Multi-wavelength observations of 3FGL J2039.65618: a candidate redback millisecond pulsar
Abstract
We present multi-wavelength observations of the unassociated -ray source 3FGL J2039.65618 detected by the Fermi Large Area Telescope. The source -ray properties suggest that it is a pulsar, most likely a millisecond pulsar, for which neither radio nor -ray pulsations have been detected yet. We observed 3FGL J2039.65618 with XMM-Newton and discovered several candidate X-ray counterparts within/close to the -ray error box. The brightest of these X-ray sources is variable with a period of 0.22450.0081 d. Its X-ray spectrum can be described by a power law with photon index , and hydrogen column density cm-2, which gives an unabsorbed 0.3–10 keV X-ray flux of erg cm-2 s-1. Observations with the Gamma-Ray Burst Optical/Near-Infrared Detector (GROND) discovered an optical counterpart to this X-ray source, with a time-averaged magnitude . The counterpart features a flux modulation with a period of 0.227480.00043 d that coincides, within the errors, with that of the X-ray source, confirming the association based on the positional coincidence. We interpret the observed X-ray/optical periodicity as the orbital period of a close binary system where one of the two members is a neutron star. The light curve profile of the companion star, with two asymmetric peaks, suggests that the optical emission comes from two regions at different temperatures on its tidally-distorted surface. Based upon its X-ray and optical properties, we consider this source as the most likely X-ray counterpart to 3FGL J2039.65618, which we propose to be a new redback system.
1 Introduction
The launch of the Fermi Gamma-ray Space Telescope in June 2008 marked a new era in -ray astronomy, thanks to the unprecedented performance of its Large Area Telescope (LAT; Atwood et al. 2009). The recently released Third Fermi-LAT -ray source catalogue (3FGL; Acero et al. 2015) derived from the first 4 years of observations contains 3033 sources. About 70% of these sources have been either directly identified, e.g. either from the detection of -ray pulsations (pulsars) or correlated -ray and optical/radio variability (Active Galactic Nuclei, Novae, X-ray binaries), or associated with objects that are either known or potential -ray emitters. The remaining 30% of the 3FGL sources have not been associated with any object yet, hence they are referred to as unassociated, and their nature is unknown.
Being pulsars the largest family of -ray sources identified in the Galaxy ( and counting111https://confluence.slac.stanford.edu/display/GLAMCOG/Public+List+of+LAT-Detected+Gamma-Ray+Pulsars), a significant fraction of the unassociated Fermi-LAT sources might be -ray pulsars. Some of them might have no or extremely faint radio emission, and escaped detection in all radio pulsar surveys so far. Indeed, many of such radio-quiet (RQ), or radio faint (RF), -ray pulsars have been discovered through blind periodicity searches in the -ray data (e.g., Abdo et al. 2009) thanks to the use of novel search techniques (e.g., Atwood et al. 2006; Pletsch et al. 2013). About 45% of the -ray pulsars discovered by the Fermi-LAT are milli-second pulsars (MSPs). Interestingly, the vast majority of these MSPs ( 80%) are in binary systems. Some of them have an He white dwarf (WD) companion star of mass , whereas others have a usually non-degenerate companion (a late main sequence star or a brown dwarf) which is ablated by irradiation from the pulsar wind. Two distinct families of binary MSPs are recognized depending on the degree of the ablation processes: the Black Widow (BW) MSPs, where the companion is a very low-mass star of almost fully ablated by the pulsar wind, and the redback (RB) MSPs, where the companion is only partially ablated and has an higher mass of – (Roberts 2013).
The use of automatic classification codes (e.g., Ackermann et al. 2012; Lee et al. 2012; Mirabal et al. 2012) based on the -ray characteristics is crucial to single out pulsar candidates among the many unassociated Fermi-LAT sources and optimise a systematic search for new -ray pulsars. Since -ray pulsars are also identified in the optical and X rays (e.g., Abdo et al. 2013), multi-wavelength follow-ups of unidentified Fermi-LAT sources are still key to confirm the proposed pulsar classifications, though. In particular, optical observations are an important aid in the search for binary MSPs, for which blind periodicity searches in rays must account for the unknown orbital parameters, requiring a massive use of super-computing power facilities (Pletsch & Clark 2014). Indeed, optical observations yielded the identification of the two Fermi-LAT sources 2FGL J2339.70531 and 2FGL J1311.73429 as binary MSPs prior to the detection of radio or -ray pulsations (Ray et al. in preparation; Pletsch et al. 2012; Ray et al. 2013) through the discovery of orbital modulations in the flux of their companion stars (Romani & Shaw 2011; Kong et al. 2012; Romani et al. 2012; Kataoka et al. 2012). In a similar way, new binary MSP candidates have been identified for the two unassociated Fermi-LAT sources 2FGL J1653.60159 (Romani et al. 2014; Kong et al. 2014) and 2FGL J0523.32530 (Strader et al. 2014).
As a part of a pilot project aimed at identifying different classes of unassociated Fermi-LAT sources, we studied 3FGL J2039.65618. This is a moderately bright -ray source (detection significance ) that was listed in both the First (Abdo et al. 2010) and Second (Nolan et al. 2012) Fermi-LAT -ray source catalogues (a.k.a. 1FGL J2039.45621 and 2FGL J2039.85620, respectively), but has remained unassociated ever since. The 3FGL J2039.65618 field was observed in X rays for the first time with the Swift/X-Ray Telescope (XRT) during snapshot observations (1 and 3.6 ks exposure times) but no candidate X-ray counterpart was detected within the 2FGL -ray source error circle (Takeuchi et al. 2013). In radio, no potential counterpart was found in the Sydney University Molonglo Sky Survey (SUMMS) source catalogue (Mauch et al. 2003) and in dedicated observations of unassociated 2FGL sources with the Australia Telescope Compact Array (Petrov et al. 2013) and the Parkes radio telescope (Camilo et al. 2015). At very high energies, 3FGL J2039.65618 is not associated with any known TeV source222http://tevcat.uchicago.edu/. Based upon its -ray characteristics, 3FGL J2039.65618 was classified as a very likely pulsar candidate by Mirabal et al. (2013). Our newly developed classification method (Salvetti et al. 2013; Salvetti et al., in preparation) confirms that 3FGL J2039.65618 is a very likely pulsar candidate and suggests that it is, most probably, an MSP, either isolated or in a binary system (see Section 2.1). However, since of the MSPs detected by the Fermi-LAT are in binary systems, one can expect that would be a binary MSP.
We investigated this scenario through a multi-wavelength observation campaign (X rays, ultraviolet, optical, infrared) of 3FGL J2039.65618 carried out using both dedicated observations and exploiting data available in public archives. The observations and data reduction are described in Section 2 and the results are presented in Section 3. Discussion and conclusion follow in Section 4 and 5, respectively.
2 Observations and Data Reduction
2.1 Target selection
Recently, we developed an advanced classification code (Salvetti et al. 2013) that can recognise different classes of -ray pulsars, e.g. young/middle-aged pulsars and MSPs. This code uses a statistical predictive method based on Artificial Neural Network (ANN) techniques to quantify the probability of a given source to be MSP-like on the basis of its -ray temporal and spectral characteristics. The method is based on an advanced hierarchical ANN architecture consisting of simple neural networks applied in sequence to discriminate pulsar-like from AGN-like objects in first place and disentangle MSPs from young/middle age pulsars in second place. Such a method correctly classifies 84% of the identified MSPs, while the false positive fraction is lower than 10% (Salvetti et al., in preparation). We then applied the optimized hierarchical neural network to all unassociated 3FGL sources, to rank them according to their MSP probability function. As a result, 3FGL J2039.65618 was classified as a MSP-like object with a probability greater than 99%. Therefore, it stands out as an obvious candidate for multi-wavelength investigations.
2.2 X-ray observations
We carried out an XMM-Newton observation of the 3FGL J2039.65618 -ray error box (Programme ID: 0720750301), which started on 2013 October 10 at 09:43:18 UT (revolution 2534) and lasted 44.6 ks. The pn detector (Struder et al. 2001) of the European Photon Imaging Camera (EPIC) instrument was operated in Extended Full Frame mode, with a time resolution of 200 ms over a Field-of-View (FoV), while the Metal Oxide Semi-conductor (MOS) detectors (Turner et al. 2001) were set in Full Frame mode (2.6 s time resolution on a 15 radius FoV). The thin optical filter was used for the pn while a medium one was used for the MOS cameras. We retrieved the Observation Data Files (ODF) from the XMM-Newton Science Archive333http://xmm.esac.esa.int/xsa/ and used the most recent release of the XMM-Newton Science Analysis Software (SAS) v14.0 to analyze them. We performed a standard data processing, using the epproc and emproc tools, and screening for high particle background time intervals (e.g., De Luca et al. 2005). Our analysis revealed no significant contamination from soft protons. After the standard data processing, the good, dead-time corrected exposure time was 41.6 ks for the pn and 43.2 ks for the two MOS detectors.
2.3 Ultraviolet, optical, infrared observations
In the optical/near-infrared (near-IR), we observed the 3FGL J2039.65618 field with the Gamma-Ray Burst Optical/Near-Infrared Detector (GROND; Greiner et al. 2008) at the MPI/ESO 2.2m telescope on La Silla (Chile). The field was repeatedly observed on August 16, 17, and 18, 2014 in the g′, r′, i′, z′ bands in the optical and in the J, H, Ks bands in the near-IR. The observations were split into sequences of 18, 18, and 17 exposures per day, each consisting of four 115 s dithered exposures in the optical and forty eight 10 s dithered exposures in the near-IR. The observations were executed in grey time with airmass between 1.12 and 1.28 and mean seeing of 1.0″. Single dithered exposures were reduced (bias subtraction, flat-fielding, distortion correction) and stacked using standard IRAF444IRAF is distributed by the National Optical Astronomy Observatories, which are operated by the Association of Universities for Research in Astronomy, Inc., under cooperative agreement with the National Science Foundation. tasks implemented in the GROND pipeline (Krühler et al. 2008; Yoldas et al. 2008). The astrometry calibration was computed on single exposures against stars selected from the USNO-B1.0 catalogue (Monet et al. 2003) in the optical bands and the 2MASS catalogue (Skrutskie et al. 2006) in the near-IR bands, yielding an accuracy of 03 with respect to the chosen reference frame. The photometric calibration in the optical was computed against a close-by field from the Sloan Digital Sky Survey (York et al. 2000) at observed in the first night under photometric conditions. From the calibrated images we extracted a grid of secondary photometric calibrators for direct on–the–frame calibration on the subsequent nights. In the near-IR, the photometric calibration was computed against 2MASS stars identified in the GROND field of view. The accuracy of the absolute photometry calibration was 0.02 magnitudes in the g′, r′, i′, z′ bands, 0.03 magnitudes in J and H, and 0.05 in the Ks band.
In addition to GROND, we used serendipitous JHKs images of the 3FGL J2039.65618 field taken on July 16 and 25 2010 with the near-IR camera (VIRCAM; Dalton et al. 2006) of the Visible and Infrared Survey Telescope for Astronomy (VISTA; Emerson et al. 2006). The data set, processed and calibrated at the Cambridge Astronomical Survey Unit (CASU555http://casu.ast.cam.ac.uk/), consists of three sequences of 16 consecutive exposures of 15 s each in the J band and of 7.5 s each in both the H and Ks bands. In the optical and near-ultraviolet (near-UV) we used U, UVW1 ( Å; Å) and UVM2 ( Å; Å) images from the XMM-Newton Optical Monitor (OM; Mason et al. 2001) obtained in parallel to our observations, with exposure times of 1900, 2700, and 3080 s, respectively. We also used archival UVW2 ( Å; Å) images from the Swift UltraViolet and Optical Telescope (UVOT; Roming et al. 2005) performed on February 21 2011 (OBSID=00041479002), consisting of five exposures for a total integration time of 3587 s. The OM and UVOT data were processed and calibrated using the SAS tool omichain and the HEASOFT software package, respectively.
3 Data analysis and results
To search for possible counterparts of 3FGL J2039.65618 in our multi-wavelength observations, we used as a reference its recent 3FGL position (Acero et al. 2015): and (J2000). Its associated 95% confidence position error ellipse has semi-major and semi-minor axis of 2′.6 and 2′.4, respectively, and a position angle of , measured East of North. We started from our XMM-Newton observations to find potential X-ray counterparts to 3FGL J2039.65618. Then, we used our multi-wavelength data base to single out those that are most likely associated with this -ray source. In particular, since we expect that 3FGL J2039.65618 is a binary MSP, we focused our analysis on X-ray sources that show variability and/or have variable optical counterparts, possibly featuring periodic flux modulations.
3.1 X-ray data analysis
3.1.1 Source detection
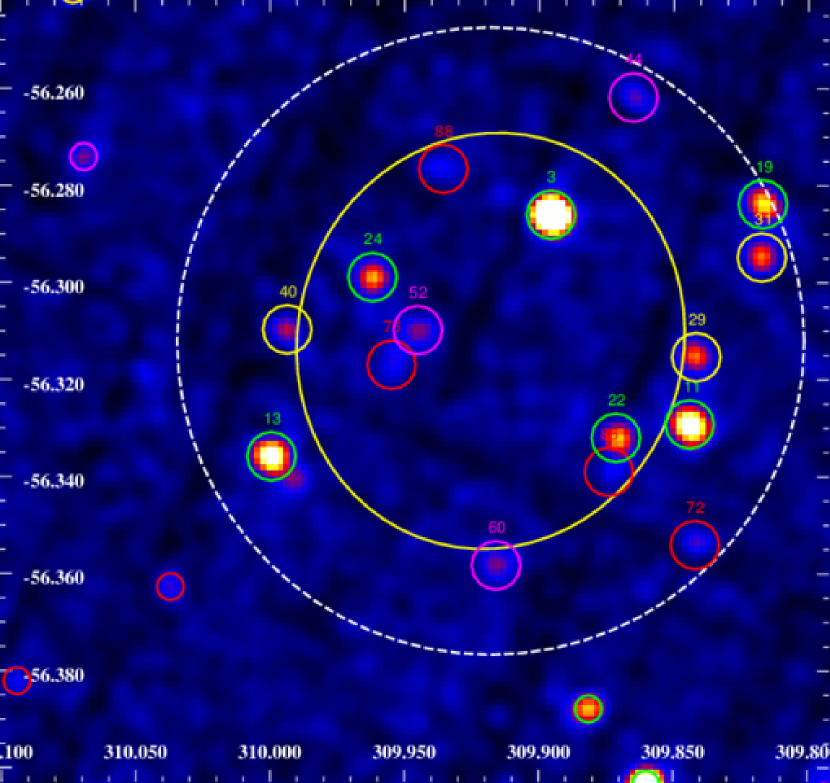
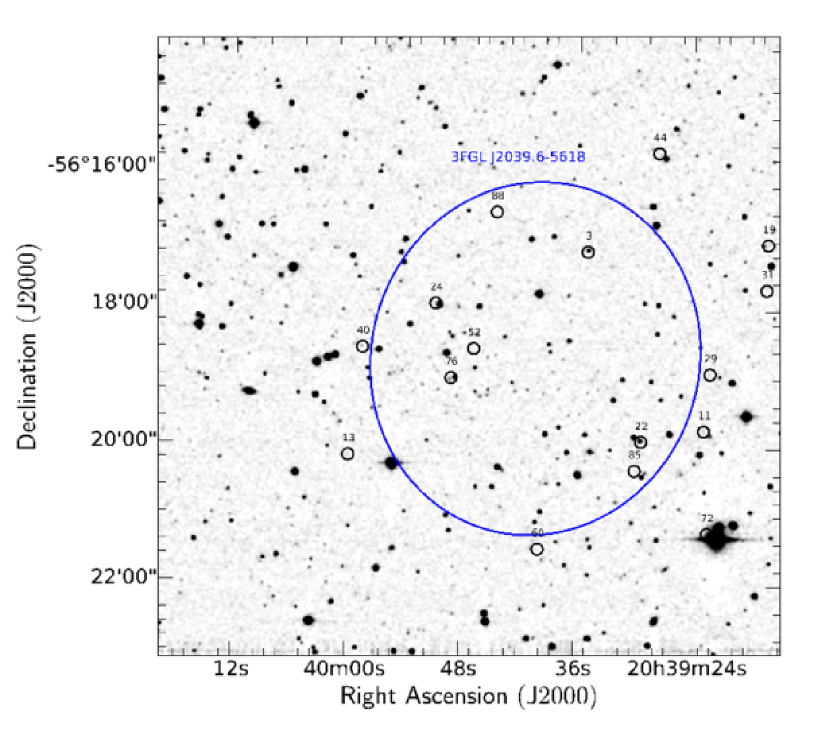
For our X-ray analysis, we selected only 04 pattern events from the pn and 012 from the two MOS detectors with the default flag mask. The source detection in the 0.3–10 keV energy range was run simultaneously on the event lists of each of the EPIC-pn and MOS detectors using a maximum likelihood fitting with the SAS task edetect_chain invoking other SAS tools to produce background, sensitivity, and vignetting-corrected exposure maps. The final source list includes 90 X-ray sources from both the pn and MOS detectors, with a combined pn+MOS detection likelihood greater than 10, corresponding to a significance above . Figure 1 shows the 0.3–10 keV exposure-corrected XMM-Newton FoV obtained combining the images of the EPIC-pn and MOS detectors. We focused our analysis on the 16 X-ray sources detected within, or close to, the 95% confidence position error ellipse of 3FGL J2039.65618. We summarized the positions, spectral parameters, fluxes, and variability indices of these sources in Table 1.
3.1.2 Spectral analysis
For each EPIC detector we extracted the source photons using an extraction radius of 20″, while we extracted background photons from source-free regions in the same CCD chip as the source, with radii of 50″–120″. For each detector, we used the SAS task specgroup to rebin all the extracted spectra and have at least 25 counts for each background-subtracted spectral channel and generated ad hoc response matrices and ancillary files using the SAS tasks rmfgen and arfgen. For each source, we fitted simultaneously the pn and MOS spectra using XSPEC v12.8, forcing the same set of parameters and considering three different spectral models: a power-law (PL), well suited for both AGN and pulsars, an apec (AP) for stellar coronae, and a black-body (BB) for the pulsar thermal component. In all cases, the hydrogen column density was left as a free parameter. For each emission model we computed the 90% confidence level error on the spectral parameters. When the best-fit values were comparable to zero, we assumed the measured uncertainties to determine the confidence level upper limit. Spectra with very low counts were fitted after fixing the to the estimated value along the line of sight ( cm-2; Dickey & Lockman 1990), or fixing either the photon index or the temperature to typical values, i.e. and keV or keV in case of an AP and a BB model, respectively.
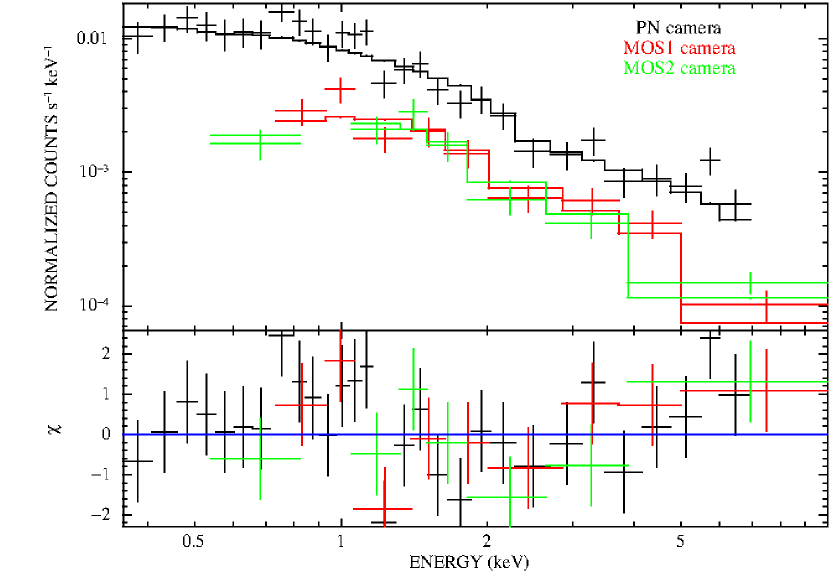
As shown in Table 1, only Source 3 and 11, the two brightest X-ray sources in our sample, were best fitted by a simple PL model, with a =52.32 (42 degrees of freedom, d.o.f.) for the former and =16.06 (22 d.o.f.) for the latter. For the remaining 13 sources, at least two different models were required to obtain an acceptable fit with null hypothesis probability 0.01. Only for Source 88 it was not possible to obtain acceptable results with any of the selected spectral models. Indeed, this source is the faintest in our sample and is likely spurious. Figure 3 shows the binned spectrum of Source 3 extracted simultaneously from each of the EPIC detectors, together with the best-fit PL model. Since most MSPs are characterized by a significant thermal component to their X-ray spectra, we tried to fit the spectra of Source 3 and Source 11 with an absorbed BB plus PL model. This improved the accuracy of the fit only for Source 3, with a =34.9 (40 d.o.f.). From the F-test (Bevington 1969), we computed a 0.0003 probability that adding a thermal component to the model would produce a chance improvement to the fit. Since this probability corresponds to a 3.6 significance only, hereafter we ignored the absorbed BB plus PL spectral model. Since for most X-ray sources the measured counts are too few to clearly discriminate among different spectral models, we checked whether we could extract qualitative spectral information from an hardness ratio (HR) analysis (Marelli et al. 2014). However, we found that the observed HRs are compatible with different spectral models and, therefore, are not constraining.
3.1.3 Variability analysis
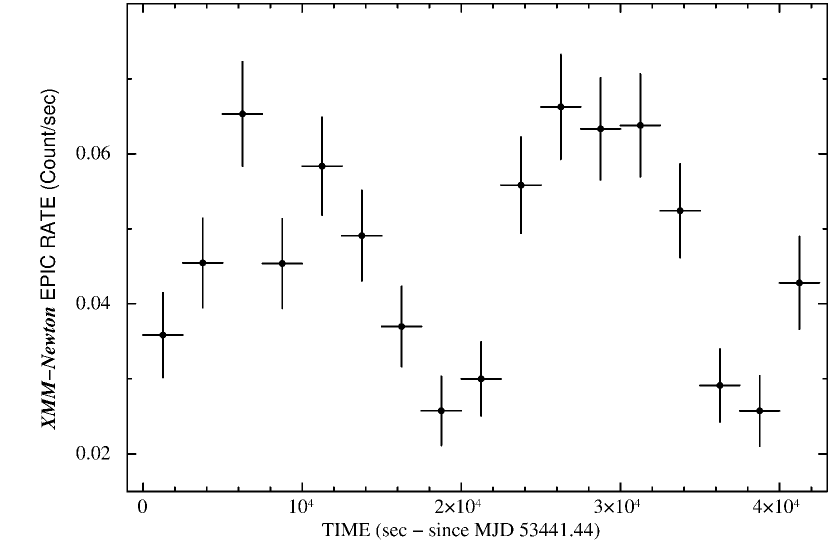
In order to detect possible time variability during the XMM-Newton observation, we generated standard light curves from the pn-data for all the 16 X-ray sources in Table 1. Starting from the source and background regions described in Section 3.1.2, we extracted source+background and background light curves, respectively, with the SAS task evselect and combined them into a background-subtracted light curve with the task epiclccorr. This task also corrects the time series for vignetting, bad pixels, chip gaps, quantum efficiency, dead time, exposure and good time intervals. For each source we generated a light curve with time binning of 2500 s, or multiple of this value, to have at least 25 counts per bin and we ran a test to evaluate the variability significance. Only Source 3 is characterized by a significant variability during the observation (, with 16 d.o.f.), with a chance probability of (). After combining the data from all the three EPIC cameras the Source 3 light curve shows a more apparent variability (Figure 2, left), with a chance probability of , whereas the other X-ray still show no evidence of significant variability.
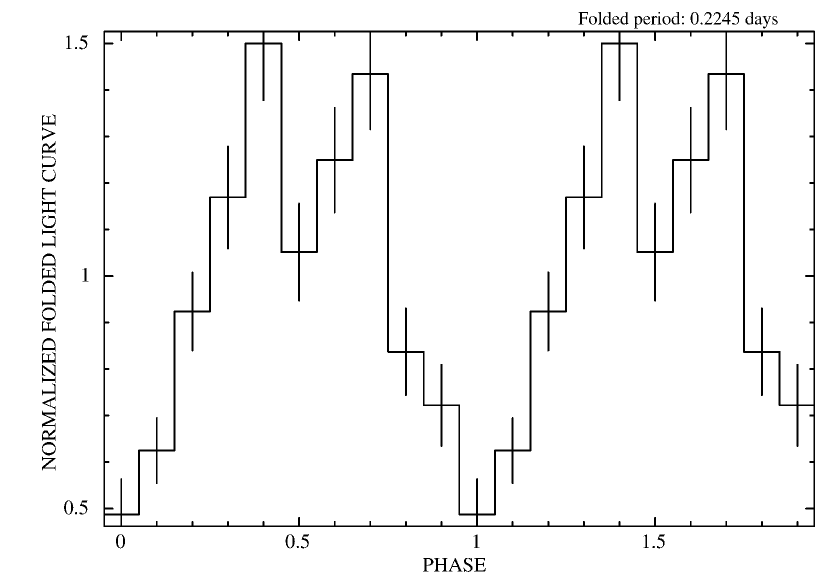
The Source 3 light curve also hints at a possibly periodic modulation. We converted photon arrival times to the Solar system Barycentric Dynamical Time (TBD) with the SAS task barycen and used the FTOOL task efsearch to find the best period in the light curve through a maximum test. We folded the light curve with periods ranging from 100 to 43000 s, the latter comparable to the length of the XMM-Newton observation. We found the best-fit period at 0.22450.0081 d, where the period uncertainty was obtained following Leahy (1987). The corresponding of 104.5 (9 d.o.f.) gives a chance probability of , accounting for the number of trials, and makes the periodicity statistically significant (). The presence of a periodic signal at the corresponding frequency of Hz was independently confirmed by the power spectrum produced with the FTOOL powspec. We note that the best-fit X-ray period of Source 3 is comparable to about half the length of the XMM-Newton observation, so that the observed periodicity might be spurious. We examined the light curves of other comparably bright X-ray sources detected in the whole XMM-Newton FoV and found that none of them showed evidence of periodicity at any time scales. Nonetheless, the fact that the length of the XMM-Newton observation only covers 2.3 cycles, prevents us to firmly claim that Source 3 is periodic. The X-ray light curve folded at the best-fit period (Figure 2, right) is characterised by two peaks separated in phase by 0.310.04. Therefore, it cannot be described by a simple sinusoidal or Gaussian model, with a null hypothesis probability lower than . We checked whether the folded X-ray light curve of Source 3 varied as a function of the energy and whether the X-ray spectrum changed as a function of the phase. In both cases, however, the available statistics is not sufficient to highlight significant differences in the energy-resolved light curves and the phase-resolved spectra.
We looked for archival X-ray images of the 3FGL J2039.65618 field to check for long-term variability of Source 3. The field was serendipitously observed with the X-ray Imaging Spectrometer (XIS) of Suzaku (Mitsuda et al. 2007) on October 28, 2010 for a total exposure time of 21.5 ks (OBSID 705028010). We extracted source counts from a circle of radius 13 around the best XMM-Newton coordinates of Source 3 and background counts from a nearby, source-free 2′-radius circle using the HEASOFT(v.6.16) tool xselect and summed the spectra from all the XIS cameras with the mathpha, addarf and addrmf tools. We obtained 350 counts, of which 50% are from the source. A fit with a PL gives a null hypothesis probability of 0.06 (4 d.o.f.), with cm-2 (90% upper limit), photon index =1.30.4 and an unabsorbed flux in the 0.3–10 keV energy range of 1.7 erg cm-2 s-1, fully compatible with the XMM-Newton results. The XMM-Newton count-rate and spectral parameters (Table 1) are also compatible with the non-detection above the 3 threshold ( 1.05 erg cm-2 s-1) of Source 3 in the short Swift/XRT images of Takeuchi et al. (2013), taken in 2010 and 2011. Therefore, we find no evidence of variability of Source 3 on time scales of three years.
3.2 IR/Optical/UV analysis
3.2.1 Source cross-identification
We cross-matched the positions of all the 16 XMM-Newton sources in Table 1 with the source catalogues obtained from the GROND observations. We performed the source detection on the single-band GROND exposures using the starfind tool in IRAF, matched the source catalogs over the different observations, and checked for variable sources against the median of all observations. Object photometry was computed using the task daophot in IRAF and the airmass correction was applied using the standard atmospheric extinction coefficients for the La Silla Observatory. For the cross-match we used a radius obtained by combining the statistical uncertainty on the X-ray source centroid plus the 90% confidence level systematic error associated with the absolute accuracy of the XMM-Newton aspect solution, which is 15 per coordinate666Calibration technical note XMM-SOC-CAL-TN-0018. The uncertainty on the absolute astrometry of the GROND images (03) is much lower than the XMM-Newton one, and is accounted for by our choice of the matching radius. There are only six XMM-Newton sources (Source 3, 13, 22, 24, 40, 76) with at least a candidate optical or near-IR counterpart in the GROND data (Figure 4).
We also cross-correlated the XMM-Newton source list with the VISTA, OM, and UVOT source catalogues. The source detection and photometry in the VISTA images were carried out as a part of the CASU pipeline (Sectn. 2.3). For the OM images, the source detection and photometry were carried out with the SAS tasks omdetect and ommag, respectively, and for the UVOT images with the HEASOFT taks uvotdetect and uvotsource. As before, the matching radius accounted for the uncertainty on the absolute astrometry of the used source catalogues, i.e. (VISTA; Emerson et al. 2004), 05 (UVOT; Breeveld et al. 2010), and 07 (OM; Page et al. 2012). The cross-correlations with these catalogues provided additional near-IR, and near-UV magnitudes for some of the GROND sources and unveiled candidate counterparts for Source 11, 19, 29, 60, 88. We found no counterparts in the OM/UVM2 filter, whereas only Source 3 was detected in the UVOT/UVW2 images. The optical, near-UV, and near-IR magnitudes of the candidate counterparts to the XMM-Newton sources are summarised in Table 2. Only for the candidate counterparts to Source 3, 40, and 76 we have an adequate spectral coverage in at least the optical and near-IR.
3.2.2 Variability analysis
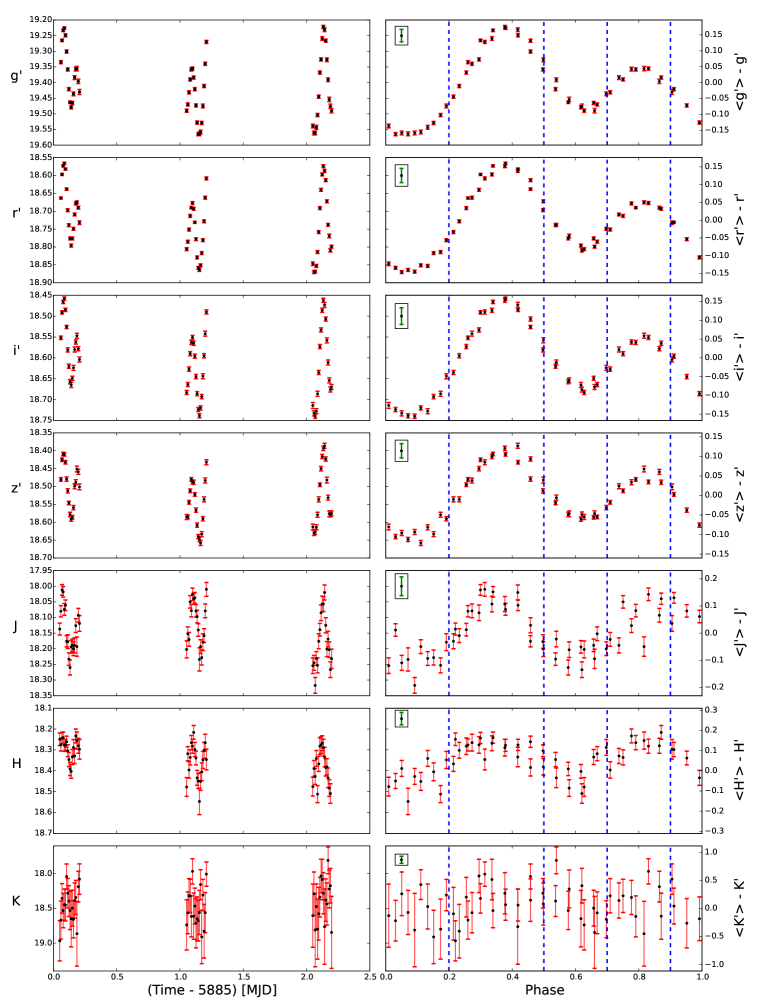
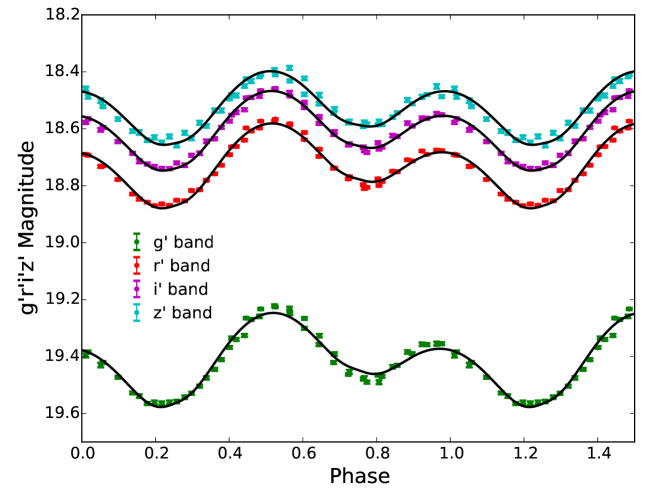
Among the six XMM-Newton sources with a possible GROND counterpart, only Source 3 is associated with a clearly variable object (, with 51 d.o.f.). Figure 5 (left) shows the multi-band light curves of this object for the three nights spanned by the GROND observations. As seen, the light curves seem modulated, with an amplitude of 0.4 magnitudes in the g′ band. In particular, the modulation seems to be periodic and feature a double-peaked profile (night 1) with the two peaks only partially seen in night 2 and 3, likely owing to the different sampling of the light curve. This modulation is also seen in the r′, i′, and z′ light curves, with both shape and amplitudes similar to the g′ one, and is also recognised in the J and H-band light curves, and very marginally in the K-band one. This suggests that the observed modulation is real and not due, for instance, to possible problems with the photometry in a given filter. As a check, for all filters we extracted the light curves of several stars of comparable brightness detected in the GROND FoV but found no evidence of such a modulation. This confirms that it is not due to random effects, such as variations in the sky conditions (transparency, background, moon illumination), or systematic effects, such as variations in the encircled flux due to the fixed size of the photometry aperture with respect to the seeing disk. Furthermore, the fact that the modulation seems to be periodic argues against the possibility that it is produced by any of such effects and implies that is associated with an intrinsic star variability.
We computed the probability that the association between Source 3 and its candidate GROND counterpart is due to a chance coincidence. We computed the probability as , where is the matching radius used for Source 3 (18) and is the density of stellar objects in the GROND field, regardless of their brightness, measured in the co-addition of all g’-band exposures. For a stellar density square degree-1 we estimated a chance coincidence probability , which makes a chance coincidence unlikely.
To confirm the existence of a periodic modulation of the Source 3 candidate counterpart, we carried out a periodicity analysis based on the Generalized Lombe-Scargle periodogram method (Lomb 1976; Scargle 1982; Zechmeister & Kuerted 2009). For cross-checking purpose, we also used the phase dispersion minimisation technique (PDM; Stellingwerf 1978) using the pdm code in IRAF and the Period04 software package (Lenz & Breger 2005), which is especially dedicated to the statistical analysis of large astronomical time series containing gaps (see Figure 5). All methods indicate the presence of a periodicity with a period of 0.227 d. The analysis of the power spectrum of the optical time series shows a clear peak at the corresponding frequency, with a probability that is due to a chance noise fluctuation (false-alarm probability) of 1.810-15 ( 8). The best period was found at 0.227480.00043 d in the optical bands and at 0.227990.00062 d in the near-IR bands, where we estimated the period uncertainty following Gilliland et al. (1987). The optical and near-IR best-fit periods of the Source 3 candidate counterpart are consistent within the uncertainties, which provides further evidence that the observed modulation is real.
The period of the optical/IR modulations seen in the GROND data for the Source 3 candidate counterpart is consistent with that seen in the XMM-Newton data for Source 3 (0.22450.0081 d; Sect. 3.1.3). Therefore, the detection of virtually the same periodicity clearly indicates that the two objects are associated. Therefore, based upon the X-ray and optical variability at the same period and the relatively low chance coincidence probability, we regard the association between Source 3 and its GROND candidate counterpart as robust. Furthermore, since we based the selection of candidate X-ray counterparts to 3FGL J2039.65618 on the search for variable sources, the optical/X-ray periodicity of Source 3 makes it a very promising candidate. Another possible candidate X-ray counterpart to 3FGL J2039.65618 would be Source 11, the second brightest X-ray source detected in the 3FGL error circle, and the only other X-ray source with an obvious non-thermal spectrum (Table 1). However, Source 11 is not variable in X rays and is not associated with a periodic optical/near-IR GROND counterpart. Therefore, although it cannot be firmly ruled out as a candidate X-ray counterpart to 3FGL J2039.65618, as of now, it is a by far a less likely candidate than Source 3. The same is true for all the other fainter X-ray sources in Table 1, whose poorly characterised X-ray spectra and sparse optical, near-UV, and near-IR flux measurements hamper a detailed multi-wavelength analysis of their properties and a non-ambiguous classification.
3.3 Characterization of the Source 3 counterpart
3.3.1 Folded light curves analysis
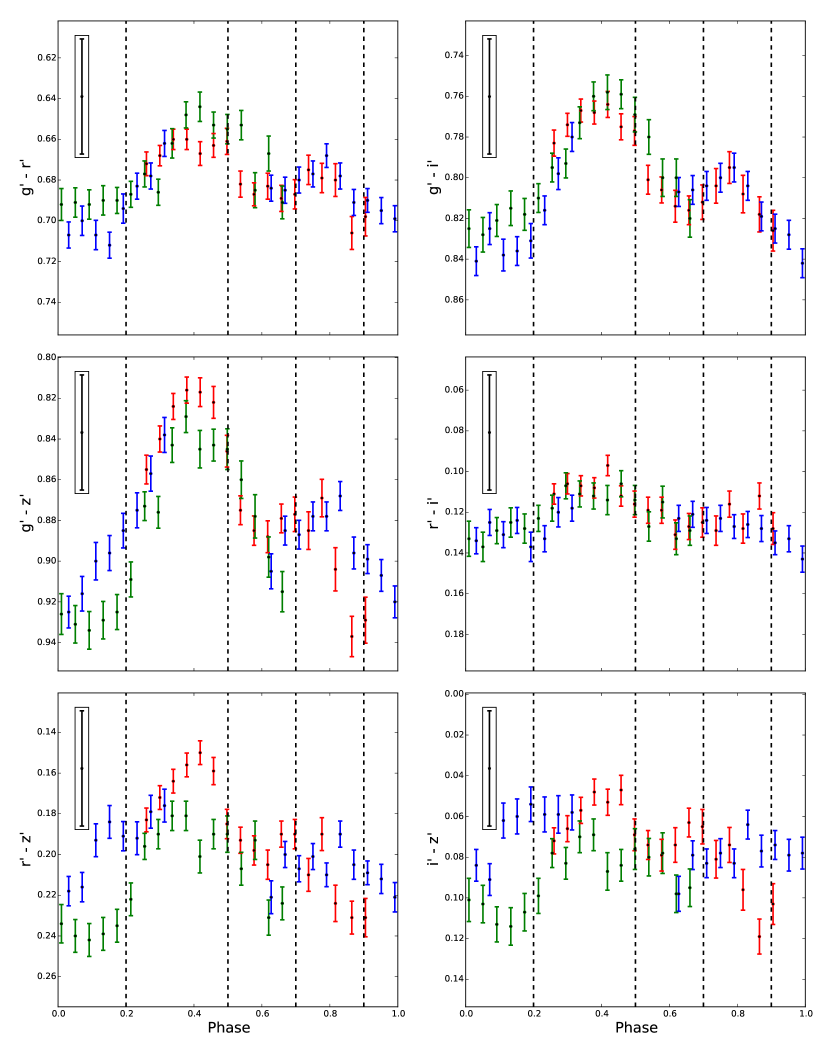
The optical/near-IR light curves of the Source 3 counterpart folded at the corresponding best-fit periods are shown in Figure 5 (right). A double-peak light curve is clearly visible, with a main peak and a secondary peak, separated in phase by . Per each band, we determined the phase of the two peaks by fitting a Gaussian function to their profiles to precisely compute their phase separations and errors. The peak phase separation remains constant in the optical (; g’), while it seems to slightly increase in the near-IR (; J). To better recognise the light curve evolution, we defined four regions: the main peak (=0.2–0.5), the secondary peak (=0.7–0.9), the “bridge” (=0.5–0.7), and the “off-peak” (=0.0–0.2 and =0.9–1.0). The shape of the light curve is similar in all bands, but the profile of the modulation changes from the optical to the near-IR (Figure 6, left). In particular, the primary peak becomes broader and its amplitude decreases, from 0.4 magnitudes in the g′ band to 0.2 magnitudes in the H band, and the difference between the primary and the secondary peaks decrease from 0.133 magnitudes in the g’ band to in the H band. Similarly, the amplitude of the ”bridge” decreases, becoming comparable to that of the ”off-peak” region. There is also a possible evidence of a colour variation as a function of phase (Figure 6, right), which might indicate that we are observing regions of the star surface at different temperatures. In particular, the colours seem to be bluer in coincidence with the two peaks, and bluer in coincidence with the primary peak than with secondary one. The colours also seem bluer in the ”bridge” than in the ”off-peak” region. The colour variation seems less marked at longer wavelengths consistently with the fact that the light curve variations are smoother. Unfortunately, the errors on the GROND photometry calibration (Sectn. 2.3) make difficult to quantify the observed colour variations.
We tried to align in phase the X-ray and optical light curves of Source 3 to check the relative alignments between the X-ray and optical peaks. However, the difference between the epochs of the XMM-Newton and GROND observations (MJD=56885–56887 and MJD=56575, respectively) corresponds to a maximum time difference of 312 d. The accuracy on the best-fit optical period derived from the GROND observations is 0.00043 d (Sectn. 3.2.2), which corresponds to a phase uncertainty of . Thus, building a phase-coherent solution for the optical light curve backward to the epoch of the XMM-Newton observation would bring an uncertainty of 0.59 on the absolute phase determination, which is larger than the phase separation between the two peaks ( in the X rays and in the optical).
3.3.2 Colour-magnitude analysis
We computed the time-average multi-band photometry of the Source 3 counterpart from the GROND data and obtained g′=19.400.02, r′=18.710.02, i′=18.590.02, z′=18.520.02, J=18.130.03, H=18.330.03, K=18.350.06, with all magnitudes in the AB system. The photometry errors account for both statistical errors and for the systematic uncertainty on the photometry calibration. We also identified the Source 3 counterpart in the U and UVW1-filter exposures from the XMM-Newton/OM with AB magnitudes U=21.260.26 and mUVW1=21.880.4 (Table 2), whereas it is not detected in the UVM2 filter down to a 3 limiting magnitude of 21.99 and in the Swift/UVOT UVW2 image down to a limiting magnitude of 23.34 (AB). In the near-IR, we also identified the Source 3 counterpart in the VISTA images, with AB magnitudes J=18.240.03, H=18.240.04, and Ks=18.640.09, converted from the native Vega survey system777http://casu.ast.cam.ac.uk/surveys-projects/vista/technical/filter-set. We found that the VISTA magnitudes (epoch 2010.6) are all compatible with the GROND ones (epoch 2014.7), after accounting for the difference between the K and Ks filters, which excludes long-term variability on year time scales from the Source 3 counterpart.
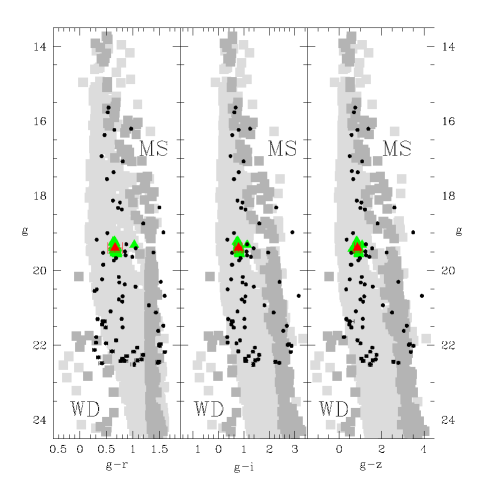
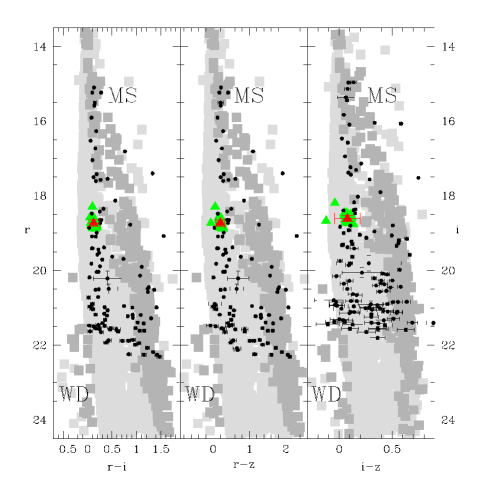
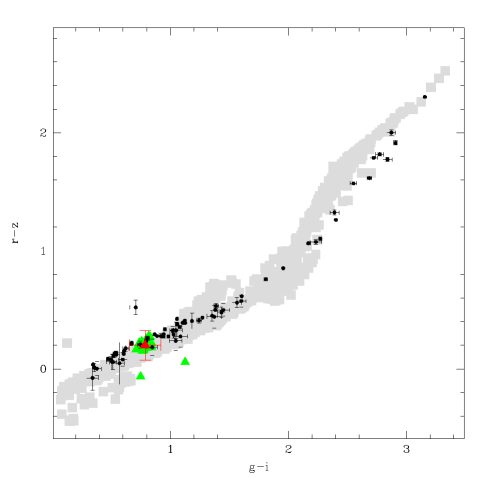
We used the time-averaged g′, r′, i′, z′-band magnitudes of the Source 3 counterpart as a reference for its classification by analysing its location in the observed (i.e. not corrected for the reddening) colour-magnitude (CM) and colour-colour (CC) diagrams of the field. The diagrams are shown in Figure 7, where the location of the field stars is shown by the black filled circles and that of the Source 3 counterpart as a red filled triangle. Red and green triangles correspond to the location computed from the single-image photometry. In order to reject outliers and include only high-confidence measurements, we plotted only field stars for which at least 20 measurements per filter were available and with . We compared the observed CM and CC diagrams with simulated stellar sequences computed from the Besançon models (Robin et al. 2004) for different stellar populations and distance values up to 15 kpc. The simulated sequences are shown in Figure 7 as the grey scale map. The dark grey regions in the CM diagrams correspond to a likely distance range ( pc) for Source 3, whereas in the CC diagram the dark grey region corresponds to simulated magnitudes that are within 0.05 the g′-band magnitude of the Source 3 counterpart.
The distance to Source 3 is unknown a priori. The upper limit on the hydrogen column density derived from the fits to the X-ray spectrum of Source 3 ( cm -2; Table 1) indicates a distance lower than kpc, assuming the relation between distance and of He, Ng & Kaspi (2013). Without a parallax measurement, the distance to Source 3 cannot be precisely constrained from kinematic measurements of its optical counterpart. The NOMAD catalogue (Zacharias et al. 2005) gives a proper motion of mas yr-1 and mas yr-1 in right ascension and declination, respectively. This corresponds to a spatial velocity of (d/1 kpc) km s-1. If we equate it to the median of the transverse velocity distribution of MSPs (108 km s-1, with a standard deviation of 86 km s-1) computed from the Australia National Telescope Facility (ATNF) Pulsar Catalogue888http://www.atnf.csiro.au/people/pulsar/psrcat (Manchester et al. 2005) we obtain a distance of 770–1500 pc, compatible with the estimate inferred from the . Any determination of a lower limit on the distance is more uncertain. Again, if Source 3 were a binary MSP, the distance distribution of known binary MSPs from the ATNF Pulsar Catalogue gives a probability of 0.006 to find one within a radius of 0.2 kpc. Thus, the assumed distance range for Source 3 ( pc) is reasonable.
We also used the upper limit on the to infer an interstellar extinction along the line of sight , after applying the relation of Predehl & Schmitt (1995). Then, we computed the extinction in the different filters using the extinction coefficients of Fitzpatrick (1999). The reddening vectors are shown in in Figure 7 for the limit case . Since the field stars are affected by an unknown interstellar extinction, and the simulations based on the Besançon models simply compute a reddening scaled proportionally to the assumed distance in a given direction, introducing a reddening correction in our simulations might bias a direct comparison between the observed and the simulated stellar sequences. Therefore, for simplicity, in all cases we simulated the stellar sequences assuming a null reddening. Then, we used the reddening vectors as a reference to trace the extinction-corrected locations of the observed points for the Source 3 counterpart (red points) along the simulated stellar sequences. As seen, the location of the Source 3 counterpart in the diagrams falls between the regions of the simulated MS and WD stellar sequences. Only for distances as low as 0.1 kpc the counterpart location in the diagrams could be compatible with a WD. However, if Source 3 is an MSP such possibility is unlikely (see above). Thus, we conclude that the star is, most likely, not a WD.
3.3.3 Spectral analysis
We built the optical/near-UV/near-IR spectrum of the Source 3 counterpart using the available multi-band photometry (Sect. 3.3.2). In all cases, we used as a reference the measured AB magnitudes to compute the spectral fluxes at the filter peak wavelengths. As a reference for the interstellar extinction correction we used a maximum extinction value of , derived from the upper limit on the hydrogen column density (Predehl & Schmitt 1995) obtained with the fit with a PL spectral model (Sect. 3.1.2).
We fitted the spectrum with both a single and a double BB spectral model. However, we found that the optical/near-UV/near-IR data cannot be simultaneously fitted by a single BB and that a double BB is required to fit the entire spectrum (, 6 d.o.f.). The inferred temperatures are K for the hotter BB, which fits the optical/UV fluxes, and K, for the colder one, which fits the near-IR part of the spectrum. The two BB model is also consistent with the upper limits obtained in the OM/UVW2 and UVOT/UVM2 filters. The overall spectral shape and spectral parameters do not change significantly when adding the correction for the maximum estimated interstellar extinction ( K, K). While the temperature of the hot BB is compatible with the surface temperature of a mid-MS companion star, the temperature of the colder one is too low to be entirely ascribed to the emission from the star surface. Although this can contribute to part of the observed near-IR emission, as indicated by the periodic modulation of the J, H and K-band light curves, an additional source external to the star is required to account for the low temperature of the BB that fits the near-IR part of the spectrum. This source might be associated with emission from cold intrabinary gas or dust, maybe the residual of an accretion disk left over by a past phase of matter accretion on the neutron star.
The analysis of the counterpart colours as a function of phase (Figure 6, right) suggests that its spectrum slightly changes along the 0.2245 d period. To quantify this possible evolution we fitted the multi-band spectrum in the four phase intervals defined in Sect. 3.3.1. Like in our phase-resolved colour analysis, we cannot use the single-epoch flux measurements in the U and UVW1 bands obtained with the XMM-Newton/OM. As done above, we fitted the four phase-resolved spectra using a two-BB model, considering both null and maximum interstellar extinction. However, we did not find evidence of a significant spectrum evolution across the different phase intervals. This is partially ascribed to the fact the spectra are less constrained at shorter wavelengths without the flux measurements in the U and UVW1 bands.
4 Discussion
The optical and X-ray emission of Source , modulated at a common periodicity of is likely associated with the orbital motion of a tight binary system. The IR/optical/UV spectrum points at a late spectral type (K or M) for at least one of the stars in the system (Secn. 3.3.3). The other object may either be another non-degenerate star or a compact object, likely an MSP. In the first scenario, the X-ray activity, the orbital period and the shape of the optical light curves indicate the system could either be of the W UMa or Lyr type (Geske et al. 2006). However, the system would be extremely peculiar even for these classes of binaries. The orbital period would be one of the shortest ever observed; the spectral type one of the latest; the asymmetry and separation of the peaks in the optical light curves hard to explain. The second scenario, sounds more plausible. Moreover, when compared to the -ray flux of 3FGL J2039.65618, erg cm-2 s-1, the 0.3–10 keV unabsorbed X-ray flux of Source 3 (F erg cm-2 s-1) would give a –to–X-ray flux ratio , which is consistent with that of MSPs (Abdo et al. 2013; Marelli et al. 2015). 3FGL J2039.65618 is also at a relatively high Galactic latitude, with and , like most MSPs. We note that the NOMAD proper motion of Source 3 in Galactic coordinates, mas yr-1 and mas yr-1, would suggest that it is moving towards the Galactic centre from its present location. This, however, would not argue against an MSP identification since several MSPs in the ATNF catalogue have a negative proper motion in Galactic latitude. Being older than a Gyr, MSPs are indeed expected to orbit in the Galactic potential and periodically move away and towards the plane. Interestingly, if ascribed to an orbital motion, the period of the observed optical flux modulation ( 0.2245 d) would be comparable to the orbital periods of BW and RB MSPs, which are usually less than one day (see, e.g. Roberts 2013). Since most binary MSPs detected as -ray pulsars by the Fermi-LAT are either BWs or RBs, the possible identification of Source 3 as a BW/RB system would, then, concur to make it the most likely X-ray counterpart to 3FGL J2039.65618.
The X-ray emission model for BW and RB is generally described by a the combination of a thermal component, which originates from the neutron star surface, and a non-thermal component, which primarily originates from an intrabinary shock and from the neutron star magnetosphere (Gentile et al. 2014). The X-ray spectrum of Source 3 is predominantly non thermal, with a photon index , and its X-ray luminosity in the 0.3–10 keV energy band is erg s-1 , where is the distance in units of kpc. Both the X-ray luminosity and photon index of Source 3 are in general agreement with those of RB/BW MSPs (Gentile et al. 2014; Roberts 2014), although its relatively hard X-ray spectrum would point more at a RB than a BW. As we noted in Sectn.3.1.2, a thermal component might be present in the X-ray spectrum of Source 3. However, further observations are necessary to clearly discriminate between a purely non-thermal and a composite spectral model.
The X-ray light curve of Source 3 can be explained assuming a binary MSP scenario, the emission from the intrabinary shock is expected to be modulated at the orbital period. Recent studies suggest that the X-ray modulation may be due to synchrotron beaming, Doppler boosting of the flow within the shock, or obscuration by the companion (Bogdanov et al. 2011; Gentile et al. 2014; Roberts 2014). The shape of the X-ray light curve strongly depends on the geometrical and physical parameters of the binary system but, on average, it is characterized by an overall increase of a factor of –3 around inferior conjunction. The light curves of many BWs and RBs show a double-peaked structure due to the obscuration of part of the shock by the companion around the superior conjunction. The inclination angle of the system, as well as the ratio of the companion radius to the intrabinary separation, characterize the phase separation and levels of the two peaks. The X-ray light curve of Source 3 clearly points at a BW/RB scenario. Its amplitude changes by a factor of during the orbit, the minima occur at orbital phases –0.1 and –0.0, which corresponds to the superior conjunction, whereas the maxima occur at phase –0.7, which corresponds to the inferior conjunction. Unfortunately, we cannot align in phase X-ray and optical light curves (Sectn 3.3.1) to confirm this scenario.
The optical emission in BWs and RBs is dominated by the non-degenerate companion and is characterized by significant luminosity and colour variations. The optical light curve profile can bring the signature of two different effects: the tidal distortion of the companion star surface, due to the gravitational pull of the MSP, and the heating of the companion star surface, due to irradiation of relativistic photons and/or high energy particles from the MSP (Breton et al. 2013). Most BWs exhibit a single-peak optical light curve (e.g., Stappers et al. 2001), due to the irradiation of the nearly fully peeled companion star from the MSP. Half of the RBs also feature a single peak, whereas the rest feature a two-peaked light curve, with the peaks occurring at specific orbital phases due to the viewing geometry of the tidally-distorted, non-degenerate, companion star. In the latter case, the companion star nearly fills its Roche lobes and tidal distortion effects dominate over the heating effects. Examples of RBs with single-peak light curves are: PSR J1023+0038 (Thorstensen & Armstrong 2005), J2215+5135 (Schroeder & Halpern 2014), J23390533 (Romani & Shaw 2011), and J12274853 (Bassa et al. 2014), while examples of RBs with double-peak light curves are: PSR J16283205 (Li et al. 2014), J17232837 (Van Staden et al. 2013), J1816+4510 (Kaplan et al. 2012), and J21290428 (Hui et al. 2015). The double-peak light curves of the RBs look very similar to that of Source 3, displaying asymmetries in the relative phase of the two peaks. In particular, the optical light curve of PSR J16283205 (Li et al. 2014) shows the same remarkable asymmetry between the two peaks, with a main and a secondary peak, as observed in the Source 3 counterpart. This similarity would, then, support the hypothesis that Source 3 is a RB.
The -ray error ellipse of 3FGL J2039.65618 has been observed four times at the CSIRO Parkes telescope searching for pulsations up to a pc cm-3 (Camilo et al. 2015). No pulsations were found, but this is not unexpected, because RBs are very elusive targets in radio. In fact, the intrabinary material ablated from the star causes strong and variable scattering and absorption of radio waves. The radio detection of the pulsations often requires several dedicated long observations (Ray et al. 2013; Ray et al., in preparation).
4.1 Modelling of the optical light curve
Standard models for the RB optical light curves based on tidal distortion and pulsar irradiation (e.g., Thorstensen & Armstrong 2005) cannot fit well neither the asymmetric peaks nor the peak separation. Therefore, we built a simple three-dimensional model including an additional component related to the asymmetric irradiation of the companion star to fit the light curve of the Source 3 counterpart. In this process, we considered only the optical light curves because are those with the highest signal–to–noise.
In order to probe the RB scenario and estimate its physical parameters we built a simple three-dimensional model of a RB binary system with very few free parameters and fit it to the observed optical light curves of Source 3. In this model, the shape of the companion star is approximated by a sphere and a tangent cone pointing to the neutron star. The cone is meant to account for the tidal deformation of the star as it approaches filling its Roche lobe. By locking the star rotation to the orbital motion we assumed two different brightnesses for night and day, a characteristic commonly found in RB systems. The asymmetry in the two peaks of the optical light curve implies some asymmetry in the physical system that produces it. Therefore, we allowed a tilt angle between the cone axis and the day/night separator line, as measured on the orbital plane. As for other RBs, we assumed a perfectly circular orbit, reducing the number of free parameters in the Kepler’s orbital parameter space. To summarize, our model accounts for four geometrical parameters: the star deformation (distance of the cone tip from the star center in star radius units); the night/day asymmetry (angle between the cone axis and the line of sight to the star); the orbital inclination (angle between the line of sight and the orbital plane); the epoch of quadrature (when the projected axis of companion star orbit lies perpendicular to the line of sight). Furthermore, for each band we have two free parameters: the light curve normalization and the brightness ratio between night and day.
We fitted our model to the data, including both statiscal and systematic errors, and found good qualitative agreement for a narrow range of parameters. The overall goodness of the fit turns out to be 197.3 (196 d.o.f.). The configuration obtained from the best fit to the model implies a deformation of 1.5190.009 for the companion star, indicating that it is subject to strong tidal effects, and a large value of the asymmetry, . The orbital inclination of the binary system obtained from the best fit is , whereas the epoch of quadrature is at MJD 56884.96670.0003. Finally, the best-fit brightness ratios between the night and day sides in the four bands are: 0.7890.007 [g’]; 0.8280.007 [r’]; 0.8510.007 [i’]; 0.8780.008 [z’].
The model assumes, as a first approximation, that the night and day sides of the star are in local thermodynamical equilibrium at different temperatures Tnight and Tday, respectively. A brightness ratio implies a relation between these two temperatures, as a function of the temperature itself. This relation weakly depends on the interstellar extinction, which can only be constrained by our upper limits on the . We computed these relations for each band, adding in quadrature the uncertainty associated with the interstellar extinction correction. The values of temperature ratios are compatible in the four bands, at 1, only for a value of the day-side temperature T K. This constraint does not rely on the normalizations, hence on the accuracy of the photometric calibration. It is a side product of our model, consistent with the spectral results obtained in Section 3.3.3. On the other hand, the model implies a simple relation between the temperature ratio and their absolute value:
| (1) |
The large value of the asymmetry, , is implied by the different levels of minima and maxima in the light curves. Similar features are observed in other RBs, like PSR J16283205 (Li et al. 2014), where asymmetry was also proposed as an explanation. In those cases, a measure of this effect was not possible, using the standard modelling tools, which motivated our alternative modelling. In our model, an asymmetry causes a phase shift between the sinusoid that represents the day/night variation and the peaks due to the bump. If the brighter temperature is induced by irradiation from the neutron star, this must be channeled through wind rather than photons. In fact, high-energy radiation travels straight lines, implying a symmetric heating, while particles may follow other trajectories. Alternatively, the apparent difference in temperature could be due to very large spots on the surface of the low-mass star. This would not be totally unexpected given the purely convective nature of this kind of stars, and the perturbation induced by the pulsar. If this were the case, a future observation may reveal a different asymmetry, indicating migration of the spots on the surface.
5 Conclusions
We carried out multi-wavelength observations of the unidentified Fermi-LAT source 3FGL J2039.65618 with XMM-Newton and GROND. We detected a likely X-ray counterpart (Source 3) within the -ray error box of 3FGL J2039.65618, which is characterised by a PL X-ray spectrum () that is indicative of strong magnetospheric emission. The upper limit on the hydrogen column density inferred from the X-ray spectral fit, cm-2, imply a distance probably lower than 1 kpc. The X-ray light curve of Source 3 features a modulation with a period of 0.22450.0081 d and two peaks, separated in phase by . Using the GROND data, we found an optical counterpart to Source 3 that features an asymmetric, double-peaked, light curve and a flux modulation with a period of 0.227480.00043 d, coincident with that measured in the X rays. If we interpret this periodicity as the orbital period of a compact binary system, Source 3 would probably be a binary MSP and, as such, a very likely counterpart to 3FGL J2039.65618. In particular, both the optical colors of its putative companion star and the optical light curve profile, with two asymmetric peaks separated in phase by , suggest that Source 3/3FGL J2039.65618 is a RB. This hypothesis is supported by the lack of apparent radio emission, which would be explained by eclipse of the radio signal as it propagates through the evaporated atmosphere of the irradiated MSP companion, as observed in many RBs.
Optical spectroscopy observations of Source 3 will be essential to obtain a more accurate classification of its companion star and measure its radial velocity curve, crucial to confirm the binary MSP scenario and determine the orbital parameters of the binary system. A precise determination of the orbital parameters is necessary to fold -ray photons and search for the MSP pulsations. A timing solution, that can be extended back in time to the launch of Fermi in 2008, will provide even tighter constraints on the orbital parameters and their evolution. This has a potentiially huge scientific payoff in terms of fundamental physics (Romani et al., 2012; Pletsch & Clark, 2015)
References
- Abdo et al. (2009) Abdo, A.A., et al., 2009, Science, 325, 840
- Abdo et al. (2010) Abdo, A.A., et al., 2010, ApJS, 188, 405
- Abdo et al. (2013) Abdo, A. A., et al. 2013, ApJS, 208, 17
- Acero et al. (2015) Acero, F., et al., 2015, ApJS, 218, 23
- Ackermann et al. (2012) Ackermann, M., et al., 2012, ApJ, 753, 83
- Atwood et al. (2006) Atwood, W. B., et al., 2006, ApJ, 652, 49
- Atwood et al. (2009) Atwood, W. B., et al., 2009, ApJ, 697, 1071
- Bassa et al. (2014) Bassa, C. G., Patruno, A., Hessels, J. W. T., et al., 2014, MNRAS, 441, 1825
- Bevington (1969) Bevington, P. R., 1969, Data Reduction and Error Analysis for the Physical Science (New York: McGraw-Hill)
- Bogdanov et al. (2011) Bogdanov, S., Archibald, A. M., Hessels, J. W. T., et al., 2011, ApJ, 742, 97
- Breeveld et al. (2010) Breeveld A. A., et al., 2010, MNRAS, 406, 1687
- Breton et al. (2013) Breton, R. P., van Kerkwijk, M. H., Roberts, M. S. E., et al., 2013, ApJ, 769, 108
- Camilo et al. (2015) Camilo, F, Kerr, M., Ray, P. S., et al., 2015, ApJ, 2015, ApJ, 810, 85
- Dalton et al. (2006) Dalton, G. B., Lewis, I. J., Bonfield, D. G., et al., 2006, SPIE, 6269, 4
- De Luca et al. (2005) De Luca, A., Caraveo, P.A., Mereghetti, S., Negroni, M., Bignami, G.F., 2005, ApJ, 623, 1051
- Dickey & Lockman (1990) Dickey, J. M., Lockman, F. J., 1990, ARA&A, 28, 215
- Drake et al. (2009) Drake, A. J., Djorgovski, S. G.; Mahabal, A., et al., 2009, ApJ, 696, 870
- Emerson et al. (2004) Emerson, J. P., Irwin, M. J., Lewis, J., et al., 2004, Optimizing Scientific Return for Astronomy through Information Technologies, eds. P. J. Quinn & A. Bridger, Proc. of the SPIE, Vol. 5493, pp. 401
- Emerson et al. (2006) Emerson, J., McPherson A., Sutherland W., 2006, The Messenger, 126, 41
- Fitzpatrick (1999) Fitzpatrick, E. L., 1999, PASP, 111, 63
- Gentile et al. (2014) Gentile, P. A., Roberts, M. S. E., McLaughlin, M. A.., et al., 2014, ApJ, 783, 69
- Gilliland et al. (1987) Gilliland, R. L., Baliunas, S. L., 1987, ApJ, 314, 766
- Geske et al. (2006) Geske, M. T., Gettel, S. J., McKay, T. A., 2006, ApJ, 131, 633
- Greiner et al. (2008) Greiner, J., et al., 2008, PASP, 120, 405
- He et al. (2013) He, C., Ng, C.-Y., Kaspi ,V. M., 2013, ApJ, 768, 64
- Hui et al. (2015) Hui, C. Y., Hu, C. P., Park, S. M., et al., 2015, ApJL, 801, 27
- Kaplan et al. (2012) Kaplan, D. L., Stovall, K., Ransom, S. M., et al., 2012, ApJ, 753, 174
- Kataoka et al. (2012) Kataoka, J., et al., 2012, ApJ, 757, 176
- Kong et al. (2012) Kong, A. K. H., et al., 2012, ApJ, 747, L3
- Kong et al. (2014) Kong, A. K. H., et al., 2014, ApJ, 794, L22
- Krühler et al. (2008) Krühler, T., et al., ApJ, 685, 376
- Leahy (1987) Leahy, D. A., 1987, A&A, 180, 275L
- Lenz & Breger (2005) Lenz P., Breger M. 2005, CoAst, 146, 53
- Li et al. (2014) Li, M., Halpern, J. P., Thorstensen, J. R., 2014, ApJ, 795, 115
- Lomb (1976) Lomb, N. R. 1976, ApSS, 39, 447
- Manchester et al. (2005) Manchester R. N., Hobbs G. B., Teoh A. & Hobbs M., 2005, AJ, 129, 1993
- Marelli et al. (2011) Marelli, M., De Luca, A., Caraveo, P. A., 2011, ApJ, 733, 82
- Marelli et al. (2014) Marelli, M., Harding, H., Pizzocaro, D., De Luca, A., Wood, K. S., Caraveo, P. A., Salvetti, D., Saz Parkinson, P. M., Acero, F., 2014, ApJ, 795, 168
- Marelli et al. (2015) Marelli, M., Mignani, R. P., De Luca, A., Saz Parkinson, P. M., Salvetti, D., Den Hartog, P. R., Wolff, M. T., 2015, ApJ, 802, 78
- Mason et al. (2001) Mason K. O., et al., 2001, A&A, 365, 36
- Mauch et al. (2003) Mauch, T., et al., 2003, MNRAS, 342, 1117
- Mirabal et al. (2012) Mirabal, N., Frías-Martinez, V., Hassan, T., Frías-Martinez, E., 2012, MNRAS, 424, 64
- Nolan et al. (2012) Nolan, P.L. et al., 2012, ApJS, 199, 31
- Orosz & van Kerkwijk (2003) Orosz, J. A., van Kerkwijk, M. H., 2003, A&A, 397, 237
- Page et al. (2012) Page M. J., et al., 2012, MNRAS, 426, 903
- Petrov et al. (2013) Petrov, L., Mahony, E. K., Edwards, P. G., Sadler, E. M., Schinzel, F. K., McConnell, D., 2013, MNRAS, 432, 1294
- Pletsch et al. (2012) Pletsch, H. J., et al., 2012, Science, 338, 1314
- Pletsch et al. (2013) Pletsch, H. J., et al., 2013, ApJ, 779, L11
- Pletsch & Clarck (2014) Pletsch, H. J., & Clark, C. J., 2014, ApJ, 795, 75
- Pletsch & Clarck (2015) Pletsch, H. J., & Clark, C. J., 2015, ApJ, 807, 718
- Poole et al. (2008) Poole T.S., et al. 2008, MNRAS, 383, 627
- Predehl, P. & Schmitt (1995) Predehl P. & Schmitt J.H.M.M. 1995, A&A, 293, 889
- Ray et al. (2013) Ray, P. S., et al., 2013, ApJ, 763, L13
- Roberts (2013) Roberts, Mallory S. E., 2013, IAU Symposium, 291, 127
- Robin et al. (2004) Robin A.C., Reylé C., Derriére S., Picaud S., 2004, A&A 416, 157
- Romani & Shaw (2011) Romani, R. W. & Shaw, M. S., 2011, ApJ, 743, L26
- Romani et al. (2012) Romani, R. W., 2012, ApJ, 754, L25
- Romani et al. (2012) Romani, R. W., et al., 2012, ApJ, 760, L36
- Romani et al. (2012) Romani, R. W., Filippenko, A. V., Silverman, J. M., 2012, ApJ, 760, 36
- Romani et al. (2014) Romani, R. W., Filippenko, A. V., Cenko, S. B., 2014, ApJ, 793, L20
- Roming et al. (2005) Roming, P. W. A., et al. 2005, Space Sci. Rev., 120, 95
- Scargle (1982) Scargle, J. D. 1982, ApJ, 302, 757
- Schroeder & Halpern (2014) Schroeder, J., Halpern, J., 2014, ApJ, 793, 78
- Stappers et al. (2001) Stappers, B. W., van Kerkwijk, M. H., Bell, J. F., Kulkarni, S. R., 2001, ApJ, 548, L183
- Stellingwerf (1978) Stellingwerf, R. F., 1978, ApJ, 224, 953
- Strader et al. (2014) Strader, J., et al., 2014, ApJ, 788, L27
- Struder et al. (2001) Struder, L., Briel, U., Dennerl, K. et al. 2001, A&A, 365, L18
- Skrutskie et al. (2006) Skrutskie M. F., et al. 2006, AJ, 131, 1163
- Takeuchi et al. (2012) Takeuchi, Y., Kataoka, J., Maeda, K., Takahashi, Y., Nakamori, T., Tahara, M., 2013, ApJS, 208, 25
- Thorstensen & Armstrong (2005) Thorstensen, J. R. & Armstrong, E., 2005, AJ, 130, 759
- Turner et al. (2001) Turner, M.J.L., Abbey, A., Arnaud, M. et al. 2001, A&A, 365, 27
- van Staden (2015) van Staden, A., 2015, MNSSA, 74, 22
- Yoldas et al. (2008) Yoldas, A. K. et al., 2008, GAMMA-RAY BURSTS 2007: Proceedings of the Santa Fe Conference. AIP Conference Proceedings, Volume 1000, pp. 227
- York et al. (2000) York D.G., et al., 2000, AJ, 120, 1579
- Zacharias et al. (2005) Zacharias, N., Monet, D. G., Levine, S. E., Urban, S. E., Gaume, R., Wycoff, G. L., 2005, Bulletin of the American Astronomical Society, Vol. 36, p.1418
- Zechmeister & Kuerted (2009) Zechmeister, M., & Kuerted, M. 2009, A&A, 496, 577
| Source ID | J2000 coord. | Counts rate | Spectral | N | Flux | Variability | |
|---|---|---|---|---|---|---|---|
| RA Dec [∘] (stat. err.aaHere we report only the statistical error, the systematic error is about 1.5″ for each X-ray source.) | cts/s | model | cm-2 | erg cm-2 s-1 | (d.o.f.) | ||
| 3 | 309.8956 -56.2861 (0.3″) | 23.780.99 | PL | 1.360.09 | 10.19 | 66.18 (16) | |
| 11 | 309.8439 -56.3292 (0.6″) | 10.760.79 | PL | 1.33 | 5.73 | 3.92 (8) | |
| 13 | 309.9995 -56.3359 (0.5″) | 4.900.57 | PL/AP | 2.07 | 2.66 | 4.0 (8) | |
| 19 | 309.8170 -56.2838 (0.9″) | 6.510.72 | PL/AP | 1.54 | 2.98 | 3.8 (8) | |
| 22 | 309.8713 -56.3320 (0.7″) | 7.841.36 | PL/AP | 1.80 | 3.37 | 11.9 (8) | |
| 24 | 309.9619 -56.2989 (0.8″) | 4.440.46 | PL/AP | 1.86 | 1.24 | 4.1 (8) | |
| 29 | 309.8415 -56.3154 (1.0″) | 5.190.71 | PL/AP/BB | 2.37 | 1.36 | 6.2 (8) | |
| 31 | 309.8172 -56.2948 (0.8″) | 4.210.54 | PL/AP/BB | 1.80 | 3.31 | 7.4 (8) | |
| 40 | 309.9936 -56.3097 (1.1″) | 3.030.50 | PL/APbbOwing to the low number of counts, we fixed the photon index () to 2 for a PL model and the temperature () to 3.5 and 0.2 for an AP and a BB model respectively. | 0.05 | 2 | 0.63 | 6.25 (6) |
| 44 | 309.8651 -56.2619 (1.5″) | 2.460.44 | PL/AP/BBbbOwing to the low number of counts, we fixed the photon index () to 2 for a PL model and the temperature () to 3.5 and 0.2 for an AP and a BB model respectively. | 0.05 | 2 | 0.11 | 5.5 (5) |
| 52 | 309.9451 -56.3099 (1.3″) | 2.000.35 | PL/BB | 1.11 | 1.67 | 2.6 (5) | |
| 60 | 309.9159 -56.3583 (1.4″) | 1.780.32 | PL/AP/BBbbOwing to the low number of counts, we fixed the photon index () to 2 for a PL model and the temperature () to 3.5 and 0.2 for an AP and a BB model respectively. | 2.33 | 0.49 | 4.4 (4) | |
| 72 | 309.8419 -56.3541 (1.6″) | 1.580.41 | PL/AP/BBbbOwing to the low number of counts, we fixed the photon index () to 2 for a PL model and the temperature () to 3.5 and 0.2 for an AP and a BB model respectively. | 0.05 | 2 | 0.74 | 0.7 (3) |
| 76 | 309.9548 -56.3170 (2.0″) | 1.100.29 | PL/AP/BBbbOwing to the low number of counts, we fixed the photon index () to 2 for a PL model and the temperature () to 3.5 and 0.2 for an AP and a BB model respectively. | 0.05 | 2 | 0.68 | 1.0 (3) |
| 85 | 309.8740 -56.3390 (1.6″) | 1.240.43 | PL/APbbOwing to the low number of counts, we fixed the photon index () to 2 for a PL model and the temperature () to 3.5 and 0.2 for an AP and a BB model respectively. | 0.05 | 2 | 0.74 | 0.64 (3) |
| 88 | 309.9357 -56.2766 (1.7″) | 1.620.43 | 8.89 (3) |
| ID | GROND | VISTA | OM | UVOT | |||||||||||
|---|---|---|---|---|---|---|---|---|---|---|---|---|---|---|---|
| g’ | r’ | i’ | z’ | J | H | K | J | H | Ks | U | UVW1 | UVM2 | UVW2 | ||
| 3 | 19.40 | 18.73 | 18.72 | 18.61 | 18.53 | 18.15 | 18.34 | 18.24 | 18.24 | 18.64 | 21.26 | 21.88 | |||
| 11 | 20.33 | 20.02 | 20.73 | ||||||||||||
| 13 | 22.61 | 20.70 | 21.27 | ||||||||||||
| 19 | 20.64 | ||||||||||||||
| 22 | 19.37 | 17.88 | |||||||||||||
| 18.02 | 17.96 | 17.84 | 17.93 | 17.97 | |||||||||||
| 24 | 24.21 | ||||||||||||||
| 29 | 20.83 | 20.39 | |||||||||||||
| 40 | 21.95 | 21.22 | 21.45 | 22.92 | 19.82 | 19.85 | 20.10 | 22.08 | |||||||
| 72 | 19.66 | ||||||||||||||
| 60 | 19.33 | ||||||||||||||
| 76 | 19.64 | 18.36 | 18.63 | 18.20 | 17.65 | 17.66 | 17.77 | 17.63 | 17.58 | 17.90 | |||||
| 21.52 | 19.36 | 18.84 | 18.64 | ||||||||||||
| 23.97 | |||||||||||||||
| 88 | 20.93 | 21.31 | |||||||||||||