The Structure of Galaxies: III. Two Structural Families of Ellipticals
Abstract
Using isophotal radius correlations for a sample of 2MASS ellipticals, we have constructed a series of template surface brightness profiles to describe the profile shapes of ellipticals as a function of luminosity. The templates are a smooth function of luminosity, yet are not adequately matched to any fitting function supporting the view that ellipticals are weakly non-homologous with respect to structure. Through comparison to the templates, it is discovered that ellipticals are divided into two families; those well matched to the templates and a second class of ellipticals with distinctly shallower profile slopes. We refer to these second type of ellipticals as D class, an old morphological designation acknowledging diffuse appearance on photographic material. D ellipticals cover the same range of luminosity, size and kinematics as normal ellipticals, but maintain a signature of recent equal mass dry mergers. We propose that normal ellipticals grow after an initial dissipation formation era by accretion of low mass companions as outlined in hierarchical formation scenarios, while D ellipticals are the result of later equal mass mergers producing shallow luminosity profiles.
1 Introduction
Since the time of Hubble, elliptical galaxies have been our purest morphology form. Having only minor irregularities to their Keplerian shaped isophotes, ellipticals distinguish themselves in their ease of classification and high repeatability in subjective morphological schemes. The brightest galaxies in the Universe are ellipticals, often located in the densest environments, making them well studied signposts to high redshift and critical test particles to scenarios of galaxy formation and evolution.
Uniformity in morphology and color for ellipticals suggests a simpler history of evolution than other galaxy types, especially in relating luminosity to stellar mass without the complications of ongoing star formation. This scenario is supported by the well defined relationships between luminosity and kinematics (the Fundamental Plane, FP, Djorgovski & Davis 1987; Burstein et al. 1997), the most precise relationship found for galaxies. While the homogeneous nature of ellipticals has been used to argue for uniform, and early, formation processes (Tantalo, Chiosi & Bressan 1998), observations of high redshift ellipticals presents a more complicated picture of stochastic mergers (Kauffmann & Charlot 1998) that should reflect into present-day structure. And, structural non-homology has been argued to be one of the primary reasons for non-linearity or a tilt to the FP (Hjorth & Madsen 1995; Graham & Colless 1997).
The regularity in structure with luminosity for present-day ellipticals was enhanced by the discovery of a number of scaling laws such as the one between color-magnitude (Visvanathan & Sandage 1977), the Kormendy relation (Kormendy 1977) and luminosity-velocity dispersion (Faber & Jackson 1976). In terms of structure, the highly uniform Keplerian shape to isophotes of ellipticals (Jedrzejewski 1987) allows for the parameterization of elliptical structure into a few simple variables. The success of resolving elliptical structure was demonstrated by the ‘Photometric Plane’, a version of the Fundamental Plane that uses only luminosity and structural information to characterize ellipticals (Graham 2002).
The study of the structure of ellipticals has become particularly salient in the last decade for theoretical frameworks (e.g., hierarchical CDM) which have been successful in explaining large-scale structure and provided an accurate prediction to galaxy structure (Driver 2010). Dividing galaxies by their structure also isolates features that reflects formation history versus components that have evolved with time. In addition, measurable structure features are a valuable commodity for modelers, and their simulations, to connect observables to physical processes in order to discovery a few physical parameters which explain the range of galaxy properties and morphology.
The best method for studying structure in ellipticals is through the analysis of their surface brightness profiles, the run of isophotal luminosity with radius. In addition to 1D luminosity profiles, various 2D structure parameters have also been defined (such as concentration, asymmetry and clumpiness, see Conselice 2003) which are extremely useful in developing quantitative morphology. However, as early-type galaxy isophotes are typically elliptical (ignoring small boxy and disky perturbations), these 2D isophotes can easily be reduced to a 1D surface brightness profile. These 1D profiles can than be further reduced to a few parameters by matching the profile to an algebraic fitting function. Typical fitting functions will have resulting parameters that represent a characteristic surface brightness, characteristic scale size and profile mean slope for each galaxy.
Many fitting functions have been proposed, and used, in past studies (see Graham 2013 for a review). The two most popular (i.e., producing the most homogeneous relationships between galaxy types) are the law (de Vaucouleurs 1948) and the Sérsic model (Sérsic 1963). The law is by far the simplest (two variables which, if correlated, leads to structural homology), but is clearly inadequate for describing an elliptical from core to halo (Schombert 1986). The Sérsic model is very useful for ellipticals with resolved cores (Graham 2002) and provides an additional shape parameter (the index) beyond the law, but also has deficiencies for elliptical halos (Schombert 2013).
To summarize the results from Schombert (2013), it was found that the Sérsic model produced good fits to the core regions of ellipticals (), but fails for the entire profile of an elliptical, i.e. from core to halo, due to the competing effects on the Sérsic index and the fact that the interior shape of an elliptical is only weakly correlated with its halo shape. In addition, it was found that there exists a wide range of Sérsic parameters that will equally describe the shape of the outer profile (i.e., becomes degenerate at large values), degrading the Sérsic model’s usefulness as a describer of the entire profile.
Empirically determined parameters, such as half-light radius and total luminosity, were found to have much less scatter than fitting function variables, begging the question on why fitting functions are applied in the first case. To this end, this paper presents a description of the structure of ellipticals using template profiles empirically derived from the 2MASS images of over 300 ellipticals. This follows the prescription from Schombert (1986) in making templates for the study of D and cD galaxies. The unexpected consequence of the template construction was the discovery that ellipticals divide into two structural different families based on their luminosity profiles at scales greater than 2 kpc (i.e., this is not the well-known core versus cusp division of ellipticals, Kormendy et al. 2009). While it is known that ellipticals divide into two types by isophote shape (boxy versus disky) and kinematics (supported by rotation and anisotropic velocity distributions), neither of these physical characteristics are related to the two families by structure.
2 Fitting Functions and Isophotal Properties
The traditional way of understanding galaxy surface brightness profiles is to use fitting functions. The most popular of these curves is the de Vaucouleurs or fit which uses two parameters (effective radius, and effective surface brightness, ) and fits a straight line to the points in space. The advantage of the law is that since only two parameters describe the entire galaxy, and these parameters are correlated by the Kormendy relation, this means that ellipticals are self-similar as a function of luminosity (i.e., they have structural homology). This type of homologous structure is predicted by various models that use violent relaxation during galaxy formation (Hjorth & Madsen 1993).
The next generation of fitting functions included the Sérsic fitting function, a modified law that adds one more parameter, a changing profile slope . This suggests a changing curvature to the profile which is not captured by a single power-law and values for the profile shape can vary greatly depending on how many and which data points are used to compute the fit. The curvature index adds another degree of freedom, allowing for less error in the fits, but does not provide any additional information as to why elliptical surface brightness profiles are shaped as they are. There are well known, and systematic, deviations, from the shape with luminosity, and thus the Sérsic function does an admirable job of fitting a profile shape in either the interiors or the outer envelopes, but not both at the same time (Schombert 2013).
Despite the difficulties with fitting functions, it is well known that galaxy structure closely follows galaxy luminosity (Schombert 1986). This is not simply a statement that galaxy size increases with galaxy luminosity (a proxy for stellar mass). It has been shown that any characteristic radius is a smooth function of a characteristic luminosity or surface brightness. For example, very early studies that used an isophotal radius (such as the Holmberg radius or the half-light radius, Strom & Strom 1978, Kormendy 1980) found fairly good uniformity over limited ranges in magnitude ( for Strom & Strom, for Kormendy). Technical difficulties in finding standard measures of luminosity and structure inhibited direct comparison between samples. Total luminosity is operational simply, the magnitude where the curve of growth flattens, but total radius is nearly impossible to define as the there is no sharp edge to a galaxy’s gravitational potential and is undefined by curves of growth.
A characteristic radius becomes the most difficult structural parameter to determine. Attempts to determine a radius that encompasses a large percentage of the total luminosities suffers from large uncertainties due to the high photometric errors at faint surface brightness levels. Using a lower percentage of the total luminosity runs the risk of missing large changes in structure outside the assigned luminosity level (i.e., half light radius). Despite these difficulties, refinement of characteristic radius versus luminosity (Schombert 1987, Graham & Guzmán 2004) finds a relationship that is well defined within the photometric errors. The empirical evidence suggests a testable hypothesis that there exists a unique set of isophotal properties that define the structure of a galaxy for a given luminosity. This implies the shape of a galaxy’s surface brightness profile is a smooth function of luminosity as well, which is what is being captured by fitting functions and their parameters.
To test this idea, various isophotal radii can be compared to search for a correlation that is greater than predicted by photometric error scatter. We have selected the 2MASS elliptical sample (428 objects) from Schombert & Smith (2012), a sample of galaxies classified as elliptical in Revised Shapley-Ames catalog (RSA) and the Uppsala Galaxy Catalog (UGC). The sample contains all galaxies greater than 5 arcmins in radius but without nearby companions or bright stars. Distances and extinction are taken from the NED database. It is important to note that all the galaxies in the sample were selected by morphology. They display no visual evidence of a disk or SO-like appearance under varying contrasts. They cover a range of axial ratio, there is no bias to only observe round ellipticals. A classical morphologist would have assigned them strictly as E0 to E6 on the Hubble/Sandage scheme.
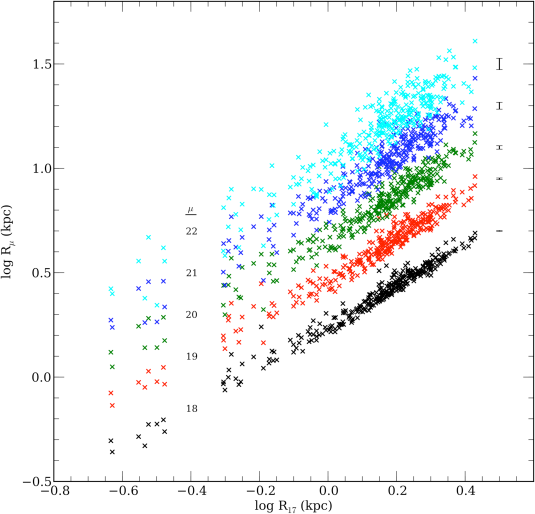
Figure 1 displays the isophotal radius at the 17 mag arcsec-2 versus the radius at 18 through 22 (the typical color of an elliptical is 4, for mental conversion to standard surface brightness values). These are generalized radii (for major and minor axis and , the generalized radius is defined as ) in order to normalize mean ellipticity. The range in total luminosity from log of 0.6 to 0.4 is 20.5 and 25.0. Only 310 ellipticals were used for these diagrams, the reasoning will be stated in the next section. The trend is, unsurprisingly, for increasing radii at all surface brightness levels. The deviation from a linear fit is within the photometric errors for a majority of the galaxies, although the relationships appear to be slightly non-linear at higher radii (see below).
Immediately apparent from Figure 1 is that ellipticals are remarkably uniform in terms of structure. Characteristic radius is strongly correlated with luminosity (although not linear, see Graham 2005). Therefore, since each isophotal radius is also strongly correlated with every other isophotal radius, then the shape of a ellipticals surface brightness profile is also unique to each luminosity. Despite the difficulties in deriving structural parameters from fitting functions (mostly a problem of profile shape), the isophotal size of ellipticals, at all isophotal levels, is a single function of luminosity.
The homogeneity of ellipticals with respect to structure is a well known fact. Although their scatter is higher than photometric error in fitting function relations (Graham 2002), the structural axis of the Fundamental Plane displays the least variation (Cappellari et al. 2013). Schombert (1986) displayed both graphically (his Figure 8) and empirically that ellipticals display a smooth change in structure as a function of luminosity. However, the change in shape and profile slope are not parameterized by fitting functions which, by their mathematical nature, smooth over irregularities profile as shape not well described by each function.
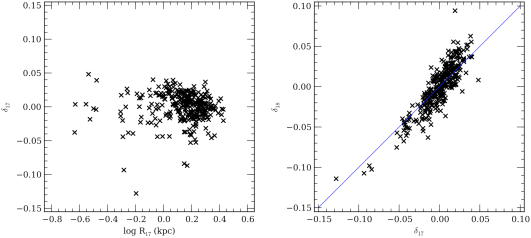
A test for non-linearity is found in the left panel in Figure 2 which displays the residuals from a straight line as a function of . There is a indication of residuals being slightly more negative at larger radii, suggesting curvature to the empirical relation between the isophotal radii. This effect is larger at fainter isophotes. The right panel in Figure 2 display this change by comparing the residuals from a linear fit between and . A clear difference from a one-to-one relationship is evident. This means that characterizing the shape of elliptical profiles will need to be more sophisticated than simple straight line fits to the isophotal radii relationships.
3 Template Construction
If the shape of an ellipticals surface brightness profile is also a function of luminosity (as suggested by Figure 1), then it should be possible to generate a series of generalized or template profiles from the isophotal relations or mean averaging the profiles themselves. We follow the prescription of Schombert (1986) where mean templates were generated from photographic surface photometry of cluster ellipticals. The motivation for that study was simply to find an empirical profile shape in order to subtract the underlying galaxy from cD envelopes to estimate their luminosities (Schombert 1988), but the basic technique is the same. The conditions found in from Schombert (1986) are identical to the photometric relationships found for the 2MASS sample, such that the isophotal radii relationships were nearly linear and their scatter was purely photometric.
The profiles from the 2MASS sample have similar depth as the original study, with similar plate scale (i.e., resolution) but using digital devices with less RMS noise around each elliptical isophote and better sky subtraction (although the sky at is a factor of three times brighter than the sky at ). To construct the templates from the profile, we have selected a statistical framework that uses the middle of the profiles first, then weighting the outer and inner data points by photometric error. While the fitting was automated, visual inspection is made of the initial templates to avoid systematics that mimic real variations in structure.
For the first pass on creating the templates, the galaxies were grouped by luminosity at the radius of 4 kpc. This radius was chosen because it is a distance outside PSF effects from the core but at sufficiently high surface brightnesses that error due to photometric and sky uncertainties are small. The galaxies for each group had generally the same luminosity and the average of their luminosity predictably grew for each successive grouping. This first stage of template construction proved to be unstable for two reasons; 1) an inner aperture magnitude was slightly sensitive to the core versus cusp behavior found in many ellipticals (Kormendy et al. 2009) and 2) a significant number of the ellipticals deviated from the average values (see below).
The second pass for template construction used isophotal radii as the normalizing metric. This proved to be more stable as an aperture magnitude is an integrated quantity, whereas a characteristic scale length is only sensitive to photometric errors at that particular radii. For the templates, each galaxy is averaged at the same radial point using linear interpolation between surface brightness levels. Once the group has been averaged, the aperture magnitude is numerically determined from the artificial profile as a crude identifier (i.e., the templates are labeled by their 16 kpc aperture magnitudes).
As is the case in a heterogeneous sample, some galaxies are a better fit to the average than other galaxies in the luminosity groups. And, more importantly, there will be some slight variation due to the range in luminosity within each group. To account for this, we weighted the galaxies by their standard deviation, , from the average and re-averaged the galaxies luminosity profiles using the inverse of ; , where is the averaged value of the surface brightness at that radius and spans all of the galaxies for the average. Once the templates were assembled, they were smoothed by a fourth order spline. This was done mostly to minimize photometric errors at larger radii where data is less reliable, but also to eliminate an artificial jagged appearance to the templates due to forced selection of radii bins. The smoothing was never greater than 0.005 mags arcsecs-2.
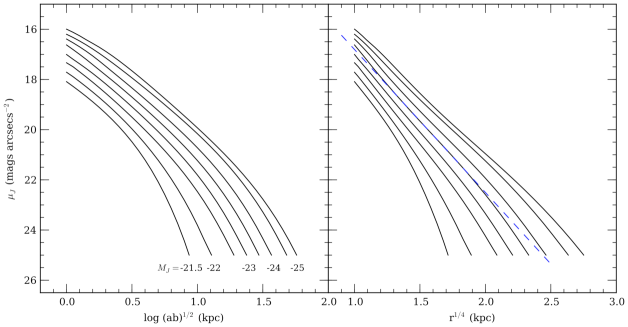
The resulting profiles are shown in Figure 3. The actual template construction is such that generalized shapes at various radii are maintained in a lookup table of twenty templates. Any particular template, as shown in Figure 3 is interpolated from the table and output with a 16 kpc magnitude as an identifier. The characteristics of the profiles are very similar to the templates constructed in (Schombert 1986) in the sense of a smooth logarithmic shape with a distinct dropoff at large radii. The dropoff at large radii is an important point, for the outer slope is such that all galaxies integrate to a finite luminosity (this is not the case for many cD galaxies). In other words, all the outer profile shapes are less than explaining why curve of growth measurements for total luminosity in ellipticals frequently converge. The inner and midsection slopes of the profiles decreases gradually with increasing luminosity and the outer dropoff becomes steeper for fainter galaxies.
The right panel of Figure 3 displays the same templates plotted in space (where the law is a straight line). The early adoption of the is understandable based on visual inspection that profiles are in shape in the mid regions for the brighter ellipticals. The shape clearly fails for the outer isophotes at all luminosities, and fails for all profiles with luminosities less than 22. The advantage of the Sérsic function is that the parameter captures this outer envelope curvature (or inner profile flatness depending on the region fitted).
The procedure for fitting a particular galaxy’s surface brightness profile to a template depends of the type and quality of the data. The algorithms that fit ellipses to 2D images tend to have more ellipses at smaller radii due to the higher S/N for those isophotes. Ellipses at larger radii tend be more widely spaced so as to decrease the photometric noise by using more pixels. Thus, template fitting was done in log radius space so that the isophotal radii are evenly spaced. Both inner and outer isophotes are weighted less, the outer isophotes by photometric error and the inner isophotes by their distance from the seeing correction region.
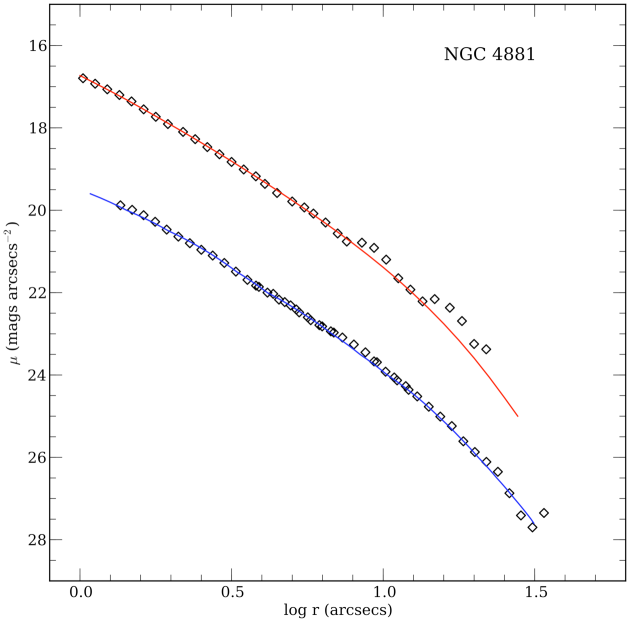
An example of a good fit is shown in Figure 4, a comparison of the and surface brightness profiles and templates for NGC 4881. NGC 4881 is located in the Coma cluster and is a common test galaxy for surface photometry due to its nearly perfectly circular shape and isolation from other galaxies and bright stars. Shown in Figure 4 is a comparison between Johnson templates from Schombert (1986) and the current set of templates for 2MASS . The original templates were based on photographic and early CCD imaging, but display the same slope and scaling relations as the newer templates (when color gradients are taken into consideration).
The NGC 4881 data displays a color gradient of , which is near the mean value for bright ellipticals (La Barbera et al. 2012). Thus, templates are slightly dependent on the filter passband used in making the surface brightness profiles and color gradients make comparison problematic, although gradients tend to be systematic with luminosity (Roig, Blanton & Yan 2015). Ideally, one would covert the surface brightness profiles at into mass density using the information from color combined with stellar population models to derive a correct with surface brightness (McGaugh & Schombert 2015).
4 Structural Homology
One of the earliest goals of studying galaxy luminosity profiles was to investigate whether the structure of ellipticals was self-similar, meaning that a more massive galaxy was, simply, a scaled up version of a less massive galaxy with a uniformly larger scalelength and more energetic internal kinematics. Early evidence on the nature of elliptical profiles, and the linearity in scaling relations derived from fits, supported this view of structural homology (Prugniel & Simien 1997). However, more detailed studies of velocity dispersion, luminosity and scalelength (the core components of the Fundamental Plane) revealed non-homology (Prugniel & Simien 1996). Non-homology was suspected to be mostly due to deviations from stellar population effects, but could also have their origin in deviations from the law.
Finding uniformity in structure is also a goal for investigating the origin of structure by formation processes. For example, early numerical simulations of dissipationless collapse demonstrated that self-gravitating systems can interact and relax to reach a universal structure despite varying initial conditions (van Albada 1982; Miller 1988; Barnes 1989) leading to the hope that a statistical mechanical theory of galaxy formation could be obtained (see Hjorth & Madsen 1991). Additional modifications to the models, using a finite escape energy, found that deviations from the shape would follow naturally from a pure dissipationless scenario. The various configurations would result in a galaxy with an anisotropic velocity distribution in a triaxial shape, similar to what is observed for bright ellipticals but with insufficient flattening to describe faint ellipticals.
Complications arose from a pure violent relaxation interpretation. For example, high central densities for low luminosity ellipticals are difficult to reproduce by dissipationless processes and suggest some dissipative component to galaxy formation is required. The existence of stellar population gradients (particular in metallicity) are also difficult to reproduce without dissipation. However, more sophisticated models were able to produce profiles that mimic real galaxy distributions with characteristic deviations at various radii. In particular, they predicted the dropoff in surface brightness below the law at large radii and lower central densities than predicated by the law (see Figure 3 in Hjorth & Madsen 1991 and Figure 2 in Hjorth & Madsen 1995).
The templates from the last section do demonstrate that ellipticals are homologous with respect to structure in a limited sense (so-called weak homology). A majority of ellipticals do have structure that varies uniformly with luminosity (i.e., a particular surface brightness profile is identified at every stellar mass). However, the template profiles do not vary in a linear fashion with respect to scalelength nor characteristic surface brightness (i.e., luminosity density). And each profile is not self-similar to any fainter or brighter profile, thus the difficulty that fitting have in functions reproducing elliptical structure as a function of luminosity (Schombert 2013). A shape parameter (equivalent to the Sérsic variable) must be added to describe the templates. This introduction of a parameter that is not self-similar destroys absolute homology, although the deviations are small. Thus, homology is a close approximation to the range of elliptical structure (and not a major contributor to the tilt in the Fundamental Plane Prugniel & Simien 1997), but ellipticals as a class have structural features that vary with galaxy mass and are, by definition, non-homologous (Graham & Colless 1997).
Templates, while more accurately describing structure and change in structure, complicate the interpretation of structure as presented by fitting functions and comparison to theoretical predictions. For example, it is relatively easy to fit density results from N-body simulations and compare the scale lengths with fitting function results (Burkert 1993). However, it would be much more complicated to convert those mass density profiles to luminosity density (with the stellar population uncertainties) and compare that to our templates. The templates recover all the known surface brightness relations (such as effective radius, , versus effective surface brightness, ). Table 1 displays the best fits to the five templates found in Figure 3 to the and the Sérsic fitting functions. The Table is divided into three parts outlining the fits under the conditions of described in Schombert (2013) for inner fits (inside the empirical half-light radius, ), outer fits (outside 80% of ) and fits for the full profile. Although Table 1 followed the technique outlined in Schombert (2013) for profile fitting, these fits do not capture the diverse range in fitting parameters. For example, the Sérsic parameter is typically lower for the templates than the mean value for from actual data (see Figure 5 in Schombert 2013). This is due to the fact that the template profiles have no photometric error assigned to their values (although, in theory, one could assign an uncertainty value based on the dispersion in the isophotal relations). Thus, the fitting routines give equal weight over the range in surface brightness of the template. This results in more curvature at fainter surface brightness levels then actual data with larger photometric errors at larger radius and Table 1 is presented for reference solely to the shape of the templates.
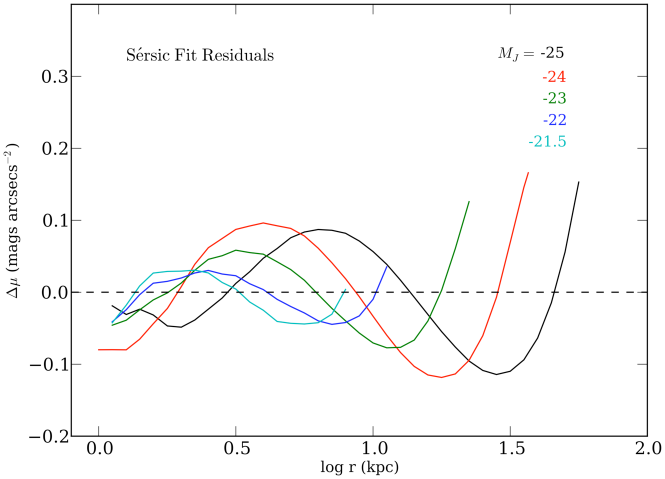
The residuals to the full Sérsic function fits are shown in Figure 5. The limitations to the Sérsic function are outlined in Schombert (2013), although it is the best ”French curve” fitting function available. The resulting fit parameters to the templates reproduce all the known scaling relations from the Sérsic function, including the Photometric Plane (Graham 2002). However, Figure 5 displays systematic residuals that are consistent from each luminosity bin. Thus, while an adequate describer of a typical elliptical profile, the surface brightness profiles of ellipticals are ultimately neither nor Sérsic in shape. In particular, the upturn in residuals at large radii will result in statistically higher indices in observed profiles with real photometric errors.
We also note that the residuals in Figure 5 can be reproduced by statistical mechanical violent relaxation models (Hjorth & Madsen 1995). Their Figure 2 displays many of the same features as in Figure 5, such as an extended envelope for bright ellipticals (for galaxies with deep central potentials), a depressed envelope for faint ellipticals (with shallow central potentials) and fainter core region for all luminosities. The difficulty in interpretation is that the central potential parameter that defines the models has a large range of values unconfined by observations. While it is encouraging that similar profile shapes can be produced by simple dissipationless scenarios, this is inadequate as a full galaxy formation theory.
The residuals do indicate some subsistence to the technique used by Huang et al. (2013) where three components are fit to an elliptical profile; a core ( kpc), an intermediate region ( kpc) and an outer envelope ( kpc). From Figure 3, we can see that the profiles divide into the same three regions, a core (not well sampled in the 2MASS images), a middle region and an outer envelope that either extends above the shape (at high luminosities) or below (at faint luminosities). However, without a physical basis for this division in structure, the multi-component technique is simply an elaborate spline curve to the data and it is not surprising that a three component model is a better match to elliptical structure as displayed by the templates in Figure 3. Whether it contains any underlying structural information is unknown.
5 Two Families of Ellipticals
5.1 Normal versus D Ellipticals
During the initial template construction, using 468 elliptical profiles, the averaged profiles failed to converge (numerically) to smooth templates with scatter less than the photometric errors. Inspection of the residuals between the actual galaxy profiles and averaged templates revealed that the problem was due to a specific subset of the profiles with consistently different shapes per luminosity bin than most other elliptical profiles. In particular, a plot of template residuals versus radius displayed a ‘cross’ pattern where 2/3rd’s of the galaxies formed one leg with a negative slope and 1/3rd formed the second leg of positive slope.
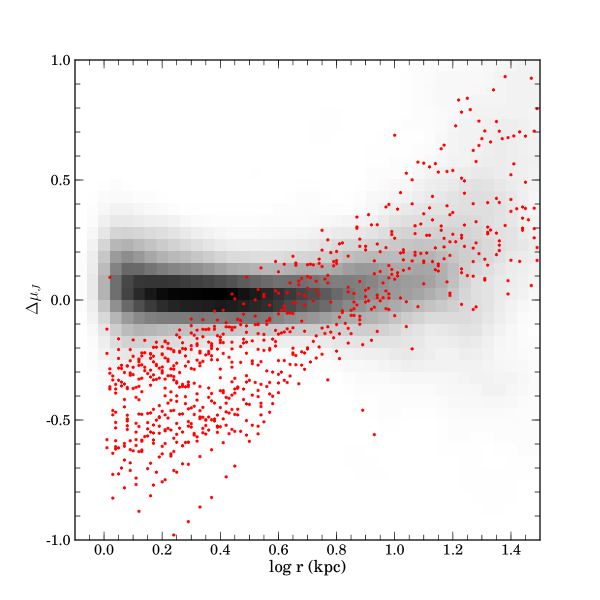
Fitting only the first type resulted in a convergence on a set of templates that was well matched to 2/3rd’s of the sample. Figure 6 displays the residuals from this second fit, where the greyscale are the difference between the surface brightness profiles and the final templates () displayed as a Hess density plot. The difference between the templates and first type of data were less than 0.15 mag arcsecs-2 for 90% of the subset. Many of the second set of galaxies (45 of them shown as red symbols in Figure 6) clearly deviate in a systematic fashion from the templates. Through an iterative procedure, we eliminated a majority of the second type of profiles from the sample and calculated templates using only profiles from the first type. These final templates are the ones shown in Figure 3.
Ultimately, 157 (33%) profiles were identified to deviate in a specific fashion from the templates (and were rejected from template construction). Some profiles were simply irregular and may be the result of recent interactions which has disturbed the luminosity distribution (40 of the 157). However, a majority of the deviant profiles (117 profiles) are more extended than our first type (larger radii per surface brightness) but varied with luminosity in the same fashion as the normal ellipticals (larger and brighter in surface brightness with increasing luminosity). Some appeared to have two shaped components, although at much larger radii than expected for a bulge+disk S0 classification (Andreon & Davoust 1997). Thus, it is clear from our template analysis that there exist two distinct families of ellipticals as classed by surface brightness profiles.
We emphasize that the two families, as outlined by structure, are not the same as the core versus cusp structure differences (see Kormendy et al. 2009). The differences in structure between the two families is strictly limited to structure well outside the core regions ( kpc). In fact, there appears to be no correlation between core and cusp shaped interiors and the two families exteriors. We also note that this division into two families is also unrelated to the proposal by Kormendy & Bender (1996) that ellipticals are divided into boxy and disky isophote families (see §5.3). The surface profile shape is unrelated to isophote shape.
This discovery would be completely missed by studies using fitting functions or even multi-component fitting functions (e.g., Huang et al. 2013). For, with a sufficient number of variables, any shape can be fit and the resulting scaling relations blur the distinction between the two families. In fact, the galaxies with the most prominent third component from profile fitting by Huang et al. mostly fall in our second class of ellipticals. The primary distinction between the two types of profiles is their outer slope. A slope that is easily mistaken as a larger Sérsic parameter or a slightly larger in fits. The two types of profiles do not separate in any scalelength or surface brightness relationship and are only discovered by comparison to templates.
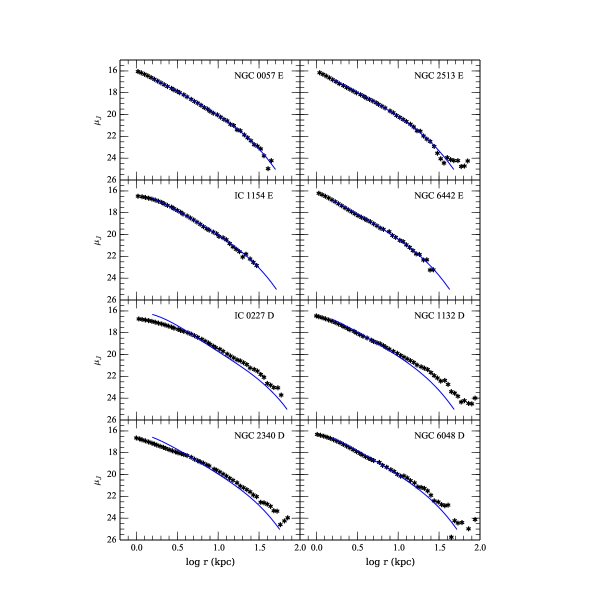
Examples of the two types of profiles are shown in Figure 7. This second type of elliptical is identical in morphology, isophotal characteristics and profile shape to the first type, but has a shallower slope than other ellipticals of the same luminosity. There are many examples of poor template fits based on an irregular profile shape, but we have reserved the designation of the second family to those profiles which are under luminous in the interiors and brighter in surface brightness in the outer envelope (i.e. shallow). Over luminous profiles produce a ‘diffuse’ appearance on photographic plates (in the language of surface brightness photometerists). There already exists a morphological class for diffuse ellipticals, the D class (Matthew, Morgan & Schmidt 1964), so we have designated this second type of elliptical as D galaxies. Although Morgan & Lesh (1965) refined the D class to apply only to the brightest member of a rich cluster of galaxies (BCM), a study of cluster ellipticals found several examples of D class ellipticals that were not the 1st, 2nd nor 3rd ranked in a cluster (Schombert 1986). For the rest of this paper, we will designate all galaxies that fit the templates as normal ellipticals, and those which deviate from the templates with shallower profiles as D ellipticals. Both normal ellipticals and D ellipticals have complete rotational symmetry, as defined by the original Hubble elliptical classification criteria. Both normal ellipticals and D ellipticals have smooth surface brightness profiles that decrease uniformly with radius.
Before assigning a new category to the family of ellipticals, we considered the possibility that the second family with shallower profiles were misclassified S0’s. A large bulge and shallow disk might mimic the second type of profile. However, there is no direct connection between the D ellipticals and S0’s, for S0 galaxies have mean ellipticities that are much flatter than the mean for D ellipticals (see §5.3), in our study, cover a range in ellipticity (see §5.3). The S01 class is the closest in appearance, which only distinguish from ellipticals by the flatter intensity gradient. But S01’s are signaled by a distinct break in the gradient of their surface brightness profiles that displays a shallower disk region, not a strictly shallower profile seen for D ellipticals. While some D ellipticals appear to have a two component profile shape (e.g., NGC 6048 in Figure 7), they do not have the characteristic bulge+disk profiles that define the S0 class (i.e., the inner component is much larger than a typical bulge).
The D ellipticals are systematically larger than normal ellipticals at any particular isophotal level and we were unable to construct reliable templates of D elliptical profiles. It appears that they are not as consistent in structure as a function of luminosity as normal ellipticals (which would not be the case if they were misclassified S0’s); however, the number of profiles was less than a quarter of the profiles available to the construction of elliptical templates and may simply represent small number statistics. In the next sections we will explore the properties of D ellipticals compared to the normal ellipticals in our 2MASS sample.
5.2 Luminosity and Local Density
Figure 8 displays the luminosity and local density differences between normal ellipticals and D ellipticals. The total magnitudes are determined by asymptotic fits to the curves of growth in the original 2MASS images (see Schombert & Smith 2012). All the galaxies in the sample converged to well determined total fluxes, ranging from 20 to 26 mags. The average total absolute mags for the sample of normal and D ellipticals is identical but, as can been seen from upper left inset in Figure 8, their distribution of luminosities differs significantly. There are slightly more D ellipticals at brighter luminosities, although the D ellipticals cover the same range of luminosities as the ellipticals in the sample (i.e., there is no deficiency of D ellipticals at any luminosity).
Typically ellipticals divide into two classes by luminosity in plots of total luminosity versus scalelength (either effective radius, half-light radius or isophotal radius). The brighter ellipticals have a slightly different relationship between luminosity and scalelength (, see Figure 8 Schombert 1987) with a break at . The fainter ellipticals display a steeper slope with luminosity (). This has been assumed, in the past, to reflect a shift in the underlying kinematics for bright ellipticals, which typically have little rotation, while fainter ellipticals are more often found to be rotationally supported. Although the kinematics for ellipticals does not divide perfectly by luminosity (Emsellem et al. 2011), the trend still exists.
The fact that some percentage of D ellipticals are part of the brightest ellipticals suggests that a subset of D ellipticals are related to the cD class ellipticals typical of brightest cluster members (BCM, Schombert 1986). The cD class BCM’s also have shallower profiles and the highest luminosities, presumingly from a long history of dynamical evolution where they have cannibalised lower mass companions, increasing their luminosities and extending their envelopes due to higher velocity dispersions from the energy of mergers (Duncan, Farouki & Shapiro 1983; Schombert 1988; Oegerle & Hill 2001). It is expected that an increase in the kinetic energy of the outer stars will result in a shallow profile from simple kinematic arguments. However, only a 1/3 of the D ellipticals in our sample are in the highest luminosity category, the remaining 2/3’s cover a full range in terms of luminosity and are not in the same luminosity bin as BCM’s (i.e., the subset of ellipticals with the highest expected merger rates).
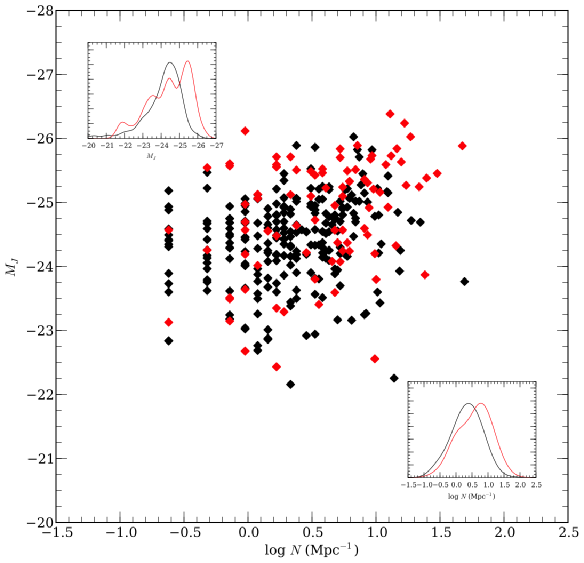
Confirmation that at least some of the brightest D ellipticals are related to cD class ellipticals comes from their local density. A comparison of luminosity and local density, (the number of galaxies within 1 Mpc), is found in Figure 8 along with an inset histogram of log . The poor correlation between luminosity and local density is a well known mass segregation effect and reflects the growth in luminosity of BCM’s by dynamical evolution in a fashion that does not directly reflect the local density (such as local velocity dispersion). And, again as with luminosity, a subset of D ellipticals also tend to be found in densest environments. The D ellipticals in the densest regions also tend to be the brightest, reinforcing their weak relationship with cD galaxies. However, over 2/3’s of the D ellipticals are not in the highest density regions and are located in regions similar to a majority of the normal ellipticals. The deviations in profile shape for these D ellipticals may be related to internal kinematics (altered by external processes), but a mechanism will be required to produce D ellipticals but leaving a majority of ellipticals unaffected.
5.3 Structural and Isophote Properties
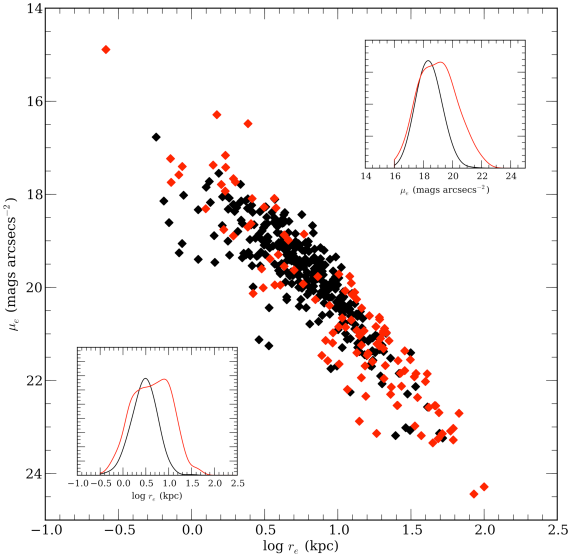
Figure 9 displays the structural comparison between normal and D ellipticals using the effective radii and surface brightness from Sérsic fits. The D ellipticals, on average, have larger and fainter , as is expected from their shallower slopes. However, as is a well known problem with fitting functions, the different profile slopes do not reflect into noticeable changes in the versus correlations. The relationship in Figure 9 does not distinguish normal ellipticals from D ellipticals other than the largest galaxies tend to be D ellipticals (in agreement with their higher mean luminosities).
The D ellipticals display the extended scalelength and shallower profile slopes in a similar manner as found for cD ellipticals. However, cD ellipticals deviate significantly from normal ellipticals in the versus diagrams (i.e., they are much shallower), presumingly a signature of past mergers that should be common in the dynamical history of central cluster galaxies. D ellipticals in our sample appear to be simply an extension to the normal ellipticals versus relationship. While it is tempting to attribute some fraction of D ellipticals as the result of strong dynamical growth in cluster cores, the remain fraction have very similar scaling relations as normal ellipticals (given the limitations of information extracted from fitting functions).
The D ellipticals, structurally, distinguish themselves primarily by profile slope. The mean profile slope (measured between 17 and 23 mags arcsecs-2) for normal ellipticals is 2.1 (where luminosity density, , goes as ). The D ellipticals have a mean slope of 1.8. Profile slope is a mild function of luminosity (as can be seen in Figure 3, the mean slope for normals ellipticals ranges from 1.9 at 26 mags to 2.4 at 21. Over the same luminosity range, D ellipticals are consistently 0.2 more shallow in slope at every luminosity bin. This consistent difference is the reason that D ellipticals are difficult to distinguish from normal ellipticals in Figure 9, for a shallow slope translates into a fainter surface brightness for a larger effective radius, in nearly the same direction as the relationship for normal ellipticals. Only a dramatic change in size, as seen for cluster BCM’s, are detectable in the versus diagram (see Figure 4 in Schombert 1987).
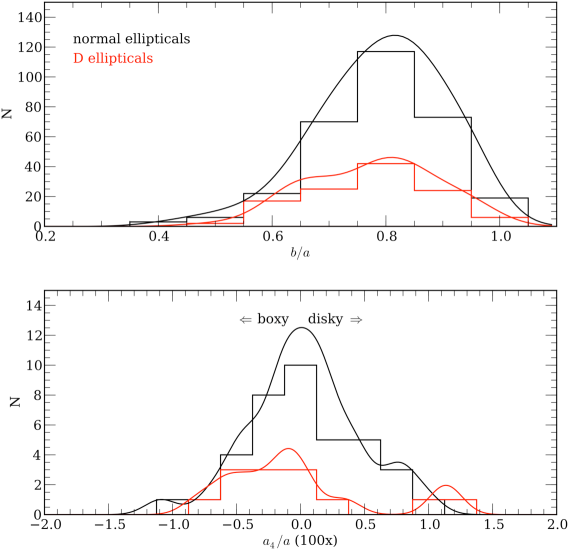
Other correlations with structural characteristics were examined. The top panel in Figure 10 displays the distribution of axial ratios () for normal and D ellipticals. The axial ratio is determined at the half-light radius (), the empirical point where half the total luminosity is reached. The distributions are identical, there is no indication that D ellipticals are, on average, flatter than normal ellipticals. There is a slight increase in at 0.6 for D ellipticals suggesting that some fraction of D ellipticals may be misclassified S0’s, but this is less than 10% of the sample. Identical results are found for value determined at 1/2 and 2. Since S0’s have mean ’s of 0.3 (Michard 1994), which is much flatter than the D ellipticals in our sample, it is clear that the frequency diagram of axial ratios for D ellipticals is more similar to normal ellipticals than S0’s.
Kormendy & Bender (1996) proposed that ellipticals be divided into two sequences based on the shape of their isophotes (boxy versus disky). Disky isophotes are isophotes that are extended at the major axis and minor axis compared to an ellipse of the same axial ratio. They are, of course, common signatures in galaxies with embedded oblate disks in a prolate or triaxial envelope (Scorza & Bender 1995). Boxy isophotes are flattened at the major and minor axis, taking on a box-like shape compared to a best fit ellipse. Disky galaxies dominate the low luminosity end of the elliptical sequence which are often oblate in shape and whose kinematics are dominated by rotation. Boxy isophotes are a common feature in non-rotating ellipticals with triaxial shapes dominated by anisotropic velocity distributions. Boxy ellipticals are predominately higher in luminosity (Pasquali et al. 2007). We investigated the occurrence of boxy and disky shaped isophotes for both types. For example, disky isophotes may signal a flatter 3D shape for D ellipticals.
Our ellipticals were divided roughly into two types based on isophotal shape. Unfortunately, the data reduction pipeline for 2MASS dithers the sky strip scans and blurs the inner isophotes where boxy and disky shapes are usually detected (Schombert 2011). In the end, we compared SDSS frames with the results from Bender et al. (1988), the original study on isophote shapes. We confirmed the fourth cosine coefficient () values for the Bender et al. sample from the isophotes of the SDSS frames and found them all to be consistent with the original Bender et al. values.
The resulting values (taken from Bender et al. 1988) are found in the bottom panel of Figure 10. Again, the normal and D ellipticals have identical distributions with the majority having isophotes are that purely elliptical in shape. Very few strongly boxy or strongly disk-like galaxies are found in either type. D ellipticals have a small number of galaxies with strongly disky isophotes (); however, this small percentage has little statistical significance.
In addition to isophotal shape, we also examined the change in the position angle of the isophotal ellipse fits as a function of radius, known as isophotal twists (Benacchio & Galletta 1980). Isophotal twists are used to probe the three dimensional shape of ellipticals through statistical arguments. The triaxial shape for bright ellipticals, and oblate shape for faint ellipticals (deduced from kinematic arguments, see below) are supported by isophotal twist analysis. And, while it is true that isophotal twists are more common in round galaxies (Galletta 1980; Nieto et al. 1992), and rare in flattened systems, part of this effect is due to the difficulty in assigning a position angle to a very round isophote.
Much like the results for isophotal shape, the distribution isophotal twists was the same for the elliptical and D elliptical samples. There was no indication that D ellipticals had fewer position angle changes, signaling an oblate shape, versus normal ellipticals. The nature of the different profile shape for D ellipticals compared to ellipticals is not revealed by any characteristic related to the 3D mass density shape. In addition, visual examination of the profile subtracted images found no evidence for peculiar features, such as tidal tails or shells, compared to the normal ellipticals sample.
5.4 Kinematics
Of most interest is whether there is a kinematic signature to distinguish the normal ellipticals from D ellipticals. The expectation for a difference is low since D ellipticals cover the same range in galaxy mass (i.e., luminosity) as the normal ellipticals and, therefore, are presumed to follow the same trends in kinematics. Also, the extended profile shapes of the D ellipticals occurs at radii much larger than sampled by kinematic studies. Thus, there is no reason to believe that internal kinematics will be correlated with kinematics in the envelopes responsible for outer structure.
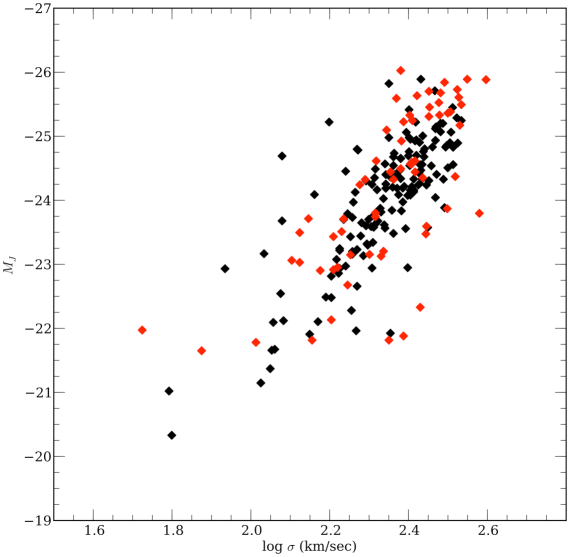
Unfortunately, although the photometric sample is large, the kinematic information for these same early-type galaxies is limited. As a first comparison, we have plotted in Figure 11 the velocity dispersions from the SDSS database (Bernardi et al. 2003) versus their total luminosities. There were velocity measurements for 50% of the sample, evenly divided between normal and D ellipticals. As can be seen in Figure 11, there is little difference in the relationship between velocity dispersion and luminosity (i.e., stellar mass) for normal and D ellipticals. The normal ellipticals are slightly more correlated than the D ellipticals. The D ellipticals have a slightly higher dispersion and are more concentrated at higher luminosities (but slightly lower velocity dispersion). Although this is not surprising as the velocity dispersion versus luminosity relation even for S0’s is identical to ellipticals and lacks a discriminator capable with respect to morphology (Dressler & Sandage 1983).
Any important kinematic signature would probably be related to rotation, not velocity dispersion. For dissipation leads to stronger rotation and strong mergers decrease the importance of rotation (Barnes 1989). The mean diagnostic for the underlying kinematics in ellipticals is the parameter, the ratio between the maximum rotation speed and the velocity dispersion (Binney 2005), usually plotted against galaxy ellipticity (the so-called the anisotropy diagram). Searching the literature, we have taken data for 68 galaxies in our sample (49 normal ellipticals, 19 D ellipticals) from Davies et al. (1983) and Emsellem et al. (2011). The resulting anisotropy diagram is shown in Figure 12.
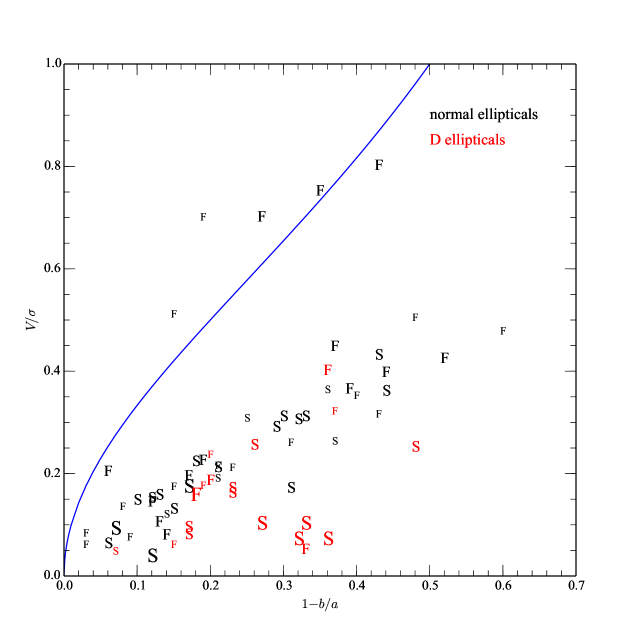
The anisotropy diagram indicates the underlying 3D shape of an elliptical where the blue line in Figure 12 is the canonical relationship for an oblate galaxy. Data points below this curve represent prolate and triaxial galaxies. In Figure 12 the size of the symbol is proportional to the luminosity of the galaxy and each symbol is marked as either ’F’ or ’S’ as a designation of the SAURON project’s classification as a fast or slow rotator (Emsellem et al. 2007). As can be seen in Figure 12, a majority of the normal and D ellipticals lie well below the oblate curve, despite indications of fast or slow rotation. The few normal ellipticals near the oblate line are all fast rotators, indicative of a rotational supported oblate shape. The D ellipticals are mostly slow rotators with low values, although not dramatically different than the distribution of normal ellipticals. We note that the brightest D ellipticals have the lowest values for their apparent ellipticity.
6 Conclusions
It is somewhat surprising that elliptical structure is as smooth a function of luminosity as displayed by the isophotal radius relations. For even normal ellipticals display a range of underlying kinematics that reflect many components (Emsellem et al. 2011). If kinematics dominate the structure of a galaxy, as reflected in its surface brightness profile, then the structure of ellipticals should take on a wide variety of shapes and slopes (although we note that most kinematic studies are confined to the core regions and kinematic statements about the outer regions are uncertain). We can only be guided by the fact that numerical simulations that invoke the two most common formation scenarios (dissipational monolithic collapse, Nipoti et al. 2006 and dissipationless merging, Aceves et al. 2006, Naab & Trujillo 2006) both result in Sérsic and shapes. In other words, simulations indicate that complicated kinematics still result in smooth surface brightness profiles due to a variety of relaxation processes that produces present-day elliptical galaxies in a state of quasi-equilibrium.
It is also interesting to note that the transition from rotation dominated kinematics and an anisotropic or pressure support kinematics occurs at approximately 23, which is also the structural point where normal elliptical structure transitions from Sérsic shapes to nearly in shape. As can been seen in the templates in Figure 3, faint elliptical structure is not in shape in that it has too much downward (fainter) curvature at small and large radii (which can be captured by the Sérsic index). For a galaxy brighter than , the profile shape deviates from a strict shape, but in a fashion predicted by the violent relaxation models of Hjorth & Madsen (1991). Comparison to their Figure 3 for the residuals from a shape is remarkably similar to the deviations from our templates (see our Figure 5), although the their simulations are not unique as a wide range of initial conditions result in similar galaxy shapes. However, it does suggest that a history of dry mergers (without dissipation) plays some role in the formation of bright ellipticals.
With the construction of the templates, and sequential re-comparison to all the elliptical profiles, comes the discovery that 1/3rd of the ellipticals in our sample, all classified as pure ellipticals based on visual morphology, deviate in a systematic fashion from the normal ellipticals templates. These ellipticals have shallower profiles than their templates at their respective luminosities, which would give them a diffuse appearance on a photographic plate. Thus, we refer to these objects as D ellipticals in acknowledgement of the pre-existing diffuse designation from Matthew, Morgan & Schmidt (1964), although this usually applied to 1st ranked galaxies in rich clusters (Schombert 1988). This dichotomy into normal (template) and D elliptical is unrelated to the core versus coreless separation, as this distinction is confined to the inner 1-2 kpc, nor is it related to the boxy versus disky isophotal shape for ellipticals (see §5.3).
The D ellipticals do not distinguish themselves, radically, from normal ellipticals through any physical characteristic other than structure. While they tend to be brighter and located in denser regions of the Universe, they cover the same luminosity and local density space as normal ellipticals. Their structural properties, as derived from fitting functions, have the same relationships as normal ellipticals (although this is more a statement concerning the limitations of fitting functions as D ellipticals clearly deviate in their profile shape). The isophotal characteristics of normal and D ellipticals are identical in terms of their axial ratio and 2D isophote shape. Their kinematics are similar, although none of the D ellipticals display strong rotation signatures.
Another key point is that a template pattern could not be constructed for D ellipticals, although their numbers are 1/3rd that of the normal ellipticals in the sample and the template algorithm may not have converged due to small numbers. In other words, even though the profiles of D ellipticals are shallower than normal ellipticals, the profile slope is not a smooth function of luminosity. If small numbers are not to blame, then the lack of uniformity to the D elliptical profiles suggests that these galaxies are formed by random or stochastic processes.
From the connection between the D ellipticals and the cD class found in rich clusters, we speculate that D ellipticals are more diffuse than normal ellipticals due to a recent history of dry (i.e. dissipationless) mergers. The D ellipticals are slightly more common a high luminosities and rich galaxy environments. Recent mergers would be more common in high density regions, and result in brighter ellipticals. While a tenuous connection, mergers have the right signature (more energy added to the stars in the outer orbits producing a more extended profile) and the degree of randomness induced by mergers would explain the lack of correlation with any other physical property to the D ellipticals.
As many galaxy formation scenarios have all ellipticals forming from mergers (Kauffmann & Charlot 1998), then the next concern is whether D ellipticals are stable or a transition class of objects. If stable, and all ellipticals are the result of mergers, than some special circumstances exist for D ellipticals with respect to normal ellipticals. If D ellipticals evolve into normal ellipticals, then the orbits of the stars after a recent merger which produces a D elliptical profile must later stabilize into a normal elliptical shape as given by the templates in Figure LABEL:template. If mergers are common for all ellipticals, than does the roughly 1-to-3 ratio of normal ellipticals to D ellipticals imply a stabilization timescale, or a current merger rate.
As evidence of dissipation formation is found in many ellipticals (e.g., color gradients), perhaps the difference between normal and D ellipticals is a measure of the importance of wet mergers, with dissipation effects, to later dry mergers where violent relaxation effects dominate. As strong dissipation leads to isotropic velocity distribution (Navarro 1990), and hierarchical mergers lead to structural non-homology (Dantas et al. 2003), the near homology of normal ellipticals implies a strong component of wet mergers in the early epochs where collapse prefers homology. Then, later dry mergers indice mild structural non-homology.
With respect to the origin of D ellipticals, it is already known that high redshift ellipticals lack the outer envelopes (Szomoru et al. 2012), which implies that most elliptical galaxies start forming their stars at high redshift in a dissipative environment, rapidly become very massive by by later mergers (Keres et al. 2009; Feldmann et al. 2011; Oser et al. 2012). But that the formation of the outer envelope occurs in an era dominated by dissipationless mergers, where new baryonic matter is added to the outer parts of the galaxies over time with very little star formation, (van Dokkum et al. 2010; Saracco et al. 2012). This form of rapid structural evolution promotes the growth of the outer envelope with very little change to the central regions, identical to the differences we detect between normal and D ellipticals.
Under hierarchical scenarios, mergers play a major roles in galaxy formation. They are expected to happen frequently and provide a natural way to increase the size of a galaxy. The addition of stellar material, particularly at large radii, cause the luminosity distribution to change significantly resulting in a significant increase of the Sérsic index (Hilz et al. 2012). When the relaxation period ends, stellar energy is not exchanged and positive energy stars escape and loosely bound stars expand to larger radii. This provides a natural mechanism to explain the changes in the shape of the templates as a function of total luminosity, and their similarity to shapes predicted by violent relaxation (Hjorth & Madsen 1995).
However, different types of dry mergers predict different profile shapes and kinematics. For example, equal mass mergers lead to anisotropic kinematics and shallower profiles (that increases with the galaxy masses) while unequal mass mergers (e.g., accretions) imparts rotation and more concentrated profiles (Khochfar & Burkert 2005). Numerical cosmological simulations find that the mass assembly of ellipticals is dominated by accretion of small galaxies with mass-ratios near 1-to-5 (Oser et al. 2012; Lackner et al. 2012). If D ellipticals are the result of nearly equal mass mergers, than their lower numbers compared to normal ellipticals is in agreement with the expectations from these simulations. Therefore, we propose that normal ellipticals are the result of late dry mergers will small companions, while the shallower D ellipticals are the result of recent dry mergers with nearly equal mass companions.
This may provide a natural mechanism for the division of rotation kinematics in ellipticals into fast and slow rotators. The SAURON project (Emsellem et al. 2007) finds all fast rotators to be low luminosity, but slow rotators, although brighter in the mean, are found at all luminosities, like D ellipticals. Slow rotators may be result of dissipationless mergers, where most of the baryonic momentum is expelled outward resulting in diffuse envelopes. Thus, the expectation that all D ellipticals be triaxal, as seen in Figure 12.
There are several testable prediction from the above scenario for the formation of D ellipticals. For example, mergers can produce gradients and color-magnitude relation (Kauffmann & Charlot 1998); however, there should be measurable differences between the gradients in normal and D ellipticals. Structural non-homology can be driven by varying star formation histories (Bekki 1998), so age and metallicity gradients would test the levels of star formation during the past mergers. Clearly, the kinematics of D ellipticals envelopes should be more energetic than normal ellipticals, but this would require deep optical spectroscopy of their envelopes, perhaps a future project for our next generation ground-based telescopes (Raskutti, Greene & Murphy 2014).
Acknowledgements:
The software for this project was supported by NASA’s AISR and ADP programs. This publication makes use of data products from the Two Micron All Sky Survey, which is a joint project of the University of Massachusetts and the Infrared Processing and Analysis Center/California Institute of Technology, funded by the National Aeronautics and Space Administration and the National Science Foundation. In addition, this research has made use of the NASA/IPAC Extragalactic Database (NED) which is operated by the Jet Propulsion Laboratory, California Institute of Technology, under contract with the National Aeronautics and Space Administration.
References
- Aceves et al. (2006) Aceves, H., Velázquez, H., & Cruz, F. 2006, MNRAS, 373, 632
- Andreon & Davoust (1997) Andreon, S., & Davoust, E. 1997, A&A, 319, 747
- Barnes (1989) Barnes, C. A. 1989, Nuclear Astrophysics, 226
- Bekki (1998) Bekki, K. 1998, ApJ, 502, L133
- Benacchio & Galletta (1980) Benacchio, L., & Galletta, G. 1980, MNRAS, 193, 885
- Bender et al. (1988) Bender, R., Doebereiner, S., & Moellenhoff, C. 1988, A&AS, 74, 385
- Bernardi et al. (2003) Bernardi, M., Sheth, R. K., Annis, J., et al. 2003, AJ, 125, 1849
- Binney (2005) Binney, J. 2005, MNRAS, 363, 937
- Burkert (1993) Burkert, A. 1993, A&A, 278, 23
- Burstein et al. (1997) Burstein, D., Bender, R., Faber, S., & Nolthenius, R. 1997, AJ, 114, 1365
- Cappellari et al. (2013) Cappellari, M., McDermid, R. M., Alatalo, K., et al. 2013, MNRAS, 432, 1862
- Conselice (2003) Conselice, C. J. 2003, ApJS, 147, 1
- Dantas et al. (2003) Dantas, C. C., Capelato, H. V., Ribeiro, A. L. B., & de Carvalho, R. R. 2003, MNRAS, 340, 398
- Davies et al. (1983) Davies, R. L., Efstathiou, G., Fall, S. M., Illingworth, G., & Schechter, P. L. 1983, ApJ, 266, 41
- Djorgovski & Davis (1987) Djorgovski, S., & Davis, M. 1987, ApJ, 313, 59
- Dressler & Sandage (1983) Dressler, A., & Sandage, A. 1983, ApJ, 265, 664
- Driver (2010) Driver, S. P. 2010, American Institute of Physics Conference Series, 1240, 17
- Duncan et al. (1983) Duncan, M. J., Farouki, R. T., & Shapiro, S. L. 1983, ApJ, 271, 22
- Emsellem et al. (2007) Emsellem, E., Cappellari, M., Krajnović, D., et al. 2007, MNRAS, 379, 401
- Emsellem et al. (2011) Emsellem, E., Cappellari, M., Krajnović, D., et al. 2011, MNRAS, 414, 888
- Faber & Jackson (1976) Faber, S. M., & Jackson, R. E. 1976, ApJ, 204, 668
- Galletta (1980) Galletta, G. 1980, A&A, 81, 179
- Graham & Colless (1997) Graham, A., & Colless, M. 1997, MNRAS, 287, 221
- Graham & Guzman (2004) Graham, A. W., & Guzman, R. 2004, Penetrating Bars Through Masks of Cosmic Dust, 319, 723
- Graham (2002) Graham, A. W. 2002, MNRAS, 334, 859
- Graham (2005) Graham, A. W. 2005, IAU Colloq. 198: Near-fields cosmology with dwarf elliptical galaxies, 303
- Graham (2013) Graham, A. W. 2013, Planets, Stars and Stellar Systems. Volume 6: Extragalactic Astronomy and Cosmology, 91
- Hilz et al. (2012) Hilz, M., Naab, T., Ostriker, J. P., et al. 2012, MNRAS, 425, 3119
- Hjorth & Madsen (1991) Hjorth, J., & Madsen, J. 1991, MNRAS, 253, 703
- Hjorth & Madsen (1993) Hjorth, J., & Madsen, J. 1993, MNRAS, 265, 237
- Hjorth & Madsen (1995) Hjorth, J., & Madsen, J. 1995, ApJ, 445, 55
- Huang et al. (2013) Huang, S., Ho, L. C., Peng, C. Y., Li, Z.-Y., & Barth, A. J. 2013, ApJ, 766, 47
- Jedrzejewski (1987) Jedrzejewski, R. I. 1987, MNRAS, 226, 747
- Kauffmann & Charlot (1998) Kauffmann, G., & Charlot, S. 1998, arXiv:astro-ph/9810031
- Khochfar & Burkert (2005) Khochfar, S., & Burkert, A. 2005, MNRAS, 359, 1379
- Kormendy & Bender (1996) Kormendy, J., & Bender, R. 1996, ApJ, 464, L119
- Kormendy (1977) Kormendy, J. 1977, ApJ, 217, 406
- Kormendy (1980) Kormendy, J. 1980, Two Dimensional Photometry, 191
- Kormendy et al. (2009) Kormendy, J., Fisher, D. B., Cornell, M. E., & Bender, R. 2009, ApJS, 182, 216
- La Barbera et al. (2012) La Barbera, F., Ferreras, I., de Carvalho, R. R., et al. 2012, MNRAS, 426, 2300
- Lackner et al. (2012) Lackner, C. N., Cen, R., Ostriker, J. P., & Joung, M. R. 2012, MNRAS, 425, 641
- Matthews et al. (1964) Matthews, T. A., Morgan, W. W., & Schmidt, M. 1964, ApJ, 140, 35
- McGaugh & Schombert (2015) McGaugh, S. S., & Schombert, J. M. 2015, ApJ, 802, 18
- Michard (1994) Michard, R. 1994, A&A, 288, 401
- Miller (1988) Miller, R. H. 1988, Comments on Astrophysics, 13, 1
- Morgan & Lesh (1965) Morgan, W. W., & Lesh, J. R. 1965, ApJ, 142, 1364
- Naab & Trujillo (2006) Naab, T., & Trujillo, I. 2006, MNRAS, 369, 625
- Navarro (1990) Navarro, J. F. 1990, MNRAS, 242, 311
- Nieto et al. (1992) Nieto, J.-L., Bender, R., Poulain, P., & Surma, P. 1992, A&A, 257, 97
- Nipoti et al. (2006) Nipoti, C., Londrillo, P., & Ciotti, L. 2006, MNRAS, 370, 681
- Oegerle & Hill (2001) Oegerle, W. R., & Hill, J. M. 2001, AJ, 122, 2858
- Oser et al. (2012) Oser, L., Naab, T., Ostriker, J. P., & Johansson, P. H. 2012, ApJ, 744, 63
- Pasquali et al. (2007) Pasquali, A., van den Bosch, F. C., & Rix, H.-W. 2007, ApJ, 664, 738
- Prugniel & Simien (1996) Prugniel, P., & Simien, F. 1996, A&A, 309, 749
- Prugniel & Simien (1997) Prugniel, P., & Simien, F. 1997, A&A, 321, 111
- Raskutti et al. (2014) Raskutti, S., Greene, J. E., & Murphy, J. D. 2014, ApJ, 786, 23
- Roig et al. (2015) Roig, B., Blanton, M. R., & Yan, R. 2015, arXiv:1506.05013
- Sérsic (1963) Sérsic, J. L. 1963, Boletin de la Asociacion Argentina de Astronomia La Plata Argentina, 6, 99
- Schombert & Smith (2012) Schombert, J., & Smith, A. K. 2012, PASA, 29, 174
- Schombert (1986) Schombert, J. M. 1986, ApJS, 60, 603
- Schombert (1987) Schombert, J. M. 1987, ApJS, 64, 643
- Schombert (1988) Schombert, J. M. 1988, ApJ, 328, 475
- Schombert (2011) Schombert, J. 2011, arXiv:1107.1728
- Schombert (2013) Schombert, J. M. 2013, PASA, 30, e034
- Strom & Strom (1978) Strom, K. M., & Strom, S. E. 1978, AJ, 83, 1293
- Scorza & Bender (1995) Scorza, C., & Bender, R. 1995, A&A, 293, 20
- Szomoru et al. (2012) Szomoru, D., Franx, M., & van Dokkum, P. G. 2012, ApJ, 749, 121
- Tantalo et al. (1998) Tantalo, R., Chiosi, C., Bressan, A., Marigo, P., & Portinari, L. 1998, A&A, 335, 823
- Visvanathan & Sandage (1977) Visvanathan, N., & Sandage, A. 1977, ApJ, 216, 214
- de Vaucouleurs (1948) de Vaucouleurs, G. 1948, Annales d’Astrophysique, 11, 247
- van Albada (1982) van Albada, T. S. 1982, MNRAS, 201, 939
| Sérsic | |||||
|---|---|---|---|---|---|
| log | log | log | |||
| (kpc) | (kpc) | ||||
| Inner Fits | |||||
| 21.5 | 0.23 | 19.05 | 0.22 | 18.97 | 0.22 |
| 22.0 | 0.33 | 19.09 | 0.30 | 18.94 | 0.41 |
| 23.0 | 0.52 | 19.18 | 0.52 | 19.17 | 0.62 |
| 24.0 | 0.65 | 18.97 | 0.65 | 19.02 | 0.64 |
| 25.0 | 0.82 | 19.07 | 0.77 | 18.84 | 0.54 |
| Outer Fits | |||||
| 21.5 | 0.42 | 14.96 | 1.89 | 19.28 | 0.08 |
| 22.0 | 0.99 | 17.14 | 2.25 | 19.22 | 0.25 |
| 23.0 | 2.99 | 18.93 | 4.04 | 19.60 | 0.38 |
| 24.0 | 5.09 | 19.24 | 5.87 | 19.51 | 0.44 |
| 25.0 | 8.70 | 19.62 | 8.65 | 19.58 | 0.54 |
| Full Fits | |||||
| 21.5 | 0.85 | 17.45 | 1.72 | 19.02 | 0.13 |
| 22.0 | 1.38 | 18.16 | 2.02 | 18.95 | 0.30 |
| 23.0 | 3.18 | 19.10 | 3.25 | 19.09 | 0.49 |
| 24.0 | 4.72 | 19.07 | 4.79 | 19.06 | 0.53 |
| 25.0 | 7.58 | 19.29 | 7.49 | 19.25 | 0.58 |