A CIRCULAR-RIBBON SOLAR FLARE FOLLOWING AN ASYMMETRIC FILAMENT ERUPTION
Abstract
The dynamic properties of flare ribbons and the often associated filament eruptions can provide crucial information on the flaring coronal magnetic field. This Letter analyzes the GOES-class X1.0 flare on 2014 March 29 (SOL2014-03-29T17:48), in which we found an asymmetric eruption of a sigmoidal filament and an ensuing circular flare ribbon. Initially both EUV images and a preflare nonlinear force-free field model show that the filament is embedded in magnetic fields with a fan-spine-like structure. In the first phase, which is defined by a weak but still increasing X-ray emission, the western portion of the sigmoidal filament arches upward and then remains quasi-static for about five minutes. The western fan-like and the outer spine-like fields display an ascending motion, and several associated ribbons begin to brighten. Also found is a bright EUV flow that streams down along the eastern fan-like field. In the second phase that includes the main peak of hard X-ray (HXR) emission, the filament erupts, leaving behind two major HXR sources formed around its central dip portion and a circular ribbon brightened sequentially. The expanding western fan-like field interacts intensively with the outer spine-like field, as clearly seen in running difference EUV images. We discuss these observations in favor of a scenario where the asymmetric eruption of the sigmoidal filament is initiated due to an MHD instability and further facilitated by reconnection at a quasi-null in corona; the latter is in turn enhanced by the filament eruption and subsequently produces the circular flare ribbon.
Subject headings:
Sun: activity – Sun: magnetic fields – Sun: flares – Sun: X-rays, gamma rayscolor figures, animations
1. INTRODUCTION
The morphology and dynamics of chromospheric flare ribbons provide a direct observational link to the coronal magnetic reconnection process. Recent high-resolution observations revealed a particular kind of flares exhibiting a closed, circular-like ribbon (e.g., Masson et al., 2009; Reid et al., 2012; Wang & Liu, 2012; Sun et al., 2013; Jiang et al., 2014; Vemareddy & Wiegelmann, 2014; Mandrini et al., 2014; Zhang et al., 2015; Joshi et al., 2015), which cannot be accommodated by the classical two-dimensional (2D)-like reconnection model stipulating two quasi-parallel ribbons (e.g., Kopp & Pneuman, 1976). A small ribbon is always found inside the circular ribbon; meanwhile, a third ribbon is seen in a remote region and/or a jet-like eruption may originate from the circular ribbon area. The associated photospheric magnetic field usually consists of a central unipolar region encompassed by the opposite-polarity field, forming a circular magnetic polarity inversion line (PIL). These observational features can fit into the fan-spine magnetic topology model (Lau & Finn, 1990; Pontin et al., 2013), in which the dome-shaped fan corresponds to the closed separatrix surface between different connectivity domains and the inner and outer spine field lines meet at a null point. The circular (inner) ribbons are located at the intersection of the fan (inner spine) with the photosphere, while the outer spine can be closed or open. Notably, the sequential brightening of the circular ribbon and the elongated shape of the inner/outer spine ribbons in many such events suggest the presence of extended quasi-separatrix layers (QSLs) (Masson et al., 2009). Circular-ribbon flares have been regarded as a typical example of confined events triggered by instabilities at the scale of the current sheet (e.g., tearing instabilities; Priest & Pontin 2009; Masson et al. 2009; Archontis et al. 2005; Shibata & Tanuma 2001).
Meanwhile, for eruptive flares and coronal mass ejections (CMEs), it is still highly debated whether current sheet instabilities or a large (MHD) scale instability (e.g. kink and torus instabilities, see Aulanier et al. 2010) act as a trigger. The temporal evolution of eruptive events is usually characterized by an initial slow rise of filament flux ropes (FRs) (e.g., Fan, 2010; Savcheva et al., 2012), before the kink/torus instability sets in (e.g., Liu et al., 2012; Zhu & Alexander, 2014). Sometimes only one end of a filament erupts while the other end remains anchored (e.g., Tripathi et al., 2006; Liu et al., 2009). Such asymmetric zipping-like filament eruptions may imply a nonuniform confinement along the filament (e.g., Liu et al., 2010).
Most intriguingly, some circular-ribbon flares are accompanied by a CME, which originates from an active filament embedded under the fan dome. It is speculated that the null-point reconnection may trigger the filament eruption (Sun et al., 2013) or the other way around (Jiang et al., 2014). Since both local and global instabilities can develop in circular-ribbon flares, studying them is very worthwhile in understanding all flares and eruptions. In this Letter, we investigate the 2014 March 29 X1.0 flare (SOL2014-03-29T17:48), in which we found a circular ribbon associated with an asymmetric filament eruption and a halo CME. We will concentrate on the interaction between the filament and magnetic fields overlying the circular ribbon, which has not been addressed before.
2. OBSERVATIONS AND MAGNETIC FIELD MODELING
To identify filaments and flare ribbons, we used a Ca ii 8542 Å image taken by the Interferometric Bidimensional Spectrometer (IBIS; see Kleint et al. 2015 for observation details), and also Si iv 1400 Å and Mg ii h/k 2796 Å slit-jaw images observed with the Interface Region Imaging Spectrograph (IRIS; De Pontieu et al. 2014). To observe large-scale flaring activities, we mainly used 304 Å (He ii) and 211 Å (Fe xiv) images from the Atmospheric Imaging Assembly (AIA; Lemen et al. 2012) on board the Solar Dynamics Observatory (SDO; Pesnell et al. 2012). The flare X-ray emission was registered by the Reuven Ramaty High Energy Solar Spectroscopic Imager (RHESSI; Lin et al. 2002). We used X-ray light curves to elucidate event evolution phases, and reconstructed X-ray images using front detectors 3–7 with the PIXON algorithm (Hurford et al., 2002).
We examined the photospheric magnetic field using a preflare vector magnetogram from the Helioseismic and Magnetic Imager (HMI; Schou et al. 2012) on board SDO. The vector data we chose for a nonlinear force-free field (NLFFF) extrapolation are remapped using Lambert equal area projection, resulting in a pixel scale of 0.03∘. First a preprocessing procedure (Wiegelmann et al., 2006) was performed to minimize the net force and torque in the observed photospheric field. The “weighted optimization” (Wheatland et al., 2000; Wiegelmann, 2004) method optimized for SDO/HMI magnetograms (Wiegelmann & Inhester, 2010; Wiegelmann et al., 2012) was then applied to derive the NLFFF, from which field lines were computed with a 4-th order Runge-Kutta solver. The calculation was conducted using 2 2 rebinned vector data as the bottom boundary, within a box of 320 400 256 uniform grid points corresponding to about 233 292 187 Mm3.
3. EVIDENCE OF FILAMENT-EMBEDDED QUASI-FAN-SPINE MAGNETIC STRUCTURE
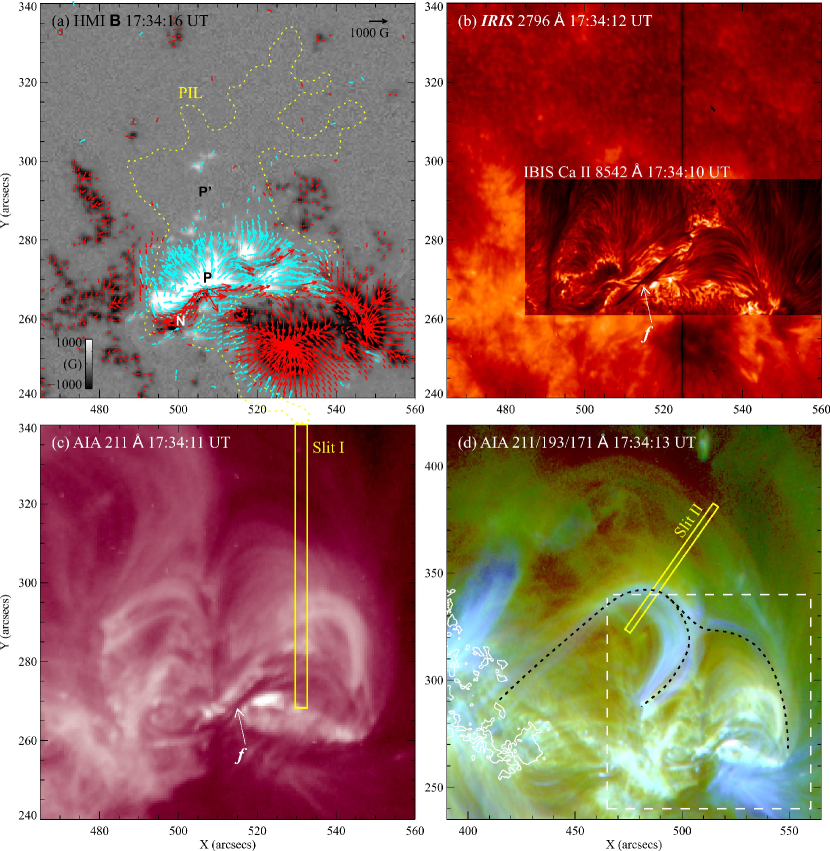
The source active region NOAA 12017 shows highly sheared magnetic fields (with a shear angle of 80∘) between the positive P spot and another small neighboring elongated region N of negative polarity (see Figure 1(a)), which cancels with P from 10 hrs before the flare. Interestingly, small positive areas P’ form a northern extension of P, and the positive fields P/P’ are surrounded by negative magnetic regions/patches, forming a quasi-circular PIL (at the chromospheric level; see the dotted line in Figure 1(a)). From both the chromospheric and coronal images (Figures 1(b) and (c)), it can be clearly observed that a sigmoidal filament , which could be formed related to the above-mentioned flux cancellation between sheared fields (e.g., van Ballegooijen & Martens, 1989; Amari et al., 2000), lies along the entire southern portion of the PIL. Doppler measurements show that the filament slowly rises during many hours before the flare (Kleint et al., 2015). Coronal loops are seen to stem from the central P/P’ regions and fan out to the peripheral negative fields, apparently overarching the filaments. Meanwhile, these dome-like loops are also enveloped by large-scale field lines (e.g., dotted lines in Figure 1(d)), which seem to converge at the top of the dome and reach out to a remote positive field region.
We resort to the NLFFF extrapolation model at a time immediately before the flare (2014 March 29 17:34 UT) to better illustrate the three-dimensional (3D) magnetic field structure. For a quantitative evaluation of the instability condition of filament FRs, we compute the magnetic twist number of a field line and the decay index of the overlying field, which are related to the kink and torus instabilities, respectively. Specifically, the twist number can be derived as (Berger & Prior, 2006), where is the force-free function, is the field line length, and turns is the typical kink unstable threshold for anchored magnetic loops (e.g., Török et al., 2004; Fan, 2005). The decay index is defined as , where is the strength of the horizontal component of the overlying potential field, is the height above the surface, and –1.5 is the theoretical torus unstable threshold (e.g., Bateman, 1978; Kliem & Török, 2006; Liu, 2008; Démoulin & Aulanier, 2010).
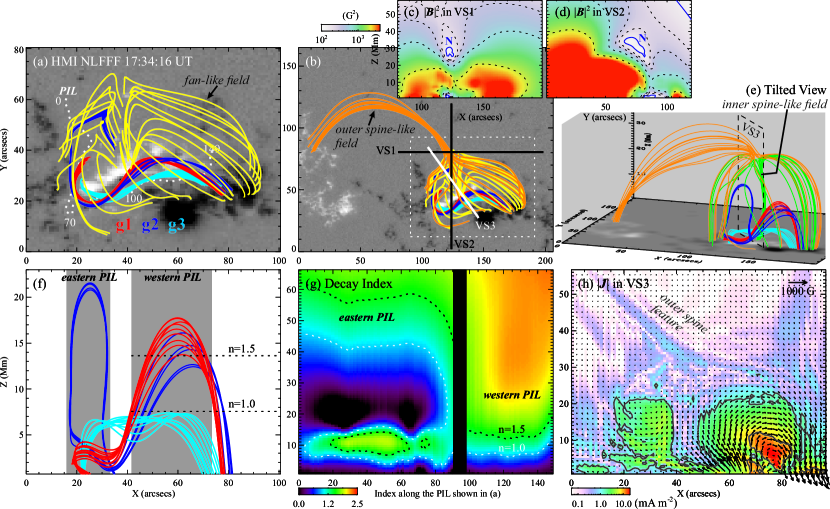
We trace field lines from positions around footpoints of distinct features, and depict in Figure 2(a) characteristic model field lines, including moderately twisted FRs g1 (red; =1.23), g2 (blue; =1.95), g3 (cyan; =1.31), and weakly twisted overlying arcade-like loops (yellow). Compared to Figures 1(b) and (c), g1 and g2 together bear a good resemblance to the observed filament (also cf. Figures 3(d) and (i)), and the arcade fields correspond to the overarching fan-like dome. The side view in Figure 2(f) displays that g1 and g2 may be distinguished from g3 since they both exhibit double hump-like elbows with the segment in-between dipping down very close to the surface around a common position. This suggests that the filament FR could be gradually built up due to the tether-cutting reconnection at photospheric levels (e.g., Jiang et al., 2014). Note however that g1–g3 may represent different parts of an integrated structure.
We did not find the relevant null point in our extrapolation model. Nevertheless, two vertical slices VS1 and VS2 of 3D magnetic field (see Figures 2(c) and (d); bottom sides are marked in (b)) indicate a weak field region N (B 12 G) located right above the dome structure. Model field lines passing close to N portray inner spine-like field lines (green in Figure 2(e)) rooted at P’ region and the outer spine-like field lines (orange in Figures 2(b) and (e)) that envelope the dome and extend to the eastern positive field, consistent with the coronal observation (Figure 1(d)). We further plot in Figure 2(h) the distribution of electric current density J in a vertical slice VS3 (dashed box in Figure 2(e); also marked in (b)), which is oriented perpendicular to and cut through the middle of FRs g1/g2. The result shows two halves of the dome embedding a filament FR, on top of which appears an outer spine feature concentrated with currents (Sun et al., 2013). The above observational and model results suggest that the flaring region could be characterized with a quasi-fan-spine and quasi-null topology, with QSLs instead of real separatrices.
We note that unlike g1 and g3, the g2 FR has a twist number greater than the kink instability threshold. We also calculate the decay index along the PIL positions beneath the FRs (the dotted line in Figures 2(a)). From Figure 2(g) a vastly different distribution of can be obviously seen between the volume above the eastern and western portions of the PIL, where the eastern and western elbows of g1/g2 FPs reside, respectively. A comparison with the apex heights of FRs (Figure 2(f)) reveals that the eastern elbows of g1/g2 and also g3 could be strongly confined by the overlying field, while the western elbows of g1/g2 already reach the torus instability threshold. Thus the filament FR could become unstable due to the combination of kink and torus instabilities.
4. ASYMMETRIC FILAMENT ERUPTION AND
CIRCULAR FLARE RIBBON
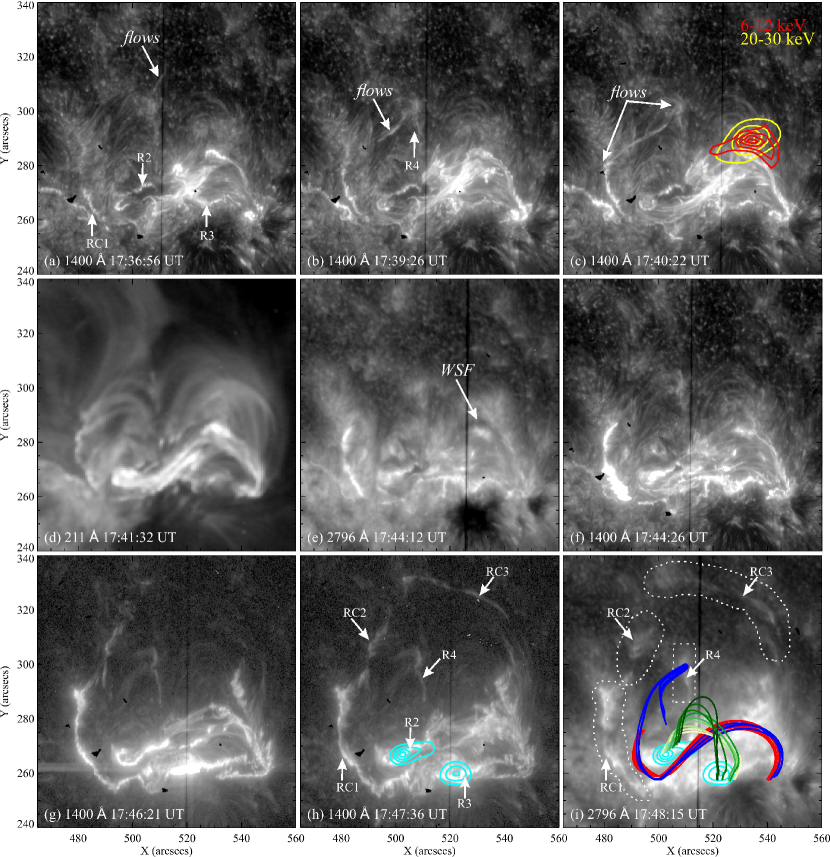
Figures 3 and 4 present the evolution of filaments, flare ribbons, and coronal loops. More dynamic details can be seen in the accompanying animations. Figure 5 shows temporal characteristics of event properties, including distance-time profiles of slits I and II as denoted in Figure 1(c) and (d). We constructed the slit I by orientating the long side of a 3″ 72″ window in the south-north direction across the top of the western elbow of the sigmoidal (WSF) and the fan-like field above. The slit II has the same size as slit I, and is placed across the top of the outer spine field at 35∘ clockwise from the solar north. Pixels are averaged across the width of the slit. The X-ray light curves of the entire flare show two broad peaks (with the second one much stronger than the first one; see Figure 5(a)), visibly dividing the whole event into two phases. In the following, we describe the event evolution in detail.
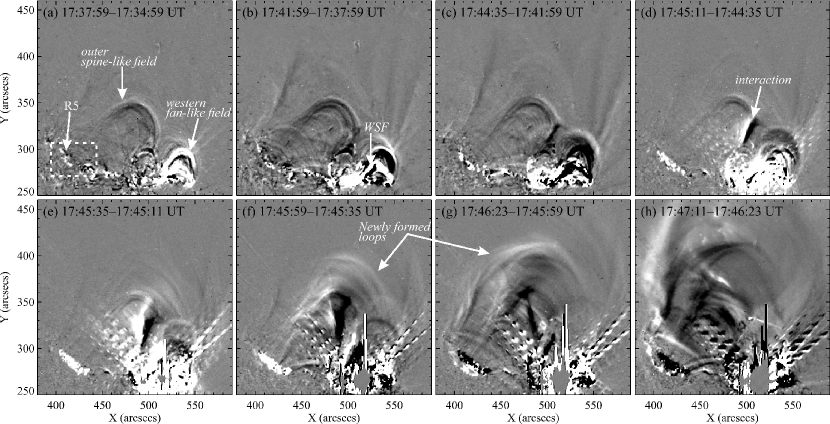
Phase I (17:35–17:43 UT).— The WSF begins to arch upward at 30 km s-1 (in the projected plane; same as below) soon after the event onset, until it reaches a higher altitude at 17:38 UT and remains quasi-static there for about five minutes (Figures 3(a)–(e) and Figure 5(d)). We observe that (1) the rising WSF could interact with the ambient fields to produce brightenings (Figure 5(d)), which are cospatial with X-ray sources (see Figure 3(c)). Subsequently, the heated materials appear to propagate toward the two ends of f (Figures 3(b)–(d); also see the time-lapse movies). (2) The western fan-like field rises together with the WSF at 20 km s-1, and the outer spine-like field also shows a slow ascending motion at 9 km s-1 (see Figures 4(a) and (b), and 5(d) and (e)). This hints that the change of local magnetic field configuration at the WSF may perturb the whole quasi-fan-spine structure. (3) An interesting observation related to this perturbation could be that an EUV flow (pointed to by arrows in Figures 3(a)–(c)) originates from the presumed coronal quasi-null region (cf. Figures 3(a) and (d)) and streams down along the eastern fan-like field. The flow seems to gain its maximum strength at 17:40 UT, cotemporal with the peak of X-ray emissions of Phase I (Figure 5(a)). (4) A total of five ribbons start to develop during this phase, including ribbons R2 and R3 lying on either side around the central dip of , and RC1, R4, and R5 located at the footpoints of the eastern fan-like, the inner spine-like, and the outer spine-like fields, respectively (see Figures 3(a)–(c) and 4(a) and (b)). Although insignificant, RC1, R4, and R5 all show an enhancement around the X-ray peak at 17:40 UT (see Figures 5(b) and (c)), evidencing reconnection at the coronal quasi-null region possibly driven by the rising WSF. An important property is that R4 and R5 are both elongated, different from the singular footpoints as expected in the fan-spine topology model. This supports the existence of extended QSLs (e.g., Masson et al., 2009).
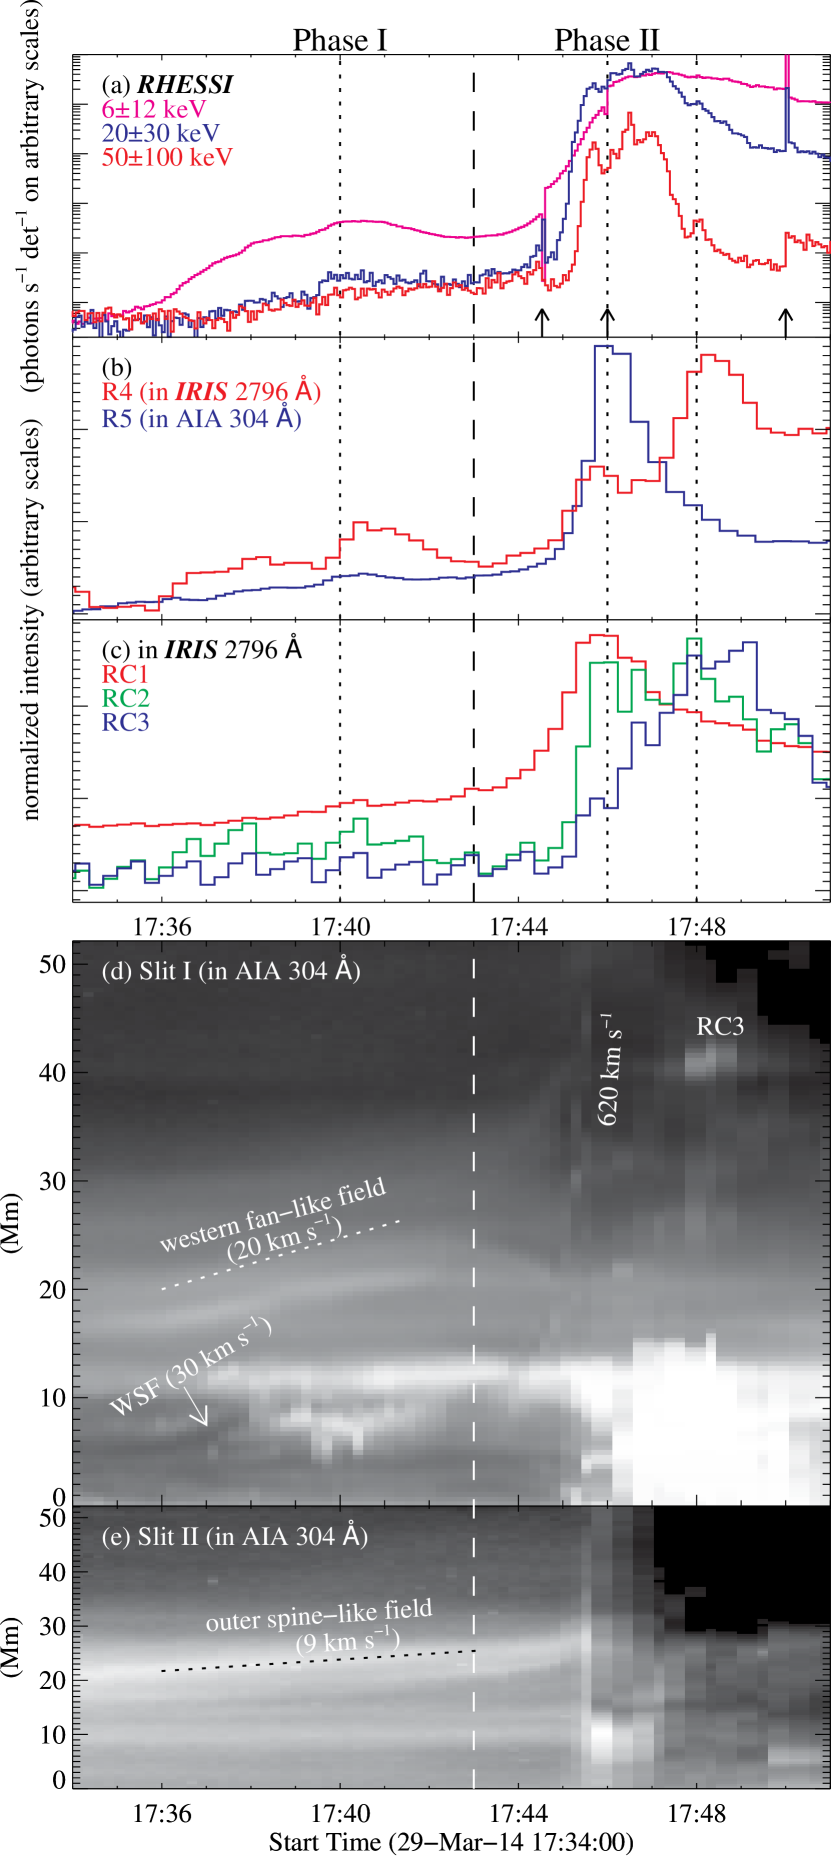
Phase II (from 17:43 UT).— The top portion of the WSF erupts at 620 km s-1 and later develop into a CME. The outward motion is immediately followed by impulsive HXR emissions (cf. Figures 5(a) and (d)). In contrast, the eastern elbow of the sigmoidal filament remains undisrupted, suggesting the asymmetric nature of this filament eruption. Several noteworthy event characteristics are as follows.
First, the western fan-like field clearly shows an outward expansion and interacts with the outer spine-like field, as indicated by the black/white feature in 211 Å running difference images (Figures 4(c)–(f)). It is plausible that this interaction, which is most intensive around the HXR peak, may be similar to the breakout-type reconnection at the coronal null (Sun et al., 2013), which facilitates and results in the violent eruption of the WSF. It also produces large-scale eruptive field lines connecting the remote positive field and the western negative field (Figures 4(f)–(h)).
Second, two main 50–100 keV sources at the HXR peak are cospatial with the ribbons R2 and R3 (Figures 3(h) and (i)), located on either side around the filament dip. These HXR sources show motions in directions both parallel and perpendicular to the PIL (Kleint et al., 2015), consistent with what was found previously during asymmetric filament eruptions (e.g., Liu et al., 2009, 2010). We consider that these main HXR emissions are produced as field lines (green in Figure 3(i)) strapping the filament dip portion reconnect after they are stretched open by the WSF eruption.
Third, the flare ribbons RC1, R4, and R5 all peak with the main HXR at 17:46 UT, and R4 further enhances with the HXR spike at 17:48 UT (see Figures 5(a)–(c)). Intriguingly, another two ribbons RC2 and RC3 begin to form with the rapid rising of HXRs from 17:45 UT (Figures 3(f)–(h)). The former peaks at both 17:46 and 17:48 UT, while the latter only peaks until 17:48 UT (see Figures 5(c) and (d)). Therefore, flare ribbons RC1–RC3 seemingly brighten in a clockwise fashion along the footpoints of the fan to form a circular-like ribbon. This sequential brightening is a pronounced characteristics of circular-ribbon flares, which strongly suggest reconnection within extended QSLs (e.g., Masson et al., 2009; Reid et al., 2012).
5. SUMMARY AND DISCUSSION
Using high-resolution observations from IRIS and SDO/AIA aided by a NLFFF model, we have presented a detailed study of an asymmetric filament eruption and the ensued flare with a circular ribbon. The main results are summarized as follows.
-
1.
A sigmoidal filament lies along the southern portion of the quasi-circular PIL and its formation could be associated with flux cancellation between sheared core fields. Coronal observations connote that could be enveloped by 3D fields with a fan-spine-like topology. This magnetic structure is evidenced by the NLFFF model, which also shows that has a double-hump configuration with a central dip, with its western portion vulnerable to the torus instability. The filament could also become unstable due to kink instability.
-
2.
With the eastern portion undisturbed, the western portion of arches upward at 30 km s-1 soon after the event onset at 17:35 UT, and remains quasi-static at a higher height for about five minutes. During this phase I, several signatures of the interaction between and the fan-spine-like field are identified, including that (1) the western fan-like and the outer spine-like fields show an ascending motion. (2) The rising of causes brightenings cospatial with X-ray sources. (3) Most obviously seen around an X-ray peak, an EUV flow stems from the quasi-null region and streams down along the eastern fan-like field. (4) Elongated ribbons RC1, R4, and R5 at the footpoints of the eastern fan-like and the inner and outer spine-like fields, respectively, begin to develop.
-
3.
The phase II starts from 17:43 UT as the top portion of erupts at a speed of 620 km s-1, immediately leading to the climax of the flare emission with two main HXR sources found on either side around the filament dip. Around the HXR peak, the rising western fan-like field driven by the erupting interacts intensively with the outer spine-like field as seen in running difference images in EUV; meanwhile, a circular ribbon brightens sequentially in the clockwise direction along the footpoints of the fan-like field.
We suggest that the initiation of the asymmetric eruption is due to the nonuniform confinement and an MHD instability. This disturbs the fan-spine-like field to cause the breakout-type reconnection at the coronal quasi-null region. Subsequently, the filament erupts rapidly triggering intense reconnection at the quasi-null, which produces the circular flare ribbon. This indicates that circular-ribbon flares, which were regarded as a typical example of confined events triggered by reconnection at the current sheet, can also be as complex as eruptive flares, possibly triggered by MHD scale instabilities.
References
- Amari et al. (2000) Amari, T., Luciani, J. F., Mikic, Z., & Linker, J. 2000, ApJ, 529, L49
- Archontis et al. (2005) Archontis, V., Moreno-Insertis, F., Galsgaard, K., & Hood, A. W. 2005, ApJ, 635, 1299
- Aulanier et al. (2010) Aulanier, G., Török, T., Démoulin, P., & DeLuca, E. E. 2010, ApJ, 708, 314
- Bateman (1978) Bateman, G. 1978, MHD Instabilities (Cambridge, MA: MIT Press)
- Berger & Prior (2006) Berger, M. A., & Prior, C. 2006, Journal of Physics A Mathematical General, 39, 8321
- De Pontieu et al. (2014) De Pontieu, B., Title, A. M., Lemen, J. R., et al. 2014, Sol. Phys., 289, 2733
- Démoulin & Aulanier (2010) Démoulin, P., & Aulanier, G. 2010, ApJ, 718, 1388
- Fan (2005) Fan, Y. 2005, ApJ, 630, 543
- Fan (2010) —. 2010, ApJ, 719, 728
- Hurford et al. (2002) Hurford, G. J., et al. 2002, Sol. Phys., 210, 61
- Jiang et al. (2014) Jiang, C., Wu, S. T., Feng, X., & Hu, Q. 2014, ApJ, 780, 55
- Joshi et al. (2015) Joshi, N. C., Liu, C., Sun, X., Wang, H., Magara, T., & Moon, Y.-J. 2015, ApJ, accepted
- Kleint et al. (2015) Kleint, L., Battaglia, M., Reardon, K., Sainz Dalda, A., Young, P. R., & Krucker, S. 2015, ApJ, 806, 9
- Kliem & Török (2006) Kliem, B., & Török, T. 2006, Phys. Rev. Lett., 96, 255002
- Kopp & Pneuman (1976) Kopp, R. A., & Pneuman, G. W. 1976, Sol. Phys., 50, 85
- Lau & Finn (1990) Lau, Y.-T., & Finn, J. M. 1990, ApJ, 350, 672
- Lemen et al. (2012) Lemen, J. R., Title, A. M., Akin, D. J., et al. 2012, Sol. Phys., 275, 17
- Lin et al. (2002) Lin, R. P., et al. 2002, Sol. Phys., 210, 3
- Liu et al. (2010) Liu, C., Lee, J., Jing, J., Liu, R., Deng, N., & Wang, H. 2010, ApJ, 721, L193
- Liu et al. (2009) Liu, R., Alexander, D., & Gilbert, H. R. 2009, ApJ, 691, 1079
- Liu et al. (2012) Liu, R., Kliem, B., Török, T., Liu, C., Titov, V. S., Lionello, R., Linker, J. A., & Wang, H. 2012, ApJ, 756, 59
- Liu (2008) Liu, Y. 2008, ApJ, 679, L151
- Mandrini et al. (2014) Mandrini, C. H., Schmieder, B., Démoulin, P., Guo, Y., & Cristiani, G. D. 2014, Sol. Phys., 289, 2041
- Masson et al. (2009) Masson, S., Pariat, E., Aulanier, G., & Schrijver, C. J. 2009, ApJ, 700, 559
- Pesnell et al. (2012) Pesnell, W. D., Thompson, B. J., & Chamberlin, P. C. 2012, Sol. Phys., 275, 3
- Pontin et al. (2013) Pontin, D. I., Priest, E. R., & Galsgaard, K. 2013, ApJ, 774, 154
- Priest & Pontin (2009) Priest, E. R., & Pontin, D. I. 2009, Physics of Plasmas, 16, 122101
- Reid et al. (2012) Reid, H. A. S., Vilmer, N., Aulanier, G., & Pariat, E. 2012, A&A, 547, A52
- Savcheva et al. (2012) Savcheva, A. S., van Ballegooijen, A. A., & DeLuca, E. E. 2012, ApJ, 744, 78
- Schou et al. (2012) Schou, J., Scherrer, P. H., Bush, R. I., Wachter, R., Couvidat, S., Rabello-Soares, M. C., Bogart, R. S., Hoeksema, J. T., Liu, Y., Duvall, T. L., Akin, D. J., Allard, B. A., Miles, J. W., Rairden, R., Shine, R. A., Tarbell, T. D., Title, A. M., Wolfson, C. J., Elmore, D. F., Norton, A. A., & Tomczyk, S. 2012, Sol. Phys., 275, 229
- Shibata & Tanuma (2001) Shibata, K., & Tanuma, S. 2001, Earth, Planets, and Space, 53, 473
- Sun et al. (2013) Sun, X., Hoeksema, J. T., Liu, Y., Aulanier, G., Su, Y., Hannah, I. G., & Hock, R. A. 2013, ApJ, 778, 139
- Török et al. (2004) Török, T., Kliem, B., & Titov, V. S. 2004, A&A, 413, L27
- Tripathi et al. (2006) Tripathi, D., Isobe, H., & Mason, H. E. 2006, A&A, 453, 1111
- van Ballegooijen & Martens (1989) van Ballegooijen, A. A., & Martens, P. C. H. 1989, ApJ, 343, 971
- Vemareddy & Wiegelmann (2014) Vemareddy, P., & Wiegelmann, T. 2014, ApJ, 792, 40
- Wang & Liu (2012) Wang, H., & Liu, C. 2012, ApJ, 760, 101
- Wheatland et al. (2000) Wheatland, M. S., Sturrock, P. A., & Roumeliotis, G. 2000, ApJ, 540, 1150
- Wiegelmann (2004) Wiegelmann, T. 2004, Sol. Phys., 219, 87
- Wiegelmann & Inhester (2010) Wiegelmann, T., & Inhester, B. 2010, A&A, 516, A107
- Wiegelmann et al. (2006) Wiegelmann, T., Inhester, B., & Sakurai, T. 2006, Sol. Phys., 233, 215
- Wiegelmann et al. (2012) Wiegelmann, T., Thalmann, J. K., Inhester, B., Tadesse, T., Sun, X., & Hoeksema, J. T. 2012, Sol. Phys., 281, 37
- Zhang et al. (2015) Zhang, Q. M., Ning, Z. J., Guo, Y., Zhou, T. H., Cheng, X., Ji, H. S., Feng, L., & Wiegelmann, T. 2015, ApJ, 805, 4
- Zhu & Alexander (2014) Zhu, C., & Alexander, D. 2014, Sol. Phys., 289, 279