A GeV source in the direction of supernova remnant CTB 37B
Abstract
Supernova remnants (SNRs) are the most attractive candidates for the acceleration sites of Galactic cosmic rays. We report the detection of GeV -ray emission with the Pass 8 events recorded by Fermi Large Area Telescope (Fermi-LAT) in the vicinity of the shell type SNR CTB 37B that is likely associated with the TeV ray source HESS J1713-381. The photon spectrum of CTB 37B is consistent with a power-law with an index of in the energy range of GeV, and the measured flux connects smoothly with that of HESS J1713-381 at a few hundred GeV. No significant spatial extension and time variation are detected. The multi-wavelength data can be well fitted with either a leptonic model or a hadronic one. However, parameters of both models suggest more efficient particle acceleration than typical SNRs. Meanwhile, the X-ray and -ray spectral properties of CTB 37B show that it is an interesting source bridging young SNRs dominated by non-thermal emission and old SNRs interacting with molecular clouds.
Subject headings:
ISM: supernova remnants—Gamma rays: general—Radiation mechanisms: non-thermal1. Introduction
Among various suggested scenarios, the leading sources of Galactic cosmic rays (CRs) below the spectral knee are believed to be supernova remnants (SNRs; see Hillas, 2005, for a review). The original idea of supernova as the source of CRs is motivated by the fact that a reasonable fraction of the kinetic energy of the supernova ejecta is comparable to that needed to sustain the Galactic CRs (Baade & Zwicky, 1934). The SNR scenario for the origin of CRs, however, was widely accepted only after the development of the shock acceleration theory of particles in 1970s’ (Drury, 1983; Hillas, 1984; Bell, 1978a, b). Direct observational evidence was absent for a long time, until in recent years several important discoveries were made due to the quick development of the -ray detection (e.g., Aharonian et al., 2006a, 2008). Fermi-LAT collaboration reported the detection of the characteristic “ bump” from sub-GeV -rays of SNRs IC443 and W44, which has been considered as the most direct evidence for the presence of relativistic nuclei acceleration in SNRs (Ackermann et al., 2013)111The hard sub-GeV spectrum of W44 measured by AGILE was also interpreted due to -decay origin (Giuliani et al., 2011).. Neutral pions produced in proton-proton (more generally nuclei-nuclei) collisions can decay and give rise to a -ray spectrum characterized by a peak at the energy of MeV, where is the rest mass of the neutral pion (Dermer, 1986).
However, these are relatively older SNRs interacting with molecular clouds. Younger remnants should accelerate particles more efficiently with stronger shocks. A number of relative younger SNRs have been identified in GeV and/or TeV band, such as Cassiopeia A (Abdo et al., 2010; Albert et al., 2007; Acciari et al., 2010), RX J1713-3946 (Abdo et al., 2011; Aharonian et al., 2007a), RX J0852-4622 (Tanaka et al., 2011; Aharonian et al., 2007b), RCW86 (Yuan et al., 2014; Aharonian et al., 2009), Tycho (Giordano et al., 2012; Acciari et al., 2011), HESS J1731-347 (Yang et al., 2014; Abramowski et al., 2011), SN 1006 (Acero et al., 2010; Araya & Frutos, 2012). The shocks in these young SNRs are still strong and can accelerate particles to higher energies efficiently which makes young SNRs the preferred targets for studying the acceleration of high energy CRs. CTB 37B is a relatively young (age yr) shell-type SNR located at the direction of and a large distance of 13.2 kpc (Tian & Leahy, 2012). The field of CTB 37B is one of the most active regions in the Galaxy. Radio observations reveal that this region is rich in star-burst activities, such as shell-like structures which are probably associated with recent SNRs (Kassim, 1991), and OH masers (Frail et al., 1996). Tian & Leahy (2012) pointed out that CTB 37B is outside of the CO survey and no molecular cloud has been detected in the region of CTB 37B. The X-ray emission of CTB 37B was first detected by Ohashi et al. (1996), and then by Aharonian et al. (2008) and Nakamura et al. (2009). With the Chandra observation, Aharonian et al. (2008) identified a point source CXOU J171405.7-381031 in the radio shell of CTB 37B, which has been identified as a new magnetar (Sato et al., 2010; Halpern & Gotthelf, 2010). In the region coincident with the radio shell, the X-ray emission is found to be thermal (Aharonian et al., 2008). The Suzaku observation revealed non-thermal X-ray emission to the south of the radio shell with very hard spectrum (Nakamura et al., 2009). TeV -ray emission has been detected by the High Energy Stereoscopic System (HESS) (i.e., HESS J1713-381; see Aharonian et al., 2006b, 2008). The spectra and morphologies of both the X-ray and TeV -rays suggest either a multi-zone leptonic model or a hadronic model is responsible for the -ray emission (Aharonian et al., 2008; Nakamura et al., 2009).
The GeV -ray emission is expected to provide a more complete view of the multi-wavelength characteristics of the source. Enlarging the sample of -ray SNRs is very important for understanding the CR acceleration and interaction in SNRs. A large sample of SNRs enables one to study the radiation mechanism, especially its relation with the SNR evolution and the ambient environment in a statistical way (Yuan et al., 2012; Dermer & Powale, 2013). Yuan et al. (2012) found an interesting correlation between the -ray spectra of SNRs and the environmental gas density: The denser the environment is, the softer the -ray spectrum is. It is then suggested that the inverse Compton scattering (ICS) of high energy electrons is the dominant process for those SNRs located in density cavities and the resulting spectra are generally hard. On the other hand, the decay emission is responsible for the -ray emission of interacting systems between SNRs and molecular clouds, resulting in softer spectra.
In this work, we report the analysis of the GeV -ray emission from the direction of CTB 37B, with Fermi Large Area Telescope (Fermi-LAT) Pass 8 data. In Section 2, the data analysis and results are presented, including the spatial, spectral and timing analyses. The discussion about the origin of the non-thermal radiation based on multi-wavelength spectral energy distribution (SED) is given in Section 3. We conclude our work in Section 4.
2. Data analysis
2.1. Data reduction
In this analysis, the latest Pass 8 version of the Fermi-LAT data were used222http://fermi.gsfc.nasa.gov/ssc/data. The data were collected from October 27, 2008 (Mission Elapsed Time 246823875) to June 18, 2015 (Mission Elapsed Time 456279605). The energies of events are cut between 500 MeV and 500 GeV to avoid the too large point spread function (PSF) in lower energy band. We select the “source” event class (evclass=128 & evtype=3). The maximum zenith angle is adopted to be to minimize the contamination from the Earth limb. We apply a set of quality cuts recommended by the LAT team, with (DATA_QUAL0) && (LAT_CONFIG==1). The analysis is performed in a rectangle region of interest (ROI) centered at the position of CTB 37B (R.A., Dec.; Green, 2014). The standard LAT analysis software, ScienceTools version v10r0p5333http://fermi.gsfc.nasa.gov/ssc/data/analysis/software/, available from the Fermi Science Support Center, and the instrumental response function (IRF) “P8R2_SOURCE_V6” are adopted. We use the binned likelihood analysis method with gtlike to fit the data. The Galactic and isotropic diffuse background models used are gll_iem_v06.fits and iso_P8R2_SOURCE_V6_v06.txt444http://fermi.gsfc.nasa.gov/ssc/data/access/lat/BackgroundModels.html. The point sources in the third Fermi catalog (3FGL; Acero et al., 2015) are included in the model, generated with the user-contributed software make3FGLxml.py555http://fermi.gsfc.nasa.gov/ssc/data/analysis/user/.
2.2. Source detection
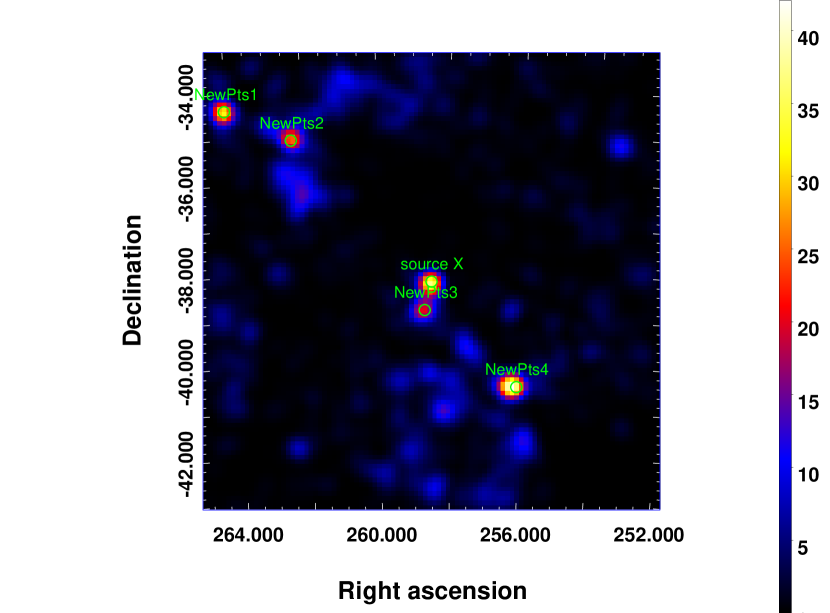
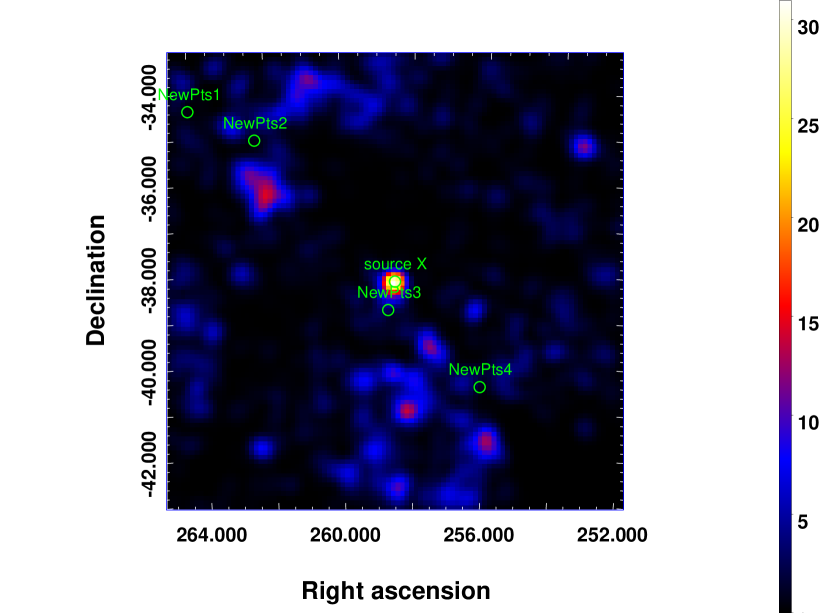
During the likelihood fittings, the normalizations and spectral parameters of the sources within around CTB 37B, together with the normalizations of the two diffuse backgrounds, are left free. Firstly, we performed the fitting with the 3FGL sources and the diffuse backgrounds. A Test Statistic (TS) map for photons above 3 GeV is created with gttsmap, as shown in the left panel of Fig. 1. The TS map shows that there are extra sources beyond the 3FGL catalog. We mark five bright new sources with green circles in this plot. Especially, we find that at the position of CTB 37B, there is an evident excess with peak TS value of , which is marked as source X. Then we add these sources in the model, assuming power-law spectra and the approximate locations read from the TS map, and fit the data again. The precise positions are obtained using gtfindsrc command. The TS map with the additional four sources (excluding source X) included in the model can be seen in the right panel of Fig. 1, which looks much smoother. The fitting positions and TS values of these new sources are listed in Table 1.
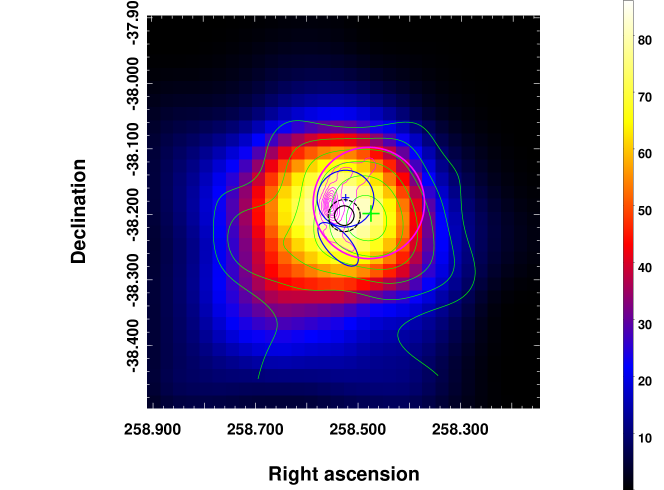
We focus on source X in the following analysis. The TS value of source X is found to be 102.6, which corresponds to a significance of for 4 degrees of freedom (dof). Using gtfindsrc tool, we find the best-fitting position of source X is R.A., Dec. with uncertainty of . To better see the spatial relation of source X and SNR CTB 37B in other wavelengths, we show a zoom-in of the TS map for a region of centered on source X in Fig. 2. The radio contours at 843 MHz from the Sydney University Molonglo Sky Survey (SUMSS; Mauch et al., 2003), and the TeV -ray contours from HESS J1713-381 (Aharonian et al., 2008) are overplotted. The position of the X-ray point source CXOU J171405.7-381031 (R.A., Dec.; Aharonian et al., 2008), which was identified as a magnetar (Nakamura et al., 2009), is marked by a blue plus. The blue circle and ellipse show the regions 1 and 2 of Nakamura et al. (2009), which show thermal and non-thermal diffuse emissions, respectively. As can be seen, the position of source X is in good coincidence with the radio and TeV -ray images of CTB 37B. CXOU J171405.7-381031 is located slightly to the north of the best-fitting position of source X (outside the error circles). As discussed in Aharonian et al. (2008), the absence of associated extended non-thermal emission around CXOU J171405.7-381031 argues strongly against the pulsar wind nebula (PWN) origin of the TeV -ray emission. If source X is associated with CXOU J171405.7-381031, its -ray emission (from the pulsar) should be point-like, and then one may have difficulty to explain the displacement of their positions. Therefore source X is more likely the counterpart of SNR CTB 37B.
| Name | R.A. [deg] | Dec. [deg] | TS |
|---|---|---|---|
| source X | |||
| NewPts1 | |||
| NewPts2 | |||
| NewPts3 | |||
| NewPts4 |
2.3. Spatial extension
The radio diameter of CTB 37B is about , as shown by the magenta circle in Fig. 2. Such a size may be too small to be resolved with Fermi-LAT. As a test, we use the SUMSS radio image, the HESS TeV -ray image, as well as uniform disks centered at the best-fitting position with different radii as spatial templates and re-do the fittings. The TS values for the SUMSS radio and HESS TeV -ray templates are 102.4 and 97.5, respectively. For uniform disks with different radii, the TS values range between 100 and 105 and the upper limit of the GeV emission radius corresponding to confidence level is given as . The extended spatial templates do not improve the significance of CTB 37B significantly. In the following SED analysis, we will keep the point source assumption.
2.4. Spectral analysis
The power-law index of source X is found to be in the energy range of GeV and the integral photon flux is photon cm-2 s-1. The -ray luminosity between 500 MeV and 500 GeV is erg s-1, where a distance kpc (Tian & Leahy, 2012) is adopted.
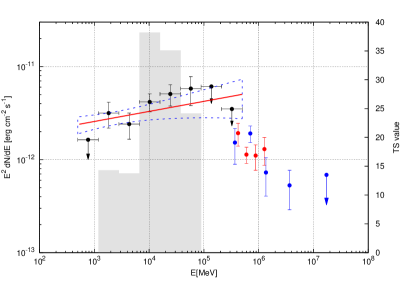
To derive the SED of source X at different energies, we bin the data with 8 equal logarithmic energy bins between 500 MeV and 500 GeV, and perform the same likelihood fitting analysis to the data. The flux normalizations of all the sources within of source X are left free, while the spectral indices are fixed. For source X, both the normalization and spectral index are left free. The remaining free parameters include the normalizations of the two diffuse backgrounds. The fitting results are shown in Fig. 3. Note that for the energy bins with TS value of sources X smaller than 5, we give the upper limits at confidence level, shown by the black arrows in Fig. 3. We find that the Fermi-LAT data connect with the TeV -ray SED of HESS J1713-381 smoothly at a few hundred GeV suggesting that source X is the GeV counterpart of SNR CTB 37B.
2.5. Timing analysis

The emission from SNR is expected to be stable at the time scale of years. As a check, we perform the time analysis of source X. The near 7 years’ data are binned into 14 time bins equally. The fitting method is the same as the SED analysis. The results are shown in Fig. 4. The arrows indicate the 95% upper limits of those time bins, whose TS values are smaller than 5. No obvious long term variation is found, which is consistence with the emission expected from an SNR.
3. Discussion
The spatial and spectral association between source X and the HESS observation of SNR CTB 37B suggests source X being the GeV counterpart of this SNR. The -ray emission can be either from the ICS of high energy electrons or the decay due to the inelastic collisions. Due to the lack of non-thermal X-ray emission in the same region of the TeV -ray emission, Aharonian et al. (2008) argued that the TeV -rays may have a hadronic origin. The Suzaku observations reveal, however, both thermal and non-thermal diffuse X-ray emissions from the western part of the radio shell, which suggests alternatively a multi-zone leptonic scenario for the -ray emission (Nakamura et al., 2009). We discuss both the leptonic and hadronic models in light of the multi-wavelength data, including the Fermi-LAT ones.
In the modeling, both the spectra of electrons and protons are assumed to be power-laws with exponential cutoffs, , where or , and are the spectral index and the cutoff energy, respectively. The distance of CTB 37B is adopted to be 13.2 kpc (Tian & Leahy, 2012), and the radius is taken to be pc which corresponds to an angular size of at such a distance. The radiation field includes the cosmic microwave background (CMB), an infrared field with K and energy density eV cm-3, and an optical field with K and eV cm-3 (Porter et al., 2006). The gas density is adopted to be hydrogen cm-3, as inferred from the X-ray observations (Aharonian et al., 2008; Nakamura et al., 2009).
For the region which is coincident with the SNR shell (region 1), no non-thermal emission has been detected (Aharonian et al., 2008; Nakamura et al., 2009). The keV flux of the thermal emission is erg cm-2 s-1 (Aharonian et al., 2008). The keV unabsorbed flux of the thermal X-ray emission from region 1 is estimated to be erg cm-2 s-1, based on the non-equilibrium ionization model employed in Aharonian et al. (2008). This thermal flux is adopted as an upper limit of the non-thermal emission from the SNR.
3.1. Leptonic model
| Model | ||||||||
|---|---|---|---|---|---|---|---|---|
| (TeV) | (TeV) | ( erg) | ( erg) | (G) | (cm-3) | |||
| leptonic | ||||||||
| hadronic |
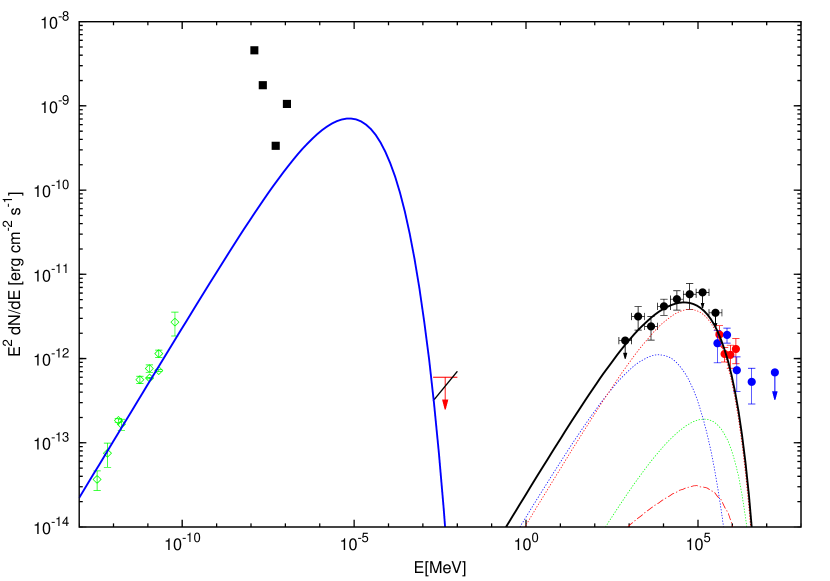
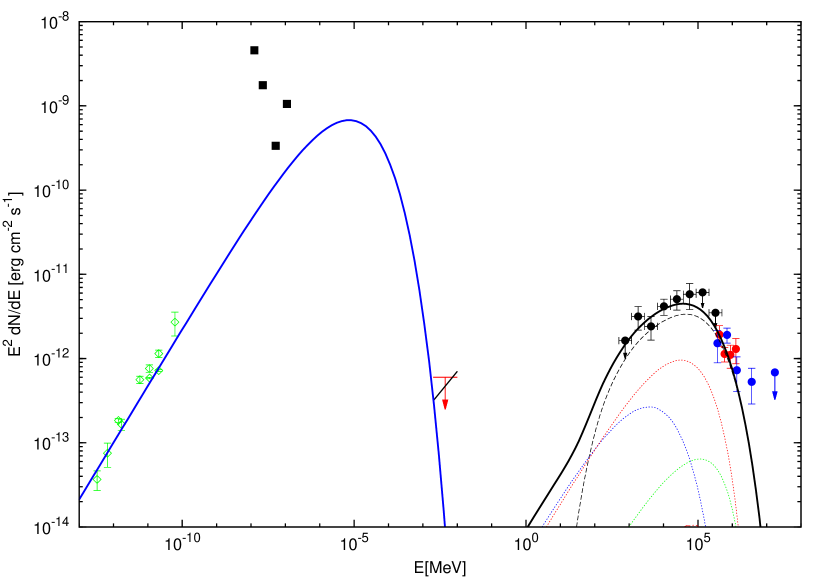
In the leptonic model, the radio to X-ray emission is due to synchrotron radiation of relativistic electrons in the magnetic field, and the -ray emission is produced through ICS in the background radiation field and bremsstrahlung in the interstellar medium. To fit the radio to TeV -ray data, we find , , a magnetic field G, and a total electron energy above 1 GeV . The fitting SED is shown in the left panel of Fig. 5. The model parameters are compiled in Table 2.
We may compare the model parameters with those from several other young SNRs which are primarily thought to be leptonic sources, such as RX J1713-3946 (Abdo et al., 2011; Yuan et al., 2011), RX J0852-4622 (Tanaka et al., 2011), RCW86 (Yuan et al., 2014), HESS J1731-347 (Yang et al., 2014), and SN 1006 (Acero et al., 2010; Araya & Frutos, 2012). The cutoff energies of electrons for these sources are typically of several tens TeV, significantly higher than the value of TeV for CTB 37B. This could be partially due to that the magnetic field is relatively higher for this source. For G, electrons with energies higher than TeV will cool down if they are accelerated in the early stage of the SNR whose age was estimated to be a few thousand years (Aharonian et al., 2008). This age estimation was also supported by the magnetar characteristic age ( yrs; Sato et al., 2010). The total energy of electrons is also higher than that of other SNRs, which are of the order of erg (Yang et al., 2014). Note that this energy estimate should suffer from the uncertainty of the distance estimate.
We note that the X-ray emission of CTB 37B is dominated by a thermal component and the weak non-thermal component has a very hard spectrum. These characteristics are distinct from that of the other young SNRs whose X-ray emission has a prominent non-thermal soft component produced by TeV electrons via the synchrotron process (Takahashi et al., 2008; Slane et al., 2000; Bamba et al., 2012). The SNR RCW 86 is more similar to CTB 37B than the others in the sense that it also has a prominent thermal X-ray component (Bamba et al., 2000; Borkowski et al., 2001). While the model parameters of CTB 37B are also extreme compared with that of leptonic model for RCW 86 (Yuan et al., 2014).
3.2. Hadronic model
The right panel of Fig. 5 shows the results of the hadronic model fitting. The model parameters are given in Table 2. The proton spectral index is found to be about , and the cutoff energy is about 3 TeV. The magentic field is even stronger to suppress the ICS contribution from the electrons. While the spectral index does not differ much from the expectation of diffusive shock acceleration, the maximum energy seems to be too low for typical SNR shocks (Gaisser, 1990). The total energy of relativistic protons above 1 GeV is . For typical kinetic energy released by a core-collapse supernova, erg, such an energy of the CR particles seems to be too high. One possibility is that the progenitor of CTB 37B is an extremely massive star which results in a hypernova explosion with a much higher energy realease than typical supernova.
On the other hand, it is possible that there are some high-density shocked clouds which do not emit thermal X-rays owing to the low-temperature in the post-shock region (Inoue et al., 2012). The actual density of gas interacting with CRs could be much higher than that inferred from the thermal X-ray emission. Assume a density of cm-3, the required energy of protons reduces to be .
The synchrotron power spectrum peaks near keV. To produce X-ray emission by sub-TeV electrons via the synchrotron process, the magnetic field strength should exceed 0.1Gauss which is too high to account for the non-thermal diffusive X-ray emission in region 2. We therefore suggest that this diffusive non-thermal component is likely associated with a different energetic electron population with energy in the TeV range.
4. Conclusion
In this work we analyze the years -ray data from Fermi-LAT in the field of SNR CTB 37B. A point-like source with a significance of has been detected, with position coincident with the radio and TeV -ray images of CTB 37B. The spectral index in GeV range is found to be , and the SED matches well with the HESS observations at a few hundred GeV energies. We do not find significant spatial extension and variability of the source, which are also consistent with the expectation from CTB 37B. This GeV source is suggested to be the GeV counterpart of SNR CTB 37B.
The multi-wavelength data can be well fitted by a leptonic or a hadronic model. However, the model parameters of both scenarios seem to be extreme compared with other similar SNRs. The estimated total energies of relativistic particles are too high for both scenarios, which might be due to an over-estimate of the distance of the source. The cutoff energy is found to be TeV, which is much lower than that in other young SNRs mentioned in the previous section.
While the -ray spectrum of CTB 37B is softer than the other young SNRs, its GeV spectrum is harder than that of older SNRs, such as IC443 and W44. Only thermal X-ray emission has been detected from older SNRs (Yamaguchi et al., 2009; Uchida et al., 2012). The X-ray and -ray spectral properties suggest that it is an interesting source bridging young SNRs dominated by non-thermal emission and old SNRs interacting with molecular clouds.
Acknowledgments
This work was supported in part by 973 Programme of China under grants 2013CB837000 and 2014CB845800, National Natural Science of China under grants 11361140349, 11273063, 11433009, 11173064, 11233001 and 11233008, the Foundation for Distinguished Young Scholars of Jiangsu Province, China (No. BK2012047) and the Strategic Priority Research Program (Grant No. XDB09000000).
References
- Abdo et al. (2010) Abdo, A. A., Ackermann, M., Ajello, M., et al. 2010, ApJ, 710, 92
- Abdo et al. (2011) Abdo, A. A., Ackermann, M., Ajello, M., et al. 2011, ApJ, 734, 28
- Abramowski et al. (2011) Abramowski, A., Acero, F., Aharonian, F., et al. (HESS Collaboration) 2011, A&A, 531, 81
- Acciari et al. (2010) Acciari, V. A., Aliu, E., Arlen, T., et al. (VERITAS Collaboration) 2010, ApJ, 714, 163
- Acciari et al. (2011) Acciari, V. A., Aliu, E., Arlen, T., et al. (VERITAS Collaboration) 2011, ApJ, 730, L20
- Acero et al. (2010) Acero, F., Aharonian, F., Akhperjanian, A. G., et al. 2010, A&A, 516, A62
- Acero et al. (2015) Acero, F., Ackermann, M., Ajello, M., et al. 2015, ApJ, 218, 23
- Ackermann et al. (2013) Ackermann, M., Ajello, M., Allafort, A., et al. 2013, Sci., 339, 807
- Aharonian et al. (2006a) Aharonian, F., Akhperjanian, A. G., Bazer-Bachi, A. R., et al. (HESS Collaboration) 2006a, A&A, 457, 899
- Aharonian et al. (2006b) Aharonian, F., Akhperjanian, A. G., Bazer-Bachi, A. R., et al. (HESS Collaboration) 2006b, ApJ, 636, 777
- Aharonian et al. (2007a) Aharonian, F., Akhperjanian, A. G., Bazer-Bachi, A. R., et al. (HESS Collaboration) 2007a, A&A, 464, 235
- Aharonian et al. (2007b) Aharonian, F., Akhperjanian, A. G., Bazer-Bachi, A. R., et al. (HESS Collaboration) 2007b, ApJ, 661, 236
- Aharonian et al. (2008) Aharonian, F., Akhperjanian, A. G., de Alemida, U. B., et al. (HESS Collaboration) 2008, A&A, 486, 829
- Aharonian et al. (2009) Aharonian, F., Akhperjanian, A. G., de Alemida, U. B., et al. (HESS Collaboration) 2009, ApJ, 692, 1500
- Albert et al. (2007) Albert, J., Aliu, E., Anderhub, H., et al. (MAGIC Collaboration) 2007, A&A, 474, 937
- Araya & Frutos (2012) Araya, M. & Frutos, F., 2012, MNRAS, 425, 2810
- Baade & Zwicky (1934) Baade, W., & Zwicky, F. 1934, Proceedings of the National Academy of Science, 20, 259
- Bamba et al. (2000) Bamba, A., Koyama, K., & Tomida, H. 2000, PASJ, 52, 1157
- Bamba et al. (2012) Bamba, A., Puhlhofer, G., Acero, F., et al., 2012, ApJ, 756, 149
- Bell (1978a) Bell, A. R. 1978a, MNRAS, 182, 443
- Bell (1978b) Bell, A. R. 1978b, MNRAS, 182, 147
- Borkowski et al. (2001) Borkowski, K. J., Rho, J., Reynolds, S. P., & Dyer, K. K. 2001, ApJ, 550, 334
- Dermer (1986) Dermer, C. D. 1986, A&A, 157, 223
- Dermer & Powale (2013) Dermer, C. D., & Powale, G. 2013, A&A, 553, A34
- Drury (1983) Drury, L. O’C., 1983, Rep. Prog. Phys., 46, 973
- Frail et al. (1996) Frail, D. A., Goss,W. M., Reynoso, E. M., Giacani, E. B., Green, A. J., & Otrupcek, R. 1996, AJ, 111, 1651
- Gaisser (1990) Gaisser, T. K. 1990, Cosmic Rays and Particle Physics (Cambridge: Cambridge Univ. Press)
- Giordano et al. (2012) Giordano, F., Naumann-Godo, M., Ballet, J., et al. 2012, ApJ, 744, 2
- Giuliani et al. (2011) Giuliani, A., Cardillo, M., Tavani, M., et al. 2011, ApJL, 742, L30
- Green (2014) Green, D. A., 2014, Bulletin of the Astronomical Society of India, 42, 47
- Halpern & Gotthelf (2010) Halpern, J. P., & Gotthelf, E. V. 2010, ApJ, 725, 1384
- Hillas (1984) Hillas A. M., 1984, ARA&A, 22, 425
- Hillas (2005) Hillas A. M., 2005, J. Phys. G: Nucl. Part. Phys., 31, R95
- Inoue et al. (2012) Inoue, T., Yamazaki, R., Inutsuka, S.-i., & Fukui, Y. 2012, ApJ, 744, 71
- Kassim (1991) Kassim, N. E., Baum, S. A., & Weiler, K. W. 1991, ApJ, 374, 212
- Mauch et al. (2003) Mauch, T., Murphy, T., Buttery, H. J., et al. 2003, MNRAS, 342, 1117
- Nakamura et al. (2009) Nakamura, R., Bamba, A., Ishida, M., et al. 2009, PASJ, 61, S197
- Ohashi (1996) Ohashi, T., Ebisawa, K., Fukazawa, Y., et al. 1996, PASJ, 48, 157
- Porter et al. (2006) Porter, T. A., Moskalenko, I. V., & Strong, A. W. 2006, ApJ, 648, L29
- Sato et al. (2010) Sato, T., Bamba, A., Nakamura, R., & Ishida, M., 2010, PASJ, 62, L33
- Slane et al. (2000) Slane, P., Hughes, J. P., Edgar, R. J., et al. 2001, ApJ, 548, 814
- Takahashi et al. (2008) Takahashi, T., Tanaka, T., Uchiyama, Y., et al. 2008, PASJ, 60, S131
- Tanaka et al. (2011) Tanaka, T., Allafort, A., Ballet, J., et al. 2011, ApJL, 740, L51
- Tian & Leahy (2012) Tian, W. W., & Leahy, D. A. 2012, MNRAS, 421, 2593
- Uchida et al. (2012) Uchida, H., Koyama, K., Yamaguchi, H., et al. 2012, PASJ, 64, 141
- Yamaguchi et al. (2009) Yamaguchi, H., Ozawa, M., Koyama, K., et al. 2009, ApJL, 705, L6
- Yang et al. (2014) Yang, R.-z., Zhang, X., Yuan, Q., & Liu, S. 2014, A&A, 567, A23
- Yuan et al. (2011) Yuan, Q., Liu, S., Fan, Z., Bi, X. & Fryer, C. 2011, ApJ, 735, 120
- Yuan et al. (2012) Yuan, Q., Liu, S., & Bi, X. 2012, ApJ, 761, 133
- Yuan et al. (2014) Yuan, Q., Huang, X., Liu, S. & Zhang, B. 2014, ApJ, 785, L22