Clock and inter-combination line frequency separation in 171Yb
L. Nenadović and J.J. McFerran∗
School of Physics, University of Western Australia, 6009 Crawley, Australia
∗Corresponding author: john.mcferran@uwa.edu.au
Abstract
We have carried out concurrent optical frequency measurements of the () and transitions in 171Yb, and in so doing have determined the frequency separation between the () and () levels with an uncertainty in the ppb range. The knowledge of this frequency interval will aid experiments relying on the line in 171Yb and 173Yb without access to highly accurate frequency standards.
OCIS codes: 120.3940, 300.6550, 140.3515, 140.3320, 300.6260
PACS numbers: 42.62.Eh; 42.62.Fi; 32.30.Jc
1 Introduction
Neutral ytterbium is used heavily in cold and ultra-cold atomic and molecular investigations [1, 2, 3]. Increasingly the spin-and-dipole forbidden transition [] in the composite fermionic Yb isotopes is being exploited; from applications in atomic clocks [4, 5, 6, 7, 8, 9, 10], to explorations in quantum many body interactions [11, 12, 13, 14, 15]. Optical lattice clocks based on ytterbium are becoming more common as their performance continues to improve, whether it be accuracy [5, 6, 7, 8], stability [4, 8], or reproducibility [5, 6, 7, 8]. However, before an atomic clock can become a versatile frequency reference, it is helpful if the transition can be easily instituted without relying upon substantial infrastructure, such as Cs primary frequency standards or hydrogen masers. Since the ensemble of Yb isotopic lines provides a relatively easy means of access, a comparison between the and the lines of 171Yb affords a convenient means of compressing the search space when exploring for the clock transition. Here we report on the frequency difference between the and transitions in 171Yb with a uncertainty below a part in . Our measurements will also assist those searching for the line(s) in 173Yb, given the previously reported value for its transition frequency [16]. Furthermore, the absolute optical frequencies of the other isotopic lines can be inferred from previously reported measurements [17, 18, 19].
The line in fermonic Yb is finding a purpose in many applications. Apart from clocks, it is being used to explore quantum many body interactions [11, 12, 13, 14, 15], and has been proposed for use in quantum simulation studies [20, 21, 22] and gravitational inverse-square-law tests at micron scales [23]. The natural line-width of the clock () transition is extremely narrow, approximately 8 mHz. The line-width can of course be intensity broadened by the probe light, though, this is more easily carried out through the use of ground state broadening; for example, by coupling light to the or transitions. This method can produce line-widths of a few MHz, but fractionally this is still only a few ppb. Hence, finding the spectroscopic line without access to an accurate frequency reference can pose a challenge. The above experiments using Yb can be greatly simplified if the expensive and/or intricate frequency standard becomes inessential. With the or frequencies reported here, a wave-meter with sufficiently high resolution (and level accuracy) should be the only frequency measuring device needed to find the lines in 171Yb or 173Yb. There are two hyperfine levels in the state of 171Yb with and . Our measurements focus on the transition, which is commonly used for laser cooling. Henceforth, denoted with . Based on an absolute frequency measurement of the transition in 176Yb and the relevant isotopic shift [19], a previous estimate for the transition frequency is MHz. We find the frequency to be offset from this by nearly four standard deviations.
In our experiment, the clock transition interaction is carried out with 171Yb atoms held in a magneto-optical trap, while the transition is addressed via saturation absorption spectroscopy on a thermal beam. In the following we present details about (i) the optical cavity used to stabilise the laser light that is needed to probe the clock transition, (ii) the spectroscopic methods for producing the and lines, (iii) the frequency measurement scheme, (iv) and a discussion of results including systematic frequency shifts.
2 Experimental setup
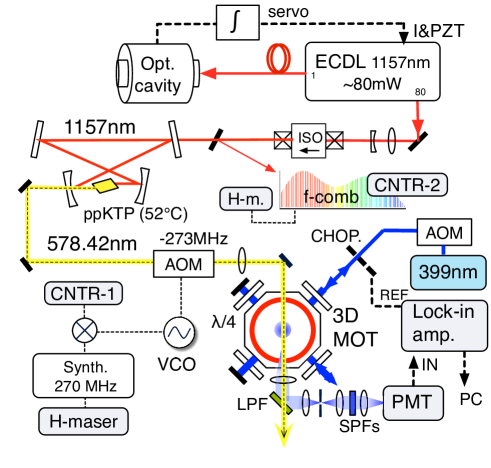
Ytterbium atoms are maintained in a 3D magneto-optical trap fed with a zero--field crossing Zeeman slower [24]. Laser light at 398.9 nm, for the MOT and Zeeman slower, is generated via resonant frequency doubling of 797.8 nm light sourced from a Ti:sapphire laser. The approximate wavelengths of the and transitions are 555.8 nm and 578.4 nm, respectively. Separate laser schemes have been put in place to address the two transitions; both make use of near-infrared lasers that are resonantly frequency doubled. The principal components and layout for the clock transition interaction and measurement are shown in Fig. 1. To probe the we commence with a semiconductor laser in an extended cavity at 1157 nm (Time-Base GmbH) and resonantly frequency double the light with a periodically poled potassium titanyl phosphate (PPKTP) crystal as the nonlinear element. The poling period of the crystal is 11.6 m and its temperature is maintained at 51.8 ∘C. We use the same set of optics for the resonant cavity as those used for the 1112 nm frequency doubling [25]. The mode-matching of the 1157 nm light into the cavity has been partly optimised; sufficient to generate 3 mW of 578.4 nm light with 17 mW of IR light incident. To avoid modulation of the 578.4 nm light, but still maintain laser locking to the centre of a frequency doubling cavity resonance, we employ the Hänsch-Couillaud frequency stabilisation scheme [26].
2.A Optical cavity and frequency comb
To stabilise the frequency of the 1157 nm light we use an optical cavity with a spacer composed of ultra-low expansion (ULE) glass and fused silica mirror substrates (Stable Lasers Systems and Advanced Thin Films). The finesse at 1157 nm is , based upon an average of cavity ring-down measurements. One mirror is planar and the second has a radius of curvature of 500 mm, the former we use as the input coupler. The spacer is cylindrical, where both the length and diameter of the spacer are 100 mm in dimension. Two notches, cut either side, run the length of the cylinder, providing a support plane 3.6 mm below the mid plane. Four symmetrically arranged Viton pads separate the ULE spacer from a Zerodur base. The Zerodur mounted optical cavity is enclosed by a gold-coated aluminium shield and placed inside a vacuum enclosure. Surrounding the vacuum housing are two nickel coated aluminium shells, 9 mm thick, with space for thermal insulation between each. The vacuum chamber is actively temperature stabilised, while the outer shells provide passive stabilisation (there is also the option to stabilise the inner aluminium shell, but this is not used at present). The complete ensemble is placed on an active vibration platform and inside an acoustic-damping enclosure. The thermal time constant between the temperature control stage and the optical cavity is 20 hours, and that between the outer shell and thermal control stage is 16 hours. The pressure in the vacuum chamber is maintained at mbar.
We employ the Pound-Drever-Hall scheme to stabilise the 1157 nm laser to the optical cavity. For phase modulation we use a resonant electro-optic modulator driven at 20 MHz with a modulation depth of 5-10 %. Approximately 110 W of light is sent to the cavity with 75-80 % coupled into the lowest order Gaussian-spherical mode. The correction signal is fed back to current modulation on the 1157 nm ECDL, and is integrated, producing slower feed-back to a piezo transducer controlling the length of the laser cavity. The servo bandwidth on the current modulation is 320 kHz [27].
The optical cavity’s frequency dependence on temperature has been examined by comparing the frequency of the cavity-stabilised 1157 nm laser against a hydrogen-maser, via a frequency comb. To generate the frequency comb light at 1157 nm (and 1112 nm), we amplified the output of a MenloSystems 1.55 m fibre oscillator with an Er-doped fibre amplifier, before coupling into 90 cm of highly non-linear fibre (OFS Fitel). One metre of Er single mode fibre is used in the amplifier, which has 30 dB m-1 absorption at 1530 nm, and the nonlinear coefficient of the highly nonlinear fibre (HNLF) is 11.5 W-1 km-1 with a dispersion parameter, , of +3 ps nm-1 km-1 [28]. Dispersion management with dispersion compensated fibre and single mode fibre (SMF28) is used between the Er-doped fibre amplifier and the HNLF. Direct splicing between the SMF28 and the HNLF produced a loss of 0.6 dB.
The mode-spacing of the frequency comb is stabilised with a dielectric resonant oscillator, which is phase referenced to a hydrogen-maser (Kvarz CH1-75A). Heterodyning the 1157 nm light and an adjacent comb element on a photodiode provides an RF beat signal for frequency counting. This beat frequency is measured for different cavity temperatures once equilibrium is reached (i.e. after at least 3 days), and to assess the temperature, recordings are taken from points on the vacuum enclosure. We have determined the temperature at which the coefficient of thermal expansion is zero () to be ∘C, and the second order thermal expansion coefficient is K-2. Having the cavity temperature set to within 0.9 ∘C of should be sufficient to have the frequency instability of the locked laser limited by the thermo-elastic noise of the fused silica mirror substrates [29, 30]. We estimate the temperature variations to be 100 nK at 1 s at the cavity based on temperature measurements of the vacuum can and passive low pass filtering between the shield and the cavity.
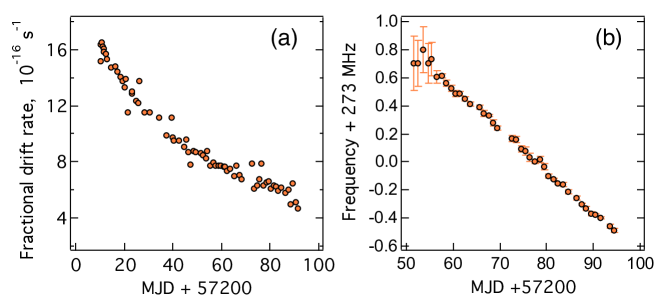
We measure the rate of frequency drift between the H-maser and the optical cavity via the frequency comb by tracking the measured beat frequency from day to day. These measurements are shown in Fig. 2(a). We observe a very slow decline in the drift rate over a monthly time scale, which has now reached 150 mHz s-1 ( s-1). The reason for the monotonic drift is not completely certain. One may posit that it is due to creep in the ULE spacer; however, other optical cavities have shown that this effect is nearly an order of magnitude smaller [31]. The frequency drift of the cavity-stabilised-laser with respect to the line can also be monitored and is discussed below.
2.B Spectroscopy methods
We perform spectroscopy on the transition with the Yb atoms maintained in a magneto-optical trap that uses the line at 398.9 nm. A description of the MOT is found in Refs. [24, 25]. Initially, the search for the clock line was carried out by locking the 1157 nm laser to an adjacent mode of the frequency comb and scanning the mode spacing (i.e. repetition rate of the mode-locked laser that seeds the comb generation). To determine the approximate frequency of the 1157 nm light prior up to the detection of the clock transition we used the H-maser-steered frequency comb. An estimation of the comb element number, (in the IR), was made by stepping the mode spacing by 950 Hz and observing the frequency step in the optical domain. A measurement of the stepped beat note frequency over 30 minutes led to an value of . Repeated measurements over several days reduced the uncertainty to . This approach was necessary, since we were unaware of any 8-digit precision measurements of any of the lines in the Yb isotopes. Alignment between the 578.4 nm probe beam and the atoms was afforded through the use of a tracer beam tuned to the transition (the tracer beam produced depletion of atoms from the MOT, signalling overlap). Detection of the ground-state atoms is made by collecting 398.9 nm fluorescence that is spatially filtered to minimise scattered light from the MOT beams. Within the imaging scheme there is one long-wavelength pass filter below the chamber and two short-wavelength pass filters before a photo-multiplier cell (PMC). The cut-off wavelengths in each case are 505 nm (this gives access to the 555.8 nm and 578.4 nm beams after they pass through the chamber).
After the first detection of the line a change in the method for tuning the 578.4 nm light frequency was made, where instead of locking the 1157 nm laser to the comb, it was locked directly to the optical cavity. The comb enabled a broad frequency tuning range, but poses a limit on spectral resolution set by the multiplied noise of the dielectric resonant oscillator. For frequency tuning, the 578.4 nm light is passed through an acousto-optic modulator (AOM) with an RF drive frequency at 273 MHz, negatively shifted with respect to the optical cavity mode. The drive frequency is heterodyned with a 270 MHz signal, referenced to the H-maser, and the frequency difference counted.
The transition is detected by three different means. The simplest approach uses rapid switching of the 398.9 nm MOT beams by use of an optical chopper wheel, while the 578 nm light remains on continuously. The photomultiplier signal is sent to a locking amplifier (LIA) that uses the chopper frequency as its reference signal, and the demodulated output of the LIA provides the spectroscopic signal. This method leaves the atoms prone to a light shift since the trapping and probe light are on simultaneously for half the time. A second approach uses interleaving of the 398.9 nm and 578.4 nm light using respective AOMs, where the on and off periods are equal and 400 s in duration. By comparing the two methods, the line-centre frequency shifts upward by in the case of modulating the 398.9 nm light only. A third approach has also been used that further quantifies the light shift (described below).
3 Results
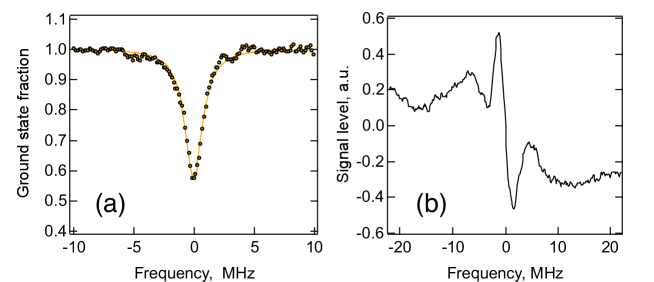
The majority of the clock-line spectroscopy was performed by chopping the 398.9 nm MOT beams at 2.2 kHz, while leaving the 578.4 nm probing acting continuously [32]. The probe excites the atoms to the metastable level, causing a depletion from the ground-state, and hence a reduction in fluorescence reaching the photomultiplier cell. With the modulated MOT beams, the temperature is not as cold as can be achieved with an optimised cyclic sequence. However, for the purposes of measuring the frequency separation, the approach is adequate, since the accuracy is limited by the spectroscopy on the line. The LIA output signal and the AOM frequency are logged simultaneously. An example of the clock-line spectrum is shown in Fig. 3(a), where the level of atom number depletion reaches 40 %. A discussion relating to the line-width appears below.
The drift of the optical cavity frequency can also be determined by tracking the change in the AOM frequency that is used to tune the 578.4 nm light to the transition (the AOM bridges the frequency interval between 2 and the clock transition, where is the frequency of the 1157 nm laser locked to the optical cavity). In one measurement run the 578.4 nm light is swept across the clock transition in both directions multiple times with a total duration of 4 min. A Lorenztian line-shape is fit to the signal versus frequency data, from which the centre frequency is determined. This scheme is repeated at least five times and an ensemble average of the centre frequencies is made for each day’s measurement. The centre frequencies (that of the AOM) are shown in Fig. 2(b). The mean drift rate over the last 20 days is s-1, in close correspondence with the drift rate determined via the comparison with the H-maser. In principle, a difference between these two drift rates should show the residual drift of the H-maser frequency (but we do not yet claim to be sensitive to this).
The 171Yb line was generated through saturation absorption spectroscopy (SAS) [33] on a thermal beam with 50 mrad angular divergence. Approximately 280 W of 555.8 nm light passes through the atomic beam (the same thermal beam that leads to a Zeeman slower and the magneto-optical trap) at right angles, and is retro-reflected with a cat’s eye that uses a lens-mirror combination (focal length =75 mm). The 555.8 nm beam shape is elliptical with the major axis aligned with the flow of the atoms. The corresponding single-beam saturation parameter is (intensity broadening is evident, but the added intensity assists with the SNR). We apply a vertical bias magnetic field to compensate for the Earth’s -field so that the magnetic sub-states of the and levels remain degenerate. The polarisation of the light is linear (and vertical), so that .
Prior to reaching the atoms the light is positively frequency shifted by 110 MHz with an acousto-optic modulator. Frequency modulation spectroscopy is carried out by modulating the AOM-shifted light at 33 kHz, sourced from another lock-in amplifier. A second photomultiplier cell collects the 555.8 nm fluorescence, producing an input signal for the LIA. An example of the discriminator signal produced by the LIA demodulation (first harmonic) is shown in Fig. 3(b). Most of the width (2.9 MHz) is caused by intensity broadening, with a small contribution from transit-time broadening (40 kHz) and the natural line-width (184 kHz [34]). The 555.8 nm laser light is frequency stabilised by using the discriminator as a correction signal and feeding back to the 1112 nm master laser via a piezo transducer with a 1 Hz bandwidth. For line-centre measurements, the third harmonic from the lock-in amplifier is used to minimise the influence of the Doppler background.
To perform the frequency evaluation for the 171Yb line we again create a heterodyne-beat in the near IR, this time mixing 1112 nm single frequency light with a portion of the frequency comb. Approximately 2 mW of cw light is split from the master laser and sent for comb mixing, leaving more than 2 mW available for the slave injection locking (the injection locking remains robust for injected power levels above 100 W). A beat signal-to-noise ratio (SNR) of 20 dB in a resolution bandwidth of 500 kHz is sufficient for frequency counting. A bandpass filter with 10 MHz FWHM and centred at 30 MHz is applied to the beat signal. The comb element number is evaluated by use of a wave-meter with an accuracy of . Frequency counting of the 1112 nm beat signal (with the comb) is carried out while the master laser is locked to the centre of the saturation dip. Measurements have also been carried out by creating an error signal involving the 555.8 nm light and the cold ytterbium atoms. Similar frequency values are found; however, the additional laser cooling of the 555.8 nm light distorts the spectral line creating sizeable frequency shifts [25].
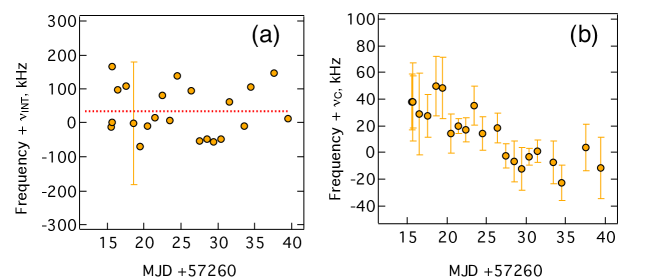
To measure the frequency difference between the and levels we carry out separate measurements of the and transition frequencies and take the difference. The frequency determination is a two part process. (i) The near-IR frequencies of the lasers are determined using the frequency comb equation , where is the number of the comb element accounting for the optical beat signal, is the mode spacing, is the offset frequency and is the beat frequency. The signs of and are easily determined by the usual means. For the measurements of both transitions MHz. (ii) The second part involves the spectroscopy, where the line-centre frequency, , is determined with the use of an AOM (either by locking to the line and frequency counting, or by sweeping across the transition, then averaging and lineshape fitting). Thus the resultant optical frequency is . For the and lines the AOM frequency shift is positive and negative, respectively. The measurements of the and transition frequencies are shown in Fig. 4(a) and Fig. 4(b), respectively. For clarity we have offset the frequencies by kHz in Fig. 4(a) and kHz [5] in Fig. 4(b). Measurements for the clock transition agree with previously reported values to within , and the remaining scatter is mostly attributed to the uncertainties related to the 398.9 nm light shift [35]. These variations are small compared to the uncertainties of the line-centre measurements, so do not impact the frequency measurements greatly. The error bars on the line frequencies are 1- statistical uncertainties arising from the line-fitting procedure. The systematic shifts will be discussed shortly. For the transition the statistical uncertainty of any particular day’s measurement is below 10 kHz, but over the duration of several weeks we see a greater variation. Because it is saturated absorption spectroscopy and we use third harmonic detection with the lock-in amplifier, the first order Doppler shifts should be negligible. There remains a second order Doppler shift, but this is below the level (with a 50 mrad atom beam divergence and m s-1). The main reason for the variations is that saturated absorption spectroscopy is wavefront curvature sensitive [36, 37]. To estimate a related systematic uncertainty we measured the line-centre frequency versus the cat’s eye mirror position. Over a 300 m displacement in the beam propagation direction, the shift is found to be less that 20 kHz. A more significant shift is observed for lateral displacements of the cat’s eye lens. Here the evaluation of the optimum alignment leaves a uncertainty of about 170 kHz, where we compare beam size and overlap of the incident and return beams at 1 m from the atoms. We note that the symmetry of the derivative spectrum in Fig. 3(b) is high, implying that a systematic frequency shift due to wavefront curvature should be small in comparison to the line-width [37]. A shift could also occur if there is a difference in intensity for the two beams (together with curved wavefronts) [37], but the windows and lenses are antireflection coated and the mirror has a reflectivity of 99.5 % to minimise related shifts.
We note that the transition in 171Yb should be 2.7 MHz away from the transition in 173Yb at zero -field, where the relative strength of the latter is about 30 % of the former [19]. Applying a dc magnetic bias field in our case creates two dominant derivative lines in the spectrum, consistent with the and transitions in 171Yb; hence, the influence of the 173Yb line is only small and not easily detectable (for reasons not immediately clear). However, it may still cause a perturbation to the (171Yb) line-centre. A careful estimate of the associated uncertainty has not been carried out, but since its presence is likely to be masked by noise we introduce an uncertainty of FWHM/SNR, which is 60 kHz. A shift due to the first order Zeeman effect should not be significant here, since any residual -field will split (or broaden) the line symmetrically, and the linearly polarised light produces equal Zeeman sub-level excitations.
From the data in Fig. 4(a) the mean frequency for the transition is 539 390 405 433 kHz with a statistical uncertainty of 16 kHz (compare with the transition’s natural line-width of 183.8 kHz [34]). The overall uncertainty is dominated by the rms systematic uncertainty of 180 kHz. An absolute frequency for this transition can be determined from a previous measurement of the transition in 176Yb and the relevant isotopic shift [19]. The frequency is predicted to be MHz. We measure a frequency that is 39.4 MHz above this value. The frequency difference is compatible with sign errors in our frequency comb measurements, but multiple checks have been made to avoid such an oversight.
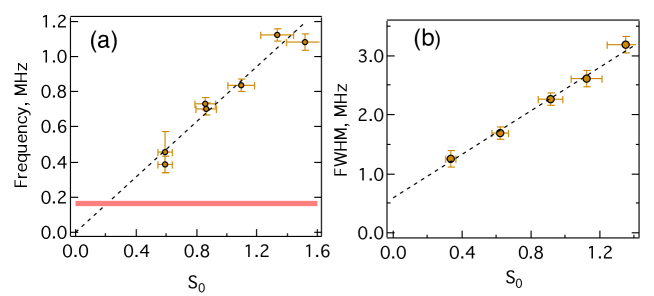
Several tests were performed in relation to Stark shifts on the transition due to the 398.9 nm light. Further assessment of the light shift has been made by probing the atoms with different levels of 398.9 nm MOT light. We use a cyclic scheme, where the MOT is loaded for 0.5 s at full intensity, then the intensity is quickly ramped down and maintained at a set intensity for a 75 ms, during which the 578.4 nm probe is applied. Immediately after the probe, the atom-fluorescence level is measured. Scanning the transition multiple times and curve fitting for different 398.9 nm levels produces the centre-frequency versus intensity data, an example of the data is presented in Fig. 5(a). There is a clear linear dependence with intensity, exhibiting a slope of 0.79 MHz per unit (across seven measurements the mean slope is MHz per unit ). Also shown by the horizontal line is the same day’s measurement of the centre frequency using the chopped MOT-beam approach. A light shift of 160 kHz is apparent for this method. By repeating this process (across separate days), we find that the average light shift for the MOT-beam chopping method is 17030 kHz. This is applied to the clock line frequency measurements, where this approach has been used (the 398.9 nm intensity has varied by less than 20 % across the recording period of the measurements) [38]. We also see the line-width dependence on the MOT beam intensity in Fig. 5(b). Interpolating to zero intensity [39] the line-width is 610 kHz. The corresponding temperature for a Doppler broadened line is 460 K. This is consistent with 171Yb atom-cloud temperature measurements made by our group by other means[24].
A Stark shift could also arise from the Zeeman-slower beam () if it is not sufficiently frequency detuned from the MOT-bound atoms. For the trapped atoms in the MOT, the frequency detuning is , where rad s-1 is the natural line-width of the transition. Repeated measurements of the transition with and without the Zeeman-slower beam showed no evidence of a light shift at 8 kHz of resolution. With regard to a light shift from the probe light itself, the Rabi frequency of the 578.4 nm light associated with the line is 4 kHz. Hence frequency shifts are not expected to be greater than this. Line-centre frequency measurements recorded for different 578.4 nm intensities confirmed this to be the case.
By differencing the values measured in Figs. 4(a) and (b) we produce the separation frequencies for . One could avoid the comparison with the measured line data and rely solely on the H-maser and prior measurements of the clock line frequency. However, by using our own clock line measurements, we limit against any bias from the H-maser should it be grossly inaccurate. The data scatter for the separation is similar to that of Fig. 4(a), since the uncertainty of the systematic shifts of the line dominate. We treat the uncertainty of each data point to be the rms sum of the systematic uncertainty of the centre frequency, the light shift uncertainty and the statistical uncertainty of each measurement. Forcing a line fit with zero gradient, the weighted mean frequency is (stat.) (syst.) kHz with a reduced- of 0.36, implying that the evaluation of the systematic uncertainty is overly conservative. However, without more effort to ensure the 555.8 nm beams have near-flat wavefronts through the atomic beam, justifying a smaller uncertainty seems inappropriate.
4 Conclusions
We have carried out concurrent optical frequency measurements of the and transitions in 171Yb, and in so doing have found the frequency separation between the and levels to be kHz. We note that the statistical uncertainty for the measurements was below 20 kHz; hence, given the reproducibility, it seems plausible that the systematic uncertainty could be reduced to a similar value. The knowledge of this frequency interval will be useful for those pursuing experiments with the 171Yb line without access to highly accurate frequency standards, since the transition is relatively easy to make apparent. This also extends to 173Yb, given the frequency measurement in [16]. With our reported value, a wave-meter with sub-ppm accuracy should be the sole frequency measuring device required to promptly find the 171Yb or 173Yb ‘clock’ transitions. We employed a hydrogen maser, but this should no longer be necessary for setting up clock-line spectroscopy in ytterbium (an alternative means of reference is described in [32] using an cell). In principle, the accuracy of the transition frequency measurements could be improved by using a retro-reflected 578.4 nm beam and producing the recoil doublet [40]. The 578 nm beam was retro-reflected with a lens-mirror cat’s-eye for some of the later measurements, but the doublet was not resolvable. Since the majority of the systematic uncertainty for the measurements lies with the line, the presence of the recoil doublet is not essential.
Acknowledgement
This work was supported by the Australian Research Council (grant LE110100054, M.E. Tobar). J.M. is supported through an ARC Future Fellowship (FT110100392). We are thankful to Gary Light and Steve Osborne of the UWA Physics workshop for fabricating components of the experiment. We thank members of the ARC Centre of Excellence for Engineered Quantum Systems for their assistance, and M.E. Tobar, S. Parker and E. Ivanov for the use of equipment. We also thank D. Sampson and D. Lorenser from the Optical and Biomedical Engineering Laboratory, UWA, for the use of measurement instrumentation.
References
- [1] Y. Takasu, K. Maki, K. Komori, T. Takano, K. Honda, M. Kumakura, T. Yabuzaki, and Y. Takahashi, “Spin-singlet Bose-Einstein condensation of two-electron atoms,” Phys. Rev. Lett. 91, 040404 (2003).
- [2] T. Fukuhara, S. Sugawa, and Y. Takahashi, “Bose-Einstein condensation of an ytterbium isotope,” Phys. Rev. A 76, 0516041 (2007).
- [3] T. Fukuhara, Y. Takasu, M. Kumakura, and Y. Takahashi, “Degenerate fermi gases of ytterbium,” Phys. Rev. Lett. 98, 030401 (2007).
- [4] N. Hinkley, J. A. Sherman, N. B. Phillips, M. Schioppo, N. D. Lemke, K. Beloy, M. Pizzocaro, C. W. Oates, and A. D. Ludlow, “An atomic clock with instability,” Science 341, 1215–1218 (2013).
- [5] N. D. Lemke, A. D. Ludlow, Z. W. Barber, T. M. Fortier, S. A. Diddams, Y. Jiang, S. R. Jefferts, T. P. Heavner, T. E. Parker, and C. W. Oates, “Spin- optical lattice clock,” Phys. Rev. Lett. 103, 063001 (2009).
- [6] M. Yasuda, H. Inaba, T. Kohno, T. Tanabe, Y. Nakajima, K. Hosaka, D. Akamatsu, A. Onae, T. Suzuyama, M. Amemiya, and F.-L. Hong, “Improved absolute frequency measurement of the 171Yb optical lattice clock towards a candidate for the redefinition of the second,” Appl. Phys. Express 5, 102401 (2012).
- [7] C. Y. Park, D.-H. Yu, W.-K. Lee, S. E. Park, E. B. Kim, S. K. Lee, J. W. Cho, T. H. Yoon, J. Mun, S. J. Park, T. Y. Kwon, and S.-B. Lee, “Absolute frequency measurement of ( F = 1/2)– ( F = 1/2) transition of 171 Yb atoms in a one-dimensional optical lattice at KRISS,” Metrologia 50, 119 (2013).
- [8] M. Takamoto, I. Ushijima, M. Das, N. Nemitz, T. Ohkubo, K. Yamanaka, N. Ohmae, T. Takano, T. Akatsuka, A. Yamaguchi, and H. Katori, “Frequency ratios of Sr, Yb, and Hg based optical lattice clocks and their applications,” Comptes Rendus Physique 16, 489 (2015).
- [9] M. Pizzocaro, G. Costanzo, A. Godone, F. Levi, A. Mura, M. Zoppi, and D. Calonico, “Realization of an ultrastable 578-nm laser for an Yb lattice clock,” IEEE Trans. Ultrason. Ferroelectr. Freq. Control 59, 426 – 31 (2012).
- [10] C. Ning, Z. Min, C. Hai-Qin, F. Su, H. Liang-Yu, Z. Xiao-Hang, G. Qi, J. Yan-Yi, B. Zhi-Yi, M. Long-Sheng, and X. Xin-Ye, “Clock-transition spectrum of 171Yb atoms in a one-dimensional optical lattice,” Chin. Phys. B 22, 090601 (2013).
- [11] F. Gerbier and J. Dalibard, “Gauge fields for ultracold atoms in optical superlattices,” New J. Phys. 12, 033007 (2010).
- [12] J. Dalibard, F. Gerbier, G. Juzeliunas, and P. Ohberg, “Colloquium: Artificial gauge potentials for neutral atoms,” Rev. Mod. Phys. 83, 1523–43 (2011).
- [13] G. Pagano, M. Mancini, G. Cappellini, P. Lombardi, F. Schafer, H. Hu, X.-J. Liu, J. Catani, C. Sias, M. Inguscio, and L. Fallani, “A one-dimensional liquid of fermions with tunable spin,” Nat. Phys. 10, 198 – 201 (2014).
- [14] F. Scazza, C. Hofrichter, M. Hoefer, P. C. De Groot, I. Bloch, and S. Foelling, “Observation of two-orbital spin-exchange interactions with ultracold SU(N)-symmetric fermions,” Nature Physics 10, 779–784 (2014).
- [15] H. Nonne, M. Moliner, S. Capponi, P. Lecheminant, and K. Totsuka, “Symmetry-protected topological phases of alkaline-earth cold fermionic atoms in one dimension,” Europhys. Lett. 102, 37008 (2013).
- [16] C. Hoyt, Z. Barber, C. Oates, T. Fortier, S. Diddams, and L. Hollberg, “Observation and absolute frequency measurements of the optical clock transition in neutral ytterbium,” Phys. Rev. Lett. 95, 083003–1 (2005).
- [17] D. Clark, M. Cage, D. Lewis, and G. Greenlees, “Optical isotopic shifts and hyperfine splittings for Yb,” Phys. Rev. A 20, 239 (1979).
- [18] W. Wijngaarden and J. Li, “Measurement of isotope shifts and hyperfine splittings of ytterbium by means of acousto-optic modulation,” J. Opt. Soc. Am. B 11, 2163 (1994).
- [19] K. Pandey, A. K. Singh, P. V. K. Kumar, M. V. Suryanarayana, and V. Natarajan, “Isotope shifts and hyperfine structure in the 555.8-nm line of Yb,” Phys. Rev. A 80, 022518 (2009).
- [20] A. Daley, M. Boyd, J. Ye, and P. Zoller, “Quantum computing with alkaline-earth-metal atoms,” Phys. Rev. Lett. 101, 170504 (2008).
- [21] K. Shibata, S. Kato, A. Yamaguchi, S. Uetake, and Y. Takahashi, “A scalable quantum computer with ultranarrow optical transition of ultracold neutral atoms in an optical lattice,” Appl. Phys. B 97, 753–8 (2009).
- [22] A. J. Daley, “Quantum computing and quantum simulation with group-II atoms,” Quantum Information Processing 10, 865–884 (2011).
- [23] P. Wolf, P. Lemonde, A. Lambrecht, S. Bize, A. Landragin, and A. Clairon, “From optical lattice clocks to the measurement of forces in the Casimir regime,” Phys. Rev. A 75, 063608 (2007).
- [24] N. Kostylev, E. Ivanov, M. Tobar, and J. J. McFerran, “Sub-Doppler cooling of ytterbium with the transition including 171Yb (I=1/2),” J. Opt. Soc. Am. B 31, 1614 (2014).
- [25] N. Kostylev, C. Locke, M. Tobar, and J. McFerran, “Spectroscopy and laser cooling on the line in yb via an injection-locked diode laser at 1111.6 nm,” Applied Physics B 118, 517–525 (2015).
- [26] T. Hänsch and B. Couillaud, “Laser frequency stabilization by polarization spectroscopy of a reflecting reference cavity,” Optics Communications 35, 441 – 444 (1980).
- [27] Partly limited by a 20 m separation between the cavity and the laser.
- [28] J. Nicholson, M. Fan, P. Wisk, J. Fleming, F. DiMarcello, E. Monberg, A. Yabon, C. Jorgensen, and T. Veng, “All-fiber, octave-spanning supercontinuum,” Opt. Lett. 28, 643 (2003).
- [29] K. Numata, A. Kemery, and J. Camp, “Thermal-noise limit in the frequency stabilization of lasers with rigid cavities,” Phys. Rev. Lett. 93, 250602–1 (2004).
- [30] M. Notcutt, L.-S. Ma, A. D. Ludlow, S. M. Foreman, J. Ye, and J. L. Hall, “Contribution of thermal noise to frequency stability of rigid optical cavity via hertz-linewidth lasers,” Physical Review A 73, 031804 (2006).
- [31] J. J. McFerran, D. V. Magalhaes, C. Mandache, J. Millo, W. Zhang, Y. L. Coq, G. Santarelli, and S. Bize, “Laser locking to the 199Hg clock transition with fractional frequency instability,” Opt. Lett. 37, 3477–3479 (2012).
- [32] T. Hong, C. Cramer, E. Cook, W. Nagourney, and E. Fortson, “Observation of the transition in atomic ytterbium for optical clocks and qubit arrays,” Opt. Lett. 30, 2644 (2005).
- [33] W. Demtröder, Laser Spectroscopy, Experimental Techniques, vol. 2 (Springer, 2008), 4th ed.
- [34] K. Beloy, J. Sherman, N. Lemke, N. Hinkley, C. Oates, and A. Ludlow, “Determination of the 5d6s state lifetime and blackbody-radiation clock shift in Yb,” Phys. Rev. A 86, 051404 (2012).
- [35] The hydrogen-maser was last calibrated and corrected to agree with UTC-Sydney in November 2011 to .
- [36] C. J. Bordé, J. L. Hall, C. V. Kunasz, and D. G. Hummer, “Saturated absorption line shape: Calculation of the transit-time broadening by a perturbation approach,” Phys. Rev. A 14, 236 (1976).
- [37] J. Hall and C. Borde, “Shift and broadening of saturated absorption resonances due to curvature of the laser wave fronts,” Appl. Phys. Lett. 29, 788 (1976).
- [38] Interleaving the 578.4 nm and 398.9 nm light via AOMs is a more appropriate method for carrying out the clock line spectroscopy, but technical issues prevented its use for much of the data recording period.
- [39] M. Cristiani, T. Valenzuela, H. Gothe, and J. Eschner, “Fast nondestructive temperature measurement of two-electron atoms in a magneto-optical trap,” Phys. Rev. A 81, 063416 (2010).
- [40] M. Petersen, R. Chicireanu, S. T. Dawkins, D. V. Magalhaes, C. Mandache, Y. L. Coq, A. Clairon, and S. Bize, “Doppler-free spectroscopy of the 1S0-3P0 optical clock transition in laser-cooled fermionic isotopes of neutral mercury,” Phys. Rev. Lett. 101, 183004 (2008).