Modelling the synchrotron light curves in recurrent novae V745 Scorpii and RS Ophiuchi–LABEL:lastpage
Modelling the synchrotron light curves in recurrent novae V745 Scorpii and RS Ophiuchi
Abstract
In this paper, we present the synchrotron light curve at 610 MHz from the recurrent nova V745 Sco following its outburst on 6 February 2014. The system has been detected and periodically monitored with the Giant Metrewave Radio Telescope (GMRT) since 9 February 2014 as part of the Galactic Nova with GMRT (GNovaG) project. The light curves are well fit by a model of synchrotron emitting region obscured by foreground thermal gas which eventually becomes optically thin to the low GMRT frequencies. We present the model fit to the 2014 data on V745 Sco and discuss it alongwith the model fit to the 1.4 GHz data of the recurrent nova RS Ophiuchi following its outburst in 1985.
keywords:
(stars:)novae – radio continuum – V745 Sco1 Introduction
Novae are cataclysmic variables comprising a white dwarf primary star and a main sequence or evolved secondary star. The primary accretes matter from the secondary leading to thermonuclear outbursts on the surface of the white dwarf. Novae brighten by several optical magnitudes and the ones which periodically undergo outbursts are referred to as recurrent novae. Emission from the system due to different physical processes is detected in bands ranging from -rays to radio waves. The emission at the long radio wavelengths (cm) is dominantly due to the synchrotron process. The energy released in a nova outburst is ergs and the synchrotron radio luminosity is about erg s-1 Hz-1 (Kantharia, 2012).
2 Outburst in the recurrent nova V745 Sco in 2014
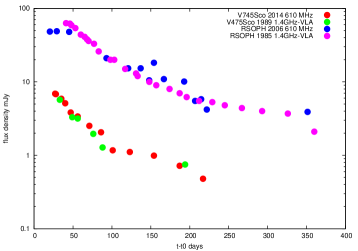
Following its outburst in 2014, V745Sco was detected at 610 MHz using GMRT (Kantharia et al., 2014). The light curves of V745 Sco following its outburst in 2014 and 1989 and of RS Ophiuchi following its outbursts in 1985 and 2006 are shown in Fig. 1. Notice the similar evolution of the radio light curves from multiple outbursts. A model consisting of a synchrotron emitting shell which is initially obscured by foreground thermal gas leading to delayed turnon of low radio frequency synchrotron emission well fits the observed light curve. We use the model parametrized by Weiler et al. (2002) to explain supernova light curves and have included only foreground absorption due to clumpy and uniform components. The best model gives a turn-on on day 9.5 and peak emission on day 23 for the 610 MHz data on V745 Sco in 2014. A similar model is found to fit the VLA 1.4 GHz light curve obtained following an outburst in the recurrent nova RS Ophiuchi in 1985. More details are presented in a research paper submitted to MNRAS.
Acknowledgements
We thank the staff of the GMRT that made these observations possible. GMRT is run by NCRA, a centre of TIFR.
References
- Hjellming et al. (1986) Hjellming R. M., van Gorkom, J. H., Taylor, A. R., Sequist, E. R., Padin, S., Davis, R. J., Bode, M. F., 1986, ApJ, 305, L71.
- Kantharia et al. (2007) Kantharia N. G., Anupama, G. C., Prabhu, T. P., Ramya, S., Bode, M. F., Eyres, S.P.S., O’Brien, T. J., 2007, ApJ, 667, L171.
- Kantharia (2012) Kantharia N. G., 2012, BASI, 40, 311.
- Kantharia et al. (2014) Kantharia N. G., Roy, N, Anupama, G. C.; Banerjee, D.P.K., Ashok, N. M., Dutta, P, Prabhu, T. P.; Johri, A, 2014, ATel, 5962, 1.
- Weiler et al. (2002) Weiler K. W.,Panagia, N, Montes, M. J.; Sramek, R. A. , 2002, ARA&A, 40, 387.