11email: : kxyysl@ynao.ac.cn 22institutetext: Key Laboratory for the Structure and Evolution of Celestial Objects, Chinese Academy of Sciences, Kunming, 650011, China 33institutetext: University of Chinese Academy of Sciences, Beijing, 100049, China 44institutetext: Key Laboratory for Research in Galaxies and Cosmology, Shanghai Astronomical Observatory, Chinese Academy of Sciences, 80 Nandan Road, Shanghai, 200030, China
The star-formation history of low-mass disk galaxies: a case study of NGC 300
Abstract
Context. Since NGC 300 is a bulge-less, isolated low-mass galaxy and has not experienced radial migration during its evolution history, it can be treated as an ideal laboratory to test simple galactic chemical evolution models.
Aims. Our main aim is to investigate the main properties of the star-formation history (SFH) of NGC 300 and compare its SFH with that of M33 to explore the common properties and differences between these two low-mass systems.
Methods. By assuming its disk forms gradually from continuous accretion of primordial gas and including the gas-outflow process, we construct a simple chemical evolution model for NGC 300 to build a bridge between its SFH and its observed data, especially the present-day radial profiles and global observed properties (e.g., cold gas mass, star-formation rate and metallicity). By means of comparing the model predictions with the corresponding observations, we adopt the classical methodology to find out the best combination of free parameters , and .
Results. Our results show that, by assuming an inside-out formation scenario and an appropriate outflow rate, our model reproduces well most of the present-day observational values, not only the radial profiles but also the global observational data for the NGC 300 disk. Our results suggest that NGC 300 may experience a rapid growth of its disk. Through comparing the best-fitting model predicted SFH of NGC 300 with that of M33, we find that the mean stellar age of NGC 300 is older than that of M33 and there is a lack of primordial gas infall onto the disk of NGC 300 recently. Our results also imply that the local environment may paly a key role in the secular evolution of NGC 300.
Key Words.:
galaxies: abundances — galaxies: evolution— galaxies: spiral — galaxies: individual: NGC 3001 Introduction
In order to fully understand the history of the universe, it is essential to understand the history of individual galaxies. However, most of disk galaxies are difficult to study in detail due to the complexities of their bulges (Byun & Freeman 1995), or tidal interactions, or mergers (Barnes & Hernquist 1992). Fortunately, there still exist some disk galaxies, which are in the absence of major mergers, undisturbed and bulge-less (i.e., pure-disk) systems that maintain weak spiral structure to suppress radial migration, making them excellent laboratories to study the secular evolution of galactic disk. At the same time, recent studies have exhibited that massive galaxies have almost finished forming stars at early epoch and a large number of low-mass galaxies exist at all redshifts (e.g., Bauer et al. 2013, and references therein). Moreover, deep surveys detecting masses have shown that galaxy stellar mass functions have steep slopes at the low-mass end (Baldry et al. 2008, 2012; Kelvin et al. 2014), indicating the necessity to understand the evolutionary history of low-mass galaxies, which are the most populous in the universe.
NGC 300 is the nearest isolated and nearly face-on low-mass disk galaxy, which is located at a distance of 2.0 Mpc (Dalcanton et al. 2009) in the Sculptor group. In addition, NGC 300 is an almost bulge-less system (Williams et al. 2013), and there is no confusion between disk and bulge populations (bulge light 20%, Vlajić et al. 2009). Both N-body simulations and the kinematics of the globular clusters systems studies have shown that NGC 300 has not experienced radial migrations during its evolution (Olsen et al. 2004; Gogarten et al. 2010; Nantais et al. 2010). Therefore, NGC 300 is an ideal disk galaxy to test the simple galactic chemical evolution model.
The simple chemical evolution model, which adopts parameterized descriptions for some complicated physical processes, has already been proven to be a powerful tool to explore the formation and evolution of disk galaxies (Tinsley 1980; Chang et al. 1999; Boissier & Prantzos 2000; Chiappini et al. 2001; Mollá & Díaz 2005; Yin et al. 2009; Chang et al. 2012; Kang et al. 2012, 2015), and it has achieved great progress in our understanding the formation and evolution of disk galaxies in a cosmological context. However, there is still lack of such research on NGC 300. In this paper, we construct a simple chemical evolution model for NGC 300 to build a bridge between its SFH and its observed properties, including both the radial profiles and global observational constraints.
More importantly, NGC 300 is also a near-optical twin of the Local Group galaxy M33, and Table 1 presents a comparison of their basic properties. Several authors have found an inside-out growth scenario for NGC 300 based on its broadband colors and the color-magnitude diagram (CMD) fitting (Kim et al. 2004; Muñoz-Mateos et al. 2007; Gogarten et al. 2010). Both theoretical model (Kang et al. 2012) and observations (Williams et al. 2009) have shown that M33 grows inside-out. Although they are similar in appearance, M33 has a disk break at (Ferguson et al. 2007; Barker et al. 2007, 2011), while NGC 300 has a pure exponential disk out to (Bland-Hawthorn et al. 2005). Furthermore, an HI bridge exists between M33 and M31 (Karachentsev et al. 2004; Putman et al. 2009), indicating the probability that they interacted with each other in the past (Braun & Thilker 2004; McConnachie et al. 2010; San Roman et al. 2010; Bernard et al. 2012). This result is confirmed by the evidence for tidal disruption of M33’s gas disk (Rogstad et al. 1976; Deul & van der Hulst 1987; Corbelli & Schneider 1997; Karachentsev et al. 2004; Putman et al. 2009). Compared to M33, NGC 300 is a relatively isolated system, with only dwarf galaxies nearby (Karachentsev et al. 2003; Tully et al. 2006; Williams et al. 2013). The aforementioned differences indicate that they may have significantly different evolution histories, and it should be interesting to compare the SFH of NGC 300 with that of M33.
The outline of this paper is organized as follows. The observational constraints are presented in Section 2. The main ingredients of our model are described in Section 3. Comparisons of the model predictions with the present-day observations of NGC 300, as well as comparisons between the SFH of NGC 300 and that of M33 are shown in Section 4. Section 5 presents a summary of our results.
| Property | NGC 300 | M33 |
|---|---|---|
| Morphology | SA(s)da,b | SA(s)cda,b |
| Distance | 2.0 Mpcc | 800 kpcd |
| Scale-length (kpc, in band) | 1.29g | 1.4g |
| Rotation velocity | 91 km s | 110 km s |
2 Observational constraints
A successful chemical evolution model of NGC 300, especially one involving free parameters, should reproduce as many as possible observational constraints, including both local (concerning the radial profiles) and global ones (concerning the whole disk). It is well known that, during the evolutionary histories of galaxies, star formation process converts cold gas into stars and stars in turn produce heavy elements by means of nucleosynthesis. These metals are then expelled into the surrounding ISM in the later stage of stellar evolution, thus enriching interstellar gas and becoming fuel for the next generation of star formation. That is, the observed present-day metallicity, atomic hydrogen gas and star-formation rate (SFR) provide important constraints on the SFH of the galaxy.
2.1 Cold gas and SFR
The atomic hydrogen gas disk associated with NGC 300 is observed to extend far beyond its optical disk. The radial distribution of atomic hydrogen gas for NGC 300 disk is measured with the Australia Telescope Compact Array (ATCA) at a wavelength of (Westmeier et al. 2011), and its atomic hydrogen mass has been estimated to be (Rogstad et al. 1979; Barnes et al. 2001; Koribalski et al. 2004; Westmeier et al. 2011; Millar et al. 2011; Wiegert & English 2014). The stellar mass of the NGC 300 disk is estimated to be (Muñoz-Mateos et al. 2007). Thus, we can easily obtain the atomic hydrogen gas fraction (defined as ) of NGC 300, i.e., .
The recent SFR surface density profiles of Gogarten et al. (2010) are obtained from the resolved stars, and those from Williams et al. (2013) are derived by the combination of far-ultraviolet (FUV) and maps. In recent years, the total SFR in several regions along the NGC 300 disk have been carefully measured by both ground-based and space-based facilities (Helou et al. 2004; Gogarten et al. 2010; Binder et al. 2012; Karachentsev & Kaisina 2013; Williams et al. 2013). The current total SFR for NGC 300 disk is estimated to be yr-1 using different tracers, including the X-ray luminosity (Binder et al. 2012), H emission (Helou et al. 2004; Karachentsev & Kaisina 2013), and luminosity in the FUV (Karachentsev & Kaisina 2013) and mid-infrared (MIR, Helou et al. 2004) bands, just a factor of several smaller than the value in the Milky Way disk, which indicates that NGC 300 is currently a rather quiescent galaxy.
| Property | Value | Refs. |
|---|---|---|
| Stellar mass | 1 | |
| Hi mass | 2, 3, 4, 5, 6, 7 | |
| Gas fraction | this paper | |
| 8, 9, 10 | ||
| Total SFR | yr-1 | 11, 12, 13, 14 |
Refs: (1) Muñoz-Mateos et al. (2007); (2) Rogstad et al. (1979); (3) Barnes et al. (2001); (4) Westmeier et al. (2011); (5) Wiegert & English (2014); (6) Koribalski et al. (2004); (7) Millar et al. (2011); (8) Garnett (2002); (9) Bresolin et al. (2009); (10) Pilyugin et al. (2014); (11) Helou et al. (2004); (12) Gogarten et al. (2010) (13) Binder et al. (2012); (14) Karachentsev & Kaisina (2013)
2.2 Chemical abundance
Observations of the chemical abundances of a galaxy provide important constraints for the physical processes in the models of galaxy evolution, since the chemical composition is directly related to star formation process. In this case, planetary nebulae (PNe) and Hii regions are good tracers. Generally speaking, they are representative of the chemical abundance in the interstellar medium (ISM) at two different epochs during the galaxy evolution. PNe proceed from the death of low- and intermediate-mass stars (), so they have oxygen abundances approximately equal to the composition of the ISM at the epoch when their progenitors were formed. On the other hand, Hii regions are thought to represent the current chemical composition of the ISM. Moreover, oxygen is the most abundant heavy element formed in the Universe (Korotin et al. 2014; Zahid et al. 2014), and oxygen abundance is easily estimated in Hii regions due to its bright emission line. Therefore, the abundance of oxygen can be used as a proxy for the production of all heavy elements in galaxies (Zahid et al. 2014).
Radial gas-phase oxygen profiles are regarded as important quantities to constrain our model. The radial gas-phase oxygen abundance for NGC 300 in the Hii regions and PNe has been studied by a number of authors (Pagel et al. 1979; Deharveng et al. 1988; Zaritsky et al. 1994; Bresolin et al. 2009; Stasińska et al. 2013; Pilyugin et al. 2014). All these studies showed that oxygen abundance decreases with radius, and the metallicity in the center is highest, although the overall abundance depends on the calibration methods adopted. The observed oxygen abundance profiles of the NGC 300 disk used to constrain the gas-phase oxygen predicted by our model are those of Bresolin et al. (2009) and Pilyugin et al. (2014), since these two papers enlarged the number of the Hii regions in whose spectra [Oiii] can be detected.
At the same time, the characteristic oxygen abundance, which is defined as the oxygen value at the effective radius , is representative of the average value of the young component across the galaxy (Garnett 2002; Sánchez et al. 2013). is equal to 1.685 times the exponential scalelength of the disk. Thus, we will also use the characteristic oxygen abundance of Bresolin et al. (2009) and Pilyugin et al. (2014) to compare with the model predicted present-day oxygen abundance of NGC 300 to constrain our chemical evolution model.
In Table 2, we present the basic observational constraints concerning the present-day total amount of stars, atomic hydrogen gas, gas fraction, characteristic oxygen abundance and SFR in the disk of NGC 300.
3 The Model
In this section, we briefly introduce the basic assumptions and main ingredients of the model. We assume that the NGC 300 disk is composed of a set of independently concentric rings with the width 500 pc, which are progressively built up by continuous infall of primordial gas () from its halo. Star formation, metal production via stellar evolution, stellar mass return, infalls of primordial gas, and outflows of metal enriched gas are taken into account in our model under the condition of both instantaneous recycling assumption (IRA) and instantaneous mixing of the ISM with stellar ejecta. Moreover, neither radial gas flows nor stellar migration is allowed in our model, since these radial flows are far from clearly understanding and will introduce additional free parameters whose values might be difficult to constrain.
3.1 Gas infall rate
In order to reproduce the observed metallicity distribution of long-living stars in the solar neighborhood (G-dwarf problem, Pagel 1989; Rana 1991, and references therein), the simple closed-box model is proved to be unreasonable and the infall of gas from its halo has been introduced in the chemical evolution model (Tinsley 1980). Indeed, Mathewson et al. (1975) conclude that a long ’Hi tail’ extends about to the southeast of the disk of NGC 300 and Westmeier et al. (2011) find that the Hi disk is more extended than its optical disk, respectively.
The infall rate, as a function of space and time, plays a key role in determining the properties of the galaxy disk, such as the gas, SFR and metallicity. At a given radius , the gas infall rate (in units of ) is assumed to be (Kang et al. 2012):
| (1) |
where is the infall time-scale and is a free parameter in our model. The are actually a set of separate quantities constrained by the present-day stellar mass surface density , and is the cosmic age and we set according to the standard cosmology (e.g., , , and ). In other words, are iteratively computed by requiring the model predicted present-day stellar mass surface density is equivalent to its observed value (Chang et al. 2012; Kang et al. 2012). In general, the -band luminosity strongly correlates with the accumulated star formation in the galaxy, thus it can accurately reflect the stellar disk. In this work, the present-day values of stellar mass and disk scale-length for NGC 300 are adopted to be and kpc, and these two values are derived from band luminosity (Muñoz-Mateos et al. 2007). We assume that NGC 300 has a pure exponential disk, which is confirmed by the observations of Bland-Hawthorn et al. (2005), and follows an exponential profile, thus the central stellar mass surface density can be easily obtained from .
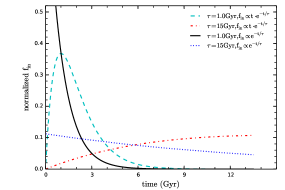
It should be emphasized that a simple exponential form of gas infall rate is widely used in the previous chemical evolution models (Matteucci & Francois 1989; Hou et al. 2000; Chiappini et al. 2001; Yin et al. 2009). To explore the difference between the exponential gas infall rate form and the form adopted in this paper, we show the two forms of the normalized gas infall rate in Fig. 1. The infall rate adopted as is plotted as dashed line () and dot-dashed line (), while that adopted as is shown as solid line () and dotted line (), respectively. From Fig. 1, we can see that the gas infall rate we adopted in this work is low in the beginning and gradually increases with time, it reaches the peak value when and then falls, that is, is corresponding to time-declining gas infall rate, while is corresponding to a time-increasing gas infall rate. However, the exponential form of gas infall rate is always decreasing with time and the limiting case is corresponding to a constant. In order to include more possible situations in the model, we adopt the gas infall rate as the form of in this work. In any case, the infall timescale determines the gas accretion history and largely describes the main properties of the SFH of the disk of NGC 300, thus we regard as the most important free parameter in our model.
3.2 Star-formation Law
The star-formation law, which connects SFR surface density with interstellar gas surface density, is another significant ingredients of the model, and SFR describes the total mass of newly born stars in unit time.
More than half a century ago, Schmidt (1959) surmised that the SFR surface density should vary with a power of the surface density of gas. Later, based on the observed data of a sample of 97 nearby normal and starburst galaxies, Kennicutt (1998) demonstrated the existence of a power-law between the galaxy-averaged SFR surface density and the galaxy-averaged total gas surface density. Recently, high-resolution investigations that separate the components of atomic hydrogen and molecular hydrogen gas have shown that the SFR surface density correlates more strongly with the surface density of molecular hydrogen than with that of atomic hydrogen and total gas (Wong & Blitz 2002; Bigiel et al. 2008; Leroy et al. 2008). Indeed, multiple studies in both individual galaxies and large samples of spiral galaxies have found a linear relation between the SFR surface density and the molecular gas surface density . The linear slope is an approximately constant depletion time (, e.g., Bigiel et al. 2008; Leroy et al. 2008; Rahman et al. 2011; Leroy et al. 2013). Furthermore, based on an up-to-date set of observational data, Krumholz (2014) concludes in his recent work that ”the correlation between star formation and molecular gas is the fundamental one”. These results do encourage us to adopt the molecular related star formation law here , that is
| (2) |
With respect to the value of molecular gas depletion time , we adopt throughout this work (Leroy et al. 2008, 2013). The reader is referred to Kang et al. (2012) and Kubryk et al. (2014) for a more indepth description for the calculation of the ratio of molecular hydrogen to atomic hydrogen gas surface density in a galaxy disk, along with the present-day molecular hydrogen and atomic hydrogen gas surface density.
3.3 Gas outflow rate
The gas-outflow process may influence the evolutionary history of NGC 300. The oxygen in the universe is predominantly formed in massive stars () and subsequently dispersed into the ISM by supernova explosion and stellar winds, thus the oxygen in the ISM may expel from the galactic disk when the gas thermal energy exceeds the binding energy of gas. Low-mass galaxies are expected to lose a larger fraction of supernova ejecta than high-mass systems due to their shallower gravitational potentials (Kauffmann et al. 1993). Indeed, both analytical (Erb 2008) and hydrodynamic (Finlator & Davé 2008) models showed that galactic outflows are important to reproduce the stellar mass-metallicity relation of galaxies. Moreover, for galaxies with stellar mass , the outflow process play a crucial role during their evolution histories (Tremonti et al. 2004; Spitoni et al. 2010; Chang et al. 2010). Finally, galaxies with rotation speed may expel a large part of their supernova ejecta to the circumgalactic medium (Garnett 2002). Since NGC 300 is a fairly low-mass disk galaxy (, Muñoz-Mateos et al. (2007)) with a rotation speed about (Garnett 2002), the gas-outflow process has a significant influence on the chemical enrichment during its evolution history.
We assume that the outflowing gas has the same metallicity as the ISM at the time the outflow is launched, and the outflowing gas will not fall again to the disk (Chang et al. 2010; Kang et al. 2012; Ho et al. 2015). We follow the approach of Recchi et al. (2008), that is, the gas outflow rate (in units of ) is proportional to the SFR surface density . Therefore, the outflow rate is given by:
| (3) |
where is the other free parameter in our model.
3.4 Basic equations of chemical evolution
As mentioned above, both IRA and instantaneous mixing of the ISM with ejecta are assumed, thus the chemical evolution in each ring can be expressed by the classical set of integro-differential equations from Tinsley (1980):
| (4) |
| (5) |
| (6) |
where is the total (star + gas) mass surface density in the ring centered at galactocentric distance at evolution time , and is the metallicity in the corresponding place and time. is the return fraction and we get after adopting stellar initial mass function (IMF) from Chabrier (2003) between and . is the nucleosynthesis yield and we set throughout this work (Fu et al. 2009; Chang et al. 2010; Kang et al. 2012). is the metallicity of the infalling gas and we assume the infalling gas is metal-free, i.e., . is the metallicity of the outflowing gas and we assume that the outflow gas has the same metallicity as the ISM at the time the outflows are launched, e.g., (Chang et al. 2010; Ho et al. 2015).
In summary, the infall time-scale and the outflow coefficient are two free parameters in our model. Moreover, there is degeneracy between and the outflow parameter in that the model adopting a higher need a larger to reproduce the observed metallicity profile. Thanks to the fact that the reasonable range of y is small (about to ) compared with the large possible rang of , we can constrain using the observed abundance gradient. We should emphasize that, although the accurate value of free parameters in our best-fitting model may change a little, our results of the main trends of the SFHs of NGC 300 are robust.
4 Model Results Versus Observations
In this section, we present our results step by step. Firstly, we investigate the influence of free parameters on model predictions and select a best-fitting model for NGC 300. Then, we present the evolution of the total amount of atomic hydrogen gas, SFR, characteristic , and of the gas fraction for the disk of NGC 300. Finally, we compare the SFH of NGC 300 with that of M33.
4.1 Radial profiles
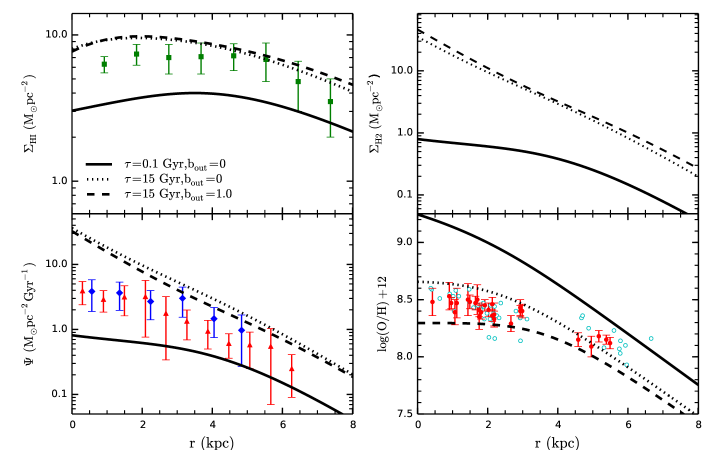
First of all, we explore the influence of infall time-scale on model results and fix the gas-outflow coefficient to be . The comparison between the profiles of model predictions and the observations are displayed in Fig. 2. The different line types in Fig. 2 are corresponding to various values of free parameters: solid lines () and dotted lines (). Obviously, the model predictions are very sensitive to the adopted infall time-scale . As shown in Fig. 1, the case of corresponds to a time-declining infall rate that most of the cold gas has been accreted to the disk in the early stage of of its history, while that of denotes a time-increasing gas infall rate that a large fraction of cold gas is still falling onto the disk of NGC 300 nowadays. Thus, the model adopting a shorter infall time-scale (solid lines) predicts lower gas surface density, lower SFR, and higher gas-phase oxygen abundance than that adopting a longer infall time-scale (dot-dashed lines). This is mainly due to the fact that, in our model, the setting of longer infall time-scale corresponds to a slower gas accretion during its evolution history, thus more gas remain in the disk nowadays to fuel higher SFR and then results in an younger stellar population, lower metallicity and higher cold gas content at the present time, and vice versa.
Here, we investigate the impact of the gas-outflow process on model predictions. The dashed lines in Fig. 2 represent the model results adopting . The comparison between the dotted () and dashed () lines shows that the gas-outflow process has little influence on Hi, H2 and SFR, while it has great influence on the gas-phase metallicity. That is, the gas-outflow process carries part of metals away from the disk and reduces the gas-phase metallicity. In other words, the observational radial gas-phase metallicity must be very important physical quantities to constrain the gas-outflow process of NGC 300.
Fig. 2 also shows that the area between the solid () and dashed () lines almost covers the whole range of the observations, which suggests the possibility to construct a model that can reproduce most of the observed features along the disk of NGC 300. Furthermore, the observed trends in Fig. 2 show that the inner stellar disk is metal-richer than that of outer region, and the observed studies also show that the stellar disk of NGC 300 grows inside-out (Kim et al. 2004; Muñoz-Mateos et al. 2007; Gogarten et al. 2010). To simply describe the inside-out formation scenario of disk, we follow the previous models of Chiosi (1980) and Matteucci & Francois (1989), and adopt a radius-dependent infall time-scale , where a and b are the coefficients for the linear equations adopted for . Including the additional free parameter in the gas-outflow process, there are three free parameters (a, b and ) in our model.
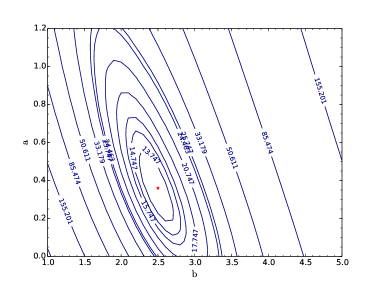
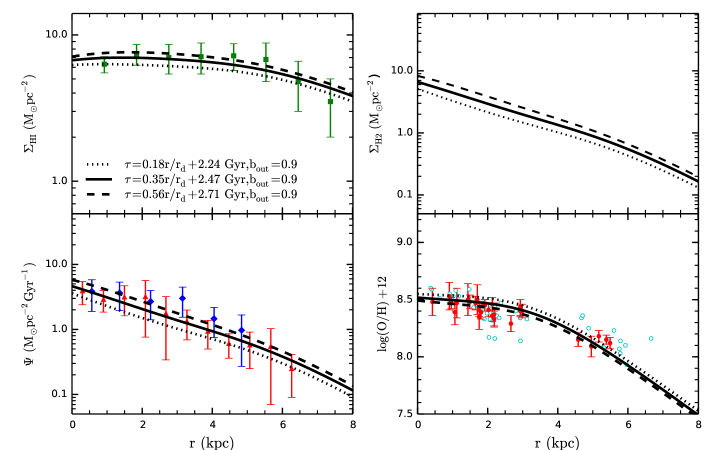
In order to find the best combination of free parameters a, b and , we adopt the classical technique to compare the model results with the corresponding observational data, including the radial profiles of Hi, SFR and . The boundary conditions of a, b and are assumed to be , and , respectively. In practice, we calculate the value of by comparing our model predictions with the observed data (i.e., the combination of the radial profiles of Hi, SFR and ), and show the contours in Fig. 3, where the number of each contour shows the value of . The first, second and third ellipses are contours that correspond to , and confidence level, respectively. It should be emphasized that, for each pair of a and b values, we change the value of in order to make sure the value of minimum. The minimum value of (12.747) denoted as filled asterisk is displayed in Fig. 3, and the corresponding values of the best combination (a, b, )= (0.35, 2.47 0.9) is selected as the best-fitting model.
The predictions of best-fitting model are shown as solid lines in Fig. 4. The dotted and dashed lines plot the model predictions adopting and with confidence level. The notation of the observed data is the same as that of Fig. 2. It can be seen from Fig. 4 that the solid lines can nicely reproduce all the observational radial profiles, which suggests that this parameter group may reasonably describe the crucial ingredients of the main physical processes that regulate the formation and evolution of NGC 300.
4.2 Stellar disk growth
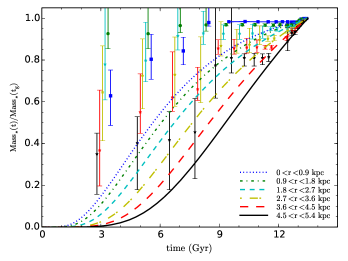
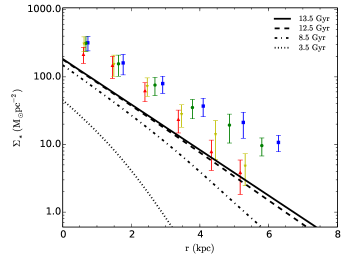
In order to quantify the inside-out assembly of NGC 300, Fig. 5 plots the best-fitting predictions of the growth curves of stellar masses in different regions, including 0-0.9 kpc (dotted lines), 0.9-1.8 kpc (dot-dashed lines), 1.8-2.7 kpc (dashed lines), 2.7-3.6 kpc (long dot-dashed lines), 3.6-4.5 kpc (long dashed lines) and 4.5-5.4 kpc (solid lines), and compare them with the measurements from Fig.6 of Gogarten et al. (2010). Note that the stellar masses in Fig. 5 are normalized by their present-day values. Fig. 6 displays the time evolution of the stellar mass surface density profile at 3.5 Gyr (dotted lines), 8.5 Gyr(dot-dashed), 12.5 Gyr(dashed lines) and 13.5 Gyr(solid lines).
It can be seen from Fig. 5 that the stellar mass in the corresponding regions has been steadily increasing to its present-day value and the outer parts of the disk formed a greater fraction of their stars at recent times than the inner parts of the disk, which is consistent with the ”inside-out” formation scenario (Kim et al. 2004; Muñoz-Mateos et al. 2007; Gogarten et al. 2010). Moreover, Fig. 6 shows that the stellar mass surface density has changed substantially in the outer regions of the disk than in the inner regions, in line with the trend of Fig.7 in Gogarten et al. (2010). However, the best-fitting model predictions fail to reproduce the measurements of Fig.6 and Fig.7 from Gogarten et al. (2010). The possible reasons may be identified as a) the stellar mass of NGC 300 in our work is derived from band luminosity (Muñoz-Mateos et al. 2007), but it in Gogarten et al. (2010) is about ; b) the galactocentric distances are within 5.4 kpc for the disk of NGC 300 in Gogarten et al. (2010), while ours are extend to 8.0 kpc; or a combination of these two. Thus, it is difficult to directly compare our results with the measurements from Gogarten et al. (2010, Fig. 6 and Fig. 7). Most importantly, the main trend of our best-fitting model predictions are in accordance with the information of Fig. 6 and Fig. 7 in Gogarten et al. (2010).
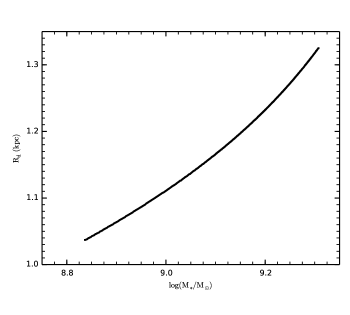
Fig. 7 also shows the stellar-mass-size evolution (from to ) for the disk of NGC 300. It can be found that both the stellar mass and the scale-length of NGC 300 have been growing since , which is consistent with the results of the previous studies (Brooks et al. 2011; Brook et al. 2012).
4.3 Global evolution
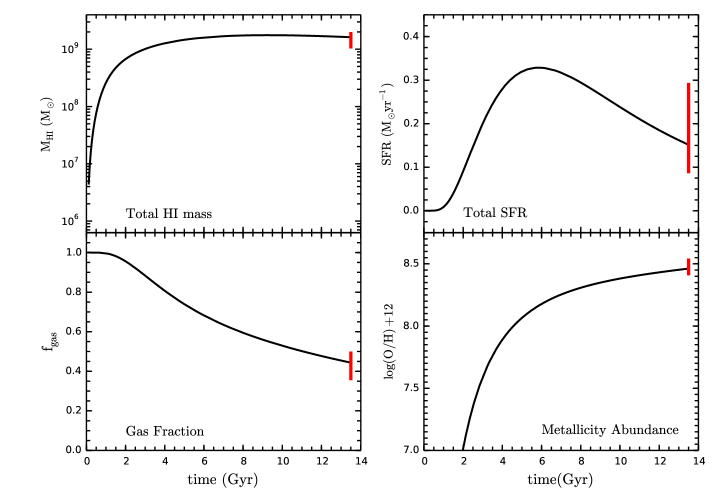
The evolution of the total amount of atomic hydrogen gas, SFR, characteristic (defined as the oxygen value at the effective radius , which is equal to 1.685 times the radial scalelength of the disk), and of the gas fraction predicted by the best-fitting model are shown by solid lines in Fig. 8. They are compared to the observational data displayed in Table 2, which are plotted as red vertical bars at the present time, i.e., .
Fig. 8 shows that the best-fitting model predictions reproduce fairly well with the global observational constraints of the NGC 300 disk. It can be also found that, in the first Gyr the atomic hydrogen gas assembles very fast, but the gas fraction does not decrease and there is no star formation occurring. Although it is generally believed that almost all star formation occurs in molecular clouds, the cold gas in the earlier stage is mainly in the form of atomic gas. After the amount of atomic hydrogen exceeds a critical value, the atomic hydrogen gas begins to convert into molecular hydrogen gas and then the star formation process accelarates. Fig. 8 also shows that the oxygen abundance increases during the whole evolution history, and there is greater abundance increase before the evolution age compared to the later epoch. This is mainly due to the fact that, in the later epoch, as the infall rate of cold gas gradually decreases with time, so too does the accumulation of molecular hydrogen gas, thus the SFR decreased as well and the oxygen abundance enrichment becomes relatively slow.
4.4 Comparison with M33
| General | Prescription | Parameter |
|---|---|---|
| Age of disk (Gyr) | 13.5 | |
| IMF | Chabrier (2003) | |
| Mass limits () | 0.1–100 | |
| Yield | ||
| SFR () | ||
| Infall rate () | ||
| Outflow rate () | ||
| Metallicity of infall gas | ||
| Individual | NGC 300 | M33 |
| Total stellar mass () | 1.928 | 4.0 |
| Scale-length (kpc) | 1.29 | 1.4 |
| 1.9 | 0.46 | |
| Infall time-scale (Gyr) | ||
| Outflow efficiency | 0.9 |
Note:
a The solar oxygen abundance value is from Asplund et al. (2009).
M33 is nearly a twin to NGC 300 in Hubble Type and mass, and we have already explored the evolution and SFH of M33 in a previous work (Kang et al. 2012). In this section, we will compare the SFH of NGC 300 predicted by the best-fitting model with that of M33. The main ingredients and parameters of the best-fitting models for NGC 300 and M33 are presented in Table 3, and the reader is referred to Kang et al. (2012) for a more indepth description of the physical details for the model of M33.
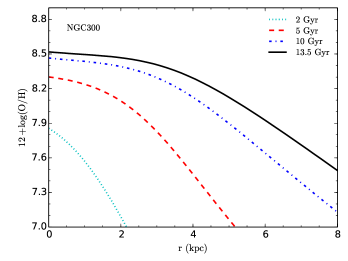
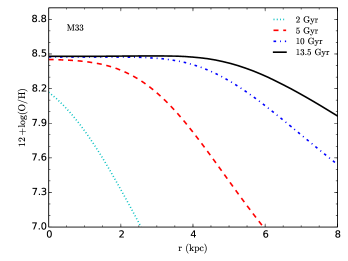
First of all, we plot the time evolution of the gas-phase oxygen abundance gradient of NGC 300 (left panel) and that of M33 (right panel) in Fig. 9. Different line types represent the radial profile of at different time, i.e., 2 (dotted line), 5 (dashed line), 10 (dot-dashed line), and at 13.5 Gyr (solid line). The best-fitting model predicted present-day (i.e., ) abundance gradients are 0.0843 for NGC 300 disk and for M33 disk from 0.2 to 6 kpc in radius, which is in good agreement with the observed gradient derived in the same radial range, i.e., 0.08420.0065 for NGC 300 from Pilyugin et al. (2014) and 0.0270.012 for M33 from Rosolowsky & Simon (2008). It can be seen from Fig. 9 that NGC 300 has a steep radial metallicity gradient and a significant increase in metallicity with time. As for M33, it has a flatter gradient and a slower increase in metallicity with time, especially in the inner parts of the disk, which indicates that M33 may experience more gas infall at later times to dilute the metallicity. Furthermore, we find that the metallicity in NGC 300 has increased with time in all radial bins, suggesting that there is less infall of primordial gas recently. This is generally in accordance with the observed finding of Gogarten et al. (2010).
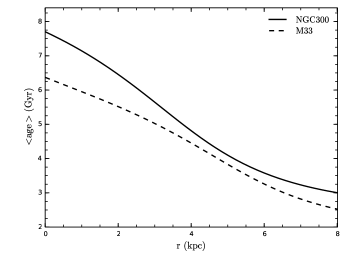
In order to demonstrate clearly the property of the stellar age of both NGC 300 and M33, we plot the mean stellar age along the disks of them predicted by their own best-fitting models with the solid line for NGC 300 and with the dashed line for M33 in Fig. 10. It can be seen that there exists radial age gradient in both NGC 300 and M33’s disks, that is, the cumulative age distribution shifts to younger ages as the radius increases, which is consistent with the inside-out growth of the stellar disk in NGC 300 and M33 (Kim et al. 2004; Muñoz-Mateos et al. 2007; Williams et al. 2009; Gogarten et al. 2010). This is mainly due to the fact that the short infall time-scale means that a large fraction of stars formed at the early stage and hence high mean stellar age, and vice verse. Fortunately, Gogarten et al. (2010) studied the cumulative SFH for the disk of NGC 300 out to 5.4 kpc, and they found that of the stars are older than 6 Gyr in the inner regions, while only of stars are this old in the outermost parts (i.e., ). Meanwhile, the model predicted mean age of stellar populations along the NGC 300 disk is 7.70 Gyr in the central region, 3.85 Gyr at and 2.97 Gyr at , respectively. As for M33, Barker et al. (2011) concluded that the mean age of stellar population at in M33 is , and our model predicted age in this place is 2.33 Gyr. Furthermore, our model predicted mean stellar age in the central region of M33 is . Williams et al. (2009) fitted the stellar disk growth within the inner disk of M33, and found that most of the stars formed from 10 Gyr to 5 Gyr ago. All of these suggest that our model predictions are basically in agreement with the previous observational results (Williams et al. 2009; Gogarten et al. 2010; Barker et al. 2011). What’s more, it can be also found that the stellar age of NGC 300 is older than that of M33 throughout the studied region, especially for the inner region of the NGC 300 disk, and the mean stellar age difference between the inner parts of the two galaxy disks is up to , while that between the outmost regions of them is . The older age of stars in NGC 300 than that in M33 indicates a lack of infall of primordial gas and a small fraction of stars formed at later times in NGC 300 disk.
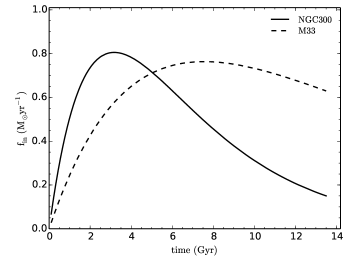
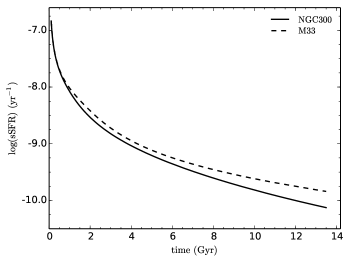
Specific star formation rate (sSFR) is defined as the ratio of the current SFR to the current stellar mass, . Thus, higher values of the sSFR indicate that a larger fraction of stars were formed recently, and it can be used to characterize the SFH of galaxies. The time evolution of gas infall rate and sSFR are shown in the left and right panel of Fig. 11, respectively. It can be seen from the left panel of Fig. 11 that the infall rate of NGC 300 given by our best-fitting model is gradually increasing with time and reaches its peak at about 10 Gyr ago, and then slowly drops down, while that of M33 achieves its peak around 6 Gyr ago and then gradually falls. Moreover, the infall rate of NGC 300 increases and falls faster than that of M33, and the present-day infall rate of NGC 300 is much lower than that of M33. This indicates that the buildup of the stellar disk of NGC 300 is faster than that of M33. At the same time, the right panel of Fig. 11 reveals that the sSFR of NGC 300 is lower than that of M33 during the whole evolution history, and the difference between them increases with time and reaches the maximum at the present time. This is also a suggestive of less gas infall and less active in star formation recently along the disk of NGC 300 than that of M33.
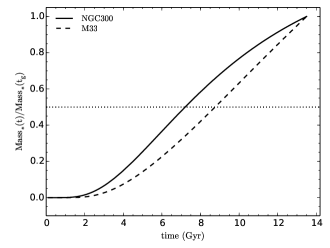
In Fig. 12, we display the best-fitting model predictions of the evolution of the stellar mass for both NGC 300 (solid line) and M33 (dashed line). To make the growth history of more visible, stellar masses are normalized to their present-day values, and to compute the growth rate, the horizontal dotted line in the panel marks when the stellar mass achieves 50% of its final value. It can be seen that both NGC 300 and M33 have been steadily increasing to their present-day values. What’s more, half of the total stellar mass of NGC 300 has been assembled during the last Gyr, while that of M33 has been accumulated during the last Gyr. That is to say, the mean age of stellar population in NGC 300 is older than that in M33.
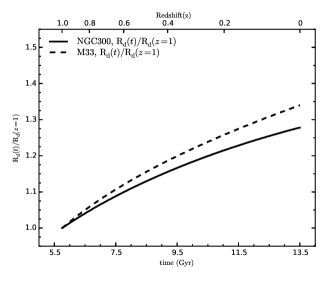
Fig. 13 plots the evolution of disk scale-length of NGC 300 (solid line) and M33 (dashed line) predicted by their own best-fitting models, which are normalized to their values at . It can be seen that the disk sizes of both NGC 300 and M33 show clear growth. Moreover, the scale-length of M33 changes more significant than that of NGC 300, which indicates that there is less fraction of stars formed recently in the disk of NGC 300 than that of M33.
To sum up, the aforementioned results suggest that the stellar population of NGC 300 is older than that of M33. There is a lack of primordial gas infall onto the disk of NGC 300 and a less fraction of stars formed recently in NGC 300 than in M33. Our results reinforce the recent results of Gogarten et al. (2010) and Guglielmo et al. (2015) that despite the two galaxies with similar stellar mass and morphology, they have experienced different histories due to their environmental differences.
5 Summary
NGC 300 is a bulge-less and isolated low-mass disk galaxy and has not experienced migration during its evolution history. In this work, we build a bridge for the disk galaxy NGC 300 between its observed properties and its evolution history by constructing a simple chemical evolution model. Some of our conclusions are as follows.
-
1.
Our results show that the model predictions are very sensitive to the adopted infall time-scale, but the outflow process plays an important role in shaping the gas-phase metallicity profiles along the disk of NGC 300 since it takes a large fraction of metals away from its disk during its evolution history.
-
2.
Using the classical methodology, we compare the model results with the corresponding observations to find the best combination of , and (i.e., 0.35, 2.47 and 0.9). As a result, the model adopting an inside-out formation scenario (i.e., ) and an appropriate gas outflow rate (i.e., ) can successfully reproduce the observed constraints of NGC 300. Our results suggest that NGC 300 likely experiences a rapid growth of its disk and the stellar population of it is predominately old, consistent with the previous observed results (Butler et al. 2004; Tikhonov et al. 2005; Gogarten et al. 2010).
-
3.
We also compared the best-fitting model predicted evolution history of NGC 300 with that of M33. We find that the mean stellar age of NGC 300 is older than that of M33, and there is a lack of primordial gas infall onto the disk of NGC 300 and a less fraction of stars formed recently in NGC 300 than in M33. The comparative study of the two bulge-less systems shows that local environmental difference may paly an important part in the secular evolution of the galaxy disks.
Acknowledgements.
We thank the anonymous referee whose comments and suggestions have improved the quality of this paper greatly. Xiaoyu Kang and Fenghui Zhang are supported by the National Natural Science Foundation of China (NSFC) grant No. 11403092, 11273053, 11033008, 11373063, and Yunnan Foundation No. 2011CI053. Ruixiang Chang is supported by the NSFC grant No.11373053, 11390373, and Strategic Priority Research Program ”The Emergence of Cosmological Structures” of the Chinese Academy of Sciences (CAS; grant XDB09010100).References
- Asplund et al. (2009) Asplund, M., Grevesse, N., Sauval, A. J., & Scott, P. 2009, ARA&A, 47, 481
- Baldry et al. (2012) Baldry, I. K., Driver, S. P., Loveday, J., et al. 2012, MNRAS, 421, 621
- Baldry et al. (2008) Baldry, I. K., Glazebrook, K., & Driver, S. P. 2008, MNRAS, 388, 945
- Barker et al. (2011) Barker, M. K., Ferguson, A. M. N., Cole, A. A., et al. 2011, MNRAS, 410, 504
- Barker et al. (2007) Barker, M. K., Sarajedini, A., Geisler, D., Harding, P., & Schommer, R. 2007, AJ, 133, 1125
- Barnes et al. (2001) Barnes, D. G., Staveley-Smith, L., de Blok, W. J. G., et al. 2001, MNRAS, 322, 486
- Barnes & Hernquist (1992) Barnes, J. E. & Hernquist, L. 1992, ARA&A, 30, 705
- Bauer et al. (2013) Bauer, A. E., Hopkins, A. M., Gunawardhana, M., et al. 2013, MNRAS, 434, 209
- Bernard et al. (2012) Bernard, E. J., Ferguson, A. M. N., Barker, M. K., et al. 2012, MNRAS, 420, 2625
- Bigiel et al. (2008) Bigiel, F., Leroy, A., Walter, F., et al. 2008, AJ, 136, 2846
- Binder et al. (2012) Binder, B., Williams, B. F., Eracleous, M., et al. 2012, ApJ, 758, 15
- Bland-Hawthorn et al. (2005) Bland-Hawthorn, J., Vlajić, M., Freeman, K. C., & Draine, B. T. 2005, ApJ, 629, 239
- Boissier & Prantzos (2000) Boissier, S. & Prantzos, N. 2000, MNRAS, 312, 398
- Braun & Thilker (2004) Braun, R. & Thilker, D. A. 2004, A&A, 417, 421
- Bresolin et al. (2009) Bresolin, F., Gieren, W., Kudritzki, R.-P., et al. 2009, ApJ, 700, 309
- Brook et al. (2012) Brook, C. B., Stinson, G. S., Gibson, B. K., et al. 2012, MNRAS, 426, 690
- Brooks et al. (2011) Brooks, A. M., Solomon, A. R., Governato, F., et al. 2011, ApJ, 728, 51
- Butler et al. (2004) Butler, D. J., Martínez-Delgado, D., & Brandner, W. 2004, AJ, 127, 1472
- Byun & Freeman (1995) Byun, Y. I. & Freeman, K. C. 1995, ApJ, 448, 563
- Chabrier (2003) Chabrier, G. 2003, ApJ, 586, L133
- Chang et al. (2010) Chang, R. X., Hou, J. L., Shen, S. Y., & Shu, C. G. 2010, ApJ, 722, 380
- Chang et al. (1999) Chang, R. X., Hou, J. L., Shu, C. G., & Fu, C. Q. 1999, A&A, 350, 38
- Chang et al. (2012) Chang, R. X., Shen, S. Y., & Hou, J. L. 2012, ApJ, 753, L10
- Chiappini et al. (2001) Chiappini, C., Matteucci, F., & Romano, D. 2001, ApJ, 554, 1044
- Chiosi (1980) Chiosi, C. 1980, A&A, 83, 206
- Corbelli & Schneider (1997) Corbelli, E. & Schneider, S. E. 1997, ApJ, 479, 244
- Dalcanton et al. (2009) Dalcanton, J. J., Williams, B. F., Seth, A. C., et al. 2009, ApJS, 183, 67
- de Vaucouleurs et al. (1991) de Vaucouleurs, G., de Vaucouleurs, A., Corwin, Jr., H. G., et al. 1991, S&T, 82, 621
- Deharveng et al. (1988) Deharveng, L., Caplan, J., Lequeux, J., et al. 1988, A&AS, 73, 407
- Deul & van der Hulst (1987) Deul, E. R. & van der Hulst, J. M. 1987, A&AS, 67, 509
- Erb (2008) Erb, D. K. 2008, ApJ, 674, 151
- Ferguson et al. (2007) Ferguson, A., Irwin2, M., Chapman, S., et al. 2007, Resolving the Stellar Outskirts of M31 and M33, ed. R. S. DE JONG, 239
- Finlator & Davé (2008) Finlator, K. & Davé, R. 2008, MNRAS, 385, 2181
- Fu et al. (2009) Fu, J., Hou, J. L., Yin, J., & Chang, R. X. 2009, ApJ, 696, 668
- Garnett (2002) Garnett, D. R. 2002, ApJ, 581, 1019
- Gogarten et al. (2010) Gogarten, S. M., Dalcanton, J. J., Williams, B. F., et al. 2010, ApJ, 712, 858
- Guglielmo et al. (2015) Guglielmo, V., Poggianti, B. M., Moretti, A., et al. 2015, MNRAS, 450, 2749
- Helou et al. (2004) Helou, G., Roussel, H., Appleton, P., et al. 2004, ApJS, 154, 253
- Ho et al. (2015) Ho, I.-T., Kudritzki, R.-P., Kewley, L. J., et al. 2015, MNRAS, 448, 2030
- Hou et al. (2000) Hou, J. L., Prantzos, N., & Boissier, S. 2000, A&A, 362, 921
- Jarrett et al. (2003) Jarrett, T. H., Chester, T., Cutri, R., Schneider, S. E., & Huchra, J. P. 2003, AJ, 125, 525
- Kang et al. (2012) Kang, X., Chang, R., Yin, J., et al. 2012, MNRAS, 426, 1455
- Kang et al. (2015) Kang, X., Chang, R., Zhang, F., Cheng, L., & Wang, L. 2015, MNRAS, 449, 414
- Karachentsev et al. (2003) Karachentsev, I. D., Grebel, E. K., Sharina, M. E., et al. 2003, A&A, 404, 93
- Karachentsev & Kaisina (2013) Karachentsev, I. D. & Kaisina, E. I. 2013, AJ, 146, 46
- Karachentsev et al. (2004) Karachentsev, I. D., Karachentseva, V. E., Huchtmeier, W. K., & Makarov, D. I. 2004, AJ, 127, 2031
- Kauffmann et al. (1993) Kauffmann, G., White, S. D. M., & Guiderdoni, B. 1993, MNRAS, 264, 201
- Kelvin et al. (2014) Kelvin, L. S., Driver, S. P., Robotham, A. S. G., et al. 2014, MNRAS, 444, 1647
- Kennicutt (1998) Kennicutt, Jr., R. C. 1998, ARA&A, 36, 189
- Kim et al. (2004) Kim, S. C., Sung, H., Park, H. S., & Sung, E.-C. 2004, Chinese J. Astron. Astrophys., 4, 299
- Koribalski et al. (2004) Koribalski, B. S., Staveley-Smith, L., Kilborn, V. A., et al. 2004, AJ, 128, 16
- Korotin et al. (2014) Korotin, S. A., Andrievsky, S. M., Luck, R. E., et al. 2014, MNRAS, 444, 3301
- Krumholz (2014) Krumholz, M. R. 2014, Phys. Rep, 539, 49
- Kubryk et al. (2014) Kubryk, M., Prantzos, N., & Athanassoula, E. 2014, ArXiv e-prints
- Leroy et al. (2008) Leroy, A. K., Walter, F., Brinks, E., et al. 2008, AJ, 136, 2782
- Leroy et al. (2013) Leroy, A. K., Walter, F., Sandstrom, K., et al. 2013, AJ, 146, 19
- Mathewson et al. (1975) Mathewson, D. S., Cleary, M. N., & Murray, J. D. 1975, ApJ, 195, L97
- Matteucci & Francois (1989) Matteucci, F. & Francois, P. 1989, MNRAS, 239, 885
- McConnachie et al. (2010) McConnachie, A. W., Ferguson, A. M. N., Irwin, M. J., et al. 2010, ApJ, 723, 1038
- Millar et al. (2011) Millar, W. C., White, G. L., Filipović, M. D., et al. 2011, Ap&SS, 332, 221
- Mollá & Díaz (2005) Mollá, M. & Díaz, A. I. 2005, MNRAS, 358, 521
- Muñoz-Mateos et al. (2007) Muñoz-Mateos, J. C., Gil de Paz, A., Boissier, S., et al. 2007, ApJ, 658, 1006
- Nantais et al. (2010) Nantais, J. B., Huchra, J. P., Barmby, P., & Olsen, K. A. G. 2010, AJ, 139, 1178
- Olsen et al. (2004) Olsen, K. A. G., Miller, B. W., Suntzeff, N. B., Schommer, R. A., & Bright, J. 2004, AJ, 127, 2674
- Pagel (1989) Pagel, B. E. J. 1989, Rev. Mexicana Astron. Astrofis., 18, 161
- Pagel et al. (1979) Pagel, B. E. J., Edmunds, M. G., Blackwell, D. E., Chun, M. S., & Smith, G. 1979, MNRAS, 189, 95
- Pilyugin et al. (2014) Pilyugin, L. S., Grebel, E. K., & Kniazev, A. Y. 2014, AJ, 147, 131
- Putman et al. (2009) Putman, M. E., Peek, J. E. G., Muratov, A., et al. 2009, ApJ, 703, 1486
- Rahman et al. (2011) Rahman, N., Bolatto, A. D., Wong, T., et al. 2011, ApJ, 730, 72
- Rana (1991) Rana, N. C. 1991, ARA&A, 29, 129
- Recchi et al. (2008) Recchi, S., Spitoni, E., Matteucci, F., & Lanfranchi, G. A. 2008, A&A, 489, 555
- Rogstad et al. (1979) Rogstad, D. H., Chu, K., & Crutcher, R. M. 1979, ApJ, 229, 509
- Rogstad et al. (1976) Rogstad, D. H., Wright, M. C. H., & Lockhart, I. A. 1976, ApJ, 204, 703
- Rosolowsky & Simon (2008) Rosolowsky, E. & Simon, J. D. 2008, ApJ, 675, 1213
- San Roman et al. (2010) San Roman, I., Sarajedini, A., & Aparicio, A. 2010, ApJ, 720, 1674
- Sánchez et al. (2013) Sánchez, S. F., Rosales-Ortega, F. F., Jungwiert, B., et al. 2013, A&A, 554, A58
- Schmidt (1959) Schmidt, M. 1959, ApJ, 129, 243
- Spitoni et al. (2010) Spitoni, E., Calura, F., Matteucci, F., & Recchi, S. 2010, A&A, 514, A73
- Stasińska et al. (2013) Stasińska, G., Peña, M., Bresolin, F., & Tsamis, Y. G. 2013, A&A, 552, A12
- Tikhonov et al. (2005) Tikhonov, N. A., Galazutdinova, O. A., & Drozdovsky, I. O. 2005, A&A, 431, 127
- Tinsley (1980) Tinsley, B. M. 1980, Fund. Cosmic Phys., 5, 287
- Tremonti et al. (2004) Tremonti, C. A., Heckman, T. M., Kauffmann, G., et al. 2004, ApJ, 613, 898
- Tully et al. (2006) Tully, R. B., Rizzi, L., Dolphin, A. E., et al. 2006, AJ, 132, 729
- Vila-Costas & Edmunds (1992) Vila-Costas, M. B. & Edmunds, M. G. 1992, MNRAS, 259, 121
- Vlajić et al. (2009) Vlajić, M., Bland-Hawthorn, J., & Freeman, K. C. 2009, ApJ, 697, 361
- Westmeier et al. (2011) Westmeier, T., Braun, R., & Koribalski, B. S. 2011, MNRAS, 410, 2217
- Wiegert & English (2014) Wiegert, T. & English, J. 2014, New A, 26, 40
- Williams et al. (2009) Williams, B. F., Dalcanton, J. J., Dolphin, A. E., Holtzman, J., & Sarajedini, A. 2009, ApJ, 695, L15
- Williams et al. (2013) Williams, B. F., Dalcanton, J. J., Stilp, A., et al. 2013, ApJ, 765, 120
- Wong & Blitz (2002) Wong, T. & Blitz, L. 2002, ApJ, 569, 157
- Yin et al. (2009) Yin, J., Hou, J. L., Prantzos, N., et al. 2009, A&A, 505, 497
- Zahid et al. (2014) Zahid, H. J., Dima, G. I., Kudritzki, R.-P., et al. 2014, ApJ, 791, 130
- Zaritsky et al. (1994) Zaritsky, D., Kennicutt, Jr., R. C., & Huchra, J. P. 1994, ApJ, 420, 87