Temperature Measurement during Thermonuclear X-ray Bursts with BeppoSAX
Abstract
We have carried out a study of temperature evolution during thermonuclear bursts in LMXBs using broad band data from two instruments onboard BeppoSAX, the MECS and the PDS. However, instead of applying the standard technique of time resolved spectroscopy, we have determined the temperature in small time intervals using the ratio of count rates in the two instruments assuming a blackbody nature of burst emission and different interstellar absorption for different sources. Data from a total of twelve observations of six sources were analysed during which 22 bursts were detected. We have obtained temperatures as high as 3.0 keV, even when there is no evidence of photospheric radius expansion. These high temperatures were observed in the sources within different broadband spectral states (soft and hard).
keywords:
X-rays: binaries; X-rays: bursts; stars: neutron1 INTRODUCTION
Thermonuclear X-ray bursts due to unstable nuclear burning of hydrogen and/or helium (Joss, 1977; Lamb and Lamb, 1978; Lewin et al., 1993, 1995; Strohmayer and Bildsten, 2006; Bhattacharyya, 2010) have been observed in nearly 80 neutron star low mass X-ray binaries (Liu et al., 2007; Galloway et al., 2008). These bursts offer a useful tool for the measurement of neutron star parameters (Bhattacharyya, 2010). Time resolved spectroscopy during bursts have been performed for many sources for the determination of neutron star radius by assuming that the entire surface emits in X-rays (e.g., van Paradijs, 1978; Galloway et al., 2008; Güver et al., 2012b). The background subtracted continuum spectra during these bursts are often fit using Planck (blackbody) function. The persistent emission prior to the burst is subtracted as background (Galloway et al., 2008; Bhattacharyya, 2010). In time resolved spectroscopy of the photospheric radius expansion bursts, when the photosphere falls back to the neutron star surface, the temperature has the highest value and the blackbody normalisation has the lowest value, which is also called the touchdown (e.g., Damen et al., 1989; Kuulkers et al., 2003). Time resolved spectroscopy during the cooling phase after the touchdown is the most widely used method for neutron star radius measurement (e.g., Lewin et al., 1993; Özel, 2006; Galloway et al., 2008; Özel et al., 2009; Güver et al., 2010a, b, 2012b, 2012a). The scattering of photons by the electrons and frequency dependence of the opacity in the neutron star atmosphere harden the spectrum, and shift it to higher energies (London et al., 1984, 1986; Syunyaev and Titarchuk, 1986; Ebisuzaki and Nakamura, 1988; Titarchuk, 1994; Madej et al., 2004; Majczyna et al., 2005; Bhattacharyya, 2010). Therefore, it is believed that the effective temperature is substantially smaller than the temperature obtained from the blackbody fit (e.g., Ebisuzaki et al., 1984; Galloway et al., 2008). The observed color temperature and flux is associated with the blackbody radius through (Lewin et al., 1993). Here, is the observed flux, is the blackbody temperature measured at infinity and refers to the source distance. The neutron star radius is estimated from the blackbody radius () via the following equation.
| (1) |
where, is the gravitational redshift and is the color correction factor
which is defined as the ratio of color temperature () and the effective
temperature () of the star (London et al., 1986; Madej et al., 2004; Majczyna et al., 2005; Suleimanov et al., 2011a, 2012). Color correction factor varies as a function of effective temperature and also depends on
effective gravitational acceleration, which determines the density profiles
of the atmospheric layers (Güver et al., 2012b). It has been found that X-ray burst cooling properties
are dependent on the accretion rate and the spectral states (Suleimanov et al., 2011b; Kajava et al., 2014).
Though a color correction factor close to 1.4 has often been used (Madej et al., 2004; Majczyna et al., 2005),
the most recent calculations by Suleimanov et al. (2012)
suggest that is in range of 1.8-1.9 when the luminosity is
close to Eddington luminosity () and its value decreases to a range of 1.4-1.5 with
the subsequent fall to 0.5 .
Assuming a constant value of color correction factor may lead to systematic change
in inferred apparent surface area (Güver et al., 2012b).
Hence, this is one of the sources for systematic
uncertainity while measuring the radius of a neutron star from X-ray bursts.
Even if a blackbody model
provides a good fit for the time resolved burst spectrum that is often measured with the proportional counters,
Nakamura et al. (1989) have reported deviations from a
blackbody. The authors observed a high energy tail during bursts
and have interpreted it as a result of comptonization of the burst emission
by hot plasma surrounding the neutron star.
For a peak temperature close to 2.5 keV, the emission peaks at 2.8kT, i.e 6-7 keV.
Therefore, in addition to the RXTE-PCA we expect to detect the bursts even with high energy instruments like
BeppoSAX-PDS, Suzaku-PIN, NuSTAR. However, simultaneous data at
energies below 10 keV with sufficient time resolution is also required to measure the temperature evolution and
this is possible with the MECS of BeppoSAX and also with NuSTAR.
Barrière et al. (2014), using NuSTAR data have reported a Type-I burst in GRS 1741.9–2853 that was
found to be 800 seconds long with mild Photospheric radius expansion (PRE).
The peak temperature of this burst was found to be 2.650.06 keV.
A large fraction of all the burst temperature studies have been done with RXTE-PCA in the energy range of 3-25 keV. We have estimated the temperature evolution in short intervals during bursts that were observed with BeppoSAX. We performed studies of bursts using the two instruments MECS and PDS on-board BeppoSAX. Since BeppoSAX data have lower count rates than RXTE-PCA we have used a new technique for measuring the temperature evolution. If a blackbody spectrum with a fixed absorption column density is fitted to the time resolved spectra, the temperature obtained is a function of the ratio of the count rates in two energy bands. Therefore, instead of a spectral fit of data with low statistical quality, we have used the hardness ratio (HR) to determine the temperature evolution. The paper is organised as : the second section describes the observations and data reduction procedure, the third and fourth sections describe the calibration and timing studies performed. The last section is dedicated to the implications of the results achieved.
2 OBSERVATIONS AND DATA REDUCTION
BeppoSAX had four co-aligned
narrow field instruments (NFI) (Boella et al., 1997) and a Wide Field Camera (WFC) (Jager et al., 1997).
The four NFIs are:
i) The Medium-Energy Concentrator Spectrometer (MECS) that consists of three grazing incidence telescopes each with
an imaging gas proportional counter that work in 1.3-10 keV band (Boella et al., 1997),
ii) The Low-Energy Concentrator Spectrometer (LECS), consisting of similar kind of imaging gas scintillation
proportional counters but with an ultra-thin (1.25 m) entrance window and working in the energy range of
0.1-10 keV (Parmar et al., 1997), iii) The High Pressure Gas Scintillation proportional Counter
(HPGSPC, 4-120 keV; Manzo et al. (1997))
and iv) The Phoswich Detection System (PDS, 15-300 keV; Frontera et al. (1997)).
The HPGSPC and PDS are non-imaging instruments.
The PDS detector is composed of 4 actively shielded NaI(Tl)/CsI(Na) phoswich scintillators
with a total geometric area of 795 .
Bursts were clearly detected over the entire energy range of 1.8-10 keV of MECS while in the case of PDS, most of the bursts were noticable only upto 30 keV, i.e. in the energy range of 15-30 keV. Therefore, we selected these two energy bands for estimating the hardness ratio.
We considered only those sources and observations for which bursts were observed
simultaneously in MECS and PDS. We have found a total of 22 bursts in 6 sources.
The log of observations is given in Table-1. Since MECS 2 and MECS 3 data were available for all
sources considered, we merged data from both these MECS. HEASOFT-6.12 and SAXDAS (version 2.3.3) were used for reduction
and extraction purposes.
Subsequently, the merged MECS event data files were used for extraction of light curves
with a binsize of 0.5 seconds using the ftools 111http://heasarc.gsfc.nasa.gov/ftools/ task xselect.
The source radius of corresponding to 95 of the
instrumental Point Spread Funcions was selected and appropriate good time intervals (GTI)
were applied.
The light curves were restricted to the energy band 1.8-10 keV using appropriate energy filters.
In case of PDS, the SAXDAS programs saxpipe and pdproducts were used
for creating the light curves with a bin time of 0.5 seconds.
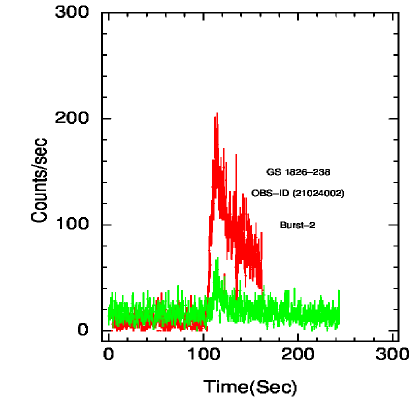
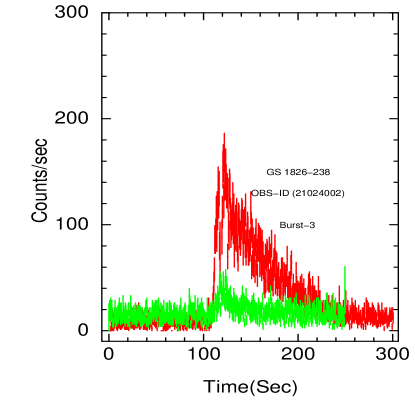
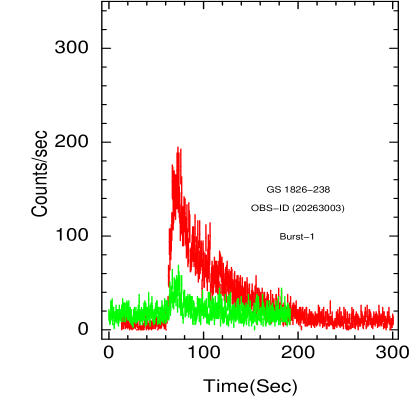
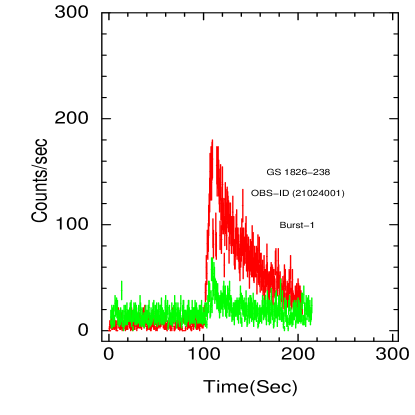
Figure-1 shows the time series for all the sources including about 100 secs of data before
and after the bursts. It is evident from the light curves shown in Figure-1
that the persistent emission is stable before and after the burst.
An interesting feature seen in one of the sources is the double peaked behaviour of the burst profile from PDS data
of the source SAX J1747–2853 (Observation ID-210320013). However, this feature was not seen
in the light curve created using MECS data. The burst profile of the same source created
using the WFC data also showed a prominent double peaked behaviour in
the high energy band (8-28) keV (Natalucci et al., 2000).
Similar kind of bi-horned profile from the X-ray burst in the higher energy band (PDS) has also been observed in X 1724-308.
We subtracted the average pre and post burst count rates to obtain only the burst profile
in the two energy bands, namely 1.3-10 keV and 15.0-30.0 keV.
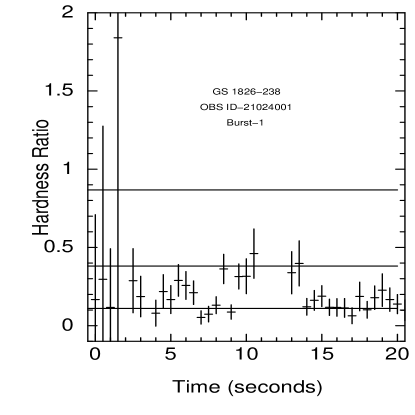
These burst profiles were then used to calculate the Hardness Ratio (HR) which is
defined as ratio of count rates between two instruments PDS
and MECS near the peak of these bursts (see, Figure-2).
A burst in 4U 1702–429 showed the maximum value of the hardness ratio of the order of 0.90.1. The three bursts in MXB 1728–34 reached a value upto 0.70.1 in the hardness. The burst obtained from the observation (ID-210320013) of SAX J1747–2853 in which PDS profile showed a double peak behaviour, the highest value seen was 0.950.18. However, the maximum value was close to 0.50.1 in the burst obtained from the other observation (ID-21032001) of SAX J1747–2853. For the bursts from the sources namely, SAX J1748.9–202, X 1724–308 and GS 1826–238, the highest values obtained for hardness ratio was close to 0.30.1.
| Source Name | Obs-ID | Observation Date | Number of Bursts | ||
|---|---|---|---|---|---|
| () | |||||
| 4U 1702–429 | 21224001 | 2000-08-24 | 3 | ||
| 4U 1702–429 | 21224002 | 2000-09-23 | 2 | ||
| X 1724–308 | 20105002 | 1996-08-17 | 1 | ||
| 4U 1728–34 | 20674001 | 1998-08-23 | 3 | ||
| SAX J1747–2853 | 21032001 | 2000-03-16 | 1 | ||
| SAX J1747–2853 | 210320013 | 2000-04-12 | 1 | ||
| SAX J1748.9–202 | 20549003 | 1998-08-26 | 1 | ||
| SAX J1748.9–202 | 21416001 | 2001-10-02 | 3 | ||
| GS 1826–238 | 20263003 | 1997-10-25 | 1 | ||
| GS 1826–238 | 21024001 | 1999-10-20 | 1 | ||
| GS 1826–238 | 21024002 | 2000-04-18 | 3 | ||
| GS 1826–238 | 20269001 | 1997-04-06 | 2 |
3 Temperature Measurements
Subsequently, after finding the values of hardness ratios during different bursts
in various sources, we aim at finding the corresponding temperatures.
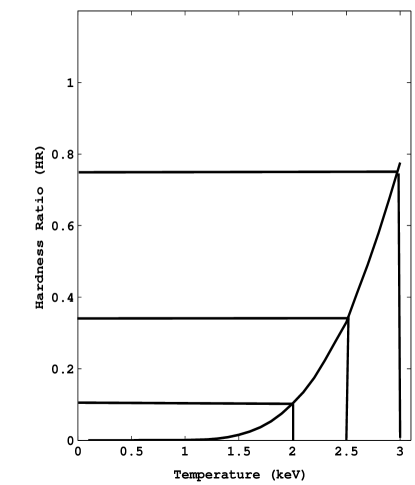
Using the assumption that during thermonuclear bursts, neutron star emits like a blackbody,
the hardness ratio, in principle can be directly converted to a corresponding blackbody temperature.
We simulated the absorbed blackbody spectrum using XSPEC.
The response files of MECS 2, MECS 3 and PDS released by
BeppoSAX Science Data Center (SDC) in 1997 along with corresponding ancillary files were used
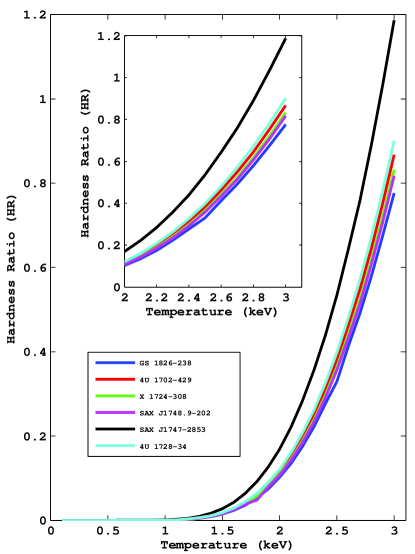
for this purpose. The simulated spectra at different temperatures
were used to calculate the expected hardness ratio between two instruments
at different blackbody temperatures for values appropriate for different sources.
For the simulation we have used the
bbodyrad model multiplied with interstellar
absorption component phabs which is available as a standard model
in XSPEC222https://heasarc.gsfc.nasa.gov/xanadu/xspec/manual/XSmodelPhabs.html .
The spectrum was simulated for temperature
values between 0.1-3 keV. Initially, we started with hydrogen column density ()=0.1
for obtaining the Temperature (T) versus Hardness ratio (HR) curve (see Figure-4).
Miller, Cackett, and Reis (2009) using high resolution grating spectra
showed that individual photoelectric absorption edges
observed in X-ray spectra of a number of X-ray binaries are independent of their spectral states.
Thus, one could fix the values of absorption in the interstellar medium to the previously
known values. For this reason we have fixed the values of to those of the
the non-burst spectra from the same set of observations.
These values are given in Table-1.
Using these respective values for each source
we obtained the values of temperature corresponding to
their hardness ratio (see Figure-4).
Next, using these simulated curves we measured the temperature evolution of all the bursts (Figure-5).
Spline interpolation was used for the
estimation of the temperatures. Errors on the temperature were estimated by propogating errors
on the count-rates.
From Figure-5, it is interesting to notice that the bursts in 4U 1702–429
with the maximum HR ratio values
close to 0.90.1 showed a temperature as high as 3.00.1 keV.
Here, we would like to mention that Güver et al. (2012b) discussed the bursts from 4U 1702–429
observed with RXTE (not the same bursts reported here from BeppoSAX)
and found that a blackbody does not provide a good
fit for these bursts which have low peak flux.
The maximum temperature seen in the bursts from 4U 1728–34 was 2.70.1 keV.
The burst from the source SAX J1747–2853, that showed
a double peaked burst profile in PDS exhibited a temperature upto 2.70.1 keV
while the remaining bursts had highest temperatures close to 2.20.1 keV.
The occurrence of high temperatures in some of the bursts was in agreement
with those observed with RXTE-PCA (see, e.g., Boutloukos et al., 2010).
We further investigated the spectral states of the sources that showed temperatures
in the range of 2.5-3.0 keV.
During the BeppoSAX observations 4U 1728–34 (Di Salvo et al., 2000) and SAX J1748.9–202 (in ’t Zand et al., 1999b)
were in soft spectral state while 4U 1702–429 (Church et al., 2014), SAX J1747–2853 (Natalucci et al., 2004),
GS 1826–238 (in ’t Zand et al., 1999a; del Sordo et al., 1999; Cocchi et al., 2001, 2011), X 1724–308 (Guainazzi et al., 1998)
were in hard spectral state.
An interesting feature to note from all the studies carried out by different authors
using the narrow field instruments (NFI) on-board
BeppoSAX was that the persistent emission was modelled as comptonized spectrum.
4 Summary and Discussions
We have presented an analysis of 22 X-ray bursts from 6 LMXB systems using the
data from the two instruments MECS and PDS onboard BeppoSAX.
The maximum allowed value of effective temperature
for Eddington limited luminosity is expected to be close to 1.7 keV for a neutron star
surrounded by an atmosphere of fully ionised hydrogen (Lewin et al., 1993).
If the effective temperature exceeds 2.0 keV for a neutron star
surrounded by an atmosphere of fully ionised helium, the radiative flux is greater than
Eddington flux (Boutloukos et al., 2010). Hence an effective temperature greater than 2 keV is not expected
in the thermonuclear bursts.
However, we have found that
temperatures attain values as high as 3.0 keV in some of the bursts.
It is believed that bursts occuring during different states (hard or soft)
exhibit a different behaviour.
During a soft state, bursts do not follow
theoretically predicted NS atmospheric models (Poutanen et al., 2014; Kajava et al., 2014).
To our surprise, it was found that the two sources 4U 1702-429 and 4U 1728–34 that
showed temperatures greater than 2.7 keV were in different spectral states,
4U 1702-429, in a hard state while 4U 1728–34 was in a soft state.
Two spectral states are believed to occur because of a change in the accretion geometry (Kajava et al., 2014).
It is even more difficult to understand a large effective temperature of some of the
bursts in two different spectral states, when the comptonisation effects would be
different. We note that usefulness for radius measurement of the X-ray bursts in soft state
has already been questioned (Poutanen et al., 2014; Kajava et al., 2014).
A considerable contribution from comptonisation
of the persistent emission or a deviation from a true blackbody spectrum
may lead to the high temperatures measured in the case of the burst from SAX J1747–2853.
This is also quite evident from the presence of a double peaked burst profile
only in PDS data. Alternatively,
there also seems to be a type of bursts where
the color temperature exceeds 2.5 keV in the same way as expected from PRE bursts but the corresponding
normalisation does not vary much (eg. Kaptein et al., 2000; van Straaten et al., 2001).
This kind of peculiar behaviour is believed to be due to sudden change in the color
correction factor. Boutloukos et al. (2010) have also discussed the temperatures greater than 2 keV during bursts with no evidence of
radius expansion in them, implying
super-Eddington fluxes.
The same authors suggest that these high temperatures could be due to
comptonization of the surface emission that alter its spectrum
as well as the relation between energy flux and apparent surface
area. The thermonuclear bursts detected with BeppoSAX provide
evidence of a significantly higher temperature of the bursts than expected or a significant
deviation from blackbody spectrum, perhaps by the process of comptonisation
, which is evident in the persistent emission during the same observations.
Acknowledgments
A.B would like to thank, Bryan.K.Ibry (NASA) and Jacob Rajan (RRI) for helping out during the installation of SAXDAS software. The research has made use of data obtained from High Energy Astrophysics Science Archive Research Center (HEASARC) and ASI Science Data Center. A.B also acknowledges IIT Ropar for financial assistance and Raman Research Institute (RRI) for providing local hospitality.
References
- Barrière et al. (2014) Barrière, N. M., Tomsick, J. A., Baganoff, F. K., Boggs, S. E., Christensen, F. E., Craig, W. W., Dexter, J., Grefenstette, B., Hailey, C. J., Harrison, F. A., Madsen, K. K., Mori, K., Stern, D., Zhang, W. W., Zhang, S., Zoglauer, A., May 2014. NuSTAR Detection of High-energy X-Ray Emission and Rapid Variability from Sagittarius Asstarf Flares. ApJ786, 46.
- Bhattacharyya (2010) Bhattacharyya, S., Apr. 2010. Measurement of neutron star parameters: A review of methods for low-mass X-ray binaries. Advances in Space Research 45, 949–978.
- Boella et al. (1997) Boella, G., Chiappetti, L., Conti, G., Cusumano, G., del Sordo, S., La Rosa, G., Maccarone, M. C., Mineo, T., Molendi, S., Re, S., Sacco, B., Tripiciano, M., Apr. 1997. The medium-energy concentrator spectrometer on board the BeppoSAX X-ray astronomy satellite. A&AS122, 327–340.
- Boutloukos et al. (2010) Boutloukos, S., Miller, M. C., Lamb, F. K., Sep. 2010. Super-Eddington Fluxes During Thermonuclear X-ray Bursts. ApJ720, L15–L19.
- Church et al. (2014) Church, M. J., Gibiec, A., Bałucińska-Church, M., 2014. The nature of the island and banana states in atoll sources and a unified model for low-mass X-ray binaries. MNRAS438, 2784.
- Cocchi et al. (2001) Cocchi, M., Bazzano, A., Natalucci, L., Ubertini, P., Heise, J., Kuulkers, E., in’t Zand, J. J. M., Jan. 2001. Beppo-SAX observation of the burster GS 1826-238. Advances in Space Research 28, 375–379.
- Cocchi et al. (2011) Cocchi, M., Farinelli, R., Paizis, A., May 2011. BeppoSAX view of the NS-LMXB GS 1826-238. A&A529, A155.
- Damen et al. (1989) Damen, E., Jansen, F., Penninx, W., Oosterbroek, T., van Paradijs, J., Lewin, H. G., Mar. 1989. Non-Planckian behaviour of burst spectra - Dependence of the blackbody radius on the duration of bursts. MNRAS237, 523–531.
- del Sordo et al. (1999) del Sordo, S., Frontera, F., Pian, E., Piraino, S., Oosterbroek, T., Harmon, B. A., Palazzi, E., Tavani, M., Zhang, S. N., Parmar, A. N., 1999. BeppoSAX Observations of the Galactic Source GS 1826-238 in a Hard X-Ray High State. Astrophysical Letters and Communications 38, 125.
- Di Salvo et al. (2000) Di Salvo, T., Iaria, R., Burderi, L., Robba, N. R., Oct. 2000. The Broadband Spectrum of MXB 1728-34 Observed by BeppoSAX. ApJ542, 1034–1040.
- Ebisuzaki and Nakamura (1988) Ebisuzaki, T., Nakamura, N., May 1988. The difference in hydrogen abundance between two classes of type I X-ray bursts. ApJ328, 251–255.
- Ebisuzaki et al. (1984) Ebisuzaki, T., Sugimoto, D., Hanawa, T., 1984. Are X-ray bursts really of super-Eddington luminosities? PASJ36, 551–566.
- Frontera et al. (1997) Frontera, F., Cinti, M. N., Dal Fiume, D., Landini, G., Nicastro, L., Orlandini, M., Zavattini, G., Costa, E., Schreiner, R. S., Rosza, C. M., Raby, P. S., White, J., Chiaverini, V., Monzani, F., Poulsen, J. M., Suetta, E., Oct. 1997. On-ground performance tests of the SAX/PDS detector. Nuovo Cimento C Geophysics Space Physics C 20, 797–809.
- Galloway et al. (2008) Galloway, D. K., Muno, M. P., Hartman, J. M., Psaltis, D., Chakrabarty, D., Dec. 2008. Thermonuclear (Type I) X-Ray Bursts Observed by the Rossi X-Ray Timing Explorer. ApJS179, 360–422.
- Guainazzi et al. (1998) Guainazzi, M., Parmar, A. N., Segreto, A., Stella, L., dal Fiume, D., Oosterbroek, T., Nov. 1998. The comptonized X-ray source X 1724-308 in the globular cluster Terzan 2. A&A339, 802–810.
- Güver et al. (2010a) Güver, T., Özel, F., Cabrera-Lavers, A., Wroblewski, P., Apr. 2010a. The Distance, Mass, and Radius of the Neutron Star in 4U 1608-52. ApJ712, 964–973.
- Güver et al. (2012a) Güver, T., Özel, F., Psaltis, D., Mar. 2012a. Systematic Uncertainties in the Spectroscopic Measurements of Neutron-star Masses and Radii from Thermonuclear X-Ray Bursts. II. Eddington Limit. ApJ747, 77.
- Güver et al. (2012b) Güver, T., Psaltis, D., Özel, F., Mar. 2012b. Systematic Uncertainties in the Spectroscopic Measurements of Neutron-star Masses and Radii from Thermonuclear X-Ray Bursts. I. Apparent Radii. ApJ747, 76.
- Güver et al. (2010b) Güver, T., Wroblewski, P., Camarota, L., Özel, F., Aug. 2010b. The Mass and Radius of the Neutron Star in 4U 1820-30. ApJ719, 1807–1812.
- in ’t Zand et al. (1999a) in ’t Zand, J. J. M., Heise, J., Kuulkers, E., Bazzano, A., Cocchi, M., Ubertini, P., Jul. 1999a. Broad-band X-ray measurements of GS 1826-238. A&A347, 891–896.
- in ’t Zand et al. (1999b) in ’t Zand, J. J. M., Verbunt, F., Strohmayer, T. E., Bazzano, A., Cocchi, M., Heise, J., van Kerkwijk, M. H., Muller, J. M., Natalucci, L., Smith, M. J. S., Ubertini, P., May 1999b. A new X-ray outburst in the globular cluster NGC 6440: SAX J1748.9-2021. A&A345, 100–108.
- Jager et al. (1997) Jager, R., Mels, W. A., Brinkman, A. C., Galama, M. Y., Goulooze, H., Heise, J., Lowes, P., Muller, J. M., Naber, A., Rook, A., Schuurhof, R., Schuurmans, J. J., Wiersma, G., Nov. 1997. The Wide Field Cameras onboard the BeppoSAX X-ray Astronomy Satellite. A&AS125, 557–572.
- Joss (1977) Joss, P. C., Nov. 1977. X-ray bursts and neutron-star thermonuclear flashes. Nature270, 310–314.
- Kajava et al. (2014) Kajava, J. J. E., Nättilä, J., Latvala, O.-M., Pursiainen, M., Poutanen, J., Suleimanov, V. F., Revnivtsev, M. G., Kuulkers, E., Galloway, D. K., Dec. 2014. The influence of accretion geometry on the spectral evolution during thermonuclear (type I) X-ray bursts. MNRAS445, 4218–4234.
- Kaptein et al. (2000) Kaptein, R. G., in’t Zand, J. J. M., Kuulkers, E., Verbunt, F., Heise, J., Cornelisse, R., Jun. 2000. Discovery of 1RXS J171824.2-402934 as an X-ray burster. A&A358, L71–L74.
- Kuulkers et al. (2003) Kuulkers, E., den Hartog, P. R., in’t Zand, J. J. M., Verbunt, F. W. M., Harris, W. E., Cocchi, M., Feb. 2003. Photospheric radius expansion X-ray bursts as standard candles. A&A399, 663–680.
- Lamb and Lamb (1978) Lamb, D. Q., Lamb, F. K., Feb. 1978. Nuclear burning in accreting neutron stars and X-ray bursts. ApJ220, 291–302.
- Lewin et al. (1993) Lewin, W. H. G., van Paradijs, J., Taam, R. E., Sep. 1993. X-Ray Bursts. Space Sci. Rev.62, 223–389.
- Lewin et al. (1995) Lewin, W. H. G., van Paradijs, J., Taam, R. E., 1995. X-ray bursts. X-ray Binaries, 175–232.
- Liu et al. (2007) Liu, Q. Z., van Paradijs, J., van den Heuvel, E. P. J., Jul. 2007. A catalogue of low-mass X-ray binaries in the Galaxy, LMC, and SMC (Fourth edition). A&A469, 807–810.
- London et al. (1984) London, R. A., Howard, W. M., Taam, R. E., Dec. 1984. The spectra of X-ray bursting neutron stars. ApJ287, L27–L30.
- London et al. (1986) London, R. A., Taam, R. E., Howard, W. M., Jul. 1986. Model atmospheres for X-ray bursting neutron stars. ApJ306, 170–182.
- Madej et al. (2004) Madej, J., Joss, P. C., Różańska, A., Feb. 2004. Model Atmospheres and X-Ray Spectra of Bursting Neutron Stars: Hydrogen-Helium Comptonized Spectra. ApJ602, 904–912.
- Majczyna et al. (2005) Majczyna, A., Madej, J., Joss, P. C., Różańska, A., Feb. 2005. Model atmospheres and X-ray spectra of bursting neutron stars. II. Iron rich comptonized spectra. A&A430, 643–654.
- Manzo et al. (1997) Manzo, G., Giarrusso, S., Santangelo, A., Ciralli, F., Fazio, G., Piraino, S., Segreto, A., Apr. 1997. The high pressure gas scintillation proportional counter on-board the BeppoSAX X-ray astronomy satellite. A&AS122, 341–356.
- Nakamura et al. (1989) Nakamura, N., Dotani, T., Inoue, H., Mitsuda, K., Tanaka, Y., Matsuoka, M., 1989. TENMA observation of X-ray bursts from X1608-52. PASJ41, 617–639.
- Natalucci et al. (2004) Natalucci, L., Bazzano, A., Cocchi, M., Ubertini, P., Cornelisse, R., Heise, J., in ’t Zand, J. J. M., Mar. 2004. Two spectral states of the transient X-ray burster SAX J1747.0-2853. A&A416, 699–702.
- Natalucci et al. (2000) Natalucci, L., Bazzano, A., Cocchi, M., Ubertini, P., Heise, J., Kuulkers, E., in’t Zand, J. J. M., Nov. 2000. Broadband Observations of the New X-Ray Burster SAX J1747.0-2853 during the 1998 March Outburst. ApJ543, L73–L76.
- Özel (2006) Özel, F., Jun. 2006. Soft equations of state for neutron-star matter ruled out by EXO 0748 - 676. Nature441, 1115–1117.
- Özel et al. (2009) Özel, F., Güver, T., Psaltis, D., Mar. 2009. The Mass and Radius of the Neutron Star in EXO 1745-248. ApJ693, 1775–1779.
- Parmar et al. (1997) Parmar, A. N., Martin, D. D. E., Bavdaz, M., Favata, F., Kuulkers, E., Vacanti, G., Lammers, U., Peacock, A., Taylor, B. G., Apr. 1997. The low-energy concentrator spectrometer on-board the BeppoSAX X-ray astronomy satellite. A&AS122, 309–326.
- Poutanen et al. (2014) Poutanen, J., Nättilä, J., Kajava, J. J. E., Latvala, O.-M., Galloway, D. K., Kuulkers, E., Suleimanov, V. F., Aug. 2014. The effect of accretion on the measurement of neutron star mass and radius in the low-mass X-ray binary 4U 1608-52. MNRAS442, 3777–3790.
- Strohmayer and Bildsten (2006) Strohmayer, T., Bildsten, L., Apr. 2006. New views of thermonuclear bursts. pp. 113–156.
- Suleimanov et al. (2011b) Suleimanov, V., Poutanen, J., Revnivtsev, M., Werner, K., Dec. 2011b. A Neutron Star Stiff Equation of State Derived from Cooling Phases of the X-Ray Burster 4U 1724-307. ApJ742, 122.
- Suleimanov et al. (2011a) Suleimanov, V., Poutanen, J., Werner, K., Mar. 2011a. X-ray bursting neutron star atmosphere models: spectra and color corrections. A&A527, A139.
- Suleimanov et al. (2012) Suleimanov, V., Poutanen, J., Werner, K., Sep. 2012. X-ray bursting neutron star atmosphere models using an exact relativistic kinetic equation for Compton scattering. A&A545, A120.
- Syunyaev and Titarchuk (1986) Syunyaev, R. A., Titarchuk, L. G., Dec. 1986. On the Spectra of X-Ray Bursters. Soviet Astronomy Letters 12, 359–364.
- Titarchuk (1994) Titarchuk, L., Jul. 1994. On the specta of X-ray bursters: Expansion and contraction stages. ApJ429, 340–355.
- van Paradijs (1978) van Paradijs, J., Aug. 1978. Average properties of X-ray burst sources. Nature274, 650–653.
- van Straaten et al. (2001) van Straaten, S., van der Klis, M., Kuulkers, E., Méndez, M., Apr. 2001. An Atlas of Burst Oscillations and Spectral Properties in 4U 1728-34. ApJ551, 907–920.
![[Uncaptioned image]](/html/1510.04848/assets/x1.png)
![[Uncaptioned image]](/html/1510.04848/assets/x2.png)
![[Uncaptioned image]](/html/1510.04848/assets/x3.png)
![[Uncaptioned image]](/html/1510.04848/assets/x4.png)
![[Uncaptioned image]](/html/1510.04848/assets/x5.png)
![[Uncaptioned image]](/html/1510.04848/assets/x6.png)
![[Uncaptioned image]](/html/1510.04848/assets/x7.png)
![[Uncaptioned image]](/html/1510.04848/assets/x8.png)
![[Uncaptioned image]](/html/1510.04848/assets/x9.png)
![[Uncaptioned image]](/html/1510.04848/assets/x10.png)
![[Uncaptioned image]](/html/1510.04848/assets/x11.png)
![[Uncaptioned image]](/html/1510.04848/assets/x12.png)
![[Uncaptioned image]](/html/1510.04848/assets/x13.png)
![[Uncaptioned image]](/html/1510.04848/assets/x14.png)
![[Uncaptioned image]](/html/1510.04848/assets/x15.png)
![[Uncaptioned image]](/html/1510.04848/assets/x16.png)
![[Uncaptioned image]](/html/1510.04848/assets/x17.png)
![[Uncaptioned image]](/html/1510.04848/assets/x18.png)
![[Uncaptioned image]](/html/1510.04848/assets/x23.png)
![[Uncaptioned image]](/html/1510.04848/assets/x24.png)
![[Uncaptioned image]](/html/1510.04848/assets/x25.png)
![[Uncaptioned image]](/html/1510.04848/assets/x26.png)
![[Uncaptioned image]](/html/1510.04848/assets/x27.png)
![[Uncaptioned image]](/html/1510.04848/assets/x28.png)
![[Uncaptioned image]](/html/1510.04848/assets/x29.png)
![[Uncaptioned image]](/html/1510.04848/assets/x30.png)
![[Uncaptioned image]](/html/1510.04848/assets/x31.png)
![[Uncaptioned image]](/html/1510.04848/assets/x32.png)
![[Uncaptioned image]](/html/1510.04848/assets/x33.png)
![[Uncaptioned image]](/html/1510.04848/assets/x34.png)
![[Uncaptioned image]](/html/1510.04848/assets/x35.png)
![[Uncaptioned image]](/html/1510.04848/assets/x36.png)
![[Uncaptioned image]](/html/1510.04848/assets/x37.png)
![[Uncaptioned image]](/html/1510.04848/assets/x38.png)
![[Uncaptioned image]](/html/1510.04848/assets/x39.png)
![[Uncaptioned image]](/html/1510.04848/assets/x40.png)


![[Uncaptioned image]](/html/1510.04848/assets/x47.png)
![[Uncaptioned image]](/html/1510.04848/assets/x48.png)
![[Uncaptioned image]](/html/1510.04848/assets/x49.png)
![[Uncaptioned image]](/html/1510.04848/assets/x50.png)
![[Uncaptioned image]](/html/1510.04848/assets/x51.png)
![[Uncaptioned image]](/html/1510.04848/assets/x52.png)
![[Uncaptioned image]](/html/1510.04848/assets/x53.png)
![[Uncaptioned image]](/html/1510.04848/assets/x54.png)
![[Uncaptioned image]](/html/1510.04848/assets/x55.png)
![[Uncaptioned image]](/html/1510.04848/assets/x56.png)
![[Uncaptioned image]](/html/1510.04848/assets/x57.png)
![[Uncaptioned image]](/html/1510.04848/assets/x58.png)
![[Uncaptioned image]](/html/1510.04848/assets/x59.png)
![[Uncaptioned image]](/html/1510.04848/assets/x60.png)
![[Uncaptioned image]](/html/1510.04848/assets/x61.png)
![[Uncaptioned image]](/html/1510.04848/assets/x62.png)
![[Uncaptioned image]](/html/1510.04848/assets/x63.png)
![[Uncaptioned image]](/html/1510.04848/assets/x64.png)


