Energy Model for Vesicle-based Active Transport Communication
Energy Model for Vesicle-Based
Active Transport Molecular Communication
Abstract
In active transport molecular communication (ATMC), information particles are actively transported from a transmitter to a receiver using special proteins. Prior work has demonstrated that ATMC can be an attractive and viable solution for on-chip applications. The energy consumption of an ATMC system plays a central role in its design and engineering. In this work, an energy model is presented for ATMC and the model is used to provide guidelines for designing energy efficient systems. The channel capacity per unit energy is analyzed and maximized. It is shown that based on the size of the symbol set and the symbol duration, there is a vesicle size that maximizes rate per unit energy. It is also demonstrated that maximizing rate per unit energy yields very different system parameters compared to maximizing the rate only.
Index Terms:
Molecular communications, vesicle-based active transport, energy model.I Introduction
Molecular communication (MC) is a new interdisciplinary research paradigm, where small particles such as molecules are used to convey information [1]. At micro-scales, where the size of the transmitter and receiver are a few micrometers, the energy budgets of the nodes introduce a crucial limitation in terms of system performance[2]. In a typical micro-scale unit, due to the device's scale, energy storage can be very challenging. For example to overcome this challenge, some of the previous works have proposed energy harvesting techniques, where energy is harvested from the environment through chemical reactions [3]. The rate at which energy can be harvested is typically a constant, and thus understanding the energy consumption of a molecular communication system plays an important role in designing the system. This work focuses on micro-scales MC in lab-on-a-chip devices, and provides an energy model that could be used for system design and optimization.
In the literature, various MC propagation schemes have been proposed for on-chip communications, such as active transport using molecular motors [4], molecular communication via diffusion[5, 6, 7, 8] and diffusion with flow [9], calcium signaling [10], and bacterium-based communication [11]. In [9], it was shown that diffusion-based molecular communication can be very slow for on-chip applications. However, active transport using stationary kinesin molecular motors and microtubule (MT) filaments, which is called active transport molecular communication (ATMC) in this work, is a viable propagation scheme for on-chip applications. In this scheme, the surface of a chip is covered with special proteins called kinesin. Kinesin mobilizes special tube like structures called microtubules (MT) through chemical reactions. This process is sometimes called kinesin-MT motility. In [12], it was shown that electrical currents can be used to control the speed and direction of motion of MT filament, and in [13] kinesin-MT motility was used for high-throughput molecular transport and assembly in microfluidics. In [14], it was demonstrated that this technique can be used to transport vesicles in an on-chip device. The MT motility was modeled mathematically in [15], where it is shown that the motion of the MT in an on-chip device can be captured using Monte Carlo techniques.
Some of the prior work that have considered ATMC from a communication engineering perspective include: a complete simulation environment for ATMC in [16], different mathematical models for the ATMC in [17], and the channel design and optimization of ATMC in [18, 19, 20].
In this work, an energy consumption model for ATMC system is derived. An important aspect of any communication system is the energy per bit requirements, which is the amount of energy required to transfer a single bit from the transmitter to the receiver. In [2], the energy model for diffusion-based MC in a 3-D environment is presented. However, to the best of our knowledge, there is no energy model proposed for ATMC systems in the MC domain. Our contributions in this work are as follows. First, a complete end-to-end energy model for ATMC systems is derived. Then using this model, system performance is analyzed by evaluating information rate per unit energy. Since tractable closed-form expression for the ATMC information rates do not exist, Monte Carlo simulations are used for finding the system parameter that maximize rate per unit energy. It is shown that depending on the size of the symbol set and the symbol duration, there is an optimal size for the information-carrying vesicles. The size of vesicles impact the system performance in two ways: first, they can change the probability of arrival at the receiver; second, the size of the vesicles effects the amount of energy required to create the vesicle. Finally, it is demonstrated that when maximizing rate per unit energy, the optimal system parameters may be very different from the case where only the rate is maximized.
The rest of the paper is organized as follows. In Section II, the system model for on-chip ATMC is presented. Then, in Section III, energy consumption by each system component is model. An end-to-end energy model for the ATMC system is presented in Section IV, and the problem of maximizing information rate per unit energy is formulated. Finally, in Section V, Monte Carlo simulations are used to provide design guideposts for system parameters such that information rate per unit energy is maximized.
II Communication System Model
The ATMC scheme considered in this paper is based on MT filament motility over immobilized kinesin molecular motor structures [14]. In nature, MTs are one of the components of the cytoskeletal structure of the cells. They help cells to keep their structure and also act as a platform for intercellular transport. Kinesin is a molecular motor that has two “leg-like” structures, which are used to “walk” over MT tracks. This process is powered by adenosine triphosphate (ATP) hydrolysis reaction, where ATP is converted into adenosine diphosphate (ADP). Inside cells MTs act as tracks and kinesin as locomotives transporting cargoes.
In [21], it was shown that a single stationary kinesin can move an MT filament. Note that the moving entity is the MT filament not the molecular motor structure. Later it was shown that kinesin covered substrates can create MT motility in an on-chip device, and can also be used to transport cargoes from one location to another [14]. In [18], it was demonstrated that using information particles as cargoes, a complete MC system can be implemented based on ATMC.
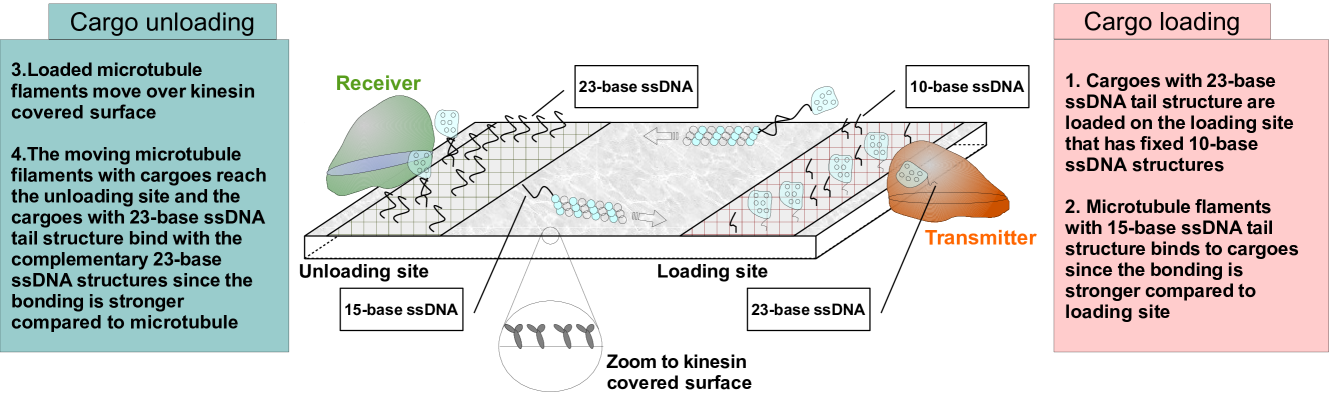
In Fig. 1, the main entities of an ATMC system are depicted: the transmitter node, glass substrate that is covered with stationary kinesin, cargo vesicles that have single-stranded DNA (ssDNA) tails, MT filaments, and the receiver node. The transmitter node, which is assumed to be a synthetic cell, is responsible for generating the vesicles. These vesicles are roughly spherical and have a similar structure as the cell membrane. The walls of the vesicles are generally constructed from phospolipids. The glass substrate, from a communication perspective, has two special regions: loading and unloading zones. The transport mechanism between these zones uses DNA hybridization and stationary kinesin that enables MT motility.
II-A DNA Hybridization & Transport Mechanism of ATMC
Generally, DNA molecules are composed of two polymer strands that bond together in a helical fashion through non-covalent bonds. The two strands can come apart to form two ssDNA molecules. In molecular biology, hybridization is a phenomenon in which ssDNA molecules anneal to DNA. Hence, complementary ssDNA structures can be used for selective hybridization to engineer the vesicle anchoring, pick up and drop off processes. Table I shows the ssDNA sequences attached to the different components of the system.
| Location | ssDNA sticky end region sequence |
|---|---|
| Cargo Tail | TGT GCAACACTAC AATCAGCGAA |
| Loading Site | TTCGCTGATT |
| MT (cargo carrier) | TTCGCTGATT GTAGT |
| Unloading Site | TTCGCTGATT GTAGTGTTGC ACA |
Note that the length of the ssDNAs attached to the loading site is designed to be much shorter than the ones attached to the cargo. When a cargo is anchored to an ssDNA at the loading site, there are 13-bases that are not connected. This partial DNA hybridization would allow the MT to load the vesicle from its anchoring position at the loading site when it moves close to the vesicle. The main steps of the transport mechanism are listed below:
-
1.
vesicles/cargoes with 23-base ssDNA tails are anchored to the loading site that is covered with 10-base ssDNA structures
-
2.
MT filaments covered with 15-base ssDNA pick up the vesicles when they glide close to it.
-
3.
vesicles/cargoes are unloaded at the unloading site, which is covered with 23-base ssDNA structures, when a loaded MT filament glides by.
II-B Propagation Dynamics
Although this form of active transport has been implemented and tested in wet labs [14], it is very difficult to obtain the statistical data that are needed for studying the communication engineering aspects of the system using experimentation. Therefore, previous works have relied on computer simulations to study these systems [17, 18, 9]. In this work, the simulation environment presented in [18] is utilized.
In the simulation environment, the MT filaments move only in the x-y directions and do not move in the z direction (i.e., they move on the planar glass substrate and do not move along the height of the channel). This is a realistic representation of the motion of MT, since they always move right on top of kinesin-covered surface. During each time interval , the MT filaments travel to a new coordinates according to
| (1) | ||||
where , , , and correspond to the x and y coordinates, step size, and angle of direction of motion at the time interval, respectively. At each step, a sample of is generated acoording to a Gaussian distribution with the following parameters
| (2) |
where , , and correspond to the Gaussian distribution with mean and the variance , the average velocity of the MT, and the diffusion coefficient of the MT, respectively. The angle is the sum of the angle in the previous step and the angular change, where the angular change is also a Gaussian random variable given as
| (3) | ||||
where corresponds to the persistence length of the MT’s trajectory. These system parameters are typically and as was shown in [15].
The MT filaments are assumed to be without a cargo and placed randomly on the glass substrate. Moreover, the initial direction of motion for each MT is selected randomly from the range . From experimental observations, an MT loads a vesicle only if it passes in close proximity of the vesicle in the loading zone [14]. Therefore, the loading zone is divided into squares forming a grid, where each square in the grid has the same length as the diameter of the vesicles. In the simulations, it is assumed that an MT loads a vesicle if it passes the square containing the vesicle. The reader is referred to [18] for a more detailed explanation of the simulation environment.
III Energy Model for ATMC Components
In this paper, we consider the MC systems in which the communication nodes are able to produce and store energy. Some of the produced energy is used by routine activities of the unit, while the rest is available for the communication processes. In the rest of this work, only the energy consumed by the communication system is considered.
As shown in Fig. 1, it is assumed that the transmitter and the receiver modules are synthetic cells. In our communication model, vesicles are used to carry information, and it is assumed that information is encoded in the number of vesicles released by the transmitter.
In a vesicle-based active transport system, energy is spent for the following steps: vesicle synthesis by the synthetic transmitter cell; carrying vesicles from inside the synthetic transmitter cell to the loading zone; anchoring the vesicles at the loading zone; loading vesicles to MTs; MT motility and vesicle transport; unloading the vesicles at the unloading zone.
The first step in the communication process is vesicle synthesis at the synthetic transmitter cell. As mentioned before, vesicles are hollow spheres whose walls are constructed out of a variety of structures, most notably phospholipids. The cost of synthesizing one phospholipid molecule is 1 unit of ATP [22], which in turn equals [3]. In a secretory vesicle, there are 5 phospholipids in area [3]. Thus, the total cost of synthesizing a vesicle, , with a radius of is
| (4) |
Next step is for the transmitter to carry the vesicle from the internal synthesis location to the loading zone. The vesicle moves along MT tracks to the membrane of the synthetic transmitter cell with the help of the motor protein kinesin. As was explained in the previous section, ATP hydrolysis reaction creates the kinetic energy and causes the kinesin to “walk” on MT tracks. For each ATP molecule used by kinesin, it travels carrying the vesicle with it [23]. It is assumed that the total distance that needs to be traveled is roughly half of the transmitter node’s radius. Hence, the overall cost of this intranode transportation, , per vesicle is
| (5) |
where denotes the radius of the transmitter node.
The vesicles released by the transmitter will be trapped at the loading zone via DNA hybridization. Note that the length of an ssDNA attached to the loading zone is much shorter than that attached to the cargo. Therefore, MTs with longer ssDNA strands can easily pick up the cargoes. Energy cost of hybridization depends on the length of the ssDNA and the bond energies associated with different bases Adenine, Thymine, Guanine, and Cytosine. Adenine and Thymine have two hydrogen bonds while Guanine and Cytosine have three hydrogen bonds, where the energy of each hydrogen bond is [3]. Thus, the energy of these bonds is given by
| (6) |
where , , and represent the number of Adenine, Thymine, Guanine, and Cytosine in the ssDNA, respectively. For the system considered in this work, the ssDNA sequences for each component is given in Table I. The length of the used ssDNAs is 10 base-pairs (, ) for anchoring the information particle at the loading zone , 15 base-pairs (, ) for attaching to the MT and 23 base-pairs (, ) for drop off at the unloading zone. Therefore, the energy required for anchoring, loading and drop-off are
| (7) | ||||
| (8) | ||||
| (9) |
respectively.
Next, the MT moves on the kinesin covered surface and the loaded cargoes are transported by motile MTs gliding over kinesin covered substrate to the unloading site. As was mentioned earlier, the motor protein kinesin takes a single step along the MT for each ATP molecule it hybridizes, where the distance traveled is about on average [24]. To calculate the number of ATP molecules used by kinesin per unit time, the average speed of kinesin is used. In [24], this value was observed to be . Therefore, on average the kinesin goes through 100 ATP hydrolysis reactions per second. Let be the density of kinesin molecules on the substrate. Typically, this density can be between 50 per to 100 per [25]. Let be the average length of MTs. Then, the overall cost of MT motion for time duration , , is
| (10) |
where is the average number of kinesin that are in contact with the MT filament at any given time. Note that this is a good estimate for this value since the MT is in diameter and can be regarded as a line with no width.
IV Energy Model for Communication
An end-to-end energy model for the ATMC channel is presented in this section. It is assumed that the information is conveyed through the number of vesicles transported. Even if the information-carrying molecules are inside the vesicles, the more vesicles transported, the more information transported. Therefore, this assumption is valid for this channel.
Let be the number of vesicles generated and released by the transmitter, and let be the number that is received after a symbol interval . Let the probability mass function (PMF) be the input distribution, and the conditional PMF represent the channel. The average total energy used by this communication system is
| (11) | ||||
where , , , , , and are the energy models for vesicle generation, intracellular transport, transmission zone attachment, MT motion, vesicle loading, and unloading given in the previous section. The is expectation, where both expectations can be calculated from and , and is the number of MTs in the channel.
From the expression for the total energy, it is observed that three system parameters have a significant effect on the energy consumption of the ATMC system: the size of the vesicles , the symbol interval (i.e. time per channel use) , and the input symbol set size and its PMF . Our goal in this work is to provide design guidelines for an ATMC system with limited energy budget. This problem is formulated as
| (12) |
where is mutual information between the channel input and the output. Since there are no closed-form expressions for mutual information for ATMC channel [17], Monte Carlo simulations are used to provide design guidelines for the system parameters that maximize this term. In particular, in [9], it is shown that Monte Carlo simulations could be used to estimate . The Blahuat-Arimoto [26, 27] algorithm is then employed to find the input probability distribution that maximizes mutual information. Then, different system parameters are changed and the effects on information rate per unit energy are observed. In the next section, the simulation results are presented, and optimal design strategies discussed. In the simulations, it is assumed that the channel is memoryless. This assumption can be justified in two ways. First, the symbol intervals can be made large enough to reduce and remove inter-symbol interference. Second, it is possible to use chemical reactions (e.g. using enzymes) to destroy the vesicles that remain in the channel [28, 29, 30]. Relaxing this assumption and studying the resulting system is future work.
V Results & Energy Limited Design
Monte Carlo simulation are used in this section to study the effects of different system parameters on the total energy expenditure, and to provide guideposts for energy efficient design that maximizes information rate per unit energy. In the simulations, it is assumed that the input symbol set is , where the elements are the number of vesicles generated and released by the transmitter. Let be the cardinality of the message set. Then at the beginning of each symbol duration (i.e. time per channel use), vesicles are released by the transmitter. In the simulations, the channel dimensions are assumed to be , where the separation distance between the transmitter and the receiver is . It is also assumed that the transmitter is placed in its optimal location according to [18], the length of the MT is , there are 15 MTs in the channel, and each MT can load multiple vesicles, up to a maximum. This maximum is assumed to be equal to the half the length of the MT divided by the diameter of the vesicles. All these parameters are based on laboratory experimentation in [14].
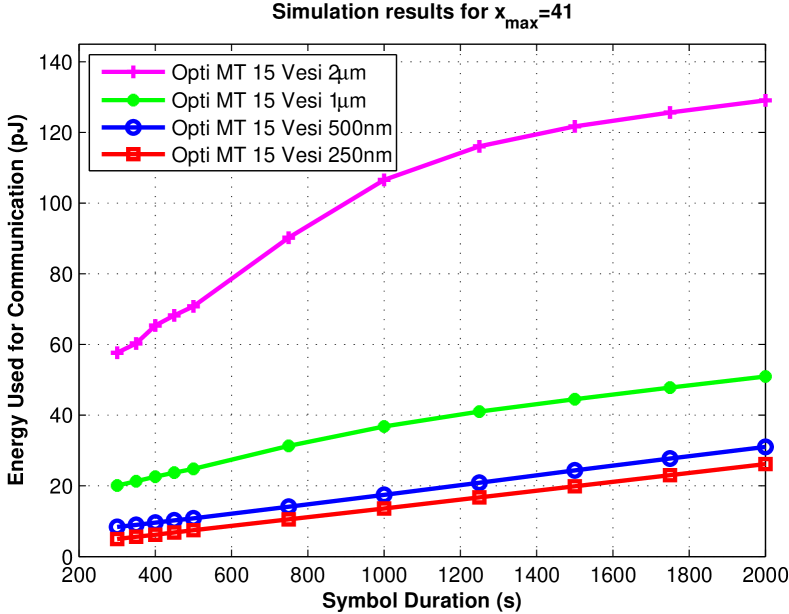
First, we analyze the effects of the symbol duration and the size of the vesicles. Fig. 2 shows the energy used by the communication system as a function of symbol duration. The four curves show the results for different sized vesicles with diameters of 250 nm, 500 nm, , and . The size of the symbol set is fixed at 41 (i.e. the number of vesicles that could be released during each symbol duration is between 0 to 40). From the figure it is observed that the energy increases linearly with symbol duration and non-linearly with the size of the vesicle. The energy consumption tends to be in the order of a few pico-joules to a few hundred pico-joules.
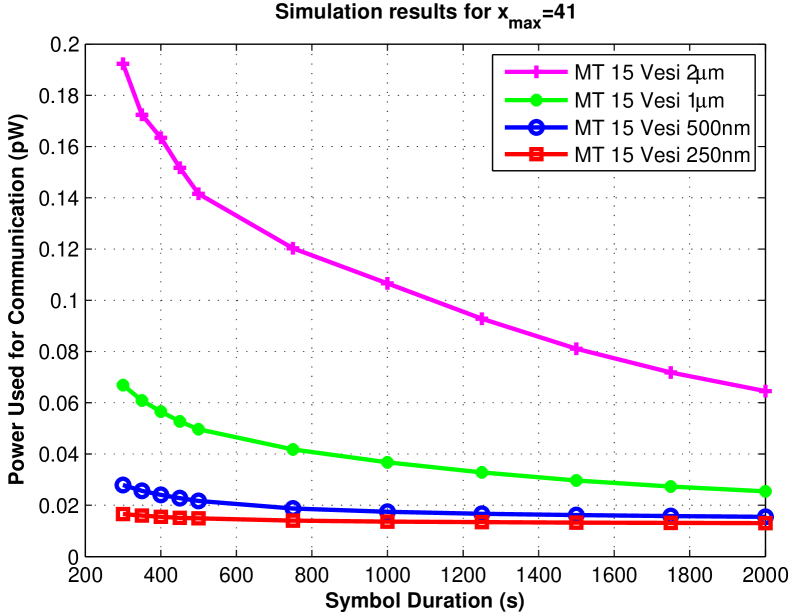
Figure 3 shows the power used by the communication system in pico-watts versus the symbol duration. Interestingly, as the symbol duration increases, the power used by the system decreases. This is due to the fact that as the symbol duration increases, the interval between vesicle generation between consecutive symbols increases, and hence the power decreases. The power used by the communication system is on the order of a few tens of femto-watts to less than half a pico-watt.
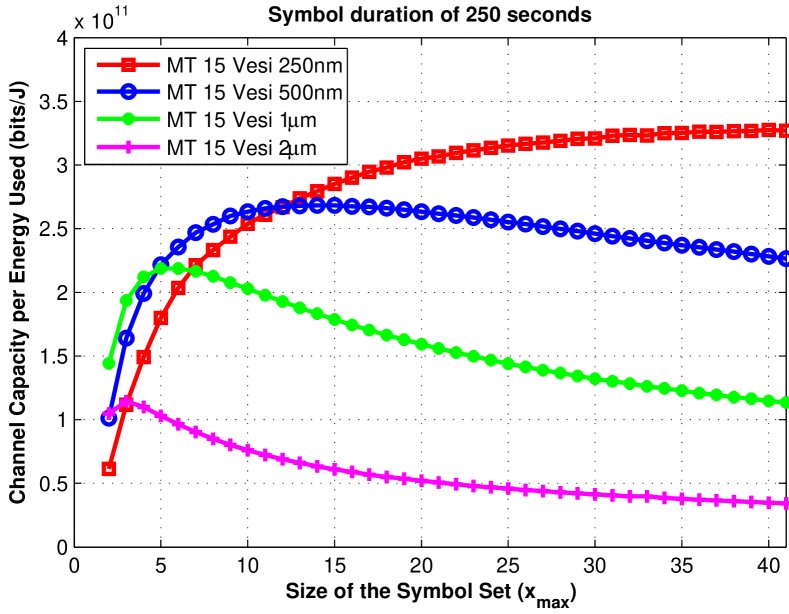
From the total energy expression derived in the previous section, as the size of the symbol set increases, it is expected that the total energy consumption increases. Fig. 4 shows the channel capacity per energy used in bits per joules as a function of the size of the symbol set. It is observed that unlike previous works that showed larger symbol sets are desirable [9], when optimizing the energy there is an optimal symbol set size. Moreover, depending on the size of the symbol set and the symbol duration, there is an optimal vesicle size that maximizes the capacity per unit energy.
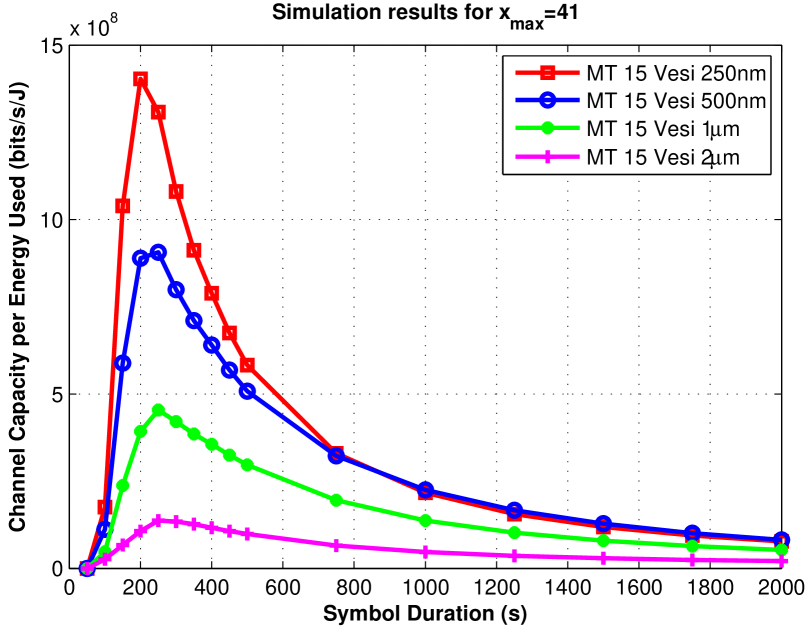
Finally, in Fig. 5 the channel capacity per unit energy is presented in units of bits per second per joule as a function of symbol duration. The size of the symbol set is constant at . In [18], it was shown that the vesicle size maximizes information rate, while 250 nm vesicle size achieves the lowest rate compared to the other vesicle sizes. However, when capacity per unit energy is considered, the 250 nm vesicles achieves the highest capacity for these particular system parameter. This shows that when designing molecular communication channels, energy is an important parameter that must be considered in the design process.
VI Conclusion
An energy model for active transport molecular communication (ATMC) was presented in this work. It was shown that the energy consumed by the communication system depends on the size of the vesicles, the symbol duration, and the input symbol set size and its probability mass function. To evaluate the effects of these parameters on energy consumption and information rate per unit energy, Monte Carlo simulations were employed. From the results, it was shown that for a given symbol set size and symbol duration, there is a vesicle size that maximizes rate per energy, and similarly, for a given vesicle size and symbol duration there is a symbol set size that maximizes rate per unit energy. An interesting property that was observed is the significant difference between maximizing rate and maximizing rate per unit energy. As was shown in [18], when only the rate is maximized, larger vesicle sizes and larger symbol set sizes are desirable. However, when rate per unit energy is maximized, smaller vesicle sizes and smaller message sets are preferred. Therefore, when designing molecular communication systems energy can have a significant effect on the overall design.
Acknowledgment
This research was supported in part by the NSF Center for Science of Information (CSoI) under grant CCF-0939370, the NSERC Postdoctoral Fellowship fund PDF-471342-2015, the MSIP (Ministry of Science, ICT and Future Planning), Korea, under the “IT Consilience Creative Program” (IITP- 2015-R0346-15-1008) supervised by the IITP (Institute for Information & Communications Technology Promotion) and by the Basic Science Research Program (2014R1A1A1002186) funded by the Ministry of Science, ICT and Future Planning (MSIP), Korea, through the National Research Foundation of Korea.
References
- [1] N. Farsard, A. Yilmaz, H. B.and Eckford, C.-B. Chae, and W. Guo, “A comprehensive survey of recent advancements in molecular communication,” arXiv:1410.4258v2, Oct. 2014.
- [2] M. S. Kuran, H. B. Yilmaz, T. Tugcu, and B. Ozerman, “Energy model for communication via diffusion in nanonetworks,” Elsevier Nano Communication Networks, vol. 1, no. 2, pp. 86–95, 2010.
- [3] R. A. Freitas, Nanomedicine, volume I: basic capabilities. Landes Bioscience Georgetown, TX, 1999.
- [4] K. Darchini and A. S. Alfa, “Molecular communication via microtubules and physical contact in nanonetworks: A survey,” Elsevier Nano Communication Networks, vol. 4, no. 2, pp. 73–85, 2013.
- [5] H. B. Yilmaz, A. C. Heren, T. Tugcu, and C.-B. Chae, “Three-dimensional channel characteristics for molecular communications with an absorbing receiver,” IEEE Communications Letters, vol. 18, no. 6, pp. 929–932, 2014.
- [6] H. B. Yilmaz and C.-B. Chae, “Simulation study of molecular communication systems with an absorbing receiver: Modulation and ISI mitigation techniques,” Elsevier Simulation Modelling Practice and Theory, vol. 49, pp. 136–150, 2014.
- [7] ——, “Arrival modelling for molecular communication via diffusion,” Electronics Letters, vol. 50, no. 23, pp. 1667–1669, 2014.
- [8] N.-R. Kim and C.-B. Chae, “Novel modulation techniques using isomers as messenger molecules for nano communication networks via diffusion,” IEEE Journal on Selected Areas in Communications, vol. 31, no. 12, pp. 847–856, 2013.
- [9] N. Farsad, A. Eckford, S. Hiyama, and Y. Moritani, “On-chip molecular communication: Analysis and design,” IEEE Transactions on NanoBioscience, 2012.
- [10] M. S. Kuran, T. Tugcu, and B. O. Edis, “Calcium signaling: Overview and research directions of a molecular communication paradigm,” IEEE Wireless Communications, vol. 19, no. 5, pp. 20–27, 2012.
- [11] M. Gregori and I. F. Akyildiz, “A new nanonetwork architecture using flagellated bacteria and catalytic nanomotors,” IEEE Journal on Selected Areas in Communications, vol. 28, no. 4, pp. 612–619, 2010.
- [12] E. Kim, K.-E. Byun, D. S. Choi, D. J. Lee, D. H. Cho, B. Y. Lee, H. Yang, J. Heo, H.-J. Chung, S. Seo, and S. Hong, “Electrical control of kinesin-microtubule motility using a transparent functionalized-graphene substrate,” Nanotechnology, vol. 24, no. 19, p. 195102, May 2013.
- [13] D. Steuerwald, S. M. Fruh, R. Griss, R. D. Lovchik, and V. Vogel, “Nanoshuttles propelled by motor proteins sequentially assemble molecular cargo in a microfluidic device,” Lab on a Chip, vol. 14, pp. 3729–3738, 2014.
- [14] S. Hiyama, R. Gojo, T. Shima, S. Takeuchi, and K. Sutoh, “Biomolecular-motor-based nano- or microscale particle translocations on DNA microarrays,” Nano Letters, vol. 9, no. 6, pp. 2407–2413, 2009.
- [15] T. Nitta, A. Tanahashi, M. Hirano, and H. Hess, “Simulating molecular shuttle movements: Towards computer-aided design of nanoscale transport systems,” Lab on a Chip, vol. 6, no. 7, pp. 881–885, 2006.
- [16] N. Farsad, A. W. Eckford, and S. Hiyama, “Channel design and optimization of active transport molecular communication,” in Proc. of International ICST Conference on Bio-Inspired Models of Network, Information, and Computing Systems, York, England, 2011.
- [17] ——, “A markov chain channel model for active transport molecular communication,” IEEE Transactions on Signal Processing, vol. 62, no. 9, pp. 2424–2436, May 2014.
- [18] N. Farsad, A. W. Eckford, S. Hiyama, and Y. Moritani, “Quick system design of vesicle-based active transport molecular communication by using a simple transport model,” Elsevier Nano Communication Networks, vol. 2, no. 4, pp. 175–188, 2011.
- [19] N. Farsad, A. W. Eckford, and S. Hiyama, “Modelling and design of polygon-shaped kinesin substrates for molecular communication,” in Proc. of IEEE Conference on Nanotechnology, Aug. 2012, pp. 1–5.
- [20] ——, “Design and optimizing of on-chip kinesin substrates for molecular communication,” IEEE Transactions on Nanotechnology, vol. 14, no. 4, pp. 699–708, Jul. 2015.
- [21] J. Howard, A. J. Hudspeth, and R. D. Vale, “Movement of microtubules by single kinesin molecules,” Nature, vol. 342, no. 6246, pp. 154–158, Nov. 1989.
- [22] A. L. Lehninger, D. L. Nelson, and M. M. Cox, Principles of Biochemistry, 3rd ed. W. H. Freeman & Company, 2000.
- [23] B. Alberts, A. Johnson, J. Lewis, M. Raff, K. Roberts, and P. Walter, Molecular Biology of the Cell, 5th ed. Garland Science, Nov. 2007.
- [24] D. L. Coy, M. Wagenbach, and J. Howard, “Kinesin takes one 8-nm step for each ATP that it hydrolyzes,” Journal of Biological Chemistry, vol. 274, no. 6, pp. 3667–3671, 1999.
- [25] F. Gibbons, J.-F. Chauwin, M. Desposito, and J. V. Jose, “A dynamical model of kinesin-microtubule motility assays,” Biophysical Journal, vol. 80, no. 6, pp. 2515–2526, 2001.
- [26] R. Blahut, “Computation of channel capacity and rate-distortion functions,” IEEE Transactions on Information Theory, vol. 18, no. 4, pp. 460–473, 1972.
- [27] S. Arimoto, “An algorithm for computing the capacity of arbitrary discrete memoryless channels,” IEEE Transactions on Information Theory, vol. 18, no. 1, pp. 14–20, 1972.
- [28] M. S. Kuran, H. B. Yilmaz, and T. Tugcu, “A tunnel-based approach for signal shaping in molecular communication,” in Proc. of IEEE International Conference on Communications Workshops (ICC), 2013, pp. 776–781.
- [29] A. Noel, K. C. Cheung, and R. Schober, “Improving receiver performance of diffusive molecular communication with enzymes,” IEEE Transactions on NanoBioscience, vol. 13, no. 1, pp. 31–43, Mar. 2014.
- [30] A. C. Heren, H. B. Yilmaz, C.-B. Chae, and T. Tugcu, “Effects of degradation in molecular communication: Impairment or enhancement?” to appear in IEEE Transactions on Molecular, Biological, and Multi-scale Communications, 2015.