,
Partitioned Sampling of Public Opinions
Based on Their Social Dynamics††thanks: This work was supported in part by the National Basic Research Program of China Grant 2011CBA00300, 2011CBA00301,
the National Natural Science Foundation of China Grant 61033001, 61361136003, 61433014.
Abstract
Public opinion polling is usually done by random sampling from the entire population, treating individual opinions as independent. In the real world, individuals’ opinions are often correlated, e.g., among friends in a social network. In this paper, we explore the idea of partitioned sampling, which partitions individuals with high opinion similarities into groups and then samples every group separately to obtain an accurate estimate of the population opinion. We rigorously formulate the above idea as an optimization problem. We then show that the simple partitions which contain only one sample in each group are always better, and reduce finding the optimal simple partition to a well-studied Min--Partition problem. We adapt an approximation algorithm and a heuristic to solve the optimization problem. Moreover, to obtain opinion similarity efficiently, we adapt a well-known opinion evolution model to characterize social interactions, and provide an exact computation of opinion similarities based on the model. We use both synthetic and real-world datasets to demonstrate that the partitioned sampling method results in significant improvement in sampling quality and it is robust when some opinion similarities are inaccurate or even missing.
1 Introduction
Public opinion is essential nowadays for governments, organizations and companies to make decisions on their policies, strategies, products, etc. The most common way to collect public opinions is polling, typically done by randomly sampling a large number of individuals from the entire population and then interviewing them by telephone. This naive method is unbiased, but conducting interviews is very costly. On the other hand, in recent years, more and more online social media data are available and have been used to predict public opinions on certain issues. Such predictions cost less human effort, but they are usually biased and may lead to incorrect decisions. Thus, keeping the estimation unbiased while saving the cost becomes an important task to pursue.
In this paper, we utilize individuals’ social interactions (potentially learned from social media data) to improve the unbiased sampling method. Our motivation is from the fact that people’s opinions are often correlated, especially among friends in a social network, due to their social interactions in terms of the homophily and influence effects (?; ?; ?). Such correlations are partially known in the big data era. For example, many online social media and networking sites provide publicly available social interaction data and user’s sentiment data, and companies also have large amounts of data about their customers’ preferences and their social interactions. Our idea is to partition individuals into different groups by utilizing the above prior knowledge, such that people within a group are likely to hold the same opinions. We can then sample very few people in each group and aggregate the sampling results together to achieve an accurate estimation. We call this the partitioned sampling method.
We formulate the above idea as an optimization problem. In particular, we first characterize individuals’ opinions as random variables. We then specify our objective as minimizing the expected sample variance of the estimate, and define the statistical measure of pairwise opinion similarity as the input. Our analysis later shows that this input is enough to fully determine the solution of the optimization problem, named the Optimal Partitioned Sampling (OPS) problem (Section 2).
We solve the OPS problem in two steps (Section 3). First, we show that the best partition is always a simple partition, meaning that each group contains only one sample. Second, we use people’s opinion similarities to construct a weighted graph and reduce the OPS problem to the Min--Partition problem. We adapt a semi-definite programming algorithm and a heuristic algorithm to solve the optimization problem. We further show that partitioned sampling using any balanced simple partition where group sizes are the same always out-performs naive sampling method, and thus balanced simple partition is always safe to use even if we only have partial or inaccurate opinion similarity information.
Next, we adapt existing opinion evolution models and propose the Voter model with Innate Opinions (VIO) based on social network interactions (Section 4). We provide an exact computation of opinion similarities in the steady state of the model, which is novel in the study of such models.
Finally, we conduct experiments on both synthetic and real-world datasets to demonstrate the effectiveness and robustness of our partitioned sampling method (Section 5).
In summary, our contributions include: (a) proposing the partitioned sampling method to improve sampling quality based on opinion similarities and formulating it as an optimization problem, (b) precisely connecting the OPS problem to the Min--Partition problem and providing efficient algorithms for the OPS problem, and (c) adapting an opinion evolution model and providing an exact computation of opinion similarities based on the model.
Related Work. There are many sampling methods in the literature. The most related method is stratified sampling (?; ?; ?; ?; ?; ?; ?). The entire population is first stratified into homogeneous atomic strata based on individuals’ profiles (e.g., age, gender, etc.), and then they may be combined to a final stratification and subsample size in each stratum is allocated to minimize sample variance. Conceptually, our partitioned sampling method is similar to stratified sampling, but there are some important differences. First, stratified sampling partitions individuals based on their profiles, which may not imply opinion similarity, while we partition individuals directly based on opinion similarity, and thus our method is more accurate and flexible. Second, the technical treatments are different. Stratified sampling treats individual opinions as fixed and unknown, and requires the (estimated) mean and standard deviation of opinions in each stratum to bootstrap the stratified sampling, while we treat individual opinions as random variables, and use pairwise opinion similarities for partitioned sampling.
Among studies on social interaction based sampling, ? (?) utilize social network connections to facilitate sampling. However, their method is to ask the voter being sampled to return the estimate of her friends’ opinions, which changes the polling practice. In contrast, we still follow the standard polling practice and only use implicit knowledge on opinion similarities to improve sampling quality. ? (?) consider the task of estimating people’s average innate opinion by removing their social interactions, which is opposite to our task — we want to utilize opinion interactions for more efficient sampling of final expressed opinions which are counted in opinion polls. Graph sampling methods (?; ?) aim at achieving unbiased uniform sampling on large scale networks when the full network is not available, which is orthogonal to our partitioned sampling approach and could be potentially combined.
Various opinion evolution models have been proposed in the literature (?; ?; ?; ?). Our VIO model is adapted from the voter model (?) and its extension with stubborn agents (?).
Graph partitioning has been well studied, and numerous problem variants and algorithms exist. In this paper, we reduce the OPS problem to the Min--Partition problem, which was first formulated by ? (?). To the best of our knowledge, there is no approximation or heuristic algorithms for Min--Partition. Thus, we adapt a state-of-art approximation algorithm for the dual problem (Max--Cut) to solve the OPS problem (?). We also propose a greedy algorithm for large graphs, which takes the idea from a heuristic algorithm for Max--Cut (?).
2 Formulating the OPS Problem
We consider a vertex set from a social network graph containing vertices (or nodes) . Each vertex represents a person in the social network, and has a binary opinion on some topic of interest. Our task is to estimate the average opinion of all individuals in the social network with sample size budget . Let denote the opinion function, i.e., we wish to estimate the fraction . The naive sampling method simply picks nodes uniformly at random with replacement from to ask their opinions and takes the average of sampled opinions as the estimate, as denoted below: , where is the -th sampled node.
In this paper, we propose a general sampling framework called partitioned sampling. Formally, we first partition the whole vertex set into several disjoint subsets (called groups), and then allocate subsample size of each group. We use to represent such a partition, where , , …, are groups, and is the subsample size of group . Next, we do naive sampling inside each group with its subsample size . Finally, we estimate the average opinion of the population by taking a weighted average of all subsampling results, with weights proportional to group sizes: . Notice that naive sampling is a special case of partitioned sampling with . One can easily verify that partitioned sampling is unbiased (see Appendix F.1).
Intuitively, the advantage of using partitioned sampling is that, if we partition individuals such that people likely holding the same opinions are partitioned into the same group, then we can sample very few people in each group to get an accurate estimate of the average opinion of the group, and aggregate them to get a good estimate of population mean. To implement this idea, we assume that some prior knowledge about people’s opinions and their similarities is available before sampling. Based on these knowledge, our goal is to find the best partition for partitioned sampling which achieves the best sampling quality.
Our first research challenge is how to rigorously formulate the above intuition into an optimization problem. To meet this challenge, we need to answer (a) which objective function is the appropriate one for the optimization problem, and (b) which representation of the prior knowledge about people’s opinions and their similarities can be used as the inputs to the optimization problem.
We first address the objective function. When all individuals’ opinions are fixed (but unknown), the effectiveness of an unbiased randomized sampling method is measured by the standard sample variance , where is the estimate. The smaller the sample variance, the better the sampling method. When the prior statistical knowledge about people’s opinions is available, effectively we treat opinions as random variables, and the prior knowledge is some statistics related to the joint distribution of these random variables. In this case, the best sampling method should minimize the expected sample variance , where the expectation is taken over the randomness from the joint distribution of people’s opinions. For clarity, we use to represent , where subscript (standing for “model”) represents the randomness from the joint distribution model of opinions, and subscript (standing for “sampling”) represents sample randomness from the sampling method. 111One may propose to use the total variance as the objective function. In Appendix A, we show that they are equivalent for the optimization task.
We now discuss the input to the optimization task. The full joint distribution of requires an exponential number of parameters and is infeasible as the input. Then notice that the objective function only involves first two moments, which suggests us to use the expectations and pairwise correlations of people’s opinions as the inputs. Indeed, we find that these knowledge is good enough to fully characterize the optimization problem. However, we further discover that a weaker and more direct type of statistics would be enough to enable the optimization problem, which we formally define as pairwise opinion similarities: the opinion similarity for nodes and is defined as the probability that and have the same values.
With the objective function and inputs settled, we are now ready to define our optimization problem:
Definition 1.
(Optimal Partitioned Sampling) Given a vertex set , sample size budget , and opinion similarity between every pair of nodes and , the Optimal Partitioned Sampling (OPS) problem is to find the optimal partition of , such that the partitioned sampling method using achieves the minimum expected sample variance, i.e., , where takes among all partitions of with samples.
We remark that the OPS problem requires all pairwise opinion similarities as inputs so as to make the problem well-defined. We will address the issue of handling missing or inaccurate opinion similarities in Section 3.1, and show that partitioned sampling still has outstanding performance.
3 Solving the OPS Problem
There are two issues involved in the OPS problem: one is how to partition the vertex set into groups; the other is how to allocate the subsample size in each group. For simplifying the OPS problem, we first consider a special kind of partitions that pick only one sample node in each group.
Definition 2.
A simple partition is a partition in which the subsample size of each group is equal to one.
Simple partitions are important not only for the simplicity but also for the superiority. We will later show in Theorem 2 that, for any non-simple partition , one can easily construct a simple partition based on which is at least as good as . Thus, we focus on finding the optimal simple partition.
Our approach is constructing a weighted assistant graph whose vertex set is , where the weight of edge is , and then connecting the OPS problem with a graph partitioning problem for the graph . For a simple partition of , we use to denote the volume of the group in the graph , defined as . We define a cost function to be the sum of all groups’ volumes in , namely, . Our major technical contribution is to show that minimizing the expected sample variance of partitioned sampling using any simple partition is equivalent to minimizing the cost function , as summarized by the following theorem:
Theorem 1.
Given a vertex set with pairwise opinion similarities ’s and sample size , for any simple partition of ,
Thus, the optimal simple partition of minimizes the cost function .
Proof (Sketch).
We use to denote the sample node selected in the -th group of the simple partition . The estimate of partitioned sampling with can be written as , where and . When is fixed, since ’s are independent, then
We then use the fact that and , and take expectation when is drawn from a distribution, to obtain
Notice that for any two binary random variables and , we have . After applying this formula to and simplifying the expression, we obtain the theorem. ∎
The intuition of the theorem is that, small cost function indicates small volume of each group, which implies that the nodes within each group have high opinion similarities. Theorem 1 makes precise our intuition that grouping people with similar opinions would make partitioned sampling more efficient.
Theorem 1 provides the connection between the OPS problem and the graph partitioning problem. In particular, it suggests that we can reduce the OPS problem to the following Min--Partition problem: given an undirected graph with non-negative edge weights, partition the graph into groups such that the sum of all groups’ volumes is minimized. However, Min--Partition is NP-hard to approximate to within any finite factor (?), and to the best of our knowledge, there is no approximation or heuristic algorithms in the literature. The good news is that Min--Partition and its dual problem (Max--Cut) are equivalent in the exact solution, and there exist both approximation and heuristic algorithms for Max--Cut. ? (?) propose a semi-definite programming (SDP) algorithm which achieves approximation ratio and is the best to date. We adopt the SDP algorithm to solve the OPS problem. The SDP partitioning algorithm including the SDP relaxation program is given in Appendix B. The drawback of the SDP partitioning algorithm is its inefficiency. Thus, we further propose a greedy algorithm to deal with larger graphs, which takes the idea from a heuristic algorithm for Max--Cut (?).
Given a simple partition and an external node which does not belong to for any , we define to be , where is . Thus represents the increase of the cost function when the external node is added to the group of . The greedy algorithm (Algorithm 1) first assigns each ungrouped node to the group such that the objective function is increased the least. After the first round of greedy assignment, the assignment procedure is repeated to further decrease the cost function, until some stopping condition holds, such as the decrease is smaller than a predetermined threshold.
The running time of one-round greedy assignment is where is the number of edges in . In our experiment, we will show that greedy partitioning performs as well as SDP partitioning but could run on much larger graphs. Theoretically, the performance of partitioned sampling using the simple partition generated by the greedy partitioning algorithm is always at least as good as naive sampling, even using the partition generated after the first round of greedy assignment, as summarized below:
Lemma 1.
Given a vertex set with sample size , partitioned sampling using the simple partition generated by the greedy partitioning algorithm (even after the first round) is at least as good as naive sampling. Specifically,
We call a partition a refined partition of , if each group of is a subset of some group of . Suppose we are given a partition such that there exists some group which is allocated more than one sample. Then we can further partition that group by the greedy partitioning algorithm and finally obtain a refined simple partition of . According to Lemma 1, the refined simple partition should be at least as good as the original partition , summarized as below:
Theorem 2.
For any non-simple partition , there exists a refined simple partition of , which can be constructed efficiently, such that partitioned sampling using the refined simple partition is at least as good as partitioned sampling using the original partition . Specifically,
Theorem 2 shows the superiority of simple partitions, and justifies that it is enough for us to only optimize for partitioned sampling with simple partitions.
3.1 Dealing with Inaccurate Similarities
When accurate opinion similarities are not available, one still can use a balanced partition (i.e., all groups have the exact same size) to achieve as least good sampling result as naive sampling, summarized as below:
Theorem 3.
Given a vertex set with nodes and sample size where is a multiple of , partitioned sampling using any balanced simple partition is at least as good as naive sampling. That is, holds for any fixed opinions , …, .
Theorem 3 provides a safety net showing that partitioned sampling would not hurt sampling quality. Thus, we can always use the greedy algorithm with a balance partition constraint to achieve better sampling result. The result will be further improved if opinion similarities get more accurate.
Furthermore, in the experiment on the real-world dataset (Section 5), we artificially remove all the opinion similarity information (set as ) between disconnected individuals, and perturb the rest opinion similarities more than , to simulate the condition of missing and inaccurate similarities. The experimental result shows that the performance of the greedy algorithm with perturbed inputs is quite close to the performance of the greedy algorithm with exact inputs. This demonstrates the robustness of our greedy algorithm in the face of missing and inaccurate opinion similarity data.
Moreover, since real-world social interaction can be characterized well by opinion evolution models, we adapt a well-known opinion evolution model and give an exact computation of opinion similarity based on the model in the next section. The model essentially provides a more compact representation than pairwise similarities.
4 Opinion Evolution Model
We adapt the well-known voter model to describe social dynamics (?; ?). Consider a weighted directed social graph where is the vertex set and is the weighted adjacency matrix. Each node is associated with both an innate opinion and an expressed opinion. The innate opinion remains unchanged from external influences, while the expressed opinion could be shaped by the opinions of one’s neighbors, and is the one observed by sampling. At initial time, each node generates its innate opinion from an i.i.d. Bernoulli distribution with expected value . The use of i.i.d. distribution for the innate opinion is due to the lack of prior knowledge on a brand-new topic, and is also adopted in other models (?). When , each node updates its expressed opinion independently according to a Poisson process with updating rate : at its Poisson arrival time , node sets to its innate opinion with an inward probability , or with probability , adopts its out-neighbor ’s expressed opinion . We call the model Voter model with Innate Opinions (VIO).
The VIO model reaches a steady state if the joint distribution of all node’s expressed opinions no longer changes over time.222The VIO model has a unique joint distribution for the final expressed opinions. See Appendix C for the proof. We use notation to represent the steady-state expressed opinion of node , which is a random variable. We assume that opinion sampling is done in the steady state, which means that people have sufficiently communicated within the social network.
To facilitate analysis of the VIO model, we take an equivalent view of the VIO model as coalescing random walks on an augmented graph , where is a copy of , is the edge set of and for all . In this viewpoint, we have walkers randomly wandering on “back in time” as follows. At time , all walkers are separately located at . Suppose before time , is the last node who updated its expressed opinion at time , then the walkers stay stationary on their nodes from time until time “back in time”. At time , the walker at node takes a walk step: she either walks to ’s out-neighbor with probability , or walks to with probability . If any walker (e.g., the walker starting from node ) walks to a node (e.g., ) in , then she stops her walk. In the VIO model language, this is equivalent to saying that ’s opinion at time is determined by ’s innate opinion, namely . If two random walkers meet at the same node in at any time, they walk together from now on following the above rules (hence the name coalescing). Finally, at time , if the walker is still at some node , she always walks to .
We now define some key parameters based on the coalescing random walk model, which will be directly used for computing the opinion similarity later.
Definition 3.
Let denote the event that two random walkers starting from and at time eventually meet and the first node they meet at is . Let be the matrix where denotes the probability that a random walker starting from at time ends at .
Lemma 2.
For , is the unique solution of the following linear equation system:
where is ’s weighted out-degree. In addition, matrix is computed by
where and are two diagonal matrices, and matrix is invertible when for all .
Our main analytical result concerning the VIO model is the following exact computation of pairwise opinion correlation, which directly leads to opinion similarity:
Lemma 3.
Theorem 4.
For any two nodes and , their opinion similarity in the steady state of the VIO model is equal to:
where opinion correlation is computed by Lemma 3.
Notice that for partitioning algorithms, we only need as the edge weight and by the above theorem this weight value is proportional to , which means the exact value of is irrelevant for partitioning algorithms. In Appendix D, we will provide an efficient computation of all pairwise opinion correlations with running time by a carefully designed iterative algorithm, where is the number of edges of which is commonly sparse, and is the number of iterations. We further remark that the correlations are calculated offline based on the existing network and historical data, and thus the complexity compared to the sampling cost of telephone interview or network survey is relatively small.
In Appendix G, we further extend the VIO model to include (a) non-i.i.d. distributions of the innate opinions, and (b) negative edges as in the signed voter model (?).
5 Experimental Evaluation
In this section, we compare the sampling quality of partitioned sampling using greedy partitioning (Greedy) and partitioned sampling using SDP partitioning333We use CVX package (?; ?) to solve the SDP programming. (SDP) against naive sampling (Naive) based on the VIO model, using both synthetic and real-world datasets. We describe major parameter settings for the experiments below, while leave the complete settings in Appendix E.
In our experiment, when the parameters of VIO model are set, the simulation is done by (a) calculating the pairwise opinion similarities by Theorem 4, (b) running the partitioning algorithms to obtain the partition candidate, and (c) computing the expected variance by Theorem 1.
Synthetic Dataset. We use the planted partition model (?) to generate undirected graphs, which aims at resembling the community structure in real-world social networks. Given vertices and latent disjoint groups, every edge is generated with a high probability if and are in the same latent group, otherwise with a low probability .
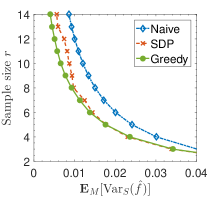
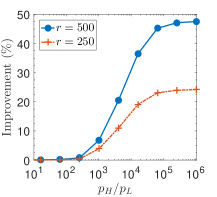
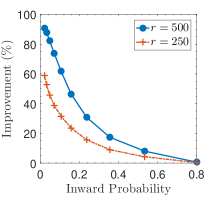
We generate two different sizes of synthetic graphs. The small one includes nodes and latent groups, and , and are set to , and , respectively. The inward probability of each node is randomly chosen from . Fig 1(a) shows that, when the sample size is small, the performance of SDP and Greedy are similar to each other and both better than Naive. When the sample size increases, Greedy becomes much better than Naive, and SDP starts getting worse. For the large synthetic graph with k nodes and latent groups, SDP is no longer feasible, thus we compare the improvement of Greedy against Naive. In Fig 1(b), we range and find that larger (more apparent clustering) indicates the better performance of the partitioned sampling method. When increases from to , the improvement of expected sample variance increases rapidly. When , the improvement becomes saturated. This is because the number of edges which cross different latent groups are so few that it decreases rather slowly and the graph structure is almost unchanged when increases further. In Fig 1(c), we set all nodes’ inward probabilities to be equal and vary them from to . The figure shows that the lower inward probability leads to the better performance of partitioned sampling. When the inward probability gets small, the improvement expected sample variance increases rapidly. This is because a lower inward probability means people interacting more with each other and thus their opinions are correlated more significantly. According to the above experiments, we conclude that the larger and the lower inward probability make people’s opinions more clustered and more correlated inside the clusters, and our partitioned sampling method works better for these cases.
Real-World Dataset. We use the micro-blog data from weibo.com (?), which contains users and tweets within a one-year timeline from 1/1/2013 to 1/1/2014. We treat the user following relationship between two users as a directed edge (with weight ).
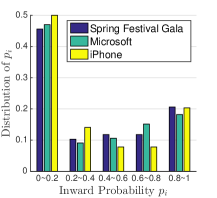
We first learn the distribution of user’s inward probabilities from the data. We extract a series of users’ opinions on specific topics (e.g., Microsoft, iPhone, etc.) by applying a keyword classifier and a sentiment analyzer (?) to the tweets. We also collect their relationships and form a subgraph for each topic. Then we use VIO model to fit the data by solving a minimization problem w.r.t. inward probabilities using gradient descent. Fig 1(d) shows the distribution of inward probabilities for three of the topics, namely Spring Festival Gala ( users), Microsoft ( users) and iPhone ( users), and the results for other topics are similar. From these distributions, we observe that (a) over inward probabilities locate in ; (b) the probability that locates in is the second highest; (c) others almost uniformly locate in . This indicates that in the real world, most people tend to adopt others’ opinions, which matches the intuition that people are often affected by others. We manually look up the users who locate in , and find that most of them are media accounts and verified users. This matches our intuition that those users always take effort to spread their own opinions on the web but rarely adopt others’ opinions, hence they should have large inward probabilities.
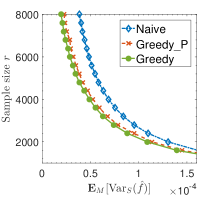
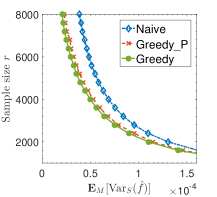
Now we simulate the sampling methods on the Weibo graph. We first remove the users who do not follow anyone iteratively, and get the graph including nodes and directed edges. We generate each user’s inward probability following the distribution we learned. We use two different settings for opinion updating rates: one is to set for all ; the other is to set to the number of ’s tweets in a year. The improvement of Greedy against Naive with two different updating rate settings are similar as shown in Fig 1(e) and 1(f). In particular, if we fix to be , Greedy needs samples while Naive needs samples (saving ) in Fig 1(e), and Greedy needs samples while Naive needs samples (saving ) in Fig 1(f). This indicates that partitioned sampling greatly improves the sampling quality, and the sample size saving is more apparent when the expected sample variance gets smaller (i.e., the requirement of sampling quality gets higher). Moreover, in order to test the performance of partitioned sampling with missing and inaccurate opinion similarities, we artificially remove all the opinion similarity information between disconnected nodes (set similarities as 0.5), and perturb each rest similarity with a random noise in the range (set perturbed similarity of as the median of ). Fig 1(e) and 1(f) show that Greedy using the above perturbed similarities (denoted as Greedy_P) is very close to Greedy, and still has a significant improvement against naive sampling.
In conclusion, the experimental results demonstrate the excellent performance of our partitioned sampling method both on synthetic and real-world datasets, even when the opinion similarities are missing or inaccurate.
References
- [Ballin and Barcaroli 2013] Ballin, M., and Barcaroli, G. 2013. Joint determination of optimal stratification and sample allocation using genetic algorithm. Survey Methodology 39(2):369–393.
- [Bethel 1986] Bethel, J. W. 1986. An optimum allocation algorithm for multivariate surveys. US Department of Agriculture, Statistical Reporting Service, Statistical Research Division.
- [Bethel 1989] Bethel, J. 1989. Sample allocation in multivariate surveys. Survey methodology 15(1):47–57.
- [Chromy 1987] Chromy, J. R. 1987. Design optimization with multiple objectives. Proceedings of the Section.
- [Clifford and Sudbury 1973] Clifford, P., and Sudbury, A. 1973. A model for spatial conflict. Biometrika.
- [Cochran 2007] Cochran, W. G. 2007. Sampling techniques. John Wiley & Sons.
- [Condon and Karp 2001] Condon, A., and Karp, R. M. 2001. Algorithms for graph partitioning on the planted partition model. Random Structures & Algorithms.
- [Crandall et al. 2008] Crandall, D.; Cosley, D.; Huttenlocher, D.; Kleinberg, J.; and Suri, S. 2008. Feedback effects between similarity and social influence in online communities. In KDD ’08.
- [Das et al. 2013] Das, A.; Gollapudi, S.; Panigrahy, R.; and Salek, M. 2013. Debiasing social wisdom. In KDD ’13.
- [Dasgupta, Kumar, and Sivakumar 2012] Dasgupta, A.; Kumar, R.; and Sivakumar, D. 2012. Social sampling. In KDD ’12.
- [Frieze and Jerrum 1997] Frieze, A., and Jerrum, M. 1997. Improved approximation algorithms for max k-cut and max bisection. Algorithmica.
- [Gionis, Terzi, and Tsaparas 2013] Gionis, A.; Terzi, E.; and Tsaparas, P. 2013. Opinion maximization in social networks. In SDM ’13.
- [Gjoka et al. 2010] Gjoka, M.; Kurant, M.; Butts, C. T.; and Markopoulou, A. 2010. Walking in facebook: A case study of unbiased sampling of osns. In INFOCOM ’10.
- [Goel, Mason, and Watts 2010] Goel, S.; Mason, W.; and Watts, D. J. 2010. Real and perceived attitude agreement in social networks. Journal of Personality and Social Psychology.
- [Grant and Boyd 2008] Grant, M., and Boyd, S. 2008. Graph implementations for nonsmooth convex programs. In Recent Advances in Learning and Control. Springer.
- [Grant and Boyd 2014] Grant, M., and Boyd, S. 2014. CVX: Matlab software for disciplined convex programming. http://cvxr.com/cvx.
- [Kann et al. 1997] Kann, V.; Khanna, S.; Lagergren, J.; and Panconesi, A. 1997. On the hardness of approximating max k-cut and its dual. Chicago Journal of Theoretical Computer Science.
- [Keskintürk and Er 2007] Keskintürk, T., and Er, S. 2007. A genetic algorithm approach to determine stratum boundaries and sample sizes of each stratum in stratified sampling. Computational Statistics & Data Analysis 52(1):53–67.
- [Kozak, Verma, and Zieliński 2007] Kozak, M.; Verma, M. R.; and Zieliński, A. 2007. Modern approach to optimum stratification: Review and perspectives. Statistics in Transition 8(2):223–250.
- [Kurant et al. 2011] Kurant, M.; Gjoka, M.; Butts, C. T.; and Markopoulou, A. 2011. Walking on a graph with a magnifying glass: stratified sampling via weighted random walks. In SIGMETRICS ’11.
- [Li et al. 2015] Li, Y.; Chen, W.; Wang, Y.; and Zhang, Z. 2015. Voter model on signed social networks. Internet Mathematics.
- [McPherson, Smith-Lovin, and Cook 2001] McPherson, M.; Smith-Lovin, L.; and Cook, J. M. 2001. Birds of a feather: Homophily in social networks. Annual Review of Sociology.
- [Norris 1998] Norris, J. R. 1998. Markov chains. Cambridge university press.
- [Sahni and Gonzalez 1976] Sahni, S., and Gonzalez, T. 1976. P-complete approximation problems. Journal of the ACM (JACM).
- [Tang et al. 2014] Tang, D.; Wei, F.; Yang, N.; Zhou, M.; Liu, T.; and Qin, B. 2014. Learning sentiment-specific word embedding for twitter sentiment classification. In ACL ’14.
- [Yildiz et al. 2011] Yildiz, E.; Acemoglu, D.; Ozdaglar, A. E.; Saberi, A.; and Scaglione, A. 2011. Discrete opinion dynamics with stubborn agents. Available at SSRN 1744113.
- [Yuan et al. 2013] Yuan, N. J.; Zhang, F.; Lian, D.; Zheng, K.; Yu, S.; and Xie, X. 2013. We know how you live: Exploring the spectrum of urban lifestyles. In COSN ’13.
- [Zhu, Lin, and Ali 2013] Zhu, W.; Lin, G.; and Ali, M. 2013. Max-k-cut by the discrete dynamic convexized method. INFORMS Journal on Computing.
Appendix
The appendix is organized as follows.
In Section A, we show that using variance as objective is equivalent to using for the OPS problem .
In Section B, we present the formulation of our SDP partitioning algorithm.
In Section C, we show that the VIO model has a unique steady state.
In Section D, we provide an efficient computation of pairwise opinion correlations.
In Section E, we provide the implementation details of the experiment.
In Section F, we provide all the mathematical proofs of lemmas and theorems stated in the main paper.
In Section G, we provide more discussion about the VIO model, including two extensions of the VIO model.
Appendix A Objective Function of the OPS Problem
In the definition of the OPS problem (Definition 1), we use the expected variance as the objective function. Another intuitive setting of the objective function is which combines all the randomness into the variance together. We now show that these two objective functions are equivalent. Actually,
Due to the unbiasedness of , we have . Thus
Therefore
Since stays constant with different partitions, for any partition, the different between and is the same. Thus using variance as objective is equivalent to using for the OPS problem.
Appendix B SDP Partitioning Algorithm
In this section, we present the formulation of our SDP partitioning algorithm. The idea is to partition the assistant graph into groups by solving the Max--Cut problem for . The task is to find groups in order to maximize the following function:
where is defined by and is the weight of edge of .
Take an equilateral simplex in with vertices , , …, . Let , and let for . Thus , , …, have the following property:
We use , , …, to represent which group node is located in. If node is in -th group, then . In this way, the maximization problem can be written as
| Maximize | (IP) | |||
| Subject to |
We then relax the above optimization problem by replacing with the entry of a positive semi-definite symmetric matrix whose diagonal elements are equal to , and relaxing to be not less than .
| Maximize | |||
| Subject to | |||
Our SDP partitioning algorithm is performed by solving the above SDP problem and rounding the SDP-relaxed solution to IP-flexible solution, which is shown in Algorithm 2.
| Maximize | |||
| Subject to |
Appendix C Steady State of the VIO Model
In this section, we show that the VIO model has a unique steady state, as summarized as follow.
Proposition.
When for all , the VIO model has a unique joint distribution for the final expressed opinions in the steady state.
Proof.
The opinion evolution can be viewed as a Markov chain. Each possible assignment of ’s expressed opinions forms one state and the initial state of the Markov chain is . At each Poisson arrival time, the transition from one state to another represents the change of the opinion assignment. Thus the state space consists of all the states reachable from the initial state. The VIO model has a unique steady state distribution for the final expressed opinions if and only if the Markov chain has a unique stationary distribution. In order to prove the existence of the unique stationary distribution of the Markov chain, we only need to prove that the Markov chain is irreducible and aperiodic (?). Notice that each state in the state space can be reached from the initial state. Meanwhile, each state in the state space can return to the initial state by all the nodes updating their expressed opinions to the innate opinion one by one, which happens with a positive probability. This means that any two states in the state space are connected, indicating the irreducibility of the Markov chain. In addition, the initial state is aperiodic since it has a self-loop in the state transition graph (with probability at least ). An irreducible Markov chain is aperiodic if there exists one aperiodic state. Therefore, the Markov chain is irreducible and aperiodic, with the unique stationary distribution being reached after long enough time. ∎
Appendix D Efficient Computation of Opinion Correlation
Naive correlation computation directly using Lemma 2 and 3 by solving the linear equation system for ’s would have a running time of (See in proof of Lemma 2). We now improve the running time to by a carefully designed iterative computation method, where is the number of edges of the social graph and is the number of iterations.
We first consider the event that a walker starting at is absorbed by after random walk steps in the coalescing random walk model. We use to represent the probability of the above event happening. Initially, the walker is located at . With probability , she takes her first step to the sink node . Then the event that she is absorbed by after steps happens if and only if . If she does not walk to the sink node in her first step, but walk to one of her neighbors (happening with probability ), then the event happens if and only if she walks from to in her rest steps. Thus can be computed iteratively by
The running time of computing all ’s from ’s is
where is number of edges of the social graph . We remark that when , approaches to the entry of matrix defined in Definition 3. Thus can be computed in the above iterative way. We further remark that can be computed column by column (fixing subscript ) to save running space.
Now we consider two walkers take coalescing random walks on the graph starting at and respectively. We use notation to denote the probability that their walks coalesce after they taking altogether random walk steps . If , two walkers have coalesced since the beginning, thus is alway equal to one. When , with probability , the first walk step is taken by the walker starting at . If she walks to her sink node (happening with probability ), then the other walker who is at must walk to the same sink node in steps (happening with probability ). If she does not walk to her sink node but one of her neighbors (happening with probability ), then two walkers will coalesce in the rest steps with probability . The case that the first step is taken by the walker starting at follows the similar analysis. Thus can be calculated by
The running time of computing ’s with one iteration is
where is number of edges of the social graph .
According to Lemma 3, opinion correlation in the steady state is equal to . Thus we can obtain people’s opinion correlations by computing ’s and ’s iteratively in time where is the number of iterations. We remark that for any , and monotonically increase with increasing , and both have the upper bound . Thus the above iterative procedure will converge.
Appendix E Experimental Setting Details
In our experiment, when the parameters of VIO model (i.e., weighted adjacency matrix , people’s inward probabilities , , …, , updating rates of people’s opinions , , …, , and the expected value of innate opinion ) are set, the experiment is done by (a) calculating the pairwise opinion similarities by Theorem 4 and the efficient opinion correlation computation method given in Section D, (b) running the partitioning algorithms555The iteration of greedy partitioning algorithm stops when the decrease of the cost function in one iteration is less than 0.01% of the cost function. to obtain the partition candidate, and (c) computing the expected variance 666Each randomized partitioning algorithm was run times, and we took the average of the expected variance as the result. by Theorem 1. In both synthetic and real-world datasets, we set to be . Notice that the value of has no effect on the results (Theorem 4).
E.1 Synthetic Dataset
In our synthetic experiments, we use the planted partition model to generate undirected graphs. It is specified by four parameters: the number of vertices , the number of latent groups , the intra-partition and inter-partition edge probabilities and , respectively. First, we assign each node to one of the latent groups uniformly at random. Next, we independently connect each pair of nodes in the same latent group with probability , and two nodes in different latent groups with probability . For synthetic graphs, we set opinion updating rate to for all , and set the weight of each edge to . We generate two different sizes of synthetic graphs.
Small synthetic graph
The small synthetic graph we generate includes nodes and latent groups. Probability and are set to and , respectively. The inward probability of each node is randomly chosen from . We put sample size on -axis in Fig 1(a) to make it easier to see the savings on the sample size under the same expected sample variance.
Large synthetic graphs
The large synthetic graphs includes k nodes and latent groups. We run Greedy and Naive using different sample sizes ( and ), varying the inward probabilities and , to observe the improvement of expected sample variance under different graph clustering and inward tendency settings. In Fig 1(b), we set all nodes’ inward probabilities to and to , and range from to . The improvement on -axis means the improvement of expected sample variance from Naive to Greedy. In Fig 1(c), we set to and to be to generate the graph. For this graph, we set all nodes’ inward probabilities to be identical, varying from to .
E.2 Real-World Dataset
The real-network dataset we use is the micro-blog data from weibo.com, which contains users and tweets within a one-year timeline from 1/1/2013 to 1/1/2014. We treat the user following relationship between two users as a directed edge (with weight ). For this dataset, we first need to learn the distribution of people’s inward probabilities.
Distribution of inward probabilities
In order to observe the evolution of opinions for a specific topic of interest, We manually choose specific topics (e.g., Microsoft, iPhone, etc.), and extract all tweets from the Weibo dataset related to these topics (simply using keyword based classifier). We then run each tweet through a sentiment analyzer to obtain binary opinion values (positive/negative). Thus we get a series of opinions for each user at discrete time corresponding to each topic. For each topic, we select those users who published opinions at least times, and regard their first opinions as their innate opinions , , …, and treat the average of the rest opinions as their expected opinions in the steady state state, denoted as , , …, . We then collect their relationships and form a subgraph for the corresponding topic.
Recall the definition of matrix (Definition 3), and it is easy to see that . Then
Thus we can estimate the inward probabilities by solving the following programming
and we use gradient descent method to handle the above programming. Fig 1(d) shows the distribution of inward probabilities for three of the topics.
Partitioned sampling on Weibo graph
For the original Weibo dataset, we first remove the users who do not follow anyone, iteratively. Then we get our Weibo graph including nodes and directed edges. We use two different settings for opinion updating rates: one is to set for all ; the other is to set to be the number of ’s tweets in a year. The users’ inward probabilities are set in the following way so that it follows the distribution we learned: we sort all the inward probabilities learned in the last section among topics, denoted as . For each user in the Weibo graph, we select an integer from uniformly at random, and set ’s inward probability to a random real number in the following interval
Since there are some values that are zeros, we will have users with zero inward probability. For these users, we use a very small value in our simulation since our computation of the VIO model requires inward probability to be greater than zero. Figure 1(e) and 1(f) show the experimental results on the Weibo graph with all and set to the number of ’s tweets, respectively.
Appendix F Mathematical Proofs
F.1 Unbiasedness of Partitioned Sampling
Proposition.
(Unbiasedness) Partitioned sampling is unbiased. Specifically, for any partition , .
Proof.
For any partition ,
Notice that naive sampling in any group is unbiased, thus is equal to the average opinion of the people in (second equality above). Therefore partitioned sampling is unbiased. ∎
F.2 Proof of Theorem 1
See 1
Proof.
We use to denote the sample node selected in the -th group of the simple partition . The estimate of partitioned sampling with can be written as
where and . When is fixed, since ’s for all are independent, we have
We then use the fact that , and , to obtain
When is drawn from a distribution, we have
| (1) |
Notice that for any two binary () random variables and , the following equation holds:
Thus
| (2) |
Applying the above to Eq. (1), we have
∎
F.3 Proof of Theorem 2
See 1
Proof.
It has been known that, the sample variance of naive sampling is
| (3) |
where is the average opinion of the entire population. Thus
where , and
Therefore
For the greedy partitioning algorithm (Algorithm 1), suppose the randomly generated node sequence is , , …, (which is denoted by in the algorithm). For the greedy assignment of -th node in the first iteration, the group that is assigned to should make the cost function increased the least, thus the increase of cost function is no more than , where is the weight of edge in the graph . Thus at the end of the first iteration, the cost function
Therefore
This finishes the proof. ∎
See 2
Proof.
We first show that the sample variance of partitioned sampling can be written as a weighted summation of the sample variance of naive sampling in each group as below:
| (4) |
where , , and is the number of groups of .
According to the definition of partitioned sampling,
The estimate of naive sampling in two different groups are independent, thus for any ,
Therefore
For any partition with groups, if there exists some group containing more than one sample nodes, according to Lemma 1, we can efficiently find the simple partition for that group by one-round greedy partitioning algorithm such that
Thus we do the above refining procedure for all the groups containing more than one sample nodes iteratively, and combine all the final groups together to get the refined simple partition of . It satisfies that
This means that partitioned sampling using the refined simple partition is at least as good as partitioned sampling using the original partition . ∎
F.4 Proof of Theorem 3
See 3
Proof.
According to Eq. (4), for any simple partition , we have
When is a balanced simple partition, we have and , thus
where is the average opinion of the -th group.
Notice that holds for any balanced simple partition, thus we have
According to Cauchy-Schwartz inequality,
Thus we have
This finishes the proof. ∎
F.5 Proof of Theorem 4
See 2
Proof.
(a) For parameter .
Recall from Definition 3 that denotes the event that two random walks starting from and at time eventually meet and the first node they meet at is . This event consists of two steps: 1) the walker at (or ) moves to one of its neighbor (or ) with probability (or ); 2) two random walks starting from (or ) and (or ) eventually meet and the first node they meet at is . The probability that the walker at (resp. ) make a movement first is proportional to ’s (resp. ’s) Poisson rate, that is (resp. ). Thus for any , can be calculated by the following recursion:
When , is determined by the following boundary conditions:
By combining the recursive equations and the boundary conditions, we have the following linear equations:
| (5) |
The above proof follows the idea in (?).
Next we show that the linear system (5) has a unique solution. For a fixed , the equations for all terms such that form a linear sub-system with variables and equations, since . Therefore, we can solve the whole linear system (5) by solving separated linear sub-systems. Each linear sub-system corresponds to a value of , and it can be solved777-variable linear system can be solved in time . in , thus the original linear system (5) can be solved in time . Thus we further develop an efficient computation method as shown in Section D.
Now we show that there exists the unique solution for each linear sub-system. Each equation in the linear sub-system can be written as
Let , then we have a bijection of subscript between integer and ordered pair where . Then we can write these equations in the matrix form:
where is a vector whose -th element is ; is a matrix whose entry is ; is a matrix whose entry is ; is a vector whose -th element is .
If is non-singular, then each linear sub-system has a unique solution . In fact, for any row of , let , and the sum of the absolute value of the -th row except the diagonal entry
Thus, is strictly diagonally dominant. According to the Levy-Desplanques theorem, it is non-singular. Since each linear sub-system has one unique solution, the whole linear system (5) also does.
(b) For parameter .
The probability of a walker from walking to in one walk step is . So we have a matrix form whose entry is . Therefore, the probability of walking from to in exactly steps is the entry of . It is easy to verify that .
By definition of our model, the probability of walking to (being absorbed) is . Thus the matrix whose entry is the probability of transition from to can be calculated by
Now we show that is invertible. The entry of is
For any row of , the sum of absolute values of its non-diagonal elements can be written as , and it is strictly less than the absolute value of -th diagonal elements . Thus is strictly diagonally dominant, and it is non-singular (Levy-Desplanques theorem). ∎
See 3
Proof.
Before proving the lemma, we first introduce the following proposition:
Proposition.
The expected expressed opinion of each node in the steady state is equal to the expected value of innate opinion, namely, for all ,
| (6) |
We prove this by proving a stronger statement: given any , for all . Namely, we want to prove that at any time , each node’s expected expressed opinion is equal to the expected innate opinion. The proof is by induction on time . In the initial state, each node’s expressed opinion (also innate opinion) is generated from an i.i.d. distribution with expected value , and thus the above statement holds. Now suppose the statement holds before time . It still holds before the next Poisson arrival among all nodes. Suppose the next Poisson arrival comes at time and its corresponding updating node is . At this Poisson arrival time , updates its expressed opinion based on its innate opinion and one of its neighbors’ expressed opinions. Notice that the expectations of both its innate opinion and all its neighbors’ expressed opinions are equal to by the inductive assumption, namely, and for all , where is the set of ’s neighbors. Thus the expectation of ’s updated expressed opinion is still equal to . Moreover, other nodes’ expected expressed opinions remain equal to upon time . Thus by induction, at any time , each node’s expected expressed opinion is always equal to .
Now we are ready to prove Lemma 3.
(a) In this part, we show that the opinion correlation is equal to the probability that two coalescing random walks starting from and at time end at the same absorbing node in . In the proof, we split the randomness into two parts: we use to denote the randomness of innate opinions which are generated from an i.i.d. distribution, and we use to denote the randomness from the opinion evolution.
When , obviously we have . In this case, the two random walks’ paths coincide, thus they are absorbed by the same node in with probability .
When , according to the definition of correlation,
| (7) |
The third equality holds because for any ,
Next, we need to calculate , which is the probability that two random walkers starting from and walk to the nodes in whose original innate opinions are . This event consists of two cases: two random walkers move to the same absorbing node, or two distinct absorbing nodes. Thus we can calculate by adding them together.
Let be the event that in the coalescing random walks on , a random walker starting from is absorbed by , while another random walker starting from is absorbed by . Note that is measurable under randomness . It only depends on the structure of and is independent of the initial value in :
Thus can be written as:
In the last equation, we use to denote the probability that two coalescing random walks starting from and end at the same node in . Thus
This means that the opinion correlation is equal to the probability that two coalescing random walks starting from and end at the same absorbing node in .
(b) We now calculate in this part. Let be the event that two coalescing random walks starting from and are both absorbed by node without meeting each other at a node in . According to the definitions of events , and , we have
| (8) |
where is the probability that a random walker starting from node at time ends at .
See 4
Appendix G Extensions of the VIO Model
In this section, we extend the VIO model to allow (a) non-i.i.d. distributions of the innate opinions, and (b) negative edges as in the signed voter model (?). We provide the analysis of opinion similarities of these two extended models.
G.1 VIO Model with Non-Identical Innate Opinion Distribution
In the VIO model (section 4), we regard the individuals’ innate opinions as generated from an i.i.d. distribution. In this section, we still assume that the individuals’ innate opinions are independent, but each person can have her own expected innate opinion . In order to distinguish the source of the randomness, we split the randomness into two parts: we use to denote the randomness of innate opinions which are generated by the Bernoulli distribution, and use to denote the randomness from the opinion evolution (These notations were first introduced in the proof of Lemma 3). Thus is clarified as .
We now give a sketchy analysis of the VIO model with non-identical innate opinion distribution. We still use notation to denote ’s expected expressed opinion when the evolution converges, that is . Notice that the computation method of and ’s (Lemma 2) still holds for the VIO model with non-identical innate opinion distribution.
Next, we focus on computing the opinion similarity between any pair of nodes , which is the probability that two random walkers starting from and have the same final expressed opinions. Recall Eq. (2) that
In order to obtain , we compute , which is the probability that two random walkers starting from and finally walk to the nodes in whose innate opinions are equal to one.
Following the notations used in the proof of Lemma 3, let be the event that in the coalescing random walks on , a random walker starting from is absorbed by , while another random walker starting from is absorbed by . Note that is measurable under randomness . Thus
Recall Eq (10),
and use the same technique of Eq (9),
Therefore, after some calculations,
Thus
where is calculated by as shown in Eq (11). With opinion similarities calculated, then we can use partitioned sampling method described in Section 3 to do efficient sampling.
G.2 Signed VIO model
In this section, we provide a sketchy analysis of the signed VIO model, which allows negative edges in the graph. Given a weighted directed social graph where is the weighted adjacency matrix with if and only if edge exists, with as the weight of edge . At initial time , each node generates its innate opinion from an i.i.d. distribution with mean . When ’s Poisson arrives, it sets its expressed opinion to be its own innate opinion with an inward probability , or with probability node randomly selects a neighbor of with probability proportional to absolute value of the weight of the edge , i.e., with probability , and sets to ’s expressed opinion when or the opposite of ’s expressed opinion when . Similar to the VIO model, when for all , the signed VIO model has a unique steady state distribution for the final expressed opinions. For simplifying the notation, we use (and ) to denote (and ). We define (and ) to be (and ). Thus if , and if . We list all the notations used in this section in Table 1. In order to distinguish the source of the randomness, we split the randomness into two parts: we use to denote the randomness of innate opinions which are generated by the i.i.d. Bernoulli distribution, and use to denote the randomness from the opinion evolution (These notations are first introduced in the proof of Lemma 3).
| Notation | Representation |
|---|---|
| , , | (resp. ) is the non-negative adjacency matrix representing positive (resp. negative) edges of , with and . |
| , | The -entry of (resp. ) is the probability that the random walk starting from is absorbed by in while the number of walking steps is even (resp. odd). |
| , | (resp. ) is the probability that two random coalescing walks starting from and are absorbed by the same node in while the summation of two walks’ steps is even (resp. odd). |
| , | (resp. ) is the probability that two random coalescing walks starting from and are absorbed by different nodes in while the summation of two walks’ steps is even (resp. odd). |
| , , , | and are both representing ’s expressed opinion at time . The difference is and . can be obtained by . and represent ’s final expressed opinion (). |
| , | (resp. ) is the event that two random walks starting from and eventually meet and the first node they meet at is while the summation of the steps they have taken is even (resp. odd). |
| , | (resp. ) is the event that two coalescing random walks starting from and are both absorbed by node without meeting each other at a node in while the summation of two walks’ steps is even (resp. odd). |
The expected final expressed opinions can be calculated by (similar to the computation of in the VIO model)
where and . Notice that the can also be written as for any , so we have
In the analysis of the unsigned VIO model, we have
Therefore, we can obtain
and
Notice that for any ,
Recall Eq (2) that
| (12) |
Next, we focus on calculating . We consider the following two cases: a) two coalescing random walkers from and walking to the same node in , and b) two coalescing random walkers from and walking to different nodes in . Notice that if two random walkers end at the same node , thus for any ; and if two random walkers end at the different nodes and , thus for any . Therefore,
| (13) |
Next, we calculate and separately, similar to the proof of Lemma 3.
(a) .
If two walkers starting from and walk to the same node in , there are two cases: one is they meet at some node and then walk together until being absorbed; the other is they do not meet before they end their walks. Thus we have
and
Consider two non-coalescing random walks starting from and are absorbed by the same node while the summation of two walks’ steps is even:
Consider two non-coalescing random walks starting from and are absorbed by the same node while the summation of two walks’ steps is odd:
Thus
| (14) |
(b) .
Consider two non-coalescing random walks starting from and are absorbed by different nodes in while the summation of two walks’ steps is even:
Consider two non-coalescing random walks starting from and are absorbed by different nodes in while the summation of two walks’ steps is odd:
Thus
| (15) |
Similar to the proof of Lemma 2, we have
and
where
Thus, we can get the recursive equations of and :
and
After solving the above two recursive equations, we get and , and then we can get and .