Low-energy enhancement in the -ray strength functions of
Abstract
The -ray strength functions and level densities of 73,74Ge have been extracted up to the neutron separation energy Sn from particle- coincidence data using the Oslo method. Moreover, the -ray strength function of 74Ge above Sn has been determined from photo-neutron measurements; hence these two experiments cover the range of E 1-13 MeV for 74Ge. The obtained data show that both 73,74Ge display an increase in strength at low energies. The experimental -ray strength functions are compared with strength functions deduced from average values calculated within the shell model for a large number of transitions. The observed low-energy enhancements in 73,74Ge are adopted in the calculations of the 72,73Ge(n,) cross sections, where there are no direct experimental data. Calculated reaction rates for more neutron-rich germanium isotopes are shown to be strongly dependent on the presence of the low-energy enhancement.
pacs:
21.10.Ma, 25.20.Dc, 21.10.Tg, 21.60.Jz, 23.20.-g, 27.50.+eI Introduction
A good knowledge on how the atomic nucleus emits and absorbs photons is essential for the fundamental understanding of this many-faceted quantum system, as well as for a wide range of nuclear applications. To characterize the average, nuclear response to electromagnetic radiation, the -ray strength function (SF) Bartholomew has proven to be a fruitful concept when the nucleus is excited to high energies, and the density of quantum levels is high. There exists a wealth of information about the SF for nuclei above the neutron binding energy, Sn, predominantly from photo-neutron experiments atlasD&B and from the spectrum-fitting method SchillerT . For energies below the information is more scarce, as it remains quite challenging to extract the SF experimentally in this energy range. For this region the Oslo method schiller_geni , the two-step cascade method Hoogenboom and a statistical treatment of nuclear-resonance fluorescence spectra Rusev are frequently used.
For energies below 3 MeV, the SF of a nucleus is expected to correspond to the exponentially decreasing tail of the giant electric dipole resonance (GEDR). It therefore came as a surprise when a sizable low-energy enhancement in the SF, hereafter referred to as the upbend, was discovered below 3 MeV for 56,57Fe VoinovLetter . The SF measurement was performed at the Oslo Cyclotron Laboratory (OCL), using charged particle reactions (and confirmed using the two-step cascade method). In the following years this phenomenon was observed in a wide range of nuclei using the Oslo method ACL_Sc ; AB_Sc ; ACL_Ti ; NS_Ti ; MG_Ti ; ACL_V ; MG_Mo . Recently, the upbend was also reported with a different experimental technique in 95Mo WiedekingLetter .
The physical mechanisms behind the upbend have been a puzzle for many years, but intense experimental and theoretical endeavors have recently led to results. Through angular-distribution measurements, it was demonstrated that the upbend is dominantly of dipole nature ACL_dipolLetter . Furthermore, the authors of Ref. Litvinova suggested that the upbend is caused by thermal excitations in the continuum leading to enhanced low-energy 1 transitions. Shell model calculations performed in Refs. RSchwengner ; ABrown , on the other hand, show very strong 1 transitions at low -ray energies. Moreover, it has been shown AC&Goriely that the presence of the upbend may enhance the r-process (n, ) reaction rates by a factor of 10-100.
Unfortunately, the various experimental techniques based on (), (), (3He,3He) reactions often give rise to large deviations in the SFs below . Therefore, an international collaboration has been formed in order to investigate one specific nucleus as a test case. Germanium-74 was chosen, and four different experiments were performed: (3He,3He′), (,), (p,p′) and (,). In this work, we will present results from 3He induced reactions on 74Ge performed at the OCL, and data from a photo-neutron experiment on 74Ge performed at NewSUBARU in Japan. In Sec. II, the experimental details and the data analysis of the two experiments are discussed. The normalization procedure of the OCL data is presented and a discussion of the resulting SFs is made in Sec. III. Shell-model calculations on the 1 strength in 73,74Ge are presented in Sec. IV. Neutron capture cross sections and reaction rates are shown in Sec. V. Finally, a summary and outlook can be found in Sec. VI.
II Experimental results
II.1 The charged-particle experiment
The charged-particle experiment was performed at the OCL, where a beam of 38-MeV 3He particles with a current of 0.5 enA impinged on a self-supporting 0.5 mg/cm2 thick 74Ge target. The target was continuously irradiated for seven days. About 5106 and 2106 particle- coincidences were recorded in each of the two reaction channels of interest: 74Ge(3He, 3He) and 74Ge(3He, ).
The charged outgoing particles were identified and their energies measured with the SiRi system SiRi , consisting of 64 E-E silicon telescopes, with thicknesses of 130-m and 1550-m, respectively. SiRi was placed in forward direction, covering angles from = 40-54∘ and a solid angle coverage of 6 of 4. The rays were measured by the CACTUS array CACTUS consisting of 28 collimated 5′′ 5′′ NaI(Tl) detectors placed on a spherical frame surrounding the target and the particle detectors. The total efficiency of CACTUS is 15.2(1) at keV. Using reaction kinematics, the initial excitation energy of the residual nucleus can be deduced from the energy of the outgoing particles detected in SiRi. The particle- coincidence technique is used to assign each ray to a cascade depopulating a certain initial excitation energy in the residual nucleus.
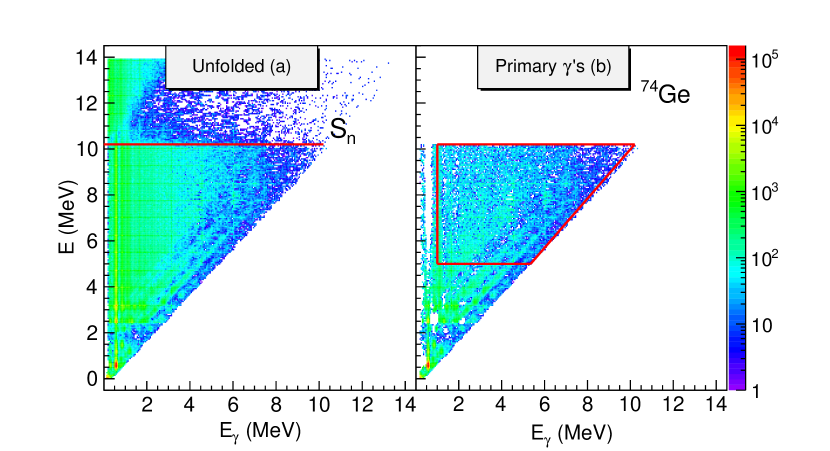
Figure 1(a) shows the excitation energy- matrix of the 74Ge(3He, 3He′) reaction, where the spectra have been unfolded unfold with the response functions of CACTUS. The neutron separation energy of 74Ge is reflected clearly in a drop in intensity at MeV. A relatively weak diagonal at , reveals that the direct feeding to the ground state of spin/parity 0+ is not particularly favored in this reaction. A second and third more pronounced diagonal represent direct decay to the 2+ states of 596 keV and 1204 keV, respectively. These rays stem from primary transitions in the -cascades.
We would like to study the energy distribution of all primary -rays originating from various excitation energies, and extract level density and SF simultaneously from this information. Using the unfolded matrix, a primary matrix , as shown in Fig. 1(b), is constructed using the subtraction method of Ref. forstegen . The basic assumption behind this method is that the -ray decay pattern from any excitation bin is independent of whether this bin was populated directly via the (3He, ) or (3He, 3He) reactions or indirectly via decay from higher excitation levels following the initial nuclear reaction. This assumption is fulfilled when states have the same relative probability to be populated by the two processes, since branching ratios are properties of the levels themselves.
Fermi’s golden rule predicts that the decay probability may be factorized into the transition matrix element between the initial and final states , and the density of the final states fermi :
| (1) |
Turning to our first generation -ray spectra we realize that they are proportional to the decay probability from to and we may write the equivalent expression of Eq. (1) as:
| (2) |
where is the -ray transmission coefficient, and is the level density at the excitation energy after the first -ray emission.
We notice that this expression does not allow us to simultaneously extract and . To do so, either one of the factorial functions must be known, or some restrictions have to be introduced. Our restriction comes in the form of the Brink-Axel hypothesis brink ; axel . The original hypothesis states that the GEDR can be built on any excited state, and that the properties of the GEDR do not depend on the temperature of the nuclear state on which it is built. This hypothesis can be generalized to include not only the GEDR, but any kind of collective nuclear excitation and results in the assumption that primary spectra originating from the excitation energy can be factorized into a -ray transmission coefficient , which depends only on the -transition energy , and into the level density at the final level. We have now the simple relation:
| (3) |
which permits a simultaneous extraction of the two functions from the first-generation matrix. At low excitation energies, the decay is, naturally, highly dependent on the individual initial and final state. This has been taken into consideration in our analysis, and we have excluded the -ray spectra originating from excitation energy bins below 3 MeV for 73Ge and 5 MeV for 74Ge. Also, a lower limit is set on the rays, where is 1 MeV and 1.5 MeV for 73Ge and 74Ge, respectively. In the range of , strong, discrete transitions are too heavily or to modestly subtracted in the first generation method, and are thus excluded from further analysis.
At this point in the analysis, we have established the functional form of the level density and transmission coefficient. As demonstrated in Ref. schiller_geni , there exists an infinite set of solutions to Eq. (3), using transformations. The last stages of the analysis of the OCL data and the normalization procedure will be described in Sec. III.
II.2 The photo-neutron experiment
The photo-neutron cross section measurement was performed at the synchrotron radiation facility NewSUBARU in the Hygo Prefecture newsubaru . Here a wide range of quasi monochromatic beams newsubaru2 are produced in head-on collisions between laser photons and relativistic electrons, so-called laser Compton scattering (LCS). The energy of the laser photons increases from a few eV to several MeV in the collision. In this experiment a 1.99 g/cm2 thick sample of 74Ge, enriched to 97.53, was placed inside an aluminum container and irradiated with eight different beams with energies ranging from 10.4 to 12.7 MeV.
The 74Ge sample was mounted in the center of a 4 neutron detection array comprised of 20 3He proportional counters embedded in a 363650 cm3 polyethylene moderator. The ring ratio technique originalRR was used to measure the average energies of the detected neutrons, and from this we establish the efficiency of the neutron detector as a function of neutron energy. A 65′′ NaI(Tl) detector was used to measure the flux of the LCS beam. The detector was placed at the end of the -ray beam line. The intensity of rays hitting the 74Ge target was s-1. The total number of rays on target for a certain beam energy was found using the pile-up method described in Ref. kondo . The almost monochromatic beams were monitored by a 3.54.0′′ LaBr3(Ce) detector between every neutron measurement run. These spectra are reproduced using GEANT4 GEANT4 simulations, and unfolded to extract the real energy profile of the incoming beam.
The (, n) cross section is given by
| (4) |
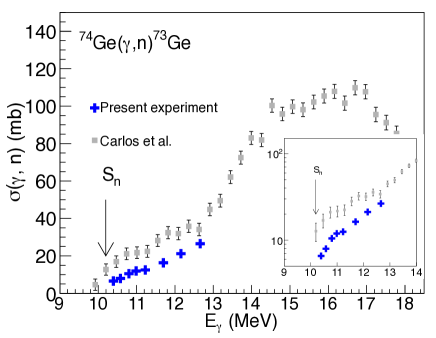
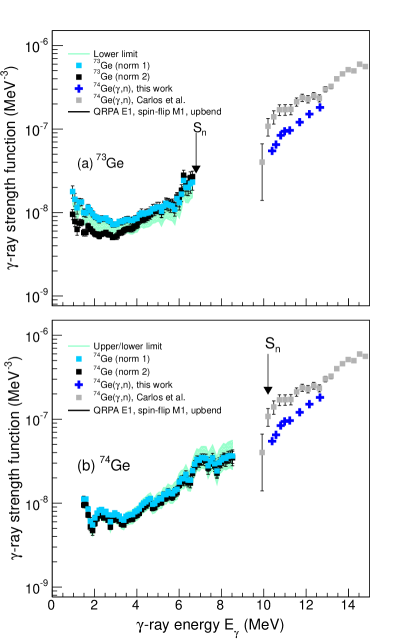
where denotes the energy distribution of the -ray beam normalized to unity, and is the photo-neutron cross section to be determined. Furthermore, represents the number of neutrons detected, gives the number of target nuclei per unit area, is the number of rays incident on target, represents the neutron detection efficiency, and gives a correction factor for a thick target measurement, where is the thickness of the target and is the attenuation coefficient of the target. The factor represents the fraction of the flux above . Equation (4) is solved for the cross section using a Taylor expansion method described in Ref. DanIoana_Sm . In this way, we find cross sections for eight different energies, starting from 200 keV above Sn of 74Ge. The total uncertainties in the measurements are 4.4 HildeTherese_Nd . The resulting 74Ge(,n) cross sections are shown in Fig. 2. We note that the newly measured data are lower than the data retrieved from a positron annihilation in-flight experiment by Carlos et al. carlos by 30 . The same trend has been reported by Berman et al. Berman_lav . In the insert in Fig. 2, the difference in shape between the two datasets becomes more apparent; our newly measured cross sections vanish at as expected, whereas the Carlos data exhibit a non-zero value in this range.
III Normalization of the OCL data
Once we have extracted the two vectors and from the first generation matrix, we can construct infinitely many solutions schiller_geni that give identical fits to the experimental data. The set of solutions are of the form
| (5) | ||||
| (6) |
and it is necessary to determine the transformation coefficients A, and B that gives solutions corresponding to the actual level densities and -transmission coefficients of 73,74Ge. To be able to do this, we take advantage of auxiliary data, mainly stemming from neutron resonance experiments. This process of determining the coefficients and thus the physical solutions is what we refer to as normalization of our experimental data.
III.1 Level density
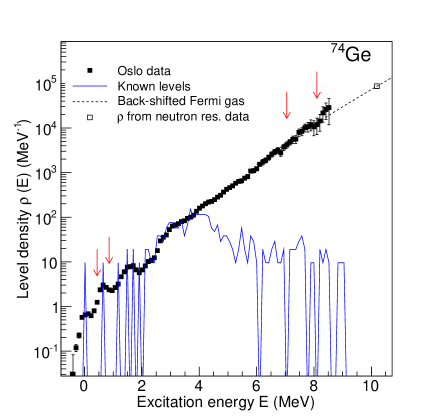
We start by establishing the normalized nuclear level densities (NLD) of 73,74Ge. This entails determining the two coefficients A and of Eq. (5). For this purpose we need two anchor points, i.e. two regions of excitation energy where there exist information on the NLD, either from experimental data or from theoretical calculations. A proper spacing between the anchor points is essential to ensure a reliable normalization. At low excitation energies, known, discrete levels can be used. The anchor points at low excitation energies of the two Ge isotopes are found simply by using the definition of NLD, , where is the number of levels in the energy bin, using the same bin size as our experimental one, where = 105 keV. The level schemes of 73,74Ge are assumed to be close to complete up to excitation energies of 1.38 MeV and 3.4 MeV, respectively NNDC , and we choose an area below these energies for normalization, see Fig. 3, where the arrows to the left show the area used in the case of 74Ge.
The second anchor point is at higher energies, where the most reliable experimental data on the NLD comes from neutron resonance experiments that provide average neutron spacings in the area of the neutron separation energy. In the case of 73,74Ge, -wave spacings, , are given in both RIPL-3 RIPL3 and the Atlas of Neutron Resonances of S. F. Mughabghab Mug , from neutron capture on 72Ge and 73Ge. After careful consideration, we have chosen to use an average value of the two proposed sets of values and uncertainties. The two main reasons for this choice are:
- 1.
- 2.
The s-wave spacings can be expressed in terms of partial level densities:
| (7) | ||||
| (8) | ||||
| (9) |
where and are the spin and parity, respectively, of the target nucleus. From Eq. (9), we find that the measured level spacing in the case of the 72Ge(n,) reaction corresponds to the density of states in 73Ge at = 6.783 MeV, . From 73Ge(n, ), the density of and states of 74Ge at = 10.196 MeV, , can be estimated. Our experimental NLD represents the density of almost all accessible spins at . From semi-classical calculations, we get 10 for a 3He beam at 38 MeV. Due to the lower limits applied on Eγ (see Sec. II) in the extraction of and , our NLDs reach only up to E - 1.5 MeV. We need to make an interpolation between our data points and the NLD at Sn. The back-shifted Fermi gas model with the parameterization of Egidy and Bucurescu E&B2009 has been chosen for this purpose (see Tab. 1). Another option had been to use a contant temperature model for the interpolation as recommended in Ref. Guttormsen_level , but in this case where the gap between the last data point and is so small the two types of interpolations gives very similar results (see Ref. Toft_Sn ). From this point in the analysis we will carry out the normalization according to two different normalization schemes.
III.1.1 norm-1
The main idea of this approach is to go from the spin- and parity-dependent NLD to the total NLD at :
| (10) |
This equation shows that we need information about the spin and parity distribution around the neutron separation energy. These quantities are both notoriously difficult to measure experimentally for all spins and both parities at such high excitation energies. At this point two assumptions are made:
-
1.
The spin dependence of the level density is given by the statistical approximation Ericson1 ; Ericson2 :
(11) where is the spin. The spin cut off parameter, , is parameterized as recommended in Ref. E&B2009 . The fact that in the case of 74Ge we know the density of 4+ and 5+ states that lie close to the center of the assumed spin distribution, will most probably lead to a good estimation of the full spin distribution.
-
2.
There is an equipartition of parities at the neutron separation energy for the two Ge isotopes. The assumption of parity symmetry at these high excitation energies for nuclei in this mass region is supported by Kalmykov_parity .
We can now express the level density at by schiller_geni :
| (12) |
and we have found our second anchor point.
III.1.2 norm-2
Recent microscopic calculations Goriely_level2008 ; Hilarie_level2006 ; Hilarie_level2001 based on the Hartree-Fock-Bogolyuobov (HFB) plus combinatorial (HFB + Comb.) approach have been successful in calculating NLDs of a wide range of nuclei. Such an approach provides the energy, spin and parity dependence of the NLD. For flexibility, the calculated NLD can be normalized, if need be, to reproduce experimental -wave spacings and the density of discrete levels at low excitation energies. These calculations have no a priori assumptions on the spin or parity distribution. The microscopic calculations generally give a broad spin distribution with a center of gravity at quite high spins, and provide a higher NLD at (see Tab. 1).
We keep in mind that the different normalizations, norm-1 and norm-2, will lead to different slopes, , of the normalized level density, and because of their interconnection also determine the slope for the -transmission coefficient, see Eqs. (5) and (6).
| Nucleus | a | ||||||||
|---|---|---|---|---|---|---|---|---|---|
| (eV) | (MeV) | (MeV-1) | (MeV) | (MeV-1) | (MeV-1) | (meV) | |||
| 73Ge | 0+ | 1785(209) | 6.783 | 3.66 | 9.00 | -1.32 | 156(35) | 23521 | 195(50) |
| 74Ge | 9/2+ | 80.5(9) | 10.196 | 3.77 | 9.70 | 0.71 | 860(98) | 98083 | 196(23) |
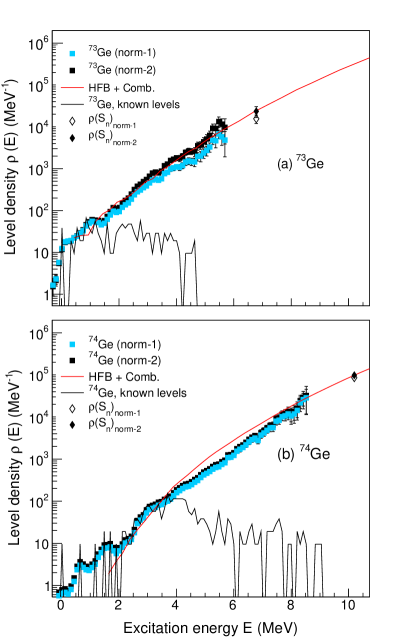
In Fig. 4 the results of the two normalizations of the NLDs are presented. Norm-1 and norm-2 give a lower and upper limit of the normalization of the two NLDs. We see that the discrete levels at low excitation energy are well reproduced, and that the good statistics of the experiment yields small statistical errors.
It is seen that the unpaired neutron in 73Ge implies a higher NLD than for 74Ge. Another striking feature is the linearity of the NLD in log scale. This means that the NLD can be well described by the constant temperature expression:
| (13) |
where is determined by the slope of ln(E). This linearity has previously been observed for many nuclei, and is described in detail in Guttormsen_level ; Moretto .
III.2 -transmission coefficient and SF
The normalization of the -transmisson coefficient, , consists of determining the scaling factor B in Eq. (6) as is already determined. Average radiative widths of neutron resonances are very important properties of -decay from nuclear states at high excitation energy, and can be used to normalize . We normalize according to AVoinovGamma :
| (14) |
where and are the spin and parity of the target nucleus in the reaction, and is the experimental level density.
The total average radiative widths are rather complex, depending on the -transmission coefficient, the NLD and the spin distribution. An average of the listed experimental values of from Refs. Mug ; RIPL3 is taken for 74Ge, giving = 196(9) meV. The large number of resonances listed in Mug and gives us confidence in the quite low uncertainty in this quantity. We also note that this value of gives a good agreement with the newly measured () data. Concerning the listed value of for 73Ge in Mug , we notice that this average value is only based on four experimental values, ranging from between 130 and 200 meV, giving an average value of 150(35) meV. RIPL3RIPL3 lists a value of 162(50) meV. These values are 15-30 lower than the average value for 74Ge. Considering the poor statistics of 73Ge compared to the case of 74Ge, we have chosen to set the value of 73Ge to 195(50) meV, also in order to be consistent with the (,n) data for 74Ge. As for the NLDs, we follow here two parallel normalization schemes. Lastly, taking into account that the transitions between states in the quasi continuum are dominantly of dipole type (e.g JKopecky ; ACL_dipolLetter ) the -transmission coefficient, , relates to the SF, , in the following way RIPL3 :
| (15) |
We thus deduce the dipole strength from the normalized -transmission coefficient.
Coming back to the photo-neutron cross sections, they are related to the SF, , by
| (16) |
which can be directly compared with the Oslo data from the principle of detailed balance, giving RIPL3 .
Now we are ready to present the SF below together with the data points above from the photo-neutron experiment. The SFs of 73,74Ge from the two normalization methods, norm-1 and norm-2, are shown in Fig. 5. The error bars of the data points include statistical errors, and propagated systematic errors from the unfolding and the primary -ray extraction. Systematic errors originating from the normalization process are indicated as upper and lower limits. We notice that norm-2 gives lower and steeper SFs than norm-1 in the case of 73Ge, but in the case of 74Ge the two normalization schemes give very similar results. The SFs below are in both cases in good agreement with the new photo-neutron data on 74Ge.
We observe a resonance-like structure centered at 7 MeV. This has also been observed in the 74Ge(,)74Ge reaction MWiedekingPrivate . Strength functions from the 74Ge() experiment are in good agreement with the results presented here gamma_gamma . We also see that both the SFs of 73,74Ge are increasing at decreasing -ray energies below 3 MeV. This finding is expected from the results of Ref. AC_76Ge , where the SF of 76Ge was reported to show a similar upbend. In the following, we will compare our data with calculations of the strength.
IV Shell-model calculations of the 1 strength
We have performed shell-model calculations by means of the code RITSSCHIL zwa85 using a model space composed of the proton orbits and the neutron orbits relative to a 66Ni core. This configuration space is analogous to the one applied in an earlier study of strength functions in 94,95,96Mo and 90Zr RSchwengner . In the present calculations for 73,74Ge, four protons were allowed to be lifted from the shell to the orbit and two neutrons from the to the orbit. This resulted in dimensions up to 11400. For comparison, strength functions were deduced also for the neutron-rich isotope 80Ge. In these calculations, one neutron could be excited from the to the orbit. We note here that the resctricted model space does not fully reproduce the collectivity in the near-yrast states of 74Ge. However, the calculations give an approach to the characteristics of transitions between excited states above the yrast line RSchwengner ; sch14E2 .
The calculations included states with spins from = 0 to 10. For each spin the lowest 40 states were calculated. Reduced transition probabilities were calculated for all transitions from initial to final states with energies and spins . For the minimum and maximum , the cases and , respectively, were excluded. This resulted in more than 23800 transitions for each parity and , which were sorted into 100 keV bins according to their transition energy . The average value for one energy bin was obtained as the sum of all values divided by the number of transitions within this bin.
The strength functions were deduced using the relation
| (17) |
They were calculated by multiplying the value in of each transition with times the level density at the energy of the initial state in MeV-1 and deducing averages in energy bins as done for the values (see above). The level densities were determined by counting the calculated levels within energy intervals of 1 MeV for the two parities separately. The strength functions obtained for the two parities were subsequently added. Gates were put on the excitation energy Ex, corresponding to the ones applied in the analysis of the experimental data (see Sec. II). The resulting strength function for 74Ge is shown in Fig. 6.
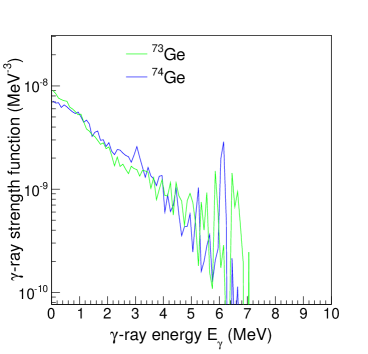
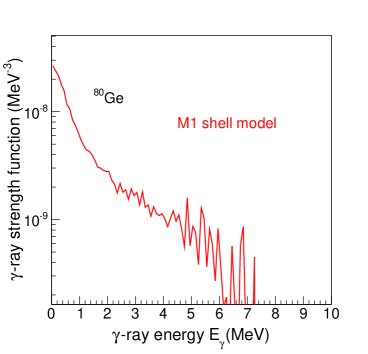
The calculated strength function shows a low-energy enhancement similar to that of the strength functions calculated for the neighboring nuclei 94,95,96Mo, 90Zr RSchwengner and for 56,57Fe ABrown . However, the slope is not as steep as in the nuclides close to = 50 RSchwengner . The strength function calculated for the = 48 isotope 80Ge is shown in Fig. 7. One sees that the slope of this is steeper than that of 74Ge and reaches larger values toward = 0. The dominating configurations of states in 73Ge linked by transitions with large values are of the type for positive-parity states and for negative-parity states. In 74Ge, the configurations are analogous, including one neutron more. In addition, configurations of the type contribute for positive parity. The corresponding configurations in 80Ge are and for positive-parity states, and and for negative-parity states.
V Calculations of (n,) cross section and reaction rates
The measured NLD and the SF together with the nucleon-nucleus optical potential, assuming a compound reaction, can now be applied to calculate the neutron-capture cross section. It has been shown that using the experimental NLD and SF extracted using the Oslo method as input for (n, ) cross section calculations gives a very good agreement with experimental cross section data Tamas . In this work, we focus on the cross sections 73Ge(n, )74Ge and 72Ge(n, )73Ge.
It is interesting to notice that both Kap_s_process and Bao_MACS list 72,73Ge as amongst the very few of the 277 stable isotopes that at present, lack (n,) cross-section data. Based on our new data on 73,74Ge, we can provide a semi-experimental capture reaction cross section. The reaction code TALYS-1.6 talys is used to perform the calculations. In the case of the neutron-nucleus optical potential we use the Koning Delaroche model Koning_Potensial . Based on the present status of the discussion of the electromagnetic character of the upbend, e.g. whether it is of 1 or 1 type, we treat the input SF in two ways:
-
(i)
The upbend of the SF is described by the exponential function
(18) The low-energy enhancement is considered to be of type, supported by recent publications RSchwengner ; ABrown and the present shell-model calculations. This is combined with QRPA calculations of the 1 strength from SGoriely_QRPA and a standard treatment of the spin-flip resonance as described in the TALYS documentation talys . This combined function represents the SF input.
-
(ii)
We give measured experimental points of the SF as input, and assume that all the strength is of 1 type, in accordance with Litvinova .
The SF of (i) and (ii) are both combined with two prescriptions for NLD; the one resulting from norm-1 and the pure HFB + combinatorial one from Goriely_level2008 , the uncertainties of the values and values being taken into account. In Fig. 8, the 72Ge(n,)73Ge and 73Ge(n,)74Ge radiative neutron capture cross sections obtained with the different combinations of NLD and SF are shown. The band width represents the obtained uncertainties taking into account the different input combinations and all systematic and statistical errors.
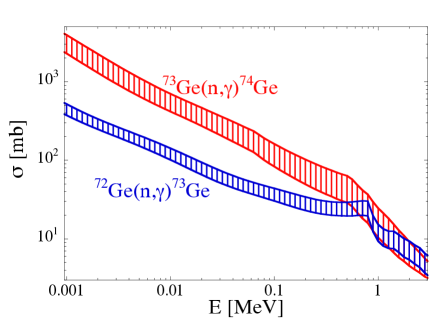
The corresponding astrophysical Maxwellian-averaged cross sections (MACS) amount to = 66(13) mb and 294(78) mb for 72Ge(n,) and 73Ge(n, ), respectively, at = 30 keV (i.e. a temperature of K), and agree well with the previous theoretical values recommended by Bao et al. Bao_MACS at = 73(7) mb and 243(47) mb, respectively.
V.1 Reaction rates of neutron rich Ge isotopes
It has previously been shown that the upbend can have a significant effect on the neutron capture cross section of exotic neutron-rich nuclei AC&Goriely . Naturally, it is an open question whether the upbend exists in neutron-rich Ge isotopes (Ref. AC_76Ge reports a similar strength of the upbend in the SF of the slightly more neutron rich isotope 76Ge). The shell-model calculations of the 80Ge SF supports the assumption of a persisting upbend for neutron-rich Ge isotopes. In the following we will assume that the upbend remains as strong in isotopes approaching the neutron drip line as observed in 73,74Ge. A fit to the 74Ge SF data give the parameters = in Eq. (18). These parameters for the upbend have been applied to the neutron-rich Ge-isotopes. We calculate the ratio of the reaction rates including and excluding the upbend for temperatures corresponding to two proposed r-process sites Goriely_rprocess ; a cold r-process in neutron star mergers and a hot r-process as in a neutrino-driven wind in core-collapse. As one goes to neutron rich nuclei we rely on theoretical calculations of the , NLD, and SF, since they are at this point experimentally inaccessible. Some uncertainties arise, especially from the mass model used to establish . The input used in the TALYS calculations of the astrophysical reaction rates in this case are: for the mass, the Skyrme-HFB mass model of Ref. SGoriely_mass , for the NLD, the HFB + Combinatorial model Goriely_level2008 and for the SF, the HFB + QRPA model SGoriely_E1 . For the spin-flip resonance the standard TALYS treatment has been applied RIPL3 .
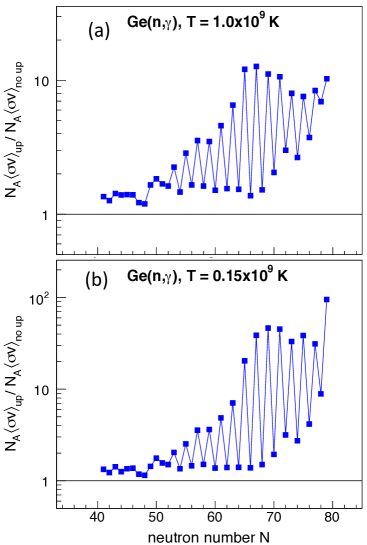
Calculations for a hot astrophysical environment of GK are shown in Fig. 9(a). Odd-even staggering effects are strong, reflecting the difference in the neutron separation energy of isotopes with odd and even neutron number. The sensitive energy range of the SF in the neutron capture reaction is situated typically a few MeV below , corresponding to the upbend-region for the extremely neutron-rich odd Ge isotopes. As expected, we see that the influence of the upbend becomes more important as the number of neutron increases. The maximum increase for the extremely neutron rich nuclei is a factor 15 for the case of GK. Figure 9(b) shows the calculated reaction rates for the case of a cold r-process with GK. For this temperature, an increase of a factor 60-70 in the reaction rates is seen for the most neutron-rich isotopes. Even for more moderately neutron-rich nuclei, an increase of a factor of 2 can be observed. Hence, we conclude that the impact of the upbend on the (n, ) reaction rates could be significant for the Ge case, as already shown in Ref. AC&Goriely .
VI Summary
The NLDs and SFs of 73,74Ge in the energy range below have been extracted from particle- coincidence data using the Oslo method. Moreover, the SF above of 74Ge has been deduced from a photo-neutron experiment. A low-energy enhancement in the SF is observed in both nuclei. Shell-model calculations on 74Ge indicate that the enhancement is (at least partly) due to transitions. The neutron capture cross sections 72Ge(n,) and 73Ge(n,) could for the first time be experimentally constrained using our new data as input. The effect of the upbend on the astrophysical reaction rates is investigated, and is shown to be significant for neutron-rich isotopes.
Acknowledgements
The authors wish to thank J. C. Müller, E . A. Olsen, A. Semchenkov, and J. Wikne at the Oslo Cyclotron Laboratory for providing excellent experimental conditions and LBNL for providing the 74Ge target used in the OCL experiment. A. C. L. acknowledges financial support from the Research Council of Norway, project grant no. 205528 and from the ERC-STG-2014 under grant agreement no. 637686. Part of this work was supported by the National Research Foundation of South Africa under contract nos.: 92789 and 78766. D. M. F., O. T. and I. G. acknowledge financial support from the Extreme Light Infrastructure Nuclear Physics (ELI-NP) Phase I, a project co-financed by the Romanian Government and the European Union through the European Regional Development Fund (425/12.12.2012, POS CCE, ID 1334 SMIS-CSNR 40741). S. G. acknowledges the financial support from the F. N. R. S.
References
- (1) G. A. Bartholomew, E. D. Earle, A. J. Ferguson, J. W. Knowles, and M. A. Lone, Adv. Nucl. Phys. 7, 229 (1972).
- (2) S. S. Dietrich and B. L. Berman, At. Data Nucl. Data Tables 38, 199 (1988).
- (3) A. Schiller and M. Thoennessen, At. Data Nucl. Data Tables 93, 549 (2007).
- (4) A. Schiller, L. Bergholt, M. Guttormsen, E. Melby, J. Rekstad, and S. Siem, Nucl. Instrum. Methods Phys. Res. A 447, 498 (2000).
- (5) A. M. Hoogenboom, Nucl. Instrum. Methods 3, 57 (1958).
- (6) G. Rusev et al., Phys. Rev. C 77, 064321 (2008).
- (7) A. Voinov et al., Phys. Rev. Lett. 93, 142504 (2004).
- (8) A. C. Larsen et al., Phys. Rev. C 76, 044303 (2007).
- (9) A. Bürger et al., Phys. Rev. C 85, 064328 (2012).
- (10) A. C. Larsen et al., Phys. Rev. C 85, 014320 (2012).
- (11) N. U. H. Syed et al., Phys. Rev. C 80, 044309 (2009).
- (12) M. Guttormsen et al., Phys. Rev. C 83, 014312 (2011).
- (13) A. C. Larsen et al., Phys. Rev. C 73, 064301 (2006).
- (14) M. Guttormsen et al., Phys. Rev. C 71, 044307 (2005).
- (15) M. Wiedeking et al., Phys. Rev. Lett. 108, 162503 (2012).
- (16) A. C. Larsen et al., Phys. Rev. Lett. 111, 242504 (2013).
- (17) E. Litvinova and N. Belov, Phys. Rev. C 88, 031302(R) (2013).
- (18) R. Schwengner, S. Frauendorf, and A. C. Larsen, Phys. Rev. Lett. 111, 23504 (2013).
- (19) B. Alex Brown and A. C. Larsen, Phys. Rev. Lett. 113, 252502 (2014).
- (20) A. C. Larsen and S. Goriely, Phys. Rev. C 82, 014318 (2010).
- (21) M. Guttormsen, A. Bürger, T. E. Hansen, and N. Lietaer, Nucl. Instrum. Methods Phys. Res. A 648,168(2011).
- (22) M. Guttormsen, A. Ata̧c, G. Løvhøiden, S. Messelt, T. Ramsøy, J. Rekstad, T. F. Thorsteinsen, T. S. Tveter, and Z. Zelazny, Phys. Scr., T 32, 54 (1990).
- (23) M. Guttormsen, T. S. Tveter, L. Bergholt, F. Ingebretsen, and J. Rekstad, Nucl. Instrum. Methods Phys. Res. A 374, 371 (1996).
- (24) M. Guttormsen, T. Ramsøy, and J. Rekstad, Nucl. Instrum. Methods Phys. Res A 255 , 518 (1987).
- (25) E. Fermi, Nuclear Physics. University of Chicago Press (1950).
- (26) D. M. Brink, Ph.D. thesis, Oxford University, 1955.
- (27) P. Axel, Phys. Rev. 126, 671 (1962).
- (28) S. Amano, K. Horikawa, K. Ishihara, S. Miyamoto, T. Hayakawa, T. Shizuma, T. Mochizuki, Nucl. Instrum. Methods Phys. Res. A 602, 337 (2009).
- (29) K. Horikawa, S. Miyamoto, S. Amano, and T. Mochizuki, Nucl. Instrum. Methods in Phys. Res. A 618, 209 (2010).
- (30) B. L. Berman, S. C. Fultz, Rev. Med. Phys. 47, 713 (1975).
- (31) T. Kondo, H. Utsunomiya, H. Akimune, T. Yamagata, A. Okamoto, H. Harada, F. Kitatani, T. Shima, K. Horikawa, S. Miyamoto, Nucl. Inst. and Meth. A 659, 462 (2011).
- (32) J. Allison et al., IEEE transactions on nuclear science, vol. 53, no. 1, (2006).
- (33) D. M. Filipescu, I. Gheorghe, H. Utsunomiya, S. Goriely, T. Renstrøm, H.-T. Nyhus et al., Phys. Rev. C 90, 064616 (2014).
- (34) H.-T. Nyhus, T. Renstrøm, H. Utsunomiya, S. Goriely, D. M. Filipescu, I.Gheorghe, et al., Phys. Rev. C 91, 015808 (2015).
- (35) P. Carlos et al., Nuclear Physics A 258, 365 (1976).
- (36) B. L. Berman, R. E. Pywell, S. S. Dietrich, M. N. Thompson, K. G. McNeill, J. W. Jury, Phys. Rev. C 36, 1286 (1987).
-
(37)
Data extracted using the NNDC On-Line Data Service from the ENSDF database, November 2014
http://www.nndc.bnl.gov/ensdf. -
(38)
R. Capote et al., Nucl. Data Sheets 110, 3107 (2009).
RIPL-3 Handbook for calculation of nuclear reaction;
available at https://www-nds.iaea.org/RIPL-3/. - (39) S. F. Mughabghab, Atlas of Neutron Resonances (Elsevier Science, Amsterdam, 2006). 5th ed.
- (40) M. Guttormsen, et al., avaliabale online at http://arXiv:1503.03300 [nucl-ex].
- (41) H. K. Toft et al., Phys. Rev. C 81, 064311 (2010).
- (42) T. Ericson, Nucl. Phys. 11, 481 (1959).
- (43) T. Ericson, Adv. Phys. 9, 425 (1960).
- (44) T. von Egidy and D. Bucurescu, Phys. Rev. C 80, 054310 (2009).
- (45) Y. Kalmykov et al., Phys. Rev. Lett. 99, 202502 (2007).
- (46) S. Hilaire and S. Goriely, Nucl. Phys. A 779, 63 (2006)
- (47) S. Hilaire, J-P. Delaroche and M. Girod, Eur. Phys. J. A 12, 169 (2001).
- (48) S. Goriely, S. Hilaire and A. J. Koning, Phys. Rev. C 78, 064307 (2008).
- (49) L. G. Moretto, A. C. Larsen, F. Giacoppo, M. Guttormsen, S. Siem and A. V. Voinov, avaliable online at http://arXiv:1406.2642.
- (50) A. Voinov et al., Phys. Rev. C 63, 044313 (2001).
- (51) J. Kopecky and M. Uhl, Phys. Rev. C 41, 1941 (1990).
- (52) D. Negi et al., submitted (2015).
- (53) R. Massarczyk et al., Phys. Rev. C 92, 044309 (2015)
- (54) A. Spyrou, S. N. Liddick, A. C. Larsen et al., Phys. Rev. Lett. 113, 232502 (2014).
- (55) D. Zwarts, Comput. Phys. Commun. 38, 365 (1985).
- (56) R. Schwengner, Phys. Rev. C 90, 064321 (2014).
- (57) T. G. Tornyi, M. Guttormsen, T. K. Eriksen, A. Görgen, F. Giacoppo, T. W. Hagen, A. Krasznahorkay, A. C. Larsen, T. Renstrøm, S. J. Rose, et al., Phys. Rev. C 89, 044323 (2014).
- (58) F. Käppeler, R. Gallino, S. Bisterzo, and Wako Aoki, Rev. Mod. Phys. 83, 157 (2011).
- (59) Z. Y. Bao et al., Atomic Data and Nuclear Data Tables 76, 70 (2000).
- (60) A. J. Koning, S. Hilaire, and M. C. Duijvestijn, in : Proceedings of the International Conference on Nuclear Data for Science and Technology, 2227 April 2007, Nice, France, edited by O. Bersillon, F. Gunsing, E. Bauge, R. Jacqmin, and S. Leray (EDP Sciences, Les Ulis, 2008), p. 211-214.
- (61) A. Koning, J.-P. Delaroche, Nucl. Phys. A 713, 231 (2003).
- (62) S. Goriely and E. Khan, Nucl. Phys. A706, 217 (2002).
- (63) M. Arnould, S. Goriely, K. Takahashi, Physics Reports 450, 97 (2007).
- (64) S. Goriely, N. Chamel, and J. M. Pearson, Phys. Rev. Lett. 102, 152503 (2009).
- (65) S. Goriely, E. Khan, and M. Samyn, Nucl. Phys. A 739, 331 (2004).