Thermal Conductivity Of Rubble Piles
Abstract
Rubble piles are a common feature of solar system bodies. They are composed of monolithic elements of ice or rock bound by gravity. Voids occupy a significant fraction of the volume of a rubble pile. They can exist up to pressure , where is the monolithic material’s yield strain and its rigidity. At low , contacts between neighboring elements are confined to a small fraction of their surface areas. As a result, the effective thermal conductivity of a rubble pile, , can be orders of magnitude smaller than, , the thermal conductivity of its monolithic elements. In a fluid-free environment, only radiation can transfer energy across voids. It contributes an additional component, , to the total effective conductivity, . Here , the inverse of the opacity per unit volume, is of order the size of the elements and voids. An important distinction between and is that the former is independent of the size of the elements whereas the latter is proportional to it. Our expression for provides a good fit to the depth dependence of thermal conductivity in the top of the lunar regolith. It also offers a good starting point for detailed modeling of thermal inertias for asteroids and satellites. Measurement of the response of surface temperature to variable insolation is a valuable diagnostic of a regolith. There is an opportunity for careful experiments under controlled laboratory conditions to test models of thermal conductivity such as the one we outline.
1. Introduction
Observational evidence for rubble piles is varied. Mean densities, , below are typical of Saturn’s icy satellites with radii smaller than (Dougherty et al., 2009), indicating porosity throughout their entire bodies. Lunar seismometers detected strong scattering in the upper of the Moon implying the presence of fractures and voids (Heiken et al., 1991). The sharp decline in the number of asteroids with spin periods below demonstrates both their low mean densities, , and weak cohesion (Waszczak et al., 2015). Thermal responses of asteroids and satellites to time variations of the incident solar flux yield thermal inertias approximately two orders of magnitude smaller than those of monolithic materials (Delbo’ & Tanga, 2009; Howett et al., 2010). The lunar surface is covered by a layer of regolith whose density in the top ranges between to (Heiken et al., 1991) and thus below that of rock, .
Goldreich & Sari (2009) studied the elastic behavior of rubble piles. They pointed out that voids rather than cracks are the essential difference between rubble piles and monoliths. We focus on the thermal properties of rubble piles, which have broad applications. In the fluid free environment pertinent to asteroids and satellites lacking atmospheres, voids impede heat transfer.
Our paper is organized as follows. In Section 2, we evaluate the condition for a rubble pile to survive and show that it is consistent with indications from observations. We derive an order-of-magnitude expression for the effective conductivity, and compare it to measurements of the thermal conductivity of the lunar regolith in Section 3. Section 4 presents a model for the thermal inertia of a rubble pile and tests it against observationally determined values for the Moon and the icy Saturnian satellites. We conclude with a short discussion in Section 5.
2. Conditions For Existence Of Rubble Piles
Consider a typical monolithic element composing a rubble pile.111This section applies and extends aspects of the Hertz (1882) theory of contact between elastic bodies. Its surface is generally coarse, i.e., covered by nubs spanning a wide range of radii of curvature (Johnson, 1987). Contacts between neighboring elements typically involve nubs with the smallest radii of curvature, , that can survive strains generated by the weight of the overlying material. Smaller nubs are crushed and flattened. Figure (1) illustrates the geometry.

Although each element participates in several contacts, it suffices to focus on just one. As shown in Figure (1), the nub is compressed by resulting in contact area . Near contact, the maximum strain, , and stress, , concentrate in a volume where and denote yield strain and shear modulus, respectively.
At average pressure , each element must transmit force across contact area . Combining the above relations, we obtain
| (1) | |||||
| (2) | |||||
| (3) |
which apply for both and . At , . Above this pressure voids shrink leading the mean density to grow. At , , i.e., the strain reaches throughout the element, voids close and the density approaches its monolithic value. We refer to as the low-pressure regime and as the high-pressure regime. Rubble piles do not exist at .
The hydrostatic pressure at the center of a homogeneous sphere is . Thus the low-pressure regime would apply throughout bodies with ;
| (4) |
whereas the limit of the high-pressure regime would be reached at the centers of bodies with ;
| (5) |
Values of and apply to bodies composed of either rock or ice; is about 10 times larger for rock than for ice, but for ice is about 3 times smaller than that for rock.
Mean densities as small as half that of the monolithic density of their constituents would be restricted to although less substantial under-densities could persist up to . Rubble piles may exist in the upper layers of bodies larger than . Given surface gravity , low-pressure and high-pressure regimes would extend to depths and . Assuming and parameters appropriate to the Moon, , , and , we estimate and . Passive seismic experiments on the moon indicate that wave scattering is strongest in the upper (Heiken et al., 1991), presumably where fractures and voids are most abundant.
3. Effective Conductivity
3.1. Phonon Conductivity
Suppose the temperature drops by across an element. In steady state, with uniform monolithic conductivity, , and without heat sources or sinks, the temperature, , satisfies . Like the stress, the magnitude of the temperature gradient peaks in the vicinity of the contact. Away from the contact, the conductive flux and hence diminish roughly quadratically with distance implying within distance from the contact (Batchelor & O’Brien, 1977). Thus the total conductive luminosity passing through the contact is , from which we deduce that the effective conductivity
| (6) |
Equation (6) applies in both low and high pressure regimes.
In the low pressure limit, , perfect elastic spheres would have
| (7) |
but measurements of in granular media consisting of commercially manufactured spheres (Watson, 1964; Huetter et al., 2008) obtain results similar to those found using crushed materials of similar composition and size. Presumably, even the surfaces of carefully manufactured spheres possess a spectrum of small scale irregularities.
3.2. Photon Conductivity
Radiation contributes to the effective conductivity in three ways.
-
•
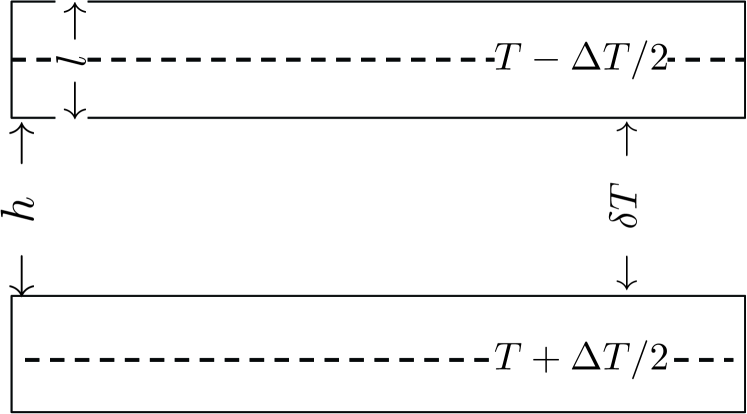
In a fluid free environment and absent physical contacts, only radiation can transfer energy between elements. To assess the rate at which it does so, we consider the simple setup displayed in Figure 2 in which parallel monolithic slabs of thickness are separated by a vacuum gap of thickness . We assume steady state conditions and slabs opaque to thermal radiation. For , the flux, satisfies
(8) (9) (10) These equations yield
(11) (12) In the limit most important to our investigation, , and . In other words, each slab is nearly isothermal and the conductive flux passing through it is determined by the rate at which radiation transfers energy across the vacuum gap separating adjacent slabs. Moreover, for , .
-
•
Next imagine cutting holes of radius in random locations through each slab. Now some photons may travel a vertical distance before striking a slab. This provides a direct radiative conductivity .
-
•
Radiation can also transport energy through elements composed of transparent materials but we neglect this effect because ice and rock are opaque to infrared radiation.
Combining the results of the first two items discussed above, we define the radiative conductivity
| (13) |
where following standard convention, is the inverse opacity per unit volume. In practice we expect that , the typical linear size of both elements and voids.
3.3. Application to the Lunar Regolith
Keihm et al. (1973)222 These results may suffer from poor thermal linkage in the probe-borestem system as remarked by Langseth et al. (1976), in which was estimated to be smaller than that in Keihm et al. (1973). determined the thermal conductivity of the lunar regolith from temperatures measured by thermocouples the Apollo 15 astronauts placed on the Moon’s surface. Their results are plotted as solid circles in Figure 3. The effective conductivity, , includes contributions from both phonon and photon diffusion. Because the latter is proportional to , it is important to note that the values of are those appropriate for the mean temperature at each depth. Although temporal variations in surface temperature are large, spanning most of the range between , those of the mean temperature are modest, rising from at the surface to at the maximum depth of .
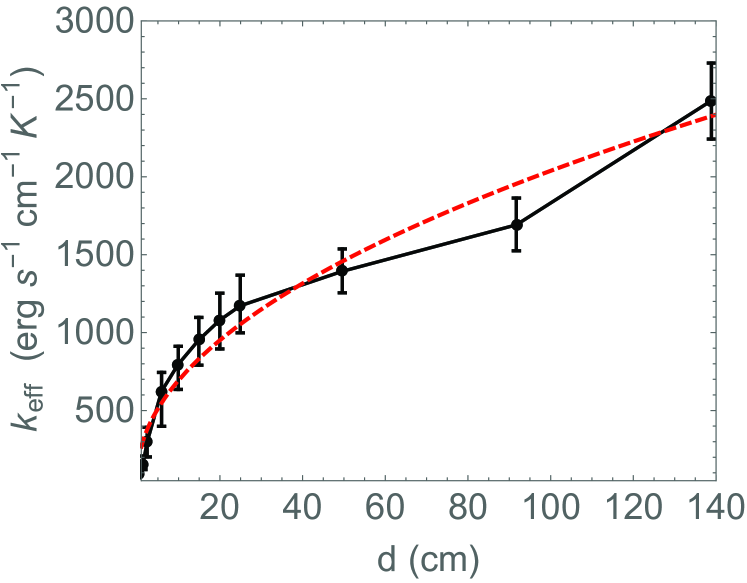
Thus we neglect the latter and make a 2 parameter fit to the data inspired by contributions to from phonon and photon diffusion expressed by equations (7) and (13), respectively. We find
| (14) |
where denotes depth below the surface. In choosing such a simple form, we are ignoring not only the depth dependence of the mean temperature but also potential variations with depth of grain size and composition. Equating the form of from equation (6) to , yields for , with , , , and .333Given the order of magnitude nature of our analysis, the value of should be viewed as unremarkable. To fit the pressure dependence of the shear velocity in sand, Goldreich & Sari (2009) require . Setting and appealing to equation (13), we obtain for the photon diffusion length. This length is several times smaller than the depth at which phonon and photon diffusion contribute equally to . Another relevant comparison is with grain sizes at the Apollo 15 landing site. As reported by Papike et al. (1982), grains smaller and larger than contribute similar amounts to the overall density of the regolith.
4. Thermal Inertia
A body’s thermal inertia is an important diagnostic of its surface. It is deduced from the amount by which variations of surface temperature, , lag those of the incident radiative flux. For monolithic material, thermal inertia is defined by
| (15) |
where thermal diffusivity,
| (16) |
with denoting specific heat capacity.
Provided all vibrational degrees of freedom are classically excited, common monolithic insulators share the almost universal values of and (White, 2012). Each nucleus contributes to the heat capacity and is surrounded by an electron cloud whose volume is insensitive to the screened nuclear charge. Taking each nucleus to occupy a cube with sides yields . Most of the thermal energy is stored in the shortest wavelength lattice vibrations and typically these propagate a few lattice spacings at speeds of a few before being scattered. With mean free path and propagation speed , . Consequently,444We express thermal inertia in the cgs unit, , instead of the more convential mks unit .
| (17) |
We motivate the definition of thermal inertia by means of a simple example. Consider the response of a body to the sudden imposition of a constant incident flux at . In the interest of simplicity, we treat a monolithic body with independent of both and and assume zero albedo. Surface temperature, , is determined by balancing the incident flux against the sum of the outward radiative flux and the inward conductive flux;
| (18) |
where we approximate by divided by the penetration depth, , for thermal diffusion during time . Initially most of the incident flux is conducted inward and
| (19) |
At
| (20) |
the outward radiative and inward conductive fluxes are comparable. Thereafter, the radiative flux dominates and asymptotically approaches .
Fitting variations of surface temperature in response to variations of incident solar flux requires a model for . Ours includes depth dependence from and temperature dependence from . Here we consider limiting cases in which either the former or the latter dominates.
-
•
Suppose phonon diffusion dominates heat transfer; .
We evaluate at the depth to which the thermal wave propagates in time , . This procedure yields
(21) for flux variations on timescale .
-
•
Next consider the opposite limit in which photon diffusion dominates; .
Here
(22) which has no explicit dependence on .
From observations during a lunar eclipse with umbral duration , Muncey (1963) estimates . Linsky (1966) estimates from data obtained during a lunation, d. From Keihm et al. (1973) and our fit to in equation (14), it appears that both phonon and photon diffusion contribute significantly to during a lunar eclipse but that the phonon contribution dominates during a lunation. Unfortunately, neither these old data nor our theory are precise enough to justify a more detailed analysis. Mid-infrared measurements made by the radiometer on the Lunar Reconnaissance Orbiter presents a comprehensive picture of the Moon’s surface temperature over 4 lunations (Vasavada et al., 2012). It clearly warrants more careful modeling than we are currently capable of doing.
Microwave measurements from the Rosetta orbiter made prior to Philae’s landing on comet 67P/Churyumov-Gerasimenko, were interpreted to imply a representative thermal inertia, , in the range for the overall surface (Gulkis et al., 2015). Shortly thereafter, diurnal temperature variations measured at the Philae landing site, Abydos, yielded an estimate of for the local thermal inertia (Spohn et al., 2015) . These low values imply a porous surface. Lack of knowledge of the local regolith prevents the direct application of our formulae for . However, in-situ measurements of the variation of the surface temperature over the comet’s orbital period might separate contributions from phonon and photon conduction because we expect and independent of .
Thermal inertia is an essential component of the Yarkovsky effect which drives significant orbital migration of small asteroids (Bottke et al., 2006). This migration is responsible for the rate at which the semi-major axes of members of asteroid families separate. It also impacts the timescale for the delivery of meteorites from the asteroid belt to Earth. Phase lags expressed in radians of rotational phase, , can be estimated by multiplying in equation (20) by the spin frequency of the asteroid;
| (23) | |||||
| (24) |
Phase lags given by equation (24) are relevant to the diurnal Yarkovsky effect. There is also a seasonal Yarkovsky effect which involves the phase lag expressed in terms of the orbital phase. In each case, migration rates are optimized for phase lags of order a radian (Bottke et al., 2006).
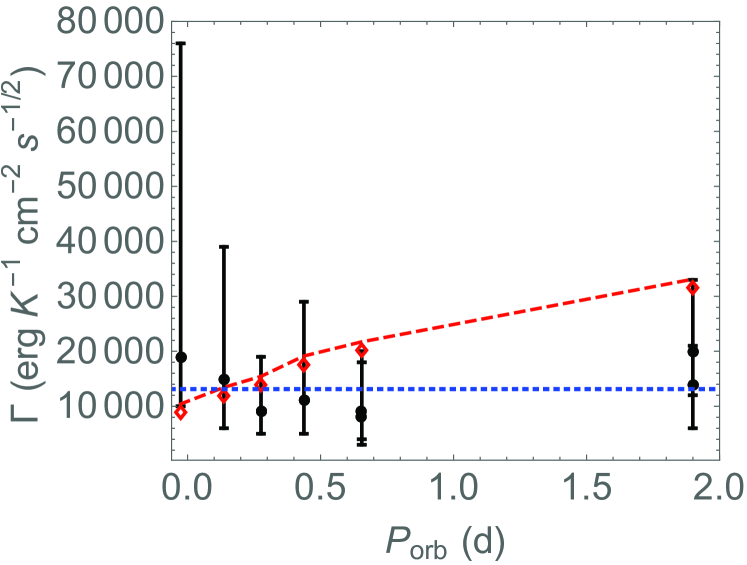
Howett et al. (2010) estimate thermal inertias for the Saturnian satellites Mimas, Enceladus, Tethys, Dione, Rhea and Iapetus from infrared data obtained by the Cassini orbiter. Each satellite has an outer ice shell and spins synchronously so incident solar flux variations occur on timescales of its orbital period, . Thermal inertias are plotted in Figure (4). They are low and show no obvious trend with orbit period. This suggests that heat transport by photon diffusion probably dominates that by phonon diffusion at the top of their regoliths; i.e., even for Iapetus. Otherwise, it would be expected from equation (21) that the fold increase of in going from Mimas to Iapetus would lead to a noticeable, factor of , rise of as indicated by the dashed line in Figure (4).555Here we assume that these satellites have similar regoliths.
The average for Saturn’s satellites is as shown by the dotted blue line in Figure (4). With , it follows that , an unremarkable value. But an upper limit of for Iapetus is problematic. Substitution of , , , , , and into equation (21) yields . The astute reader will recognize that the substituted values are appropriate for water ice at . Moreover, although is a reasonable value for the yield strength of a single crystal of cold ice, it is a large one for polycrystalline ice (Hobbs, 1974; Schulson, 2001). Substituting parameters suitable for pure water ice at would not help; would be larger and although would be smaller, the product would be slightly larger. We have checked this statement for down to and see no reason why it would not apply for as low as . A significant reduction of is more plausible; on Earth, accumulations of dry snow with water content below 30 are common. The weaker gravity on Iapetus would permit even lower densities than on Earth. Even at temperatures below 90, ice grains might bond to their neighbors.666Bonding increases contact areas at fixed pressure and implies finite contact areas at zero pressure (Johnson, 1987). Bonding could enable both low and large . According to Borderies et al. (1984), bonding is the most likely explanation for the paucity of sub-centimeter water ice particles in Saturn’s rings.
5. Summary
Together, phonon and photon diffusion determine the thermal conductivity of a rubble pile.
Phonons transmit heat through contacts between neighboring elements. Conductivity due to phonon diffusion in granular materials is independent of the sizes of the individual elements. We consider irregularly shaped elements whose mutual contact areas in the low pressure regime, , are smaller than those for spheres. Consequently, they provide a lower phonon conductivity than spheres, but one that increases more rapidly with pressure, , rather than, for spheres. At , phonon conductivities of irregular elements and spheres are equal. At still higher pressure, the contact areas of both spheres and irregularly shaped elements are governed by equation (2).
The effective conductivity in the top of the lunar regolith as deduced from radiometer measurements of surface temperatures (Keihm et al., 1973) roughly agrees with our prediction . But measurements of the annual temperature variation by probes analyzed by Langseth et al. (1976) indicate that is nearly constant at about of the monolithic conductivity for . This result has no simple explanation since contact areas should monotonically increase with increasing pressure.
Photons transmit heat across voids between elements. Photon diffusion contributes , where is the linear size of a typical element. A subtle argument in 3.2 shows that the element size is more important than the void size in determining the appropriate value of .
Thermal inertias of Saturnian satellites exhibit little dependence on suggesting that photon diffusion may dominate . This is surprising both because their surface temperatures are low and the implied values of are smaller than one might expect from phonon diffusion alone.
Acknowledgement
We thank David Rubincam, Thomas A. Prince, and Christian D. Ott for their comments and suggestions.
References
- Batchelor & O’Brien (1977) Batchelor, G. K., & O’Brien, R. W. 1977, Proceedings of the Royal Society of London. Series A, Mathematical and Physical Sciences, 355, 313
- Borderies et al. (1984) Borderies, N., Goldreich, P., & Tremaine, S. 1984, in Planetary Rings, ed. A. Brahic, 327–329
- Bottke et al. (2006) Bottke, Jr., W. F., Vokrouhlický, D., Rubincam, D. P., & Nesvorný, D. 2006, Annual Review of Earth and Planetary Sciences, 34, 157
- Delbo’ & Tanga (2009) Delbo’, M., & Tanga, P. 2009, Planet. Space Sci., 57, 259
- Dougherty et al. (2009) Dougherty, M. K., Esposito, L. W., & Krimigis, S. M. 2009, Saturn from Cassini-Huygens (Springer), doi:10.1007/978-1-4020-9217-6
- Goldreich & Sari (2009) Goldreich, P., & Sari, R. 2009, ApJ, 691, 54
- Gulkis et al. (2015) Gulkis, S., Allen, M., von Allmen, P., et al. 2015, Science, 347, aaa0709
- Heiken et al. (1991) Heiken, G. H., Vaniman, D. T., & French, B. M. 1991, Lunar sourcebook - A user’s guide to the moon (Cambridge University Press)
- Hertz (1882) Hertz, H. 1882, J. reine und angewandte Mathematik, 92, 156, for English translation see Miscellaneous Papers by Hertz, H., Jones, Eds. and Schott, London: Macmillan, 1896.
- Hobbs (1974) Hobbs, P. V. 1974, Ice physics (Oxford University Press)
- Howett et al. (2010) Howett, C. J. A., Spencer, J. R., Pearl, J., & Segura, M. 2010, Icarus, 206, 573
- Huetter et al. (2008) Huetter, E. S., Koemle, N. I., Kargl, G., & Kaufmann, E. 2008, Journal of Geophysical Research (Planets), 113, 12004
- Johnson (1987) Johnson, K. L. 1987, Contact Mechanics (Cambridge University Press)
- Keihm et al. (1973) Keihm, S. J., Peters, K., Langseth, M. G., & Chute, J. L. 1973, Earth and Planetary Science Letters, 19, 337
- Langseth et al. (1976) Langseth, M. G., Keihm, S. J., & Peters, K. 1976, in Lunar and Planetary Science Conference Proceedings, Vol. 7, Lunar and Planetary Science Conference Proceedings, ed. D. C. Kinsler, 3143–3171
- Linsky (1966) Linsky, J. L. 1966, Icarus, 5, 606
- Muncey (1963) Muncey, R. W. 1963, Australian Journal of Physics, 16, 24
- Papike et al. (1982) Papike, J. J., Simon, S. B., & Laul, J. C. 1982, Reviews of Geophysics and Space Physics, 20, 761
- Schulson (2001) Schulson, E. M. 2001, Engineering Fracture Mechanics, 68, 1839
- Spohn et al. (2015) Spohn, T., Knollenberg, J., Ball, A. J., et al. 2015, Science, 349, 020464
- Vasavada et al. (2012) Vasavada, A. R., Bandfield, J. L., Greenhagen, B. T., et al. 2012, Journal of Geophysical Research (Planets), 117, 0
- Waszczak et al. (2015) Waszczak, A., Chang, C.-K., Ofek, E. O., et al. 2015, ArXiv e-prints, arXiv:1504.04041
- Watson (1964) Watson, K. 1964, PhD thesis, California Institute of Technology, Pasadena
- White (2012) White, M.-A. 2012, Physical Properties of Materials, 2nd edn. (CRC Press)