Interpreting the spectral behavior of MWC 314 ††thanks: Based on observations made at the 0.91 m of Catania Observatory, the OHP telescopes and the 1.83 m telescope of the Asiago Observatory.
Abstract
Context. MWC 314 is one of the most luminous stars in the Milky Way. Its fundamental parameters are similar to those of LBVs, although no large photometric variations have been recorded. Moreover, it shows no evidence neither for a dust shell nor for relevant spectral variability.
Aims. The main purpose of this work is to clarify the origin of the radial velocity and line profile variations exhibited by absorption and emission lines.
Methods. We analyzed the radial velocity (RV) variations displayed by the absorption lines from the star’s atmosphere using high resolution optical spectra and fitting the RV curve with an eccentric orbit model. We also studied the RV and profile variations of some permitted and forbidden emission lines of metallic ions with a simple geometric model. The behavior of the Balmer and He i lines has been investigated as well.
Results. Fourier analysis applied to the RV of the absorption lines clearly shows a 60–day periodicity. A dense coverage of the RV curve allowed us to derive accurate orbital parameters. The RV of the Fe ii emission lines varies in the same way, but with a smaller amplitude. Additionally, the intensity ratio of the blue/red peaks of these emission lines correlates with the RV variations. The first three members of the Balmer series as well as [N ii] lines display a nearly constant RV and no profile variations in phase with the orbital motion instead. The He i 5876 Å line shows a strongly variable profile with broad and blue-shifted absorption components reaching velocities of km s-1 at some specific orbital phases.
Conclusions. Our data and analysis provide strong evidence that the object is a binary system composed from a supergiant B[e] star and an undetected companion. The emission lines with a non-variable RV could originate in a circumbinary region. For the Fe ii emission lines we propose a simple geometrical two-component model where a compact source of Fe ii emission, moving around the center of mass, is affected by a static extra absorption that originates from a larger area. Finally, the blue-shifted absorption in the He i 5876 Å line could be the result of density enhancements in the primary star wind flowing towards the companion that is best observed when projected over the disk of the primary star.
Key Words.:
stars: binaries – stars: emission line, Be– stars: individual MWC3141 Introduction
There has been debate about whether MWC 314 is a B[e] supergiant or a luminous blue variable (LBV). It appears to be one of the most luminous stars in the Galaxy (Miroshnichenko et al. 1998). However, it does not show the typical brightness variations of the latter class. The profiles of the permitted emission lines show two peaks, suggesting their formation in a rotating disk which led us to consider MWC 314 a B[e] supergiant rather than an LBV (Muratorio et al. 2008).
Marston & McCollum (2008) detected a very large bipolar nebula that emits in H and extends for 13.5 pc. It takes over years to form such a nebula at a typical expansion velocity for LBV candidates of 50 km s-1 (Nota et al. 1995). They propose that this star and other B[e] supergiants with large nebulae could have passed the LBV phase and have been moving towards the blue part of the upper HR diagram. This possibility is also supported by the absence of circumstellar dust, analogously to P~Cyg, already noted by Miroshnichenko (1996) and confirmed by the spectral energy distributions of these two stars shown by Lobel et al. (2013). This might mean that the dust has been blown away by the wind and one or more LBV outbursts, which occurred long ago.
The possibility of binarity of MWC 314 was suggested by Wisniewski et al. (2006) from fast variations of the H emission line strength. It was further indicated by the discovery of regular displacements of the absorption line centroids in the spectrum of MWC 314 (Muratorio et al. 2008).
Regular radial velocity (RV) variations of four absorption lines with a period of 60.8 days were detected by Lobel et al. (2013) based on 15 high-resolution optical spectra. These authors concluded that MWC 314 is a single-lined binary system with a LBV-like early B–type supergiant primary with a mass of 40 M⊙ that has a strong asymmetric wind. No signature of the secondary companion was found, although they suggested that it might be a less massive relatively cool (T 6200 K) giant.
Richardson et al. (2014) presented a larger set of high-resolution spectroscopic data that cover the period 2001–2013 and derived a slightly different orbit using the same absorption lines as Lobel et al. (2013). However, they concluded that the primary star in the system has a mass of 5 M⊙. Such a low mass was explained by a strong mass loss through transfer toward the secondary, stellar wind, and eruptions that led to the mass ratio reversal. At the same time, these authors did not reconsider the primary’s luminosity, thus suggesting that it is significantly overluminous for its current mass.
They also obtained -band interferometry that was modelled with a point-like source plus an elliptical Gaussian corresponding to a circumbinary disk tilted by 50–65 with respect to the line of sight. However, they do not exclude that this structure is a jet roughly aligned with the H bipolar outflow.
In any case, the lack of detection of spectral signatures from the secondary component does not permit establishing more accurate masses of the stellar components.
In order to study this binary system with a large set of data and to look for correlations of permitted and forbidden emission lines with the orbital phase, we performed a dense spectroscopic monitoring of MWC 314 between September 2007 and October 2009.
In this paper we describe the results obtained from the analysis of all the spectra collected from 1994 to 2009. We studied the RV behavior of both absorption and emission lines, the simultaneous ratio of blue/red peak intensities of permitted emission lines, and the total equivalent width of the emission lines.
2 Observations and data reduction
The first set of spectra was obtained between 1994 and 1998 at OHP with both the Aurelie and Elodie spectrographs and one spectrum at Ekar-Asiago in 2006 with the Reosc échelle spectrograph. A detailed logbook of these observations and the data reduction procedures are described in Muratorio et al. (2008).
Additional spectra were collected between September 2007 and October 2009 in the wavelength range 4300–6850 Å at the 91 cm telescope of the Catania Observatory (OAC) with the Fresco spectrograph giving a spectral resolving power of 000. In some cases we were able to follow the star for several consecutive nights.
The data were reduced with the echelle task of the IRAF package following standard steps. The data analysis was performed with IRAF routines and IDL111IDL (Interactive Data Language) is a registered trademark of Exelis Visual Information Solutions. procedures.
The log of all the spectroscopic observations is presented in Table 1, where also the numerical results of our analysis are reported.
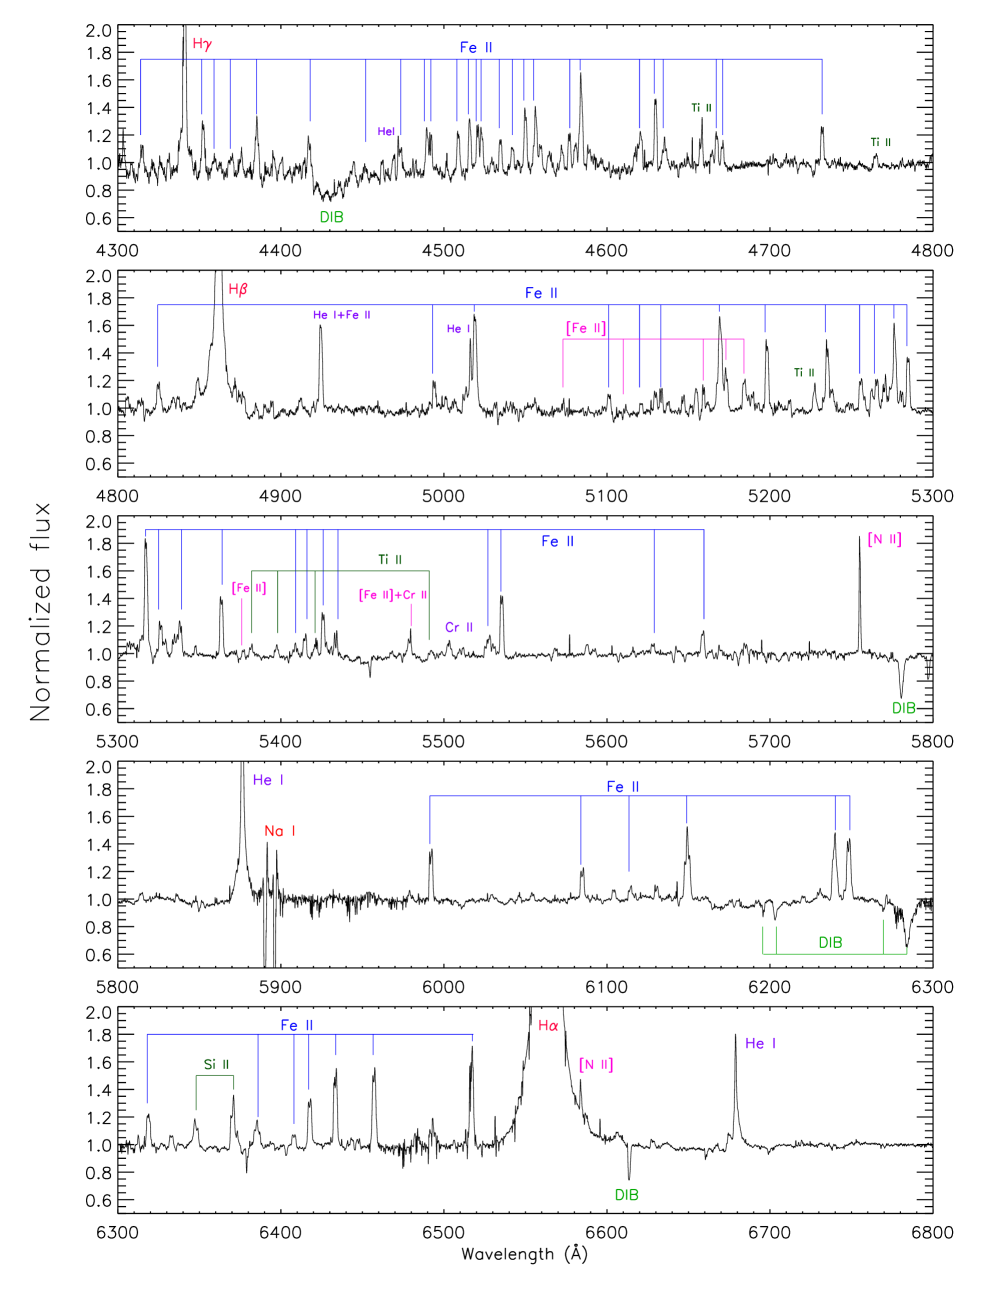
An Elodie spectrum showing the most prominent emission lines in the range 4300–6850 Å is shown in Fig. 1.
3 Data analysis
We studied the behavior of absorption and emission (permitted and forbidden) lines from several points of view.
We used the absorption lines only to measure the RV with the aim to confirm the strong variations detected in a relatively short time (Muratorio et al. 2008) and to refine the parameters of the periodicity previously found on the basis of a small number of observations spanning a period of several years. In the hypothesis of a binary system, possibly composed from two very luminous stars, we studied the emission lines aiming at understanding not only their forming regions and the cause of their double-peaked shape, but also at interpreting their temporal variations and looking for any possible correlation with the RV of the absorption lines.
3.1 Absorption lines
All the absorption lines are very faint, therefore we carefully selected a number of them to be used for the RV determination. We chose lines of the same ion and possibly same multiplet previously noticed for their wavelength clearly varying in time (see, e.g., Rossi et al. 2011, and Fig. 2 of the present paper). The final list of these lines is as follows: S ii (, , , , , , , , , ), N ii (, , and ), and Ne i (). A few other lines were also considered in the spectra with the highest S/N ratio.
For each line we have measured the centroid wavelength and converted it into the heliocentric radial velocity. For each spectrum we then computed the average and the standard deviation of all the individual RV values. These values are reported in Table 1.
| Date | HJD | err | phase | err | err | err | err | |||||
|---|---|---|---|---|---|---|---|---|---|---|---|---|
| 2 400 000+ | (km s-1) | (km s-1) | (km s-1) | (km s-1) | ||||||||
| 1994 08 28 | 49593.39754 | 6 | 0.780 | 1.15 | 0.12 | 2.4 | 59.6 | 2.6 | 27.2 | 2.7 | ||
| 1995 06 07 | 49876.58716 | 4 | 0.443 | 0.55 | 0.11 | 1.8 | 55.1 | 3.1 | 42.9 | 4.3 | ||
| 1995 08 19 | 49949.46725 | 5 | 0.643 | 0.87 | 0.06 | 3.1 | 63.7 | 2.7 | 37.4 | 3.7 | ||
| 1998 07 05 | 51000.46328 | 7 | 0.947 | … | … | … | … | … | … | … | ||
| 1998 07 21 | 51016.46947 | 9 | 0.210 | … | … | … | … | … | … | … | ||
| 1998 09 09 | 51066.35217 | 5 | 0.032 | 1.06 | 0.04 | 5.7 | 59.8 | 3.1 | 34.9 | 3.5 | ||
| 2006 07 16 | 53933.40647 | 6 | 0.236 | 0.76 | 0.03 | 4.3 | 68.4 | 3.4 | 40.9 | 4.1 | ||
| 2007 09 03 | 54347.40815 | … | 0.052 | 0.77 | 0.08 | 2.0 | 81.0 | 3.0 | 36.4 | 3.6 | ||
| 2007 09 29 | 54373.38428 | 8 | 0.480 | 0.55 | 0.10 | 1.1 | 58.4 | 0.7 | 42.5 | 4.2 | ||
| 2007 09 30 | 54374.35878 | 7 | 0.496 | 0.50 | 0.12 | 1.6 | 57.9 | 0.7 | 43.1 | 4.3 | ||
| 2008 05 17 | 54604.50475 | 8 | 0.285 | 0.74 | 0.11 | 3.6 | 73.5 | 4.5 | 39.9 | 3.9 | ||
| 2008 05 21 | 54607.54430 | 1 | 0.335 | 0.66 | 0.07 | 2.8 | 65.4 | 1.5 | 43.2 | 4.3 | ||
| 2008 05 23 | 54609.56085 | 4 | 0.368 | 0.65 | 0.11 | 4.7 | 66.5 | 3.9 | 46.3 | 4.6 | ||
| 2008 05 25 | 54611.56548 | 5 | 0.401 | 0.58 | 0.07 | 2.5 | 61.6 | 5.5 | 43.6 | 4.3 | ||
| 2008 05 27 | 54613.53195 | 6 | 0.434 | 0.58 | 0.12 | 4.4 | 58.9 | 2.5 | 45.3 | 4.5 | ||
| 2008 06 13 | 54631.45182 | 8 | 0.729 | 1.00 | 0.05 | 3.6 | 62.4 | 3.2 | 30.9 | 3.0 | ||
| 2008 06 15 | 54632.55436 | 10 | 0.747 | 1.13 | 0.15 | 2.7 | 63.0 | 3.8 | 29.3 | 2.9 | ||
| 2008 06 19 | 54636.52365 | 4 | 0.812 | 1.15 | 0.17 | 5.1 | 65.0 | 6.8 | 22.0 | 2.2 | ||
| 2008 07 20 | 54668.51706 | 10 | 0.339 | 0.73 | 0.03 | 1.2 | 69.0 | 1.5 | 42.5 | 4.2 | ||
| 2008 07 21 | 54669.48507 | 20 | 0.355 | 0.66 | 0.08 | 6.2 | 65.2 | 2.1 | 44.2 | 4.4 | ||
| 2008 07 22 | 54670.43017 | 20 | 0.371 | 0.65 | 0.15 | 3.4 | 64.2 | 4.1 | 45.8 | 4.6 | ||
| 2008 07 23 | 54671.42815 | 7 | 0.387 | 0.62 | 0.06 | 3.1 | 62.4 | 2.0 | 44.7 | 4.4 | ||
| 2008 07 31 | 54679.46166 | 7 | 0.519 | 0.53 | 0.12 | 3.7 | 58.7 | 3.7 | 48.1 | 4.8 | ||
| 2008 08 01 | 54680.46382 | 8 | 0.536 | 0.56 | 0.10 | 3.6 | 62.8 | 3.6 | 46.3 | 4.6 | ||
| 2008 08 30 | 54709.46967 | 8 | 0.013 | 1.11 | 0.07 | 1.1 | 60.6 | 1.5 | 30.1 | 3.0 | ||
| 2008 09 22 | 54732.34722 | 7 | 0.390 | 0.60 | 0.08 | 4.6 | 65.2 | 3.1 | 47.2 | 4.7 | ||
| 2008 09 28 | 54738.39732 | 10 | 0.490 | 0.63 | 0.08 | 5.0 | 59.3 | 0.9 | 45.6 | 4.5 | ||
| 2009 06 13 | 54996.45406 | 8 | 0.738 | 1.05 | 0.09 | 3.4 | 67.0 | 3.2 | 34.9 | 3.5 | ||
| 2009 06 15 | 54997.57071 | 8 | 0.757 | 1.23 | 0.10 | 3.3 | 61.0 | 3.9 | 27.2 | 2.7 | ||
| 2009 06 16 | 54998.53984 | 7 | 0.773 | 1.15 | 0.14 | 2.9 | 58.2 | 4.0 | 28.4 | 2.8 | ||
| 2009 06 20 | 55003.39754 | 7 | 0.853 | 1.32 | 0.06 | 3.6 | 55.5 | 5.0 | 20.5 | 2.0 | ||
| 2009 06 20 | 55003.43507 | 8 | 0.853 | 1.38 | 0.09 | 3.6 | 57.1 | 4.2 | 21.6 | 2.1 | ||
| 2009 06 24 | 55006.53995 | 4 | 0.905 | 1.31 | 0.11 | 3.5 | 50.9 | 3.5 | 19.0 | 1.9 | ||
| 2009 06 24 | 55007.48101 | 3 | 0.920 | 1.27 | 0.08 | 4.0 | 49.9 | 5.2 | 21.5 | 2.1 | ||
| 2009 06 25 | 55007.54341 | 5 | 0.921 | 1.40 | 0.12 | 3.5 | 53.0 | 3.5 | 20.7 | 2.1 | ||
| 2009 06 25 | 55008.48148 | 7 | 0.936 | 1.29 | 0.14 | 3.8 | 56.7 | 3.2 | 21.7 | 2.2 | ||
| 2009 06 26 | 55009.48715 | 7 | 0.953 | 1.24 | 0.14 | 1.9 | 56.5 | 2.7 | 21.3 | 2.1 | ||
| 2009 07 04 | 55017.36579 | 8 | 0.083 | 0.82 | 0.08 | 3.1 | 63.6 | 3.4 | 35.3 | 3.5 | ||
| 2009 07 30 | 55042.51432 | 7 | 0.497 | 0.61 | 0.07 | 0.5 | 56.5 | 1.0 | 41.5 | 4.1 | ||
| 2009 08 09 | 55053.35448 | 8 | 0.675 | 0.85 | 0.07 | 3.6 | 64.3 | 2.5 | 35.1 | 3.5 | ||
| 2009 08 09 | 55053.39778 | 7 | 0.676 | 0.85 | 0.07 | 3.8 | 64.3 | 3.6 | 35.5 | 3.5 | ||
| 2009 08 31 | 55075.41518 | 7 | 0.038 | 0.90 | 0.08 | 1.9 | 59.0 | 2.3 | 30.3 | 3.0 | ||
| 2009 09 03 | 55078.36655 | 8 | 0.087 | 0.86 | 0.11 | 2.9 | 63.2 | 2.7 | 31.3 | 3.1 | ||
| 2009 09 07 | 55082.32460 | 8 | 0.152 | 0.82 | 0.07 | 4.8 | 68.4 | 2.9 | 34.6 | 3.4 | ||
| 2009 09 26 | 55101.43383 | 8 | 0.467 | 0.57 | 0.08 | 3.2 | 61.9 | 1.2 | 45.2 | 4.5 | ||
| 2009 09 26 | 55101.48352 | 8 | 0.468 | 0.58 | 0.11 | 3.8 | 61.7 | 3.9 | 45.4 | 4.5 | ||
| 2009 10 04 | 55109.34247 | 8 | 0.597 | 0.66 | 0.12 | 1.8 | 57.2 | 4.2 | 38.4 | 3.8 | ||
| 2009 10 11 | 55116.39065 | 8 | 0.713 | 0.91 | 0.07 | 3.9 | 62.6 | 4.3 | 33.1 | 3.3 | ||
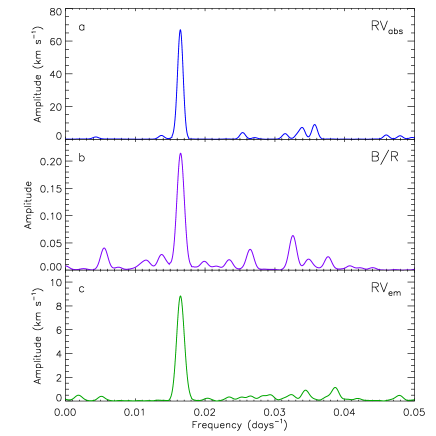
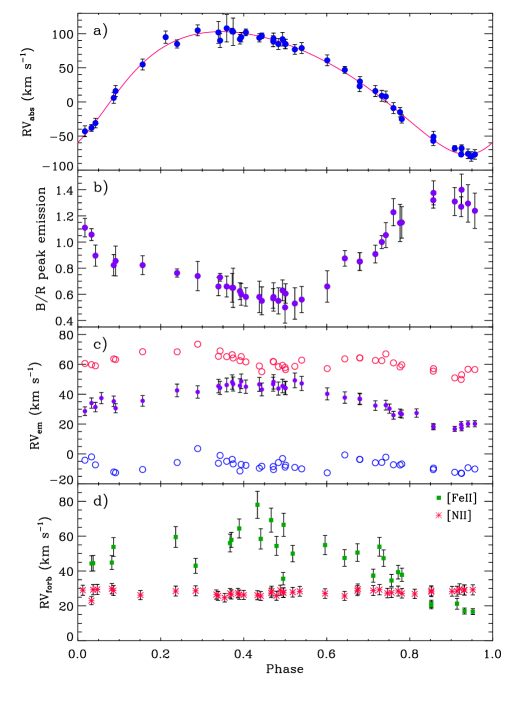
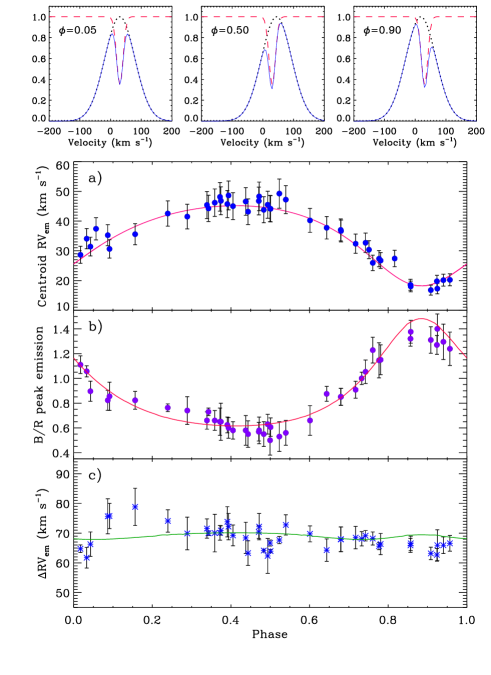
Thanks to a large number of spectra taken in a long-term time span (from 1994 to 2009) we were able to obtain an accurate determination of the period of the RV variations. For this task we used periodogram analysis (Scargle 1982) and the CLEAN deconvolution algorithm (Roberts et al. 1987), which allowed us to reject aliases generated by the spectral window of the data. We found a period of 60.81.7 days (see Fig. 3). The data folded with the period display a smooth variation with an asymmetrical shape typical for an eccentric RV orbital motion (see Fig. 4-a). Thus, we fitted the observed RV curve with the Curvefit routine (Bevington 1969) to determine the orbital parameters and their standard errors. This has also allowed us to improve the determination of the orbital period based on the periodogram analysis. The orbital parameters resulting from the fit of the RV curve are presented in Table 2, and the phase computed for each observation is quoted in column 5 of Table 1.
With our 48 spectra, which provide a well phase coverage of the orbital cycle span 15 years, we find orbital elements in a fairly good agreement with those derived by Lobel et al. (2013). Our orbital period is only 0.1 % smaller, the eccentricity is 4 % larger, and the RV semi-amplitude is 6 % larger than those of Lobel et al. (2013). The RV errors of our data are similar to those quoted by these authors, but we derive larger errors for the orbital parameters. In particular, we find an error of 11 minutes for the orbital period, much larger than that of only 1.2 seconds reported by Lobel et al. (2013). We think that our value of the orbital period error, which is not affected by possible errors due to the relatively large photometric uncertainties, is more reliable.
Our orbital solution derived from the absorption lines coincides with that of Richardson et al. (2014) within the uncertainties, although our error for the orbital period is three times smaller. For a direct comparison of our results with those of Lobel et al. (2013) and Richardson et al. (2014) we also report these latter in Table 2.
From our values of , , and , we have computed the mass function, defined as:
| (1) |
We find M⊙ (where the uncertainty includes the errors on , , and ) in very good agreement with the value of 4.00.3 M⊙ reported by Richardson et al. (2014). We note that without further constraints, such as the detection of spectral features from the secondary component and a very precise photometry, no other reliable parameter for the system components can be obtained.
| HJDP | Diagnostics/Ref. | |||||
|---|---|---|---|---|---|---|
| (days) | () | (km s-1) | (km s-1) | |||
| 60.737 (0.008) | 49546.01 (1.10) | 0.244 (0.020) | 218.7 (5.7) | 30.7 (1.3) | 89.7 (2.0) | Absorption lines |
| 60.74 (0.03) | 49546 (2) | 0.25 (0.05) | 170 (10) | 35.0 (1.0) | 13.5 (1.0) | Fe ii emission lines |
| 60.799977 (0.000014) | 54959.76 (0.56) | 0.235 (0.003) | 289 (1) | 28.44 (0.17) | 84.5 | Lobel et al. (2013) |
| 60.735 (0.024) | 55618.49 (0.65) | 0.29 (0.02) | 206.4 (4.2) | 31.3 (1.1) | 89.6 (1.8) | Richardson et al. (2014) |
3.2 Permitted emission lines
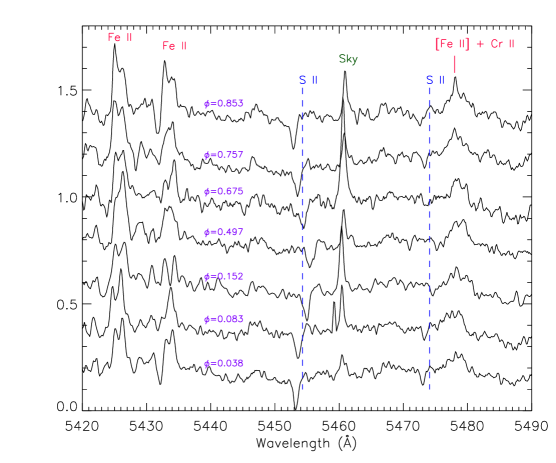
Permitted metallic emission lines exhibit obvious variability of the blue/red peak ratio (see Fig. 2). Taking into account the possibility of a connection with the absorption lines velocities, we decided to tackle the problem from several points of view. To the purpose we selected a number of strong and isolated lines of metallic ions. The final list includes: Fe ii , , , , , , , and Å which all display a double-peaked or asymmetric profile in all spectra. We note that some Fe ii lines were discarded due to either blending with other features, their faintness, or a low S/N ratio in the blue spectral range.
First we performed a two-Gaussian fit to each line in order to measure the intensity and wavelength of the blue and red peaks. The results are presented in Table 1. We found a modulation of the blue/red peak intensity ratio () with the same period as that of . Indeed, the CLEAN analysis performed on these ratios gives a period of 60.62.2 days (see Fig. 3) which is the same as that of within the uncertainties. The curve and the one are nearly anti-correlated, as can be seen in Fig. 4. The shape of the two curves is slightly different: the minimum of is observed later than the maximum of , while the largest ratios are observed just before the minimum of . The high degree of correlation of the two curves is demonstrated by a very high rank-correlation (Press et al. 1986) coefficient .
We also plotted the blue and red peak RVs individually. The situation is much more complicated here. Sometimes the lines are only asymmetric with one of the peaks missing. In other cases more than two peaks are present simultaneously in all the lines making the measurement much more uncertain. The results are presented in Table 1 (columns from 8 to 11) and in Fig. 4-c. These RVs show small-amplitude scattered variations with only a possible modulation with the orbital 60–day period. However, the velocity difference seems to be constant except for a few cases around phase 0.15 (see bottom panel of Fig. 6).
Given the unclear situation for the RV of the double peaks, we decided to additionally measure the equivalent width (EW) of the emission lines and the centroid of each line without fitting its peaks but treating it as a single feature. To do that, we used the splot task in IRAF. The RVs, calculated from the line centroids, are listed in Table 1 (, columns 12 and 13), and displayed in Fig. 4-c and Fig. 6-a. A clear, positive correlation with the absorption lines RV curve is now evident, although with an amplitude smaller than that of and RVs ranging from +15 to +50 km s-1. The periodogramme analysis applied to the RV of the emission lines practically gives the same period as for the absorptions. The fit of the curve with an eccentric orbit provides the values reported in Table 2. This solution is shown as a full line in Fig. 6-a. The cross-correlation of and indicates that the former precedes the latter by a very small (and likely insignificant) phase shift (corresponding to ).
The same orbital period and the very similar velocity suggest that the bulk of the emission is coming from a region corotating with the binary system but much closer to the center of mass (MC) than the source of the absorption lines. A simple geometrical sketch of the source of the Fe ii emission is depicted in Fig. 5.
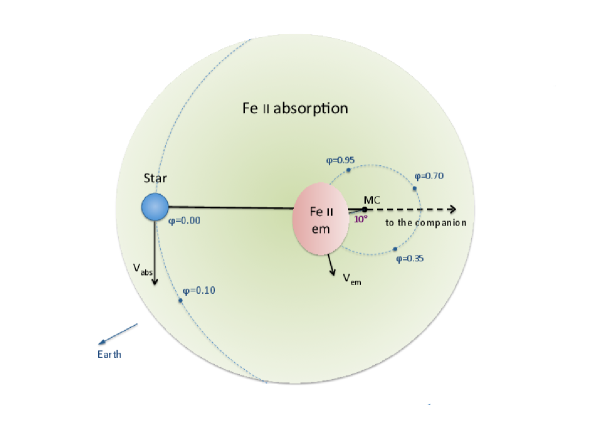
With this simple geometrical model we also tried to understand the orbital modulation of the peak ratio. We propose a hypothesis that the double-peaked shape of the permitted Fe ii emission lines is a result of an extra-absorption superimposed on a pure emission profile. If the two profiles have different full width at half maximum (FWHM) and velocities, a changing blue/red peak asymmetry in phase with the orbit can be reproduced. The continuous line overplotted on the observed curve in Fig. 6-b is derived from the synthetic double-peaked profiles obtained by the superposition of a broad emission (a Gaussian with FWHM=115 km s-1) moving according to the curve (full line in Fig. 6-a), and a narrower absorption Gaussian (FWHM=25 km s-1) at the MC velocity.
As indicated by the semi-amplitude of only 13.5 km s-1, the emitting region must be rather compact (or highly centrally condensed) and should be located much closer to the MC of the system than the star which is the source of the observed absorption lines. As a simple speculation, if the location of this emitting region is close to the Lagrangian point L1, one may suggest that it is related to a denser part of the stellar wind funneled through L1 towards the unseen companion. Conversely, the excess absorption shows a constant intensity and velocity, so it must be caused by a quite large and homogeneous structure, which is always projected onto the emission produced by the compact region. One could argue then that the source of the excess absorption is a circumstellar envelope or shell.
Although this is a simplified model, it allows us to explain the observed behavior of the permitted Fe ii emission lines and could be taken as a starting point for more sophisticated models.
The EWs of the measured emission lines show no evidence for periodicity. This supports the hypothesis of a purely “geometrical” effect produced by a static and nearly homogeneous absorbing envelope over the compact emitting region.
3.3 Forbidden emission lines
Similarly to the permitted emission lines, metallic forbidden lines have double-peaked profiles that are not always well structured. Three peaks are clearly present in some spectra. Most of them are blended with other emissions, so that we could not obtain definite results. The final list of [Fe ii] lines to analyze only includes 5627.5, 5376.5, and 5158.8 Å.
As already described in Muratorio et al. (2008), forbidden lines are narrower than permitted lines: a mean FWHM of 55 8 km s-1 is found from a single Gaussian fitting. The RV curve reproduces the behavior of the permitted (and therefore of the absorption) lines though with quite a large scatter, likely due to the small number of lines and their faintness (see Fig. 4-d). We found surprising that the RV variation of the [Fe ii] lines is larger than that of the permitted lines, indicating a different emission region. In a very simplified scheme of matter corotating with the system, this would mean that this region is located farther from the MC of the system towards the star, which is the source of the absorption lines. However, this result needs to be confirmed by further observations with a higher S/N ratio.
An interesting case is the [N ii] 5754.59 Å line which shows a clear double-peaked profile in all the Elodie spectra (=42 000) with the red peak always fainter than the blue one, as was also found by Lobel et al. (2013). The mean RV difference between the peaks is 27.5 1.0 km s-1 (see Fig. 7), that is much smaller than the peak separation of 70 km s-1 measured for the permitted emission lines (see Fig. 4-c). The B/R peak ratio ranges from 1.3 to 1.6. The other spectra have a lower resolution that does not permit to separate the peaks, however the Fresco spectra indicate an asymmetry of the blue/red side at the top of the line which is never reversed. Other parameters characterizing this line remained constant during the long period of our observations. The results can be summarized as follows: FWHM= 50 5 km s-1, EW=0.8 0.1 Å, RV1.3 km s-1. The latter is very close to the 30 km s-1 of the barycentric velocity (see Fig. 4). This could indicate an emitting region located around the MC or, most likely, an emitting envelope/shell with a large extension, encompassing the entire binary system, similar to the one which we have assumed to give rise to the narrow Fe ii absorption. A very similar behaviour is displayed by the [N ii] 6583.45 Å line.
With the data in our hands, we cannot say whether the extra-absorption is a feature related to the formation of the [N ii] lines or it is an effect of the same cloud that causes the excess absorption in the permitted Fe ii lines. In the latter hypothesis, the absence of inversion of the B/R peak ratio is due to the stability of [N ii] line RV.
However, this line can mainly form in the large bipolar outflow around MWC 314 which has been discovered by Marston & McCollum (2008) with narrow-band H imaging. Since both the Elodie and Fresco spectra are taken with optical fibers which encompass a few arcseconds on the sky around the central star, the double-peaked profiles could be indicative of the approaching and receding parts of the outflow in the line of sight of the central star. Similar [N ii] 6583.45 Å double-peaked profiles with velocity separations of the same order have been also observed in LBV candidates in the Large Magellanic Cloud by Weis (2003).

4 Hydrogen and Helium line profiles
We also investigated the behavior of the helium and hydrogen lines with the orbital phase.
The H line with a peak intensity in the continuum units and a full width at zero level of Å is a strong and broad feature. It is difficult to set the continuum level around the line and precisely measure its EW. However, its centroid (and RV) can be defined with a sufficient accuracy. Most of other H and He lines are either faint, fall near edges of échelle orders, or are blended with other emission lines. We found that the He i 5876 Å and H lines appear in all our spectra, are strong enough, and unsaturated. Unfortunately, the other strong helium line in the optical range, He i 6678 Å, falls in the gap between the last two échelle orders in our Fresco spectra. In the same spectra, H falls near the edges of two orders, but we could measure its EW and RV in the best exposed ones.
The EWs of H, H, and H are in the ranges of 110–140 Å, 12–17 Å, and 2–5 Å, respectively, with no clear orbital modulation. The same holds true for their RVs which are scattered between 30 and 45 km s-1. The absence of orbital modulation in both the EWs and RVs of the Balmer lines suggests that these features are neither related to one of the stellar components nor are formed in a compact source corotating with the system, such as the source of Fe ii lines. The Balmer lines more likely originate in a large region or in different regions that occupy a large portion of the circumbinary space.
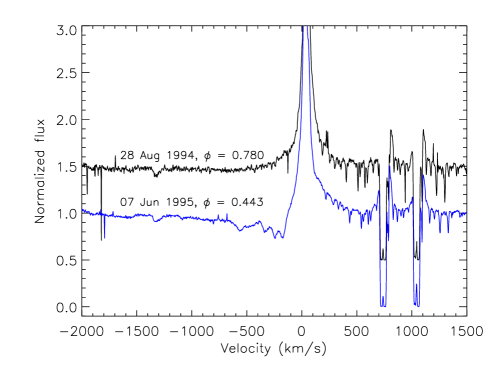
The most interesting behavior shows the profile of the He i 5876 line, which changes from a nearly symmetric emission to a P-Cygni profile. This is clearly illustrated by the two OHP-Elodie spectra shown in Fig. 8. The blue-shifted extra-absorption visible in the spectrum at the phase seems to be a result of different components with velocities from 200 km s-1 to 1000 km s-1.
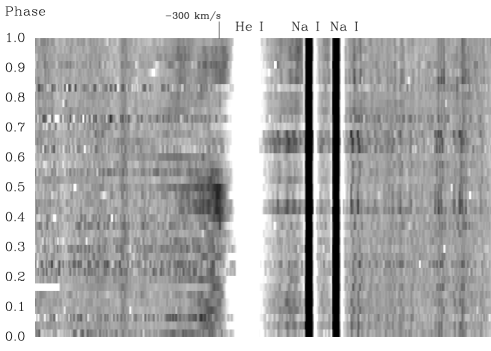
To check if this feature has a random occurrence or it is related to particular orbital configurations, we have produced a trailed spectral image with all the Fresco and Asiago spectra in the region around the He i 5876 Å line (Fig. 9). It clearly shows that the extra absorption is mainly observed at phases between 0.40 and 0.55. Although with a smaller intensity, some extra-absorption is also observed at phases around 0.9 and 0.1 (primary star in front). This is the configuration where this phenomenon was observed by Lobel et al. (2014), who ascribed it to wave propagation linked to the orbital motion near the low-velocity regions of the stellar wind close to the primary star. Note that, due to the different ephemeris, the phases in Lobel et al. (2014) are shifted by compared to ours. They suggest that these absorption features can also be originated in dynamical wind regions confined between the two components. Our observations indicate that these extra absorptions are stronger when the primary star is behind the “inter-binary” wind. This can be understood if the primary component is filling (or almost filling) its Roche lobe, as proposed by Lobel et al. (2013) and Richardson et al. (2014), and transferring mass to the secondary through Roche lobe overflow. The strengthening of the extra absorption at these phases could be due to a gas stream projected over the primary star or to overdense regions in the stellar wind funneled through L1. Thus, the source of this phenomenon could be different, both physically and geometrically, than that originating the Fe ii emission. This is in line with the detailed model of asymmetric wind developed by Lobel et al. (2013). A detailed physical model of the He i profile is, however, out of the scope of the present paper.
5 Concluding remarks
The large number of high resolution spectra spanning nearly 15 years has allowed us to confirm the binary nature of MWC 314 and provide a very accurate solution for the RV curve obtained from the stellar absorption lines.
The numerous metallic emission lines present in the spectrum very often display double-peaked profiles with a variable shape. The RV variations of the permitted Fe ii emission lines, as derived from their centroids, are clearly periodic and in phase with the RV curve of the star that produces the absorption spectrum, although with a much smaller RV semi-amplitude. The blue/red peak ratio is also strongly correlated with the orbital period.
We proposed a simple geometrical model, where the source of Fe ii emission is rather compact and located near the system MC possibly close to the Lagrangian L1 point. In this model, the central absorption in the Fe ii lines forms in a very wide (circumbinary?) region that slowly rotates around the MC (see Fig. 5) and is is always projected over the source of emission. This model allows us to explain the observed variation of both the radial velocity() and the peak ratio of the permitted Fe ii lines fairly well, and it is compatible with a more sophisticated 3D-wind model proposed by Lobel et al. (2012).
The optically-thin [Fe ii] lines also display double-peaked profiles but their RV variation has a larger amplitude compared to the Fe ii ones, indicating that these lines are formed closer to the primary star and possibly in a circumstellar disk. However since the [Fe ii] lines are weaker than those of Fe ii, this result needs further verification using higher signal-to-noise spectra.
Other emission lines, such as the [N ii] 5754 Å and the Balmer lines have an almost constant RV which is nearly coincident with the velocity. They likely originate in a distant, circumbinary region and possibly in the inner parts of the large bipolar outflow discovered by Marston & McCollum (2008) with narrow-band H imaging.
The most prominent variable feature observed in the He i 5876 Å line profile is a broad blue-shifted absorption which is mostly observed at phases between 0.40 and 0.55 (primary star behind). This is likely due to the wind of the primary component, funneled towards the companion, that is interposed between us and the primary star at these phases.
In order to continue revealing the nature of the MWC 314 binary system, a new set of high-resolution and high signal-to-noise ratio spectra, which would densely cover the orbital phases and focus on weak spectral lines in an attempt to get information about the forbidden lines formation region and search for the elusive secondary companion, is needed. Contemporaneous multicolor photometry would help to associate spectral and brightness variations.
Acknowledgements.
The authors thank the staff of the OAC for the technical support during the observations; IRAF is distributed by the NOAO which is operated by AURA under contract with NFS. This project was partially supported by the INAF grant 2007 “Luminous Blue Variable phenomenon: towards a better understanding of massive stars evolution”. We thank the anonymous referee for the useful comments and suggestions.References
- Bevington (1969) Bevington, P. R. 1969, “Data Reduction and Error Analysis for the Physical Sciences”, McGraw-Hill Book Company, 237
- Glatzel, W. & Chernigovski (2001) Glatzel, W. & Chernigovski, S. 2001, in : M. de Groot & C.Sterken (eds), P Cygni 2000, 400 Years of Progress’ ASP Conf. Ser, 233, 227
- Lobel et al. (2012) Lobel, A., Groh, J., Torres Dozinel, K., et al. 2012, in: Four Decades of Massive Star Research - A Scientific Meeting in Honor of A. F. J. Moffat, Eds. L. Drissen, C. Robert, and N. St-Louis, ASP Conf. Ser., 465, 358
- Lobel et al. (2013) Lobel, A., Groh, J.H., Martayan, C., et al., 2013, A&A, 559, A16
- Lobel et al. (2014) Lobel, A., Martayan, C., Corcoran, M., Groh, J.H, & Frémat, Y. 2014, in: New windows on massive stars: asteroseismology, interferometry, and spectropolarimetry, Proceedings IAU Symposium, 307, 115
- Miroshnichenko (1996) Miroshnichenko, A. S. 1996, A&A, 312, 941
- Miroshnichenko et al. (1998) Miroshnichenko, A. S., Fremát, Y., & Hauziaux, L. 1998, A&A, 131, 469
- Marston & McCollum (2008) Marston, A. P., & McCollum, B. 2008, A&A, 477, 193
- Muratorio et al. (2008) Muratorio, G., Rossi, C., & Friedjung, M. 2008, A&A, 637, 64
- Nota et al. (1995) Nota, A., Livio, M., Clampin, M., & Shulte-Ladbeck, R. 1995, A&A, 448, 788
- Press et al. (1986) Press, W. H., Flannery, B. P., Teukolsky, S. A., & Vetterling, W.T. 1986, Numerical Recipes. The Art of Scientific Computing (Cambridge University Press), 489
- Richardson et al. (2014) Richardson, N. D., Moffatt, A. F. J., Maltais-Tariant, R. et al. 2014, SPIE Proc., vol. 9146, 91460G-1
- Rossi et al. (2011) Rossi, C., Frasca, A., Marilli, E., et al. 2011, in: Active OB stars: structure, evolution, mass loss and critical limits. C. Neiner, G. Wade, G. Meynet & G. Peters, eds., IAU Symp. 272, 422
- Roberts et al. (1987) Roberts, D. H., Lehar, J., & Dreher, J. W. 1987, AJ, 93, 968
- Scargle (1982) Scargle, J. D. 1982, ApJ, 263, 835
- Weis (2003) Weis, K. 2003, A&A, 408, 205
- Wisniewski et al. (2006) Wisniewski, J. P., Babler, B. L., Bjorkman, K. S., et al. 2006, PASP, 118, 820