Measurement of the absolute differential cross section of proton-proton elastic scattering at small angles
Abstract
The differential cross section for proton-proton elastic scattering has been measured at a beam energy of 1.0 GeV and in 200 MeV steps from 1.6 to 2.8 GeV for centre-of-mass angles in the range from – to –, depending on the energy. Absolute normalisations of typically 3% were achieved by studying the energy losses of the circulating beam of the COSY storage ring as it passed repeatedly through the windowless hydrogen target of the ANKE magnetic spectrometer. It is shown that the data have a significant impact upon a partial wave analysis. After extrapolating the differential cross sections to the forward direction, the results are broadly compatible with the predictions of forward dispersion relations.
keywords:
Proton-proton elastic scattering, differential cross sectionPACS:
13.75.Cs, , , , , , , , , , , , , , , , , , , , , , , , , , , , , , , , , , , , , , , ,
For beam energies above about 1 GeV there are relatively few measurements of proton-proton elastic scattering at centre-of-mass (c.m.) angles from to , i.e., between the region of major Coulomb effects and the larger angles where the EDDA collaboration has contributed so extensively [1, 2, 3]. This lack of information inevitably leads to ambiguities in any partial wave analysis (PWA) at high energies [4]. The ANKE collaboration has recently published proton analysing powers in this angular domain at 796 MeV and five other beam energies between 1.6 and 2.4 GeV using a polarised proton beam [5] and these led to a revision of the SAID PWA [4] in order to accommodate the data. The major uncertainty in such a measurement is the precision to which the beam polarisation can be determined, beam-target luminosity and equipment acceptance playing only secondary roles. This is far from being the case for the differential cross section where, in order to provide accurate absolute values, both the luminosity and acceptance must be mastered with high precision [6]. The difficulties encountered in earlier experiments in making absolute measurements were discussed most clearly in Ref. [7], whose normalisation was used as the standard for the EDDA work [1, 2].
As was the case for the analysing power [5], the present studies of the differential cross section were carried out using the ANKE magnetic spectrometer [8] sited inside the storage ring of the COoler SYnchrotron (COSY) [9] of the Forschungszentrum Jülich. The only detector used in the analysis was the forward one (FD), which measured fast protons from elastic scattering over a range of up to in c.m. polar angles and in azimuth. The FD comprises a set of multiwire proportional and drift chambers and a two-plane scintillation hodoscope, the counters of which were used to measure the energy losses required for particle identification [10].
The biggest challenge that has to be faced when measuring the absolute value of a cross section in a storage ring experiment is to establish the beam-target luminosity at the few percent level even though the overlap of the beam and target cannot be deduced with such precision from macroscopic measurements. It has been shown that this can be achieved by studying the energy loss through electromagnetic processes as the coasting uncooled beam passes repeatedly through the target chamber. There is a resulting change in the frequency of the machine that can be determined with high accuracy by studying the Schottky power spectrum of the beam [11]. The amount of electromagnetic interaction is, of course, proportional to that of the strong proton-proton scattering, whose measurement was the goal of the experiment
The statistical distribution of particles in the beam is at the origin of the Schottky noise. This gives rise to current fluctuations that induce a voltage signal at a beam pick-up. The Fourier analysis of the voltage signal, i.e., of the random current fluctuations, by a spectrum analyser delivers power distributions around the harmonics of the revolution frequency. Over a 300 s cycle, the Schottky signals were recorded every 10 s with a 189 ms sweep time, thus giving effectively instantaneous spectra. The frequencies were measured with the existing Schottky pick-up of the stochastic cooling system operated on harmonic number 1000 [12] and a more precise analyser than previously used [11]. Some examples of these measurements scaled to harmonic number 1 are shown in Fig. 1 for circulating proton beam energies of 1.0 and 2.0 GeV. After subtracting the background noise, the mean frequency of the beam at each instant of time was evaluated from the centroid of the distribution. Such values, which are indicated by the vertical lines, allow to be determined as a function of time over the 300 s cycle.
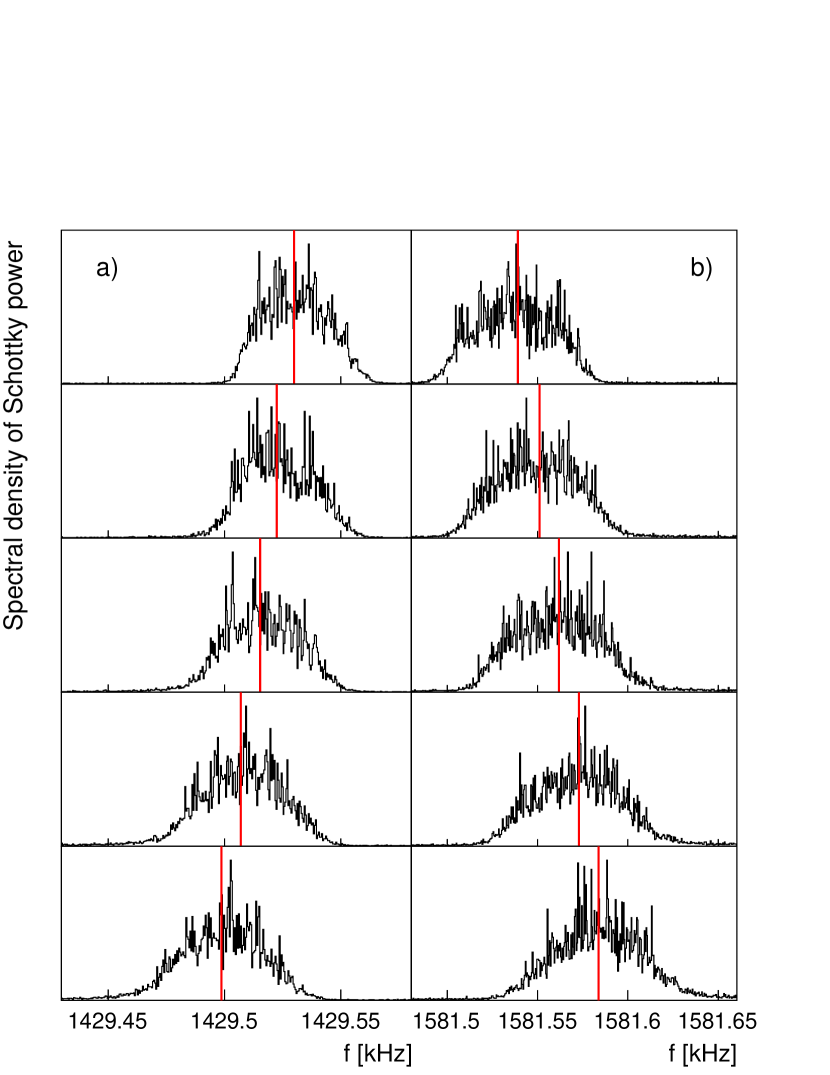
The important point to notice in Fig. 1 is that the direction of the frequency change is different at low and high energies; the energy of this transition from one regime to the other depends upon the lattice settings of the accelerator [11]. Since the luminosity is proportional to , it means that there is a range of beam energies where the fractional errors are so large as to make the Schottky method of little practical use. This explains the gap in our data from 1.0 GeV to 1.6 GeV.
It was shown in Ref. [11] that the effective number of target particles is given by
| (1) |
where is the proton mass. The cluster-jet target [13] used in this experiment was very thin and, as a result, the energy changes over a 300 s cycle were extremely small (). Under such conditions one can take and to be the initial values of the frequency and kinetic energy of the beam and as the corresponding Lorentz factor. The stopping power at a given energy is to be found in the NIST-PML database [14].
It is the remaining quantity in Eq. (1), the so-called frequency-slip parameter , that under COSY conditions changes sign at GeV. Although this parameter can be estimated semi-quantitatively by a computer simulation of the acceleration process, greater precision is achieved by a direct measurement, where the change in the revolution frequency induced by adjusting the strength in the bending magnets by few parts per thousand is studied [11]. This was investigated in separate runs at each of the beam energies with the target switched off [6].
A small frequency shift is also produced by the interaction of the beam with the residual gas in the COSY ring and this was measured using dedicated cycles, where the ANKE cluster target was switched on but the beam was steered away from it. This precaution was necessary because the target produces additional background in the vicinity of the ANKE target chamber [11].
The measurement of the beam intensity () is a routine procedure for any accelerator and is performed at COSY using the high precision Beam Current Transformer device. These measurements were carried out every second over the 300 s cycle and then averaged. The final results are accurate to better than [11]. The luminosity in the experiment is then the product of beam and target factors, .
The Forward Detector was the subject of a very detailed study [15] and only some of the salient points are mentioned here. The setup parameters were adjusted in a geometry tuning procedure, with the use of the exclusive , , , and reactions. In the last case, both the and were detected in the FD and this gave valuable information on the systematics of the transverse momentum reconstruction. These showed that any systematic shift in the determination of the c.m. angle in elastic scattering was less than , which would correspond to a change in the differential cross section.
The trigger was initiated by a signal from either of the two hodoscope walls, placed one behind the other. This, together with a high scintillation counter efficiency, reduced the trigger inefficiency to the level. An MWPC efficiency of over 97% and a redundancy of the track hits led to an overall tracking efficiency of . In order to study the systematic effects, different acceptance cuts were applied in the cross section evaluation as well as different sets of wire planes used for track reconstruction. The resulting values of the cross sections showed a (RMS) variation.
| E1 | E2 | E3 | E4 | E5 | Total | |
| GeV | % | % | % | % | % | % |
| 1.0 | 1.6 | 0.7 | 0.7 | 1.5 | 1.5 | 2.8 |
| 1.6 | 1.2 | 1.9 | 1.4 | 1.5 | 1.5 | 3.4 |
| 1.8 | 1.3 | 1.6 | 1.6 | 1.5 | 1.5 | 3.4 |
| 2.0 | 0.8 | 1.9 | 1.8 | 1.5 | 1.5 | 3.5 |
| 2.2 | 0.3 | 1.0 | 1.0 | 1.5 | 1.5 | 2.6 |
| 2.4 | 0.4 | 1.5 | 1.6 | 1.5 | 1.5 | 3.1 |
| 2.6 | 0.4 | 1.5 | 1.5 | 1.5 | 1.5 | 3.0 |
| 2.8 | 0.9 | 1.2 | 0.5 | 1.5 | 1.5 | 2.6 |
The elastic scattering reaction produced a prominent peak in the missing-mass spectrum, with a background of only , and an estimated uncertainty of this level of . A small contribution from the reaction to the peak region at 1 GeV was subtracted on the basis of the energy-loss information. A kinematical fitting procedure was applied to events in the elastic scattering peak; this produced an accuracy and further reduced the systematic uncertainty.
Table 1 lists five identified contributions to the overall systematic uncertainty of the elastic scattering data at the eight energies studied. No single contribution is dominant, which means that it would be hard to reduce the systematic error to much below the 2.5–3.5% total uncertainty quoted in the table.
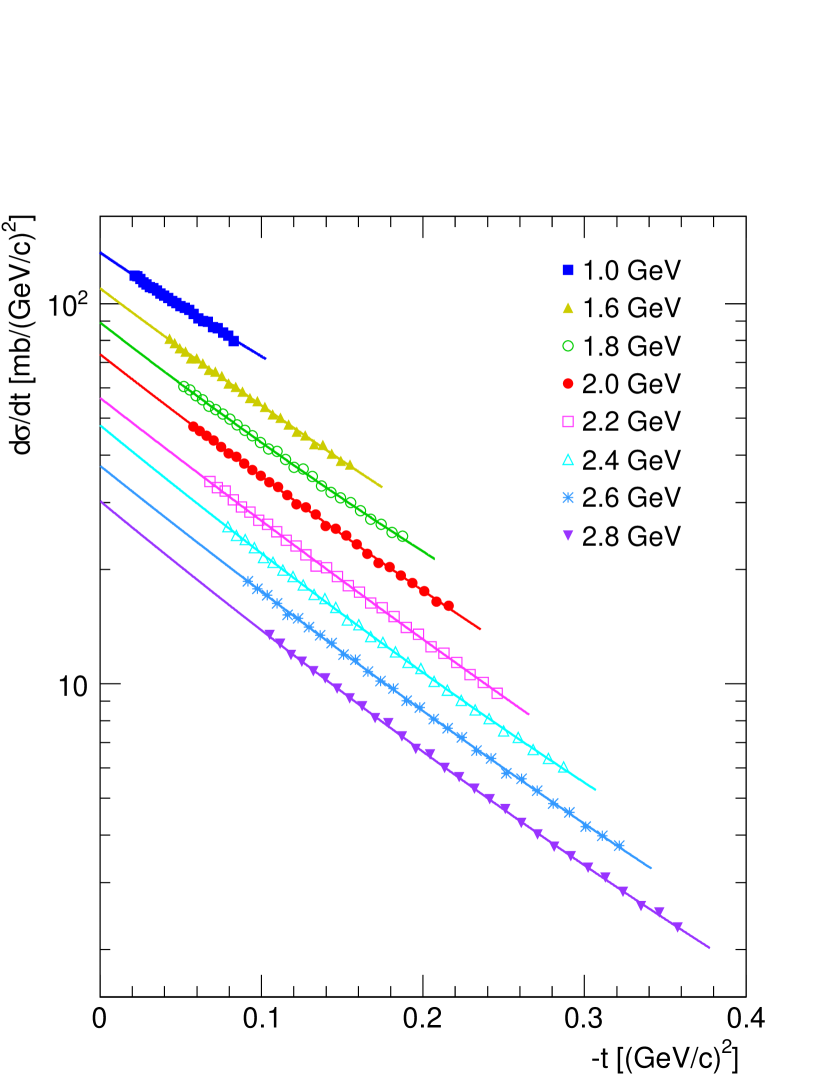
The variation of the ANKE data over the ranges in angle and energy studied can be seen most clearly in the differential cross section with respect to the four-momentum transfer and these results are shown in Fig. 2. Also shown are exponential fits to the measured data made on the basis of
| (2) |
where the values of the resulting parameters are given in Table 2. Taking at 1 GeV would change the value of found in the fit by less than 1%, though this parameter becomes more important at higher energies where the range is larger. This empirical representation of the measured data may prove helpful when the results are used in the normalisation of other experimental measurements.
| (Corr.) | (GK) | ||||
|---|---|---|---|---|---|
| GeV | (GeV) | (GeV) | |||
| 1.0 | |||||
| 1.6 | |||||
| 1.8 | |||||
| 2.0 | |||||
| 2.2 | |||||
| 2.4 | |||||
| 2.6 | |||||
| 2.8 |
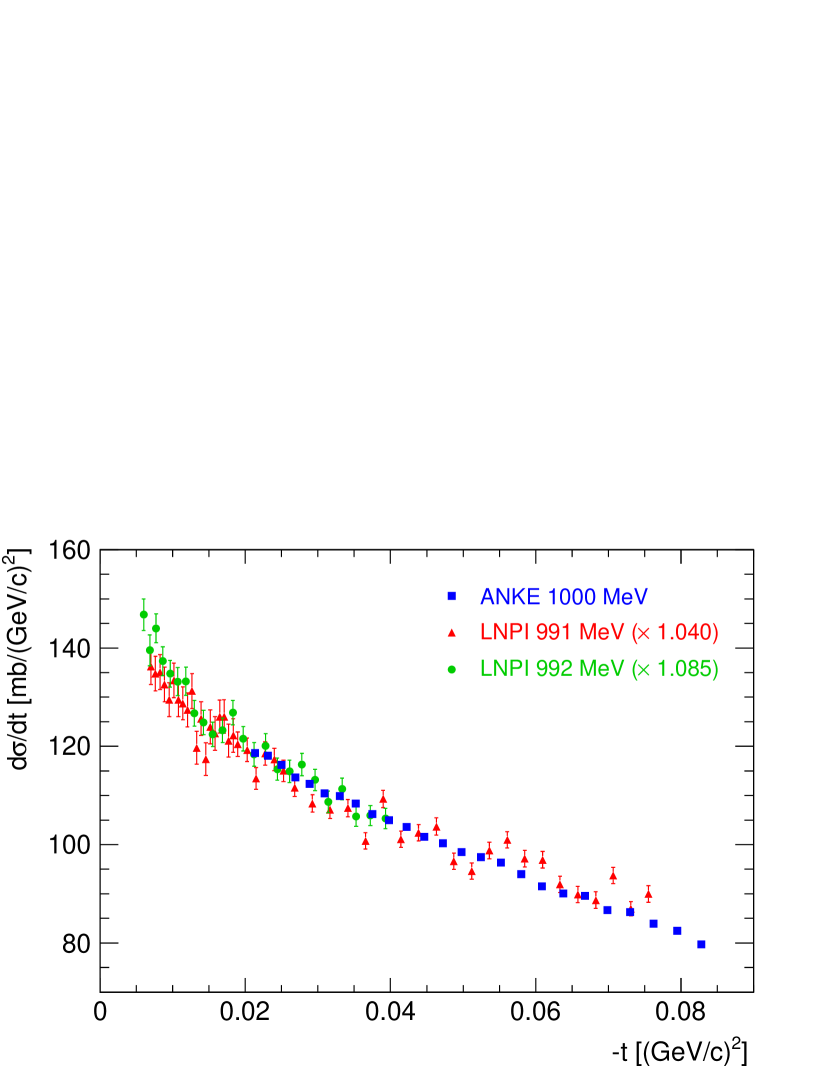
There are very few data sets of absolute cross sections at small angles to which the ANKE results can be compared. In the vicinity of 1 GeV there are two measurements by the Gatchina group that were made with the IKAR recoil detector. In the first of these at 992 MeV, IKAR was filled with hydrogen [17]. In the second at 991 MeV a methane target was used, though the prime purpose of this experiment was to show that such a target gave consistent results and so could be used with a neutron beam [19]. The ratio of the Gatchina hydrogen values [17] to the fit of the ANKE 1000 MeV data over the common range of angles is and these Gatchina results have been scaled by a factor of 1.085 before being plotted in Fig. 3. The scaling factor is significant in view of the 2% and 2.8% absolute normalisations reported for the Gatchina and ANKE experiments, respectively.
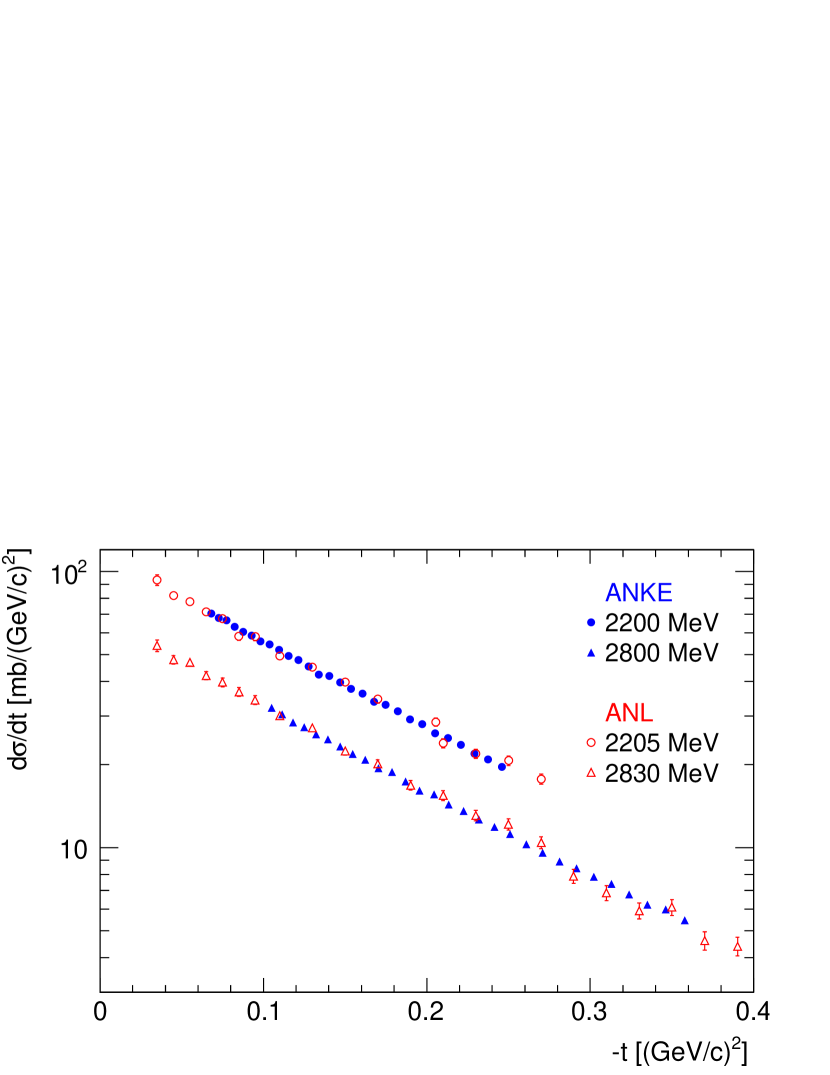
Data are also available from the Argonne National Laboratory in our angular range at 2.2 and 2.83 GeV [20] and these values are plotted together with our measurements in Fig. 4. The ANL data sets agree with our 2.2 and 2.8 GeV results to within 1%. However, the absolute normalisation claimed for these data was 4% [20] so that it is not possible to draw completely firm conclusions from this comparison.
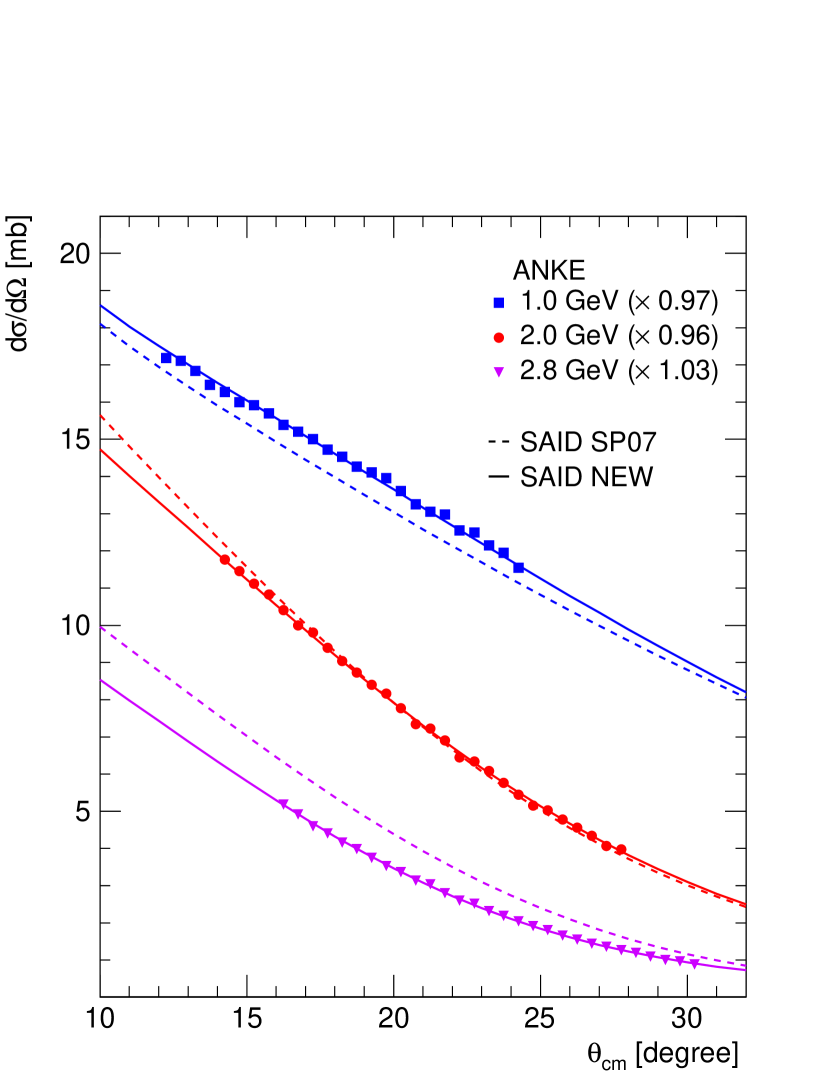
The results reported in this letter could clearly have an impact on the current partial wave solutions. This is demonstrated in Fig. 5, where the ANKE cross sections at 1.0, 2.0, and 2.8 GeV are compared to both the SAID SP07 solution [4] and a modified one that takes the present data at all eight energies into account. Scaling factors in the partial wave analysis, consistent with the overall uncertainties given in Table 1, have been included in the figure. The major changes introduced by the new partial wave solution are in the and waves at high energy. It should be noted that the modified solution does not weaken the description of the ANKE proton analysing powers presented in Ref. [5].
The precise EDDA measurements were undertaken for c.m. angles of and above whereas the ANKE data finish well below this and the gap looks even bigger in terms of the momentum-transfer variable . Nevertheless, the modified SAID solution shown in Fig. 5 fits the ANKE 1000 MeV cross section reduced by 3% and describes also the EDDA data at 1014.4 MeV [2]. Such a 3% reduction in the ANKE normalisation at this energy is consistent with the results of a combined fit of Eq. (2) to the EDDA and the Coulomb-corrected ANKE data.
In the forward direction the number of proton-proton elastic scattering amplitude reduces from five to three and the imaginary parts of these amplitudes are determined completely by the spin-averaged and spin-dependent total cross sections with the help of the generalised optical theorem. The corresponding real parts have been estimated from forward dispersion relations, where these total cross sections provide the necessary input [16]. All the terms contribute positively to the value of and, using the optical theorem, the lower bound,
| (3) |
is obtained by taking the spin-averaged total cross section . This lower bound and the full Grein and Kroll estimates for [16] are both shown in Fig. 6 where, for consistency, the same values of were used in the two calculations.
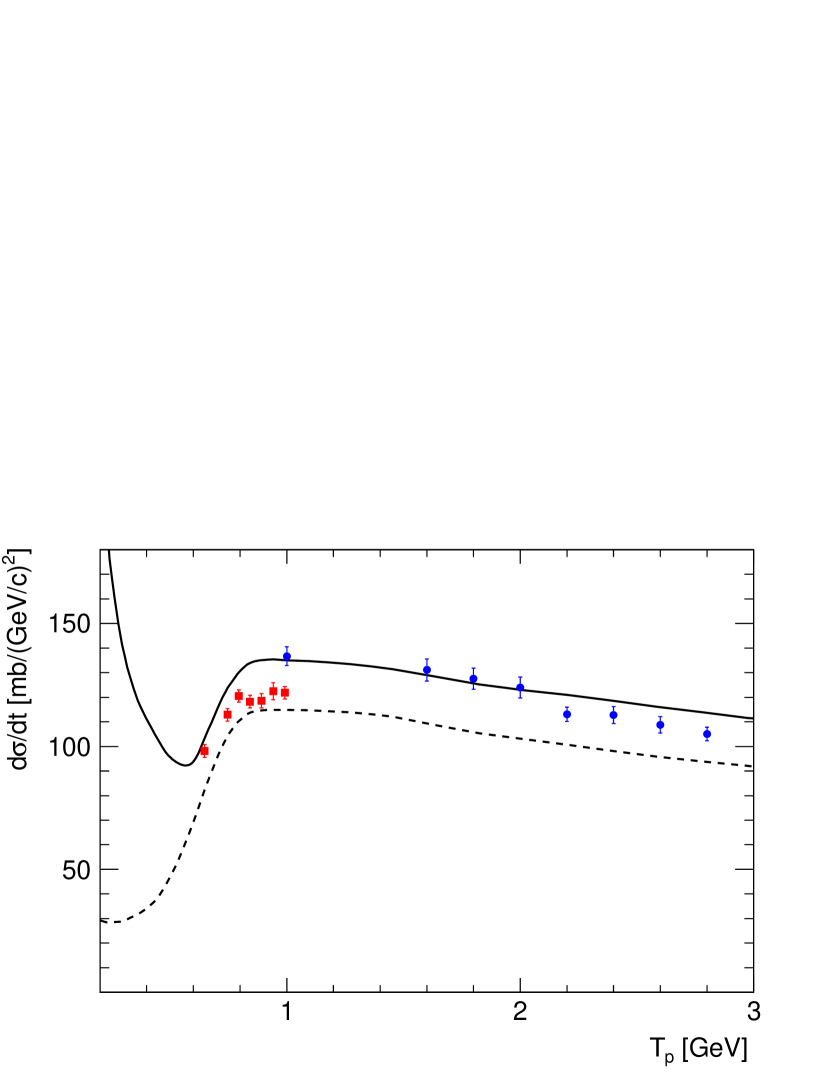
The 992 MeV Gatchina data of Fig. 3 show a significant rise at small that is a reflection of Coulomb distortion of the strong interaction cross section and this was taken into account through the introduction of explicit corrections [17]. The corrected data were then extrapolated to the forward direction (), using a simple exponential function, which would correspond to Eq. (2) with . The resulting points at all the energies studied are generally about 10% below the Grein and Kroll predictions and would therefore correspond to smaller real parts of the spin-dependent amplitudes. The extrapolation does, of course, depend upon the Coulomb-corrected data following the exponential fit down to .
Though the ANKE data do not probe such small values as Gatchina [17], and are therefore less sensitive to Coulomb distortions, these effects cannot be neglected since they contribute between about 1.5% and 4.5% at 1.0 GeV though less at higher energies. It is seen in Fig. 5 that modified SAID solutions describe well the ANKE measurements at three typical energies and the same is true also at the energies not shown. After fitting the ANKE measurements, there is a facility in the SAID program for switching off the Coulomb interaction without adjusting the partial wave amplitudes [4] and this allows a robust extrapolation of the Coulomb-free cross section to the forward direction. The approach has the advantage that it includes some of the minor Coulomb effects that are contained in the SAID program [21, 22]. It takes into account the phase variations present in the partial wave analysis and also the deviations from exponential behaviour for very small momentum transfers, (GeV/)2, that are linked to pion exchange. The values for (Corr.) at produced in this way are given in Table 2 and shown in Fig. 6. The error bars are purely the systematic uncertainties listed in Table 1 and any errors in the angular dependence of the SAID predictions are neglected.
The corrections obtained using the SAID program with and without the Coulomb interaction at 1 GeV are a little larger than those found by the Gatchina group using an explicit Coulomb formula [17], in part due to the different relative real parts of the amplitude in the two calculations.
The agreement of the ANKE data with the theoretical curve in Fig. 6 is encouraging and would be even slightly better if the normalisation factors found in the fits to the cross sections in Fig. 5 were implemented. Nevertheless, the extrapolated values generally fall a little below the predictions at the higher energies.
In summary we have measured the differential cross sections for proton-proton elastic scattering at eight energies between 1.0 and 2.8 GeV in a c.m. angular domain between about – to –, depending on the energy. Absolute normalisation of typically 3% were achieved by measuring the energy loss of the beam as it traversed the target. After taking the Coulomb distortions into account, the extrapolations to the forward direction, are broadly compatible with the predictions of forward dispersion relations.
Although our results are completely consistent with ANL measurements at 2.2 and 2.83 GeV [20], the published Gatchina values [17] are lower than ours at 1 GeV by about 8%, though this would be reduced to about 5% if one accepts the renormalisation factor from the SAID fit shown in Fig. 5.
The new ANKE data have a significant influence on a partial wave analysis of this reaction, changing in particular and waves at high energies. This will be made clearer in an update to the SAID SP07 solution [4]. On a more practical level, the measurements will also be a valuable tool in the normalisation of other experiments.
We acknowledge valuable discussions with Peter Kroll, who provided the numerical values of the predictions shown in Ref. [16]. We also are grateful to other members of the ANKE Collaboration for their help with this experiment and to the COSY crew for providing such good working conditions. This material is based upon work supported by the Forschungszentrum Jülich (COSY-FEE), the Shota Rustaveli Science Foundation Grant (#31/91), and the U.S. Department of Energy, Office of Science, Office of Nuclear Physics, under Award Number DE-FG02-99-ER41110.
References
- [1] D. Albers et al., Phys. Rev. Lett. 78 (1997) 1652.
- [2] D. Albers et al., Eur. Phys. J. A 22 (2004) 125.
- [3] M. Altmeier et al., Eur. Phys. J. A 23 (2005) 351.
-
[4]
R.A. Arndt, I.I. Strakovsky, R.L. Workman, Phys. Rev. C 62 (2000) 034005;
R.A. Arndt, W.J. Briscoe, I.I. Strakovsky,
R.L. Workman, Phys. Rev. C 76 (2007) 025209;http://gwdac.phys.gwu.edu. - [5] Z. Bagdasarian et al., Phys. Lett. B 739 (2014) 152.
- [6] D. Chiladze, Proc. 8th Int. Conf. Nucl. Phys. at Storage Rings, PoS(STORI11)039 (2011).
- [7] A.J. Simon et al., Phys. Rev. C 48 (1993) 662.
- [8] S. Barsov et al., Nucl. Instrum. Methods A 462 (2001) 364.
- [9] R. Maier et al., Nucl. Instrum. Methods A 390 (1997) 1.
- [10] S. Dymov et al., Part. Nucl. Lett. 2(119) (2004) 40.
- [11] H.J. Stein et al., Phys. Rev. ST Accel. Beams 11 (2008) 052801.
- [12] D. Prasuhn et al., Nucl. Instrum. Methods Phys. Res. A 441 (2000) 167.
- [13] A. Khoukaz et al., Eur. Phys. J. D 5 (1999) 275.
- [14] NIST-PML database, http://www.nist.gov/pml/data/star.
-
[15]
S. Dymov, ANKE internal report #32 available from
http://collaborations.fz-juelich.de/ikp/anke/internal.shtml. - [16] W. Grein, P. Kroll, Nucl. Phys. A 377 (1982) 505.
- [17] A.V. Dobrovolsky et al., Nucl. Phys. B 214 (1983) 1.
- [18] A.V. Dobrovolsky et al., report LNPI-1454 (1988).
- [19] B.H. Silverman et al., Nucl. Phys. A 499 (1989) 763.
- [20] I. Ambats et al., Phys. Rev. D 9 (1974) 1179.
- [21] R.A. Arndt et al., Phys. Rev. D 28 (1983) 97.
- [22] C. Lechanoine, F. Lehar, F. Perrot, P. Winternitz, Nuovo Cimento A 56 (1980) 201.