Powerful quasar outflow in a massive disc galaxy at
Abstract
There is growing observational evidence of high-redshift quasars launching energetic, fast outflows, but the effects that these have on their host galaxies is poorly understood. We employ the moving-mesh code AREPO to study the feedback from a quasar that has grown to by and the impact that this has on its host galaxy. Our simulations use a super-Lagrangian refinement technique to increase the accuracy with which the interface of the quasar-driven wind and the surrounding gas is resolved. We find that the feedback injected in these simulations is less efficient at removing gas from the galaxy than in an identical simulation with no super-Lagrangian refinement. This leads to the growth of a massive, rotationally supported, star-forming disc, co-existing with a powerful quasar-driven outflow. The properties of our host galaxy, including the kinematical structure of the gaseous disc and of the outflow, are in good agreement with current observations. Upcoming ALMA and JWST observations will be an excellent test of our model and will provide further clues as to the variance in properties of high-redshift quasar hosts.
keywords:
methods: numerical – black hole physics – cosmology: theory – cosmology: galaxy formation1 Introduction
High redshift quasars, thought to be powered by accretion processes on to supermassive black holes (Lynden-Bell 1969), are unique probes not only of black hole growth in the early Universe but also of galaxy formation in extreme environments. Assembly of black holes with masses in excess of in less than of cosmic time (Mortlock et al. 2011) requires copious amounts of low angular momentum gas to be channelled into the innermost regions of a galaxy to sustain high accretion rates comparable to or even in excess of the Eddington limit. Some of the most promising sites for this physical process to take place are very massive proto-clusters embedded within collapsing large-scale over-densities and surrounded by a rich web of filaments (e.g. Springel et al. 2005b; Sijacki et al. 2009; Di Matteo et al. 2012; Dubois et al. 2012; Costa et al. 2014). Even if a very small fraction of the quasar luminosity couples to the surrounding matter this can lead to powerful outflows, which have indeed been recently observed in distant quasars (e.g. Maiolino et al. 2012; Cicone et al. 2015).
A crucial question that then arises is how these outflows interact with the host galaxy and affect its gas content, star formation rate and morphology. The quasar-driven outflows are sufficiently energetic that they may heat and unbind a large fraction of the gas in a galaxy (Silk & Rees 1998; Fabian 1999; King 2005), ridding the galaxy of its star formation reservoir and leading to the shutting off of star formation and quenching. On the other hand, it is possible that the outflows launched by the central engine cannot effectively couple with the surrounding dense interstellar medium (ISM) and instead leave the host galaxy without causing major disruption to the ISM (Debuhr et al. 2012; Bourne et al. 2014; Roos et al. 2015) or they may even lead to shock-induced star formation bursts (Silk 2013). For a given strength of quasar outflow clearly these scenarios can lead to very different host galaxy properties. In this Letter we present very high resolution zoom-in simulations of a high redshift quasar grown self-consistently in a cosmological simulation of a massive proto-cluster region. We employ a recently developed super-Lagrangian refinement technique (Curtis & Sijacki 2015) to resolve the interface between the quasar-launched outflow and its host galaxy with higher spatial resolution, allowing us to study the morphological and kinematical imprints that can be directly compared with upcoming ALMA and JWST observations.
| Simulation type | () | () | () | () | (kpc) | SFR () |
|---|---|---|---|---|---|---|
| Default | 108 | 96.5 | ||||
| Refinement | 108 | 397 |
2 Methodology
We use the finite volume moving mesh code AREPO (Springel 2010) which adopts the TreePM approach for gravity and a Voronoi mesh to discretise the fluid. We select one of the most massive haloes from the Millennium simulation (Springel et al. 2005b) and resimulate it at high resolution, including baryons as in Sijacki et al. (2009); Costa et al. (2014). The spatial and mass resolutions of our simulation are: (comoving), and , where is the mean cell mass at the beginning of the simulation. We include primordial gas cooling and heating and a UV background as in Sijacki et al. (2009) and a sub-grid model for star formation and associated feedback (Springel & Hernquist 2003). No galactic outflows are explicitly included. We seed black holes in haloes with which then grow at the Bondi rate, capped at the Eddington limit, and through black hole mergers. Feedback consists of thermal energy which is injected into the surrounding gas cells within the black hole smoothing length and weighted by mass. In both simulations this region contains times the mean gas cell mass. For full details of the black hole model see Springel et al. (2005a); Sijacki et al. (2009); Curtis & Sijacki (2015).
We present the results of two otherwise identical simulations, one of which adopts the super-Lagrangian refinement method detailed in Curtis & Sijacki (2015), which allows us to increase the resolution of our simulations around the black holes. To do this, we split and merge cells over an adaptive region defined by the smoothing length of each black hole (which is typically around for the largest black hole), forcing the innermost cells to be the size of the Bondi radius of each black hole. For when the black hole growth reaches a plateau, the mean cell size in the refined region is , while the smallest cells have a size of and a mass of . The region of refinement itself is typically (physical). Our aim is to examine how a better resolution in the region in which feedback is injected, without otherwise changing the parameters of the feedback, can make a difference in our understanding of the environment and host galaxy properties of high redshift quasars. The results presented below, where not otherwise indicated, are from our simulation with the refinement scheme and all properties are given in physical units.
3 Results
3.1 The large scale distribution
After the first black holes are seeded at , a subset of simulated black holes begin growing rapidly for , quickly reaching the Eddington limit. In this phase, the feedback is insufficient to prevent gas inflows on to massive haloes and so does little to affect the black hole accretion (see also Sijacki et al. 2009; Costa et al. 2014) or the star formation, which reaches a peak of at . The black hole growth and host galaxy properties in the simulations with and without the super-Lagrangian refinement are very similar during this phase. The differences begin to occur during the end of the Eddington growth. At this point, the black hole has reached a sufficiently high mass to cut off its own accretion flow, which for the most massive black hole in our simulations happens at . We find that the nature of this initial shut off and the manner in which the feedback continues to regulate the black hole growth after this phase is important in determining the galaxy properties, and we focus our subsequent analysis on this later period. It is worth noting that in the simulation with super-Lagrangian refinement the black hole growth is somewhat more efficient for and the final mass of the most massive black hole is times higher at , reaching . The bolometric luminosity of the quasar in this period varies between and .
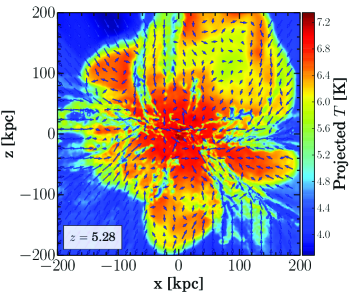
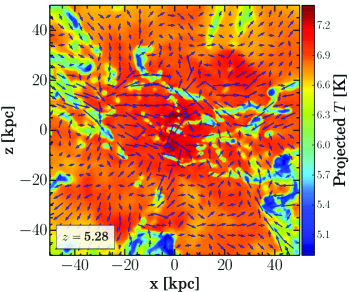
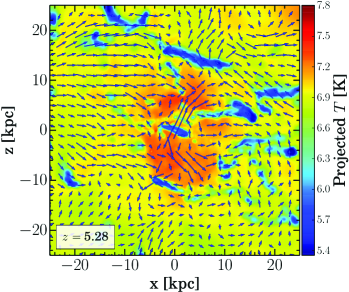
In Fig. 1 we show gas temperature maps centred on the largest halo in our simulation (detailed halo properties are listed in Table 1). Here, the rich web of cold filaments is feeding the halo with gas from large scales, following the distribution of the dark matter. As the filaments reach the virial radius the surrounding gas rises in temperature, from to much higher temperatures of around a few . This is mostly the result of the gas virially shocking, in line with the classical analytical models of galaxy formation (Rees & Ostriker 1977; Silk 1977; White & Frenk 1991), whereby the cooling radius of the in-falling gas is much smaller than the virial radius, allowing for a quasi-hydrostatic atmosphere to form in the halo. In addition to this, feedback from the central black hole heats the gas to a high temperature of a few . In line with previous simulations (see e.g. Kereš et al. 2005; Ocvirk et al. 2008; Nelson et al. 2013) the filaments are not totally disrupted at the virial radius and the cold filamentary accretion continues down to smaller scales (Di Matteo et al. 2012; Dubois et al. 2012; Costa et al. 2014). While the filaments are largely disrupted roughly half-way through the halo, the residual accretion of the cold gas persists across the successively smaller scales shown in Fig. 1, connecting large scale filaments with the central galaxy at the bottom of the potential well.
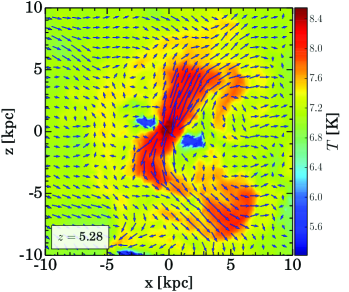
The bottom right-hand panel of Fig. 1 shows the gas temperature of a slice through the centre of the halo. The gas that has reached this far into the halo has circularized into a massive cold gaseous disc, which forms not long after the end of the Eddington limited phase of accretion, and is in place by . Detailed galaxy properties are listed in Table 2. Note that the axis of rotation of the disc is largely perpendicular to the orientation of the main filaments. Parallel to the rotational axis of the disc is the hot, outflowing gas that has been launched by the powerful feedback from the central supermassive black hole. This is entirely hydrodynamically driven - the black hole injects thermal energy into the gas in the very central region which then expands and rises in the comparatively cool medium of the disc and surrounding warm gas. The peak velocity of the outflow, , occurs at from the black hole, as the centre of the outflow accelerates slightly, before dropping off. The mass averaged velocity of the outflowing gas, however, is fastest in the centre of the outflow and at its base where the pressure gradient is strongest.
The cold gaseous disc shown here is not present in our simulation without super-Lagrangian refinement - a similar structure forms at the same time, i.e. at , but in the case without refinement, the cold gas is completely overwhelmed by the feedback from the black hole. This is particularly interesting given that, in the refinement simulation, the black hole grows slightly faster and, as such, more cumulative feedback energy has been injected into the gas by . This underlines the importance of resolving the inner region of the outflowing gas - if the resolution is insufficient (both spatially or temporally) then the feedback will blow away the cold gas before the hot quasar-driven wind is able to rise out of the galaxy and subsequent predictions about the morphology of the host galaxy will likely be incorrect.
3.2 Properties of the inflow and outflow
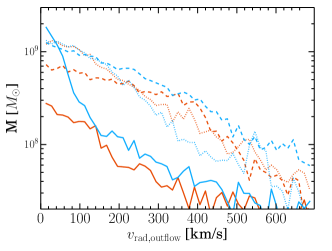
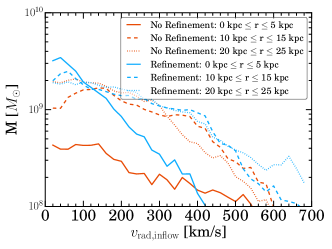
In Fig. 2, we show the gas mass distribution as a function of its velocity for both simulations. Our intent here is to investigate what difference the use of refinement has on the kinematic properties of the gas, even at distances much larger than those at which we increase the resolution, i.e. at . These plots are for our simulations at , but the results are very similar from onwards, when the black hole is in its post Eddington regime.
In the left-hand panel of Fig. 2, we show the velocity distribution of the outflowing gas. At all radii, the two simulations agree reasonably well, predicting a similar gas mass distribution, but overall there is more of the outflowing gas in the simulation with refinement. We have also estimated the total mass in the outflow, which is within , its momentum flux is , while the outflow rate is (if we consider speeds higher than this number drops to ).
In the right-hand panel of Fig. 2 we show a similar plot, but for the inflowing gas. There is a significant difference in the mass distribution at low radii - the non-refinement simulation exhibits little inflow across all velocity bins, whilst the refinement simulation shows a much larger mass of inflowing gas at lower velocities. This difference is still sizeable at out from the black hole, an order of magnitude outside of our refinement region. By the time we reach , the two simulations agree well. The difference, in both cases, is a reflection of the simulation resolution and hence the spatial distribution of the outflow. With refinement, the outflow is tightly collimated with a small opening angle (as the cells are not enforced to maintain approximately constant mass), and the gas rises vertically out of the galaxy without interacting much with the cold disc of accreting gas. Without refinement the hot gas expands, leading to a very coarse effective resolution and it interacts with the inflowing gas, reducing both the inflow and outflow at small radii.
3.3 Galaxy morphology
| Disc | ||||
|---|---|---|---|---|
| (kpc) | (kpc) | () | () | |
| Gas | 3.5 | 2.05 | 3.53 | 332 |
| Stellar | 3.5 | 0.86 | 27.5 | - |
We now focus on the morphological properties of the quasar host galaxy in our simulation with refinement. The black hole sits at the centre of an exponential stellar disc, with a prominent and kinematically distinct central bulge component. The ratio for our galaxy is , which is within the scatter of the observed relation of Kormendy & Ho (2013). The abundance matching constraints of Moster et al. (2013) suggest that a dark matter halo of mass at should on average host a central galaxy with a stellar mass of , indicating that while we overproduce around twice as many stars as predicted by the mean relation we are within the 1 scatter, which has an upper bound of . We do not include strong stellar feedback in our simulations in the form of energetic supernova-driven outflows, which may likely bring our simulated disc stellar mass closer to the mean relation.
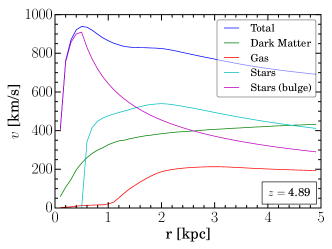
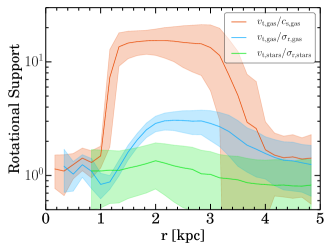
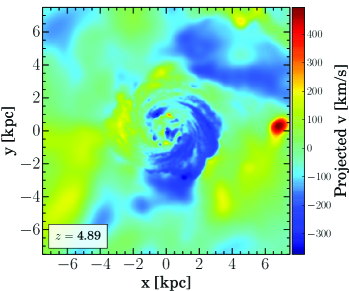
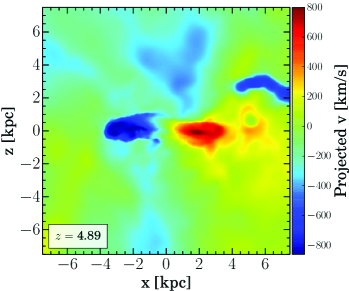
In the left-hand panel of Fig. 3 we show the rotation curves of different components, with stellar bulge dominating in the centre, followed by the stellar disc at the intermediate range of radii and finally by dark matter outside of the galaxy. In the right-hand panel we plot the tangential velocity of the gas divided by the sound speed of the gas and the radial velocity dispersion of the gas, respectively. The tangential velocity of the stars divided by their radial velocity dispersion is shown as well, indicating much larger velocity dispersion support. The gas disc is aligned with the stellar component and covers a similar radial extent. The surface density profile is however not well modelled by an exponential, especially in the inner region. In Fig. 4 we show the projected line of sight velocity of the gas centred on the galaxy. There is a clear signature of the rotating gas disc both when viewed face-on and edge-on with typical velocities of and , respectively.
4 Discussion
Recent observations have started to shed light on the properties of quasar feedback at high redshifts and several studies have found evidence of large-scale outflows (e.g Maiolino et al. 2012; Cicone et al. 2015). However, there are currently very few observed examples which can constrain in detail both the quasar outflow and the host galaxy properties, especially at high redshift. A notable exception, but in the local Universe, is Mrk 231, a ULIRG galaxy with a quasar at its core. The inferred star formation rate of the galaxy of , its regular rotation pattern together with the outflow rate of and velocity of (Feruglio et al. 2010) agrees very well with our results, indicating that our simulated system could be a high redshift counterpart of Mrk 231. Recent ALMA observations by Carniani et al. (2013) have found a quasar - SMG pair at , where host galaxies exhibit a rotationally supported geometry with a range of velocities and disc sizes similar to our findings, albeit with no detected quasar outflow. Moreover, ALMA observations of five luminous quasars at by Wang et al. (2013) with a range of black hole masses and host galaxy dynamical masses bracketing our results, find evidence of velocity gradients indicative of rotationally supported discs. It is worth noting however that observed quasar host galaxies are more likely to be viewed face-on, and this selection bias needs to be taken into account when comparing to our simulation results.
The results presented in this Letter indicate that a more careful treatment of the black hole feedback injection can lead to feedback having less of an impact on galaxy properties (see also Dubois et al. 2015; Feng et al. 2015), at least concerning the central galaxy over limited periods of time. However, the injected energy can have a longer term impact - it will heat the gas outside of the central galaxy in the circum-galactic and inter-galactic medium. This will affect the subsequent gas cooling on to the galaxy which, if there is sufficient energy, may ultimately lead to the starvation and quenching of star formation.
In light of this, it will be increasingly important in future work to attempt to model the ISM, ideally down to parsec scales and below. High density clumps within the ISM will be more resistant to destruction by the central engine, and this will further complicate the picture of how the feedback energy couples to the surrounding medium and quenches star formation. Future ALMA and JWST observations will be crucial in this regard, as they will allow detailed comparison with the theoretical models and also provide larger statistical samples to pin down the morphological variety of galaxies hosting powerful quasar outflows.
Acknowledgements
We thank Roberto Maiolino, Martin Haehnelt and Ewald Puchwein for many helpful suggestions on the manuscript. MC is supported by the STFC and DS acknowledges support by the ERC Starting Grant 638707 “Black holes and their host galaxies: co-evolution across cosmic time”. This work was performed on: DiRAC Darwin Supercomputer (University of Cambridge HPCS; Higher Education Funding Council for England and STFC); DiRAC Complexity system (University of Leicester IT Services; BIS National E-Infrastructure grant ST/K000373/1 and STFC DiRAC grant ST/K0003259/1); the COSMA Data Centric system (Durham University; BIS National E-infrastructure grant ST/K00042X/1, STFC grant ST/K00087X/1, DiRAC Operations grant ST/K003267/1 and Durham University). DiRAC is part of the National E-Infrastructure.
References
- Bourne et al. (2014) Bourne M. A., Nayakshin S., Hobbs A., 2014, MNRAS, 441, 3055
- Carniani et al. (2013) Carniani S. et al., 2013, A&A, 559, A29
- Cicone et al. (2015) Cicone C. et al., 2015, A&A, 574, A14
- Costa et al. (2014) Costa T., Sijacki D., Haehnelt M. G., 2014, MNRAS, 444, 2355
- Curtis & Sijacki (2015) Curtis M., Sijacki D., 2015, MNRAS, 454, 3445
- Debuhr et al. (2012) Debuhr J., Quataert E., Ma C.-P., 2012, MNRAS, 420, 2221
- Di Matteo et al. (2012) Di Matteo T., Khandai N., DeGraf C., Feng Y., Croft R. A. C., Lopez J., Springel V., 2012, ApJ, 745, L29
- Dubois et al. (2012) Dubois Y., Pichon C., Haehnelt M., Kimm T., Slyz A., Devriendt J., Pogosyan D., 2012, MNRAS, 423, 3616
- Dubois et al. (2015) Dubois Y., Volonteri M., Silk J., Devriendt J., Slyz A., Teyssier R., 2015, MNRAS, 452, 1502
- Fabian (1999) Fabian A. C., 1999, MNRAS, 308, L39
- Feng et al. (2015) Feng Y., Di Matteo T., Croft R., Tenneti A., Bird S., Battaglia N., Wilkins S., 2015, ApJ, 808, L17
- Feruglio et al. (2010) Feruglio C., Maiolino R., Piconcelli E., Menci N., Aussel H., Lamastra A., Fiore F., 2010, A&A, 518, L155
- Kereš et al. (2005) Kereš D., Katz N., Weinberg D. H., Davé R., 2005, MNRAS, 363, 2
- King (2005) King A., 2005, ApJ, 635, L121
- Kormendy & Ho (2013) Kormendy J., Ho L. C., 2013, ARA&A, 51, 511
- Lynden-Bell (1969) Lynden-Bell D., 1969, Nature, 223, 690
- Maiolino et al. (2012) Maiolino R. et al., 2012, MNRAS, 425, L66
- Mortlock et al. (2011) Mortlock D. J. et al., 2011, Nature, 474, 616
- Moster et al. (2013) Moster B. P., Naab T., White S. D. M., 2013, MNRAS, 428, 3121
- Nelson et al. (2013) Nelson D., Vogelsberger M., Genel S., Sijacki D., Kereš D., Springel V., Hernquist L., 2013, MNRAS, 429, 3353
- Ocvirk et al. (2008) Ocvirk P., Pichon C., Teyssier R., 2008, MNRAS, 390, 1326
- Rees & Ostriker (1977) Rees M. J., Ostriker J. P., 1977, MNRAS, 179, 541
- Roos et al. (2015) Roos O., Juneau S., Bournaud F., Gabor J. M., 2015, ApJ, 800, 19
- Sijacki et al. (2009) Sijacki D., Springel V., Haehnelt M. G., 2009, MNRAS, 400, 100
- Silk (1977) Silk J., 1977, ApJ, 211, 638
- Silk (2013) Silk J., 2013, ApJ, 772, 112
- Silk & Rees (1998) Silk J., Rees M. J., 1998, A&A, 331, L1
- Springel (2010) Springel V., 2010, MNRAS, 401, 791
- Springel et al. (2005a) Springel V., Di Matteo T., Hernquist L., 2005a, MNRAS, 361, 776
- Springel & Hernquist (2003) Springel V., Hernquist L., 2003, MNRAS, 339, 289
- Springel et al. (2005b) Springel V. et al., 2005b, Nature, 435, 629
- Wang et al. (2013) Wang R. et al., 2013, ApJ, 773, 44
- White & Frenk (1991) White S. D. M., Frenk C. S., 1991, ApJ, 379, 52