ALMA resolves extended star formation in high- AGN host galaxies
Abstract
We present high resolution (0.3′′) Atacama Large Millimeter Array (ALMA) 870 m imaging of five 1.5–4.5 X-ray detected AGN (with luminosities of erg s-1). These data provide a 20 improvement in spatial resolution over single-dish rest-frame FIR measurements. The sub-millimetre emission is extended on scales of FWHM0.2′′–0.5′′, corresponding to physical sizes of 1–3 kpc (median value of 1.8 kpc). These sizes are comparable to the majority of =1–5 sub-millimetre galaxies (SMGs) with equivalent ALMA measurements. In combination with spectral energy distribution analyses, we attribute this rest-frame far-infrared (FIR) emission to dust heated by star formation. The implied star-formation rate surface densities are 20–200 yr-1 kpc-2, which are consistent with SMGs of comparable FIR luminosities (i.e., [1–5]1012 L☉). Although limited by a small sample of AGN, which all have high FIR luminosities, our study suggests that the kpc-scale spatial distribution and surface density of star formation in high-redshift star-forming galaxies is the same irrespective of the presence of X-ray detected AGN.
keywords:
galaxies: active; — galaxies: star formation; — quasars: general; — galaxies: evolution; — submillimetre: galaxies1 Introduction
Understanding the physical processes that drive the growth of super-massive black holes (SMBHs i.e., active galactic nuclei; AGN) and how this relates to the growth of their host galaxies (i.e., star formation), is an ongoing challenge of observational and theoretical astronomy (e.g., Alexander & Hickox 2012; Crain et al. 2015; Volonteri et al. 2015). The bulk of star formation and black hole growth occurred at high redshift (i.e., 1) and most observational work of high- galaxies, suggests that the star-formation rates (SFRs) of AGN hosts are broadly consistent with the overall star-forming population (e.g., Stanley et al 2015; Azadi et al. 2015; Banerji et al. 2015). However, the average black hole growth rates of high- massive galaxies do appear to be correlated with average SFRs (e.g., Mullaney et al. 2012; Delvecchio et al. 2014). These combined results potentially indicate a common fuelling mechanism for both processes, but with the AGN activity varying on much shorter timescales than the star formation (e.g., Hickox et al. 2014; Stanley et al 2015). Unfortunately these and similar studies have been limited to spatially-unresolved measurements of the star formation, such as those provided by Herschel (e.g., FWHM6.5′′ at 100m) or SCUBA-2 (e.g., FWHM14.5′′ at 850m). These measurements hide crucial information on the star formation spatial distribution and surface densities of star formation.
Arguably the best tracer of star formation in high- galaxies is rest-frame far-infrared (FIR) emission (8–1000 m). This emission is due to dust that has been heated by young stars inside star-forming regions (e.g., see Lutz 2014). For AGN host-galaxies there is some discussion about the contribution of star formation versus AGN activity as the source of heating for FIR-emitting dust (e.g., see Hill & Shanks 2011; Netzer et al. 2015); however, providing direct size measurements of the emission provides a useful constraint on this issue (e.g., see Lutz et al. 2015). In the era of the Atacama Large Millimeter Array (ALMA), it is now possible to rapidly build up large samples of high- galaxies with accurate measurements of the angular sizes of the rest-frame FIR emission, and consequently to constrain the spatial distribution and surface density of star formation (e.g., Simpson et al. 2015; Ikarashi et al. 2015; Diaz-Santos et al. 2015). Such work builds on previous sub-arcsecond resolution interferometric continuum observations of a small number highly-selected high- sub-millimetre galaxies (SMGs) and AGN (e.g., Tacconi et al. 2006; Clements et al. 2009). Comparing the spatial distribution of star formation in AGN to non-AGN host galaxies of uniformly-selected samples will provide important information on the feeding and feedback processes involved in SMBH accretion (e.g., see Volonteri et al. 2015).
In this letter we present high-resolution (FWHM=0.3′′) ALMA 870 m continuum measurements of 1.5–4.5 X-ray identified AGN. This is based on ALMA data from a programme that was designed to obtain sensitive SFR measurements (or upper limits) for X-ray AGN (Mullaney et al. 2015; §2). Here, we place constraints on the sizes of the rest-frame FIR emission in high- X-ray AGN host galaxies and hence measure the spatial distribution and surface density of star formation in these sources (§3). We compare to equivalent ALMA observations SMGs, to assess if and how AGN activity in high- star-forming galaxies is related to SFR surface density (§4). Throughout, we adopt km s-1 Mpc-1, and .
2 Target selection, observations and analysis
The data presented in this letter are from a Cycle 1 Band 7 ALMA programme to obtain 870 m continuum measurements of 1.5 X-ray detected AGN that were selected to be pre-dominantly faint or undetected in Herschel measurements.111This paper makes use of ALMA data: ADS/JAO.ALMA-2012.1.00869.S. ALMA is a partnership of ESO (representing its member states), NSF (USA), NINS (Japan), together with NRC (Canada), NSC and ASIAA (Taiwan), and KASI (Republic of Korea), in cooperation with the Republic of Chile. The Joint ALMA Observatory is operated by ESO, AUI/NRAO and NAOJ. Thirty AGN were targeted that were selected from the Chandra-Deep Field South (CDF-S; Xue et al. 2011), to have X-ray luminosities of 1042 erg s-1. The details of how the sample was constructed are provided in Mullaney et al. (2015); however, we note that they only include 24 sources in their study due to specific constraints on the redshifts and stellar masses. Here we exploit all of the high signal-to-noise ratio (SNR) detections from these data, including serendipitous detections (see below).
2.1 ALMA observations
The 30 primary targets were split into three groups containing 7, 11 and 12 targets each. The first two groups were observed in two observing blocks, whilst the third group was observed once. The array configuration contained 26 ALMA antennae, with a maximum baseline of 1300 m and median baselines of 200 m. The observations are sensitive to a maximum angular scale of 4–6′′, at which we expect to recover all of the rest-frame FIR-emission (see Simpson et al. 2015; Ikarashi et al. 2015). Each target was observed using 7.5 GHz of bandwidth, centred on 351 GHz (i.e., 870 m), with on-source exposure times of 2.5–7 min. All measurement sets have a full compliment of calibrator observations (amplitude, phase and bandpass). Full details of the observations and data reduction will be presented in Stanley et al. (in prep).
2.2 Data reduction and source detection
The data were processed using the Common Astronomy Software Application (casa; version 4.4.0; McMullin et al. 2007) and imaged using the clean routine provided by casa. We used the most recent version of the ALMA data reduction pipeline to calibrate the raw data. However, the calibrated data were then visually inspected and, where appropriate, we repeated the pipeline calibration including additional data flagging. To image the data, we largely follow the methods described in detail in Simpson et al. (2015) and so we only provide brief details here. We created two sets of images: (1) “detection images” (FWHM0.8′′) and (2) “high-resolution images” (FWHM0.3′′). For both sets of images we initially create “dirty” images and identify emission detected with SNR5. We then place a tight clean mask around the emission from the source and iteratively clean down to 1.5 within these regions. Finally, we measure the noise in the cleaned image, and repeat the cleaning process around SNR4 sources.
For the detection images, we applied natural weighting and a Gaussian taper, resulting in synthesised beams of (0.8′′–0.9′′)0.7′′. The noise of the final cleaned images have a range of =0.10–0.25 mJy beam-1. To create the high-resolution images we used Briggs weighting (robust parameter = 0.5) to obtain synthesised beams of (0.3′′–0.4′′)0.2′′. These final cleaned images have a noise of =0.07–0.18 mJy beam-1.
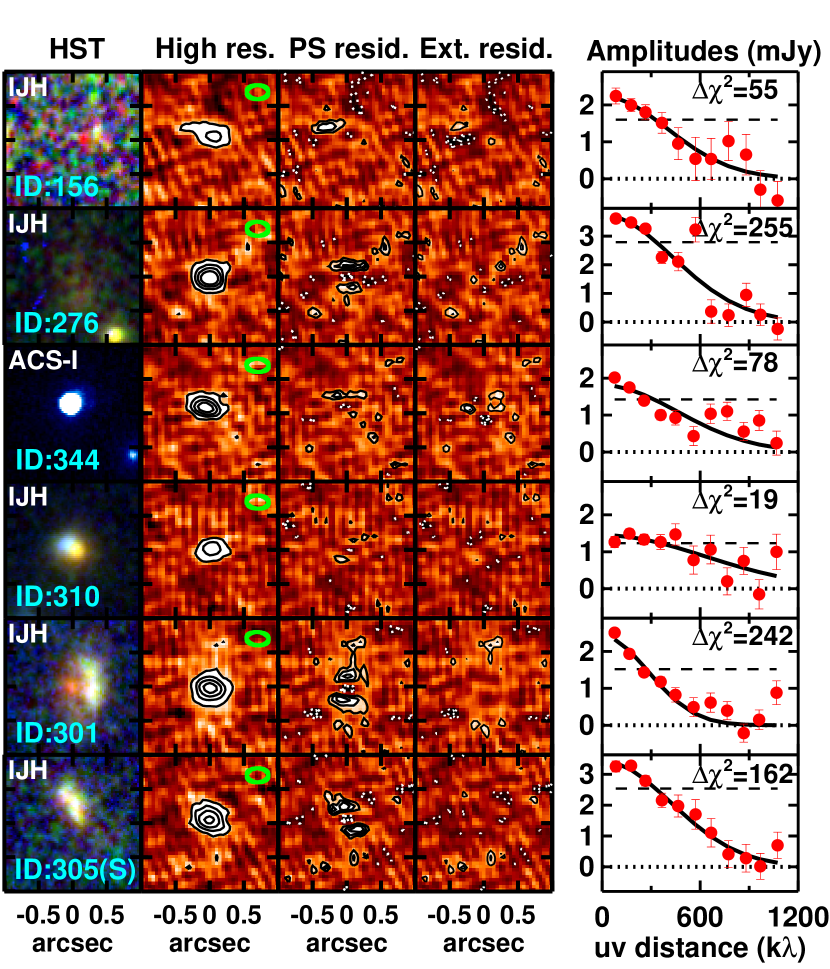
We searched for ALMA sources that are detected within the primary beam of the high-resolution images with peak SNRs9. Above this detection threshold we can make measurements of the continuum sizes in these images and compare directly to the SMGs with equivalent measurements in Simpson et al. (2015) (see §4). Across all of the images we obtain six sources, with peak SNRs9, of which three are primary X-ray AGN targets for this programme (Mullaney et al. 2015), two are serendipitous X-ray AGN and one is a serendipitous source which is not X-ray detected (Table 1). This low ALMA detection rate of the primary AGN targets is driven by a selection which prioritised AGN with low Herschel FIR fluxes and a discussion of this is provided in Mullaney et al. (2015). In Section 4 we compare our detected sources to SMGs with similar fluxes and luminosities. The ALMA detection images and high-resolution images for these six targets are shown in Figure 1. Peak flux densities are measured directly from the images (calibrated in units of Jy beam-1). Total flux densities are measured using high-resolution images that are converted to Jy pixel-1 and 1′′ diameter apertures. We note that we obtain consistent flux measurements if we use the detection images (i.e., agreement within 20% in all cases and a median ratio between measurements of 1.0). Uncertainties are calculated by taking the 1 distribution from placing hundreds of random apertures across the images.
Properties of the high SNR ALMA-detected X-ray AGN
| ID | FWHM | ||||
|---|---|---|---|---|---|
| (erg s-1) | (mJy) | (L☉) | (arc sec) | ||
| 156 | 4.7 | 43.6 | 2.30.4 | 12.3 | 0.490.11 |
| 276 | 1.52 | 42.1 | 3.70.3 | 12.6 | 0.200.03 |
| 301 | 2.47 | 43.3 | 2.700.19 | 12.4 | 0.260.04 |
| 310 | 2.39 | 43.2 | 1.440.28 | 12.1 | 0.230.06 |
| 344 | 1.617 | 43.4 | 2.020.19 | 12.3 | 0.170.05 |
| 305(S)⋆ | 2.93 | - | 3.60.3 | 12.1 | 0.320.04 |
2.3 Multi-wavelength properties
The details of our final six targets are tabulated in Table 1. For the AGN we adopt the photometric redshifts and 1 uncertainties provided in Hsu et al. (2014). They identified the optical counterparts of the X-ray sources in CDF-S and performed detailed spectral energy distribution (SED) analyses to optical through mid-infrared photometric data, including host galaxy and AGN templates. We adopt the available spectroscopic redshift for ID:344 (Szokoly et al. 2004) and for the serendipitous target we use the photometric redshift and 1 uncertainty from the 3D-HST team (Skelton et al. 2014). We use these redshifts and the 2–8 keV X-ray fluxes from Xue et al. (2011) to calculate X-ray luminosities, assuming a power-law index of =1.4 (Table 1). To determine the position of the ALMA sources with respect to the optical emission, we collated the -band, and where possible, and band HST observations of our targets (Fig. 1; Guo et al. 2013).
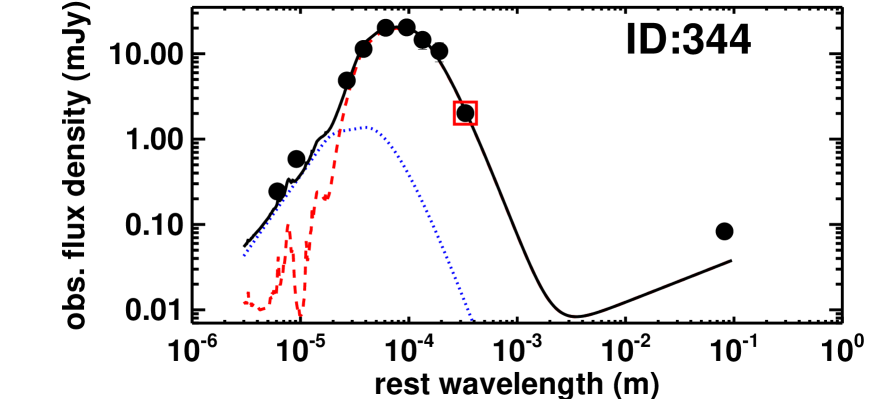
We derive total infrared luminosities (=8–1000 m) by fitting SEDs to the available Spitzer, deblended Herschel-PACS; deblended Herschel-SPIRE and ALMA photometry (i.e., =16 m–870 m; see Fig. 2). The details of the SED fitting routine and the compilation of the non-ALMA photometry are detailed in Stanley et al (2015). Briefly, the fitting routine finds the best fit SED from normalising various combinations of empirical star-formation templates and an AGN template, taking into account photometric data points, uncertainties, and upper limits. Using the best-fit SEDs we derived total infrared luminosities, , due to star formation only (i.e., subtracting off any identified AGN contribution; see Fig. 2). In two cases (ID:156 and ID:276) there are no Spitzer or Herschel detections and therefore we use the ALMA measurement only. We believe that the ALMA photometry is well described by emission due to star formation because, based on a range of AGN templates (e.g., see Netzer et al. 2015), there would be a bright Spitzer 24 m detection if it was AGN dominated. Furthermore, in the other four cases the SEDs indicate that the ALMA photometry is dominated by star formation (e.g., Fig 2; Stanley et al. in prep). Finally, we assess if the sub-mm fluxes could have a contribution from radio synchrotron emission. Only three of our sources (156, 344 and 305[S]) are detected in the deep 1.4 GHz radio imaging of Miller et al. (2013) (typical sensitivity of 7.4 Jy per 2.8′′ by 1.6′′ beam). The flux densities are 88 Jy, 83 Jy and 41 Jy, respectively, which are over an order of magnitude lower than the ALMA flux densities (e.g., Fig. 2). We conclude that the ALMA photometry has negligible contribution from synchrotron emission.
3 Extended far-infrared emission
We have compiled a sample of five X-ray AGN, and one serendipitous target, with high SNR ALMA 870 m continuum detections in our high-spatial resolution images (FWHM0.3′′). For the redshifts of our targets these data cover rest-frame far-infrared wavelengths of 150–330 m. In this section we assess if this emission is extended and measure intrinsic (deconvolved) sizes. We are specifically interested in comparing to the redshift-matched (=1–5) SMGs with ALMA 870 m sizes presented in Simpson et al. (2015). These ALMA observations were taken at the same resolution as those presented here (i.e., FWHM0.3′′) and we can derive directly comparable size measurements. We also refer briefly to Ikarashi et al. (2015) who make size measurements of SMGs; however, they focus on higher redshift sources, typically have lower spatial resolution data and employ different methods to this study.
We make use of both the raw visibility data and our cleaned images to search for extended continuum emission in the ALMA data and measure sizes for our six sources. Firstly, we explore the raw visibilities by assessing how the amplitude of the data change as a function of distance. Increasing distance corresponds to smaller angular scales. Therefore, a point source has a constant amplitude across all distances and an extended source has a decreasing amplitude as a function of increasing distance (see e.g., Rohlfs & Wilson 1996). For each target we align the phase centre of the data to the position of the ALMA source and then extract the visibility amplitudes, binning across the distance in steps of 100k, and calculating the error on the mean in each bin (see Fig. 1).222We note that our targets do not have other bright ALMA sources in close proximity (which may complicate the analysis of the data). However, we obtain consistent results if we model and subtract all other 5 sources before extracting the visibilities. We model the amplitude- data with: (1) a constant amplitude (applicable for point source emission) and (2) a Gaussian (applicable for a Gaussian distribution of emission).
The amplitude data and our fits are shown in Figure 1. In all six cases the amplitudes are better described as decreasing, rather than constant, with distance. The values between the two fits range from 19–255. Using the Bayesian Information Criterion (Schwarz 1978), which takes into account the number of parameters in each fit, these values indicate strong evidence in favour of the Gaussian model (e.g., Mukherjee et al. 1998).
To measure the intrinsic far-infrared sizes of our targets we follow the same methods as those presented in Simpson et al. (2015). That is, we use the imfit routine in casa to fit an elliptical Gaussian model (convolved with the synthesised beam) to the 870 m emission in our high-resolution images (see Simpson et al. 2015 and Ikarashi et al. 2015 for various tests of this routine). In all cases imfit returns spatially-resolved fits, in agreement with our conclusions based on the data above. The fits are a good description of the data and show reduced residuals compared to point source model fits, as shown in Figure 1. We quote the sizes (major axes) and uncertainties returned by casa in Table 1 and plot them in Figure 3. For comparison, we derive sizes from Gaussian fits to the -amplitude data (Fig. 1; following e.g., Rohlfs & Wilson 1996). These values assume symmetry and will be systematically low compared to elliptical fits of the images (see Ikarashi et al. 2015); however, these sizes agree within 1–3 of the image-derived sizes, with a median ratio of FWHMuv/FWHMimage=0.9, in agreement with that found by Simpson et al. (2015) for SMGs.
We perform two further tests to verify there is extended emission in our six sources and that our size measurements are reliable. Firstly, we compare the peak and galaxy-integrated fluxes in the high-resolution images. We find /=0.49–0.74. These ratios indicate extended structure since a point source would have a peak flux density equal to the total flux density. Finally, we compare the peak flux densities in the detection images to those in the high-resolution images and obtain ratios of /=0.56–0.82. This drop in flux is strong evidence for emission that is more resolved at higher resolution. These ratios agree within 1–20% of the predicted values we obtain by taking out best imfit models and convolving them with the appropriate beams. This places further confidence on our size measurements described above.
4 Discussion
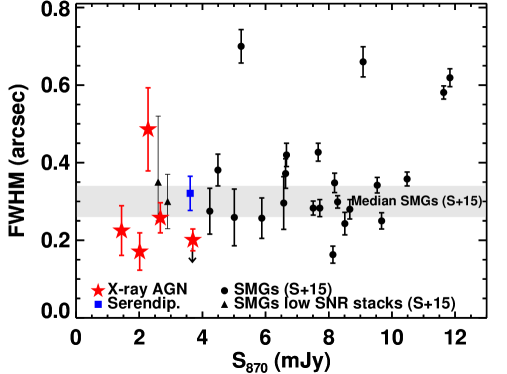
We have identified extended 870 m emission in the 1.5–4.5 host galaxies of five X-ray AGN (see Figure 1). The measured intrinsic (i.e., deconvolved) sizes are FWHM=0.2′′–0.5′′ and correspond to projected physical sizes of 1–3 kpc, with a median value of 1.8 kpc (see Fig. 3). We have used infrared SEDs to show that our ALMA photometry is consistent with star-forming SEDs (e.g., Fig. 2) and consequently we attribute this rest-frame FIR emission (i.e., 150–330 m) to dust heated by star formation. Furthermore, the observed spatial extent of the FIR emission on 1 kpc scales is challenging to explain with dust that is heated directly by AGN without any contribution from star formation.
In Figure 3 we compare our FIR size measurements with the 1–5 SMGs from the UDS field that were observed with ALMA by Simpson et al. (2015) and one serendipitous star-forming galaxy from our data. These sources have a similar redshift range to our X-ray AGN and have available FIR luminosities that are calculated following similar infrared SED analyses to those we applied to our AGN. Crucially, the size measurements are obtained from equivalent observational data sets and by using the same techniques as applied here. Simpson et al. (2015) present results for 23 SMGs for which they have high SNR ALMA detections, and hence reliable size measurements. They stack the data for a further 25 sources which have lower SNR detections (see Fig. 3). These SMGs are not identified as X-ray AGN based on the X-ray coverage of this field (Ueda et al. 2008). This X-ray data coverage is relatively shallow; however, very deep studies in CDF-S find the X-ray AGN detection rate of ALMA-identified SMGs to be 20% (Wang et al. 2013) and will make a minor contribution to the overall SMG sample.
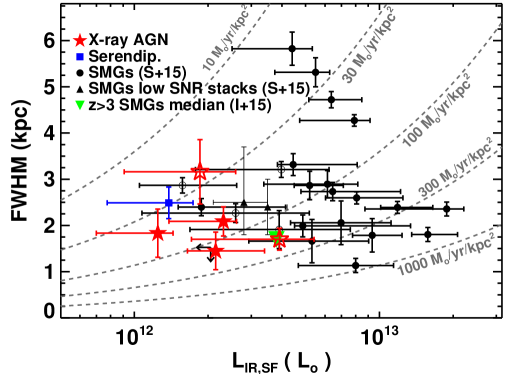
The median intrinsic FIR size of the SMGs is FWHM0.3′′, with a corresponding median physical size of 2.40.2 kpc (Simpson et al. 2015). Therefore, the sizes of the rest-frame FIR emission of our X-ray AGN host galaxies, are consistent with the typical sizes of SMGs (see Fig. 3). Four of the most luminous SMGs (with L☉) have very large sizes of 4–6 kpc. Our sample of X-ray AGN do not reach these high FIR luminosities and due to the low number of targets, we cannot conclude anything significant about the lack of very large sizes in our AGN sample.
To derive SFR surface densities we follow Simpson et al. (2015). That is, we convert infrared luminosities to SFRs, following Kennicutt (1998) (converting to a Chabrier IMF), and assume a uniform surface density with a radius of FWHM/2 (see tracks in Fig. 3). We obtain SFR surface densities of 20–200 yr-1 kpc-2, similar to the subset of SMGs with comparable FIR luminosities to our sample (Fig. 1). These results provide evidence that the kpc-scale star formation distribution and surface densities of high- star-forming galaxies are independent of the presence of an X-ray AGN. This implies that the physical mechanisms driving the star formation (see discussion in Simpson et al. 2015 and Ikarashi et al. 2015) are similar in these two populations. We note that our AGN have SFRs of 130–400 M☉ yr-1, stellar masses of (2–20)1010 M☉ and corresponding specific SFRs of 1–20 Gyr-1 (see Mullaney et al. 2015). These values are similar to SMGs of comparable luminosity (e.g., Simpson et al. 2014); however, they may represent the high end of the (s)SFR distribution of X-ray AGN (see Mullaney et al. 2015).
Based on Herschel-160 m imaging, X-ray AGN typically have larger rest-frame FIR sizes than our high- samples, reaching sizes of FWHM5–30 kpc (Mushotzky et al. 2014). However, we caution that these results are based on low-resolution data, leading to some sources with upper limits on the measured sizes. These local AGN have a wide range of SFR surface densities, covering 2.5 dex, with the majority of values being low (i.e., 0.1 M☉ yr-1 kpc-2) compared to our high- X-ray AGN. These local AGN have similar X-ray luminosities to our sample (a proxy for black-hole accretion rate), but typically much lower FIR luminosities (a proxy for SFR; i.e., 109–1011 L☉; Shimizu et al. 2015). Therefore, the star formation sizes and surface densities appear to be insensitive to the presence of an X-ray AGN. Lutz et al. (2015) recently reached a similar conclusion for local galaxies that host optical AGN using Herschel data. In contrast, extreme SFR surface densities are only associated with the most extreme star-forming galaxies (Fig. 3), which may provide evidence for different fuelling mechanisms (e.g., see Daddi et al. 2010). We note that all of these measurements hide information of 1 kpc structures.
Although this study is limited to sources with FIR luminosities of [1–5]1012 L☉, we now have a first-order assessment of the size scale of the star formation that has been measured for high- X-ray AGN by Herschel studies (e.g., Stanley et al 2015). These Herschel studies have shown that the average SFRs appear to be broadly independent of AGN luminosity, which trace instantaneous black-hole accretion rates. These results may not be surprising because the star formation appears to be occurring on scales of a few kpc, orders of magnitude larger than the immediate vicinity of the black hole. Indeed, local studies have shown a tighter correlation between nuclear SFRs, compared to 1 kpc-scale SFRs, and black hole accretion rates (Diamond-Stanic & Rieke 2012). By collating large samples of spatially-resolved ALMA data of high- galaxies, it will be possible to assess the relationship between SFR surface density and AGN activity, providing fundamental insight into feeding and feedback mechanisms governing galaxy and black hole growth.
Acknowledgements
We thank the referee for constructive comments. We acknowledge the Science and Technology Facilities Council (CMH; DMA; DJR; IRS; grant code ST/L00075X/1). IRS and JMS acknowledge the ERC (Dustygal 321334) and IRS acknowledges a RS/Wolfson Award. FS acknowledges a Durham Doctoral Scholarship.
References
- Alexander & Hickox (2012) Alexander D. M., Hickox R. C., 2012, New Astron. Rev., 56, 93
- Azadi et al. (2015) Azadi M. et al., 2015, ApJ, 806, 187
- Banerji et al. (2015) Banerji M. et al., 2015, MNRAS, 454, 419
- Clements et al. (2009) Clements D. L. et al., 2009, ApJL, 698, L188
- Crain et al. (2015) Crain R. A. et al., 2015, MNRAS, 450, 1937
- Daddi et al. (2010) Daddi E. et al., 2010, ApJL, 714, L118
- Delvecchio et al. (2014) Delvecchio I. et al., 2014, MNRAS, 439, 2736
- Diamond-Stanic & Rieke (2012) Diamond-Stanic A. M., Rieke G. H., 2012, ApJ, 746, 168
- Diaz-Santos et al. (2015) Diaz-Santos T. et al., 2015, arXiv:1511.04079
- Guo et al. (2013) Guo Y. et al., 2013, ApJS, 207, 24
- Hickox et al. (2014) Hickox R. C., Mullaney J. R., Alexander D. M., Chen C.-T. J., Civano F. M., Goulding A. D., Hainline K., 2014, ApJ, 782, 9
- Hill & Shanks (2011) Hill M. D., Shanks T., 2011, MNRAS, 410, 762
- Hsu et al. (2014) Hsu L.-T. et al., 2014, ApJ, 796, 60
- Ikarashi et al. (2015) Ikarashi S. et al., 2015, ApJ, 810, 133
- Kennicutt (1998) Kennicutt Jr. R. C., 1998, ARAA, 36, 189
- Lutz (2014) Lutz D., 2014, ARAA, 52, 373
- Lutz et al. (2015) Lutz D. et al., 2015, arXiv:1151.02075
- McMullin et al. (2007) McMullin et al. J. P., 2007, in Astronomical Data Analysis Software and Systems XVI. p. 127
- Miller et al. (2013) Miller N. A. et al., 2013, ApJS, 205, 13
- Mukherjee et al. (1998) Mukherjee S., Feigelson E. D., Jogesh Babu G., Murtagh F., Fraley C., Raftery A., 1998, ApJ, 508, 314
- Mullaney et al. (2015) Mullaney J. R. et al., 2015, MNRAS, 453, L83
- Mullaney et al. (2012) Mullaney J. R. et al., 2012, ApJL, 753, L30
- Mushotzky et al. (2014) Mushotzky R. F., Shimizu T. T., Meléndez M., Koss M., 2014, ApJL, 781, L34
- Netzer et al. (2015) Netzer H., Lani C., Nordon R., Trakhtenbrot B., Lira P., Shemmer O., 2015, arXiv:1511.07876
- Rohlfs & Wilson (1996) Rohlfs K., Wilson T. L., 1996, Tools of Radio Astronomy
- Schwarz (1978) Schwarz G., 1978, Ann. Stat., 6, 461
- Shimizu et al. (2015) Shimizu T. T., Mushotzky R. F., Meléndez M., Koss M., Rosario D. J., 2015, MNRAS, 452, 1841
- Simpson et al. (2015) Simpson J. M. et al., 2015, ApJ, 799, 81
- Simpson et al. (2014) Simpson J. M. et al., 2014, ApJ, 788, 125
- Skelton et al. (2014) Skelton R. E. et al., 2014, ApJS, 214, 24
- Stanley et al (2015) Stanley et al F., 2015, MNRAS, 453, 591
- Szokoly et al. (2004) Szokoly G. P. et al., 2004, ApJS, 155, 271
- Tacconi et al. (2006) Tacconi L. J. et al., 2006, ApJ, 640, 228
- Ueda et al. (2008) Ueda Y. et al., 2008, ApJS, 179, 124
- Volonteri et al. (2015) Volonteri M., Capelo P. R., Netzer H., Bellovary J., Dotti M., Governato F., 2015, MNRAS, 452, L6
- Wang et al. (2013) Wang S. X. et al., 2013, ApJ, 778, 179
- Xue et al. (2011) Xue Y. Q. et al., 2011, ApJS, 195, 10