iint \restoresymbolTXFiint
Shock-powered radio emission from V5589 Sagittarii (Nova Sgr 2012 #1)
Abstract
Since the Fermi discovery of -rays from novae, one of the biggest questions in the field has been how novae generate such high-energy emission. Shocks must be a fundamental ingredient. Six months of radio observations of the 2012 nova V5589 Sgr with the VLA and 15 weeks of X-ray observations with Swift/XRT show that the radio emission consisted of: 1) a shock-powered, non-thermal flare; and 2) weak thermal emission from M⊙ of freely expanding, photoionized ejecta. Absorption features in the optical spectrum and the peak optical brightness suggest that V5589 Sgr lies 4 kpc away (3.2-4.6 kpc). The shock-powered flare dominated the radio light curve at low frequencies before day 100. The spectral evolution of the radio flare, its high radio brightness temperature, the presence of unusually hard ( keV) X-rays, and the ratio of radio to X-ray flux near radio maximum all support the conclusions that the flare was shock-powered and non-thermal. Unlike most other novae with strong shock-powered radio emission, V5589 Sgr is not embedded in the wind of a red-giant companion. Based on the similar inclinations and optical line profiles of V5589 Sgr and V959 Mon, we propose that shocks in V5589 Sgr formed from collisions between a slow flow with an equatorial density enhancement and a subsequent faster flow. We speculate that the relatively high speed and low mass of the ejecta led to the unusual radio emission from V5589 Sgr, and perhaps also to the non-detection of -rays.
keywords:
novae, cataclysmic variables – binaries: general – stars: variables: general – stars: winds, outflows – radio continuum: stars – X-rays: stars1 Introduction
| Observation Date | MJD | Daya | Epoch | Program ID | Configuration | Observed Bands | Timeb(min) |
|---|---|---|---|---|---|---|---|
| 2012 Apr 23.4 | 56040.4 | 2.4 | 1 | 11B-170 | C | Ka | 23.9 |
| 2012 May 22.0 | 56069.0 | 31.0 | A | 2012A-S016 | SMA (compact) | 225 GHz | 60 |
| 2012 Jun 6.2 | 56084.4 | 46.4 | 2 | 12A-479 | B | C | 12.0 |
| 2012 Jun 14.2 | 56092.2 | 54.2 | 3 | 12A-479 | B | Ka Ku X | 19.5 |
| 2012 Jun 22.3 | 56100.3 | 62.3 | 4 | 12A-479 | B | X C S | 30.4 |
| 2012 Jul 8.9 | 56117.9 | 79.9 | B | 2012A-S016 | SMA (compact) | 225 GHz | 208 |
| 2012 Jul 11.1 | 56119.1 | 81.1 | 5 | 12A-479 | B | C L | 32.4 |
| 2012 Jul 20.3 | 56128.3 | 90.3 | 6 | 12A-479 | B | Ka Ku X | 19.1 |
| 2012 Aug 9.0 | 56148.0 | 110.0 | 7 | 12A-479 | B | X C L | 30.4 |
| 2012 Aug 11.2 | 56150.2 | 112.2 | 8a | 12A-479 | B | Ka Ku X | 19.1 |
| 2012 Aug 12.3 | 56151.3 | 113.3 | 8b | 12A-479 | B | X C L | 29.9 |
| 2012 Aug 28.0 | 56167.0 | 129.0 | 9a | S4322* | B | C L | 17.7 |
| 2012 Aug 28.0 | 56167.0 | 129.0 | 9b | 12A-479 | B | X C L | 30.4 |
| 2012 Aug 28.1 | 56167.1 | 129.2 | 9c | 12A-483 | B | C L | 19.9 |
| 2012 Sep 4.2 | 56174.2 | 137.7 | 10 | 12A-483 | B | Ka Ku X | 19.1 |
| 2012 Sep 7.9 | 56178.0 | 140.0 | 11 | S4322* | BnA | C L | 17.7 |
| 2012 Oct 31.0 | 56231.0 | 193.0 | 12 | 12A-479 | A | Ka Ku X | 19.1 |
| 2012 Dec 9.8 | 56270.8 | 232.8 | 13 | 12A-479 | A | X C L | 30.4 |
| 2012 Dec 23.6 | 56284.6 | 246.6 | 14 | 12A-479 | A | Ka Ku X | 19.5 |
| 2013 Jan 5.7 | 56297.7 | 259.8 | 15 | 12A-479 | A | X C L | 30.4 |
| 2013 Feb 24.7 | 56347.7 | 309.7 | 16 | 13A-461 | D | X C L | 29.9 |
| 2013 Mar 7.6 | 56358.6 | 320.6 | 17a | 13A-461 | D | Ka Ku X | 19.5 |
| 2013 Mar 8.6 | 56359.6 | 321.6 | 17b | 13A-461 | D | Ka Ku X | 19.1 |
| 2013 May 29.4 | 56441.4 | 403.4 | 18a | 13A-461 | DnC-C | X C L | 29.9 |
| 2013 Jun 3.2 | 56446.2 | 408.2 | 18b | 13A-461 | DnC-C | Ka Ku X | 19.1 |
| 2013 Aug 22.2 | 56526.2 | 488.2 | 19 | 13A-461 | C | X C L | 30.4 |
| 2013 Aug 26.2 | 56530.2 | 492.2 | 20 | 13A-461 | C | Ka Ku X | 19.1 |
a Days after 2012 April 21.0 = MJD 56038.0
b Total time on source for all bands.
*P.I. C. C. Cheung.
Since the discovery of -rays from novae by the Fermi Gamma-ray Space Telescope (Fermi) in 2010 (Cheung et al., 2010; Abdo et al., 2010), the production of early, high-energy shocks in the ejecta of novae has become an increasingly important topic in the field of nova studies. These shocks can be caused by collisions with pre-existing circumstellar material (eg., V407 Cyg, V745 Sco, and RS Oph; Bode et al., 2006; Das et al., 2006; Sokoloski et al., 2006; Abdo et al., 2010; Munari et al., 2011; Chomiuk et al., 2012; Nelson et al., 2012; Banerjee et al., 2014; Orio et al., 2015), or interactions between multiple flows from the same eruption (eg., V959 Mon, T Pyx, V382 Vel; Mukai & Ishida, 2001; Chomiuk et al., 2014; Nelson et al., 2014; Chomiuk et al., 2014). Radio monitoring of novae, especially when combined with observations at other frequencies, provides a powerful tool for understanding the evolution of nova eruptions and examining shocks within the ejecta. High radio brightness temperatures can reveal either non-thermal emission or shock-heated plasma, as in the case of V1723 Aql (Krauss et al., 2011; Weston et al., 2014; Weston et al., 2016). Spatially resolved images of radio synchrotron emission in several novae have been used to trace the location of relativistic particles that have been accelerated in shocks (eg., RS Oph, V959 Mon; O’Brien et al., 2006; Sokoloski et al., 2008; Rupen et al., 2008; Chomiuk et al., 2014). We show in this paper that the 2012 nova V5589 Sgr is one of the most extreme cases known of a nova that is not embedded in the wind of a red-giant companion having shock-powered radio emission.
V5589 Sgr (Nova Sgr 2012, PNV J17452791-2305213) was discovered to be in outburst on 2012 April 21.0 (MJD 56038.0; all calendar dates are UT) by Korotkiy et al. (2012). For the rest of the paper, we take the peak of the optical light curve to be MJD 56039.45 (which is roughly consistent with the peak in HI1-B light curve from the Solar Terrestrial Relations Observatory, Korotkiy et al. 2012; Thompson 2012; Eyres, in preparation), and using data from the Stony Brook / Small & Moderate Aperture Research Telescope System (SMARTS) Atlas of (mostly) Southern Novae 111http://www.astro.sunysb.edu/fwalter/SMARTS/NovaAtlas/ (Walter et al., 2012) and the American Association of Variable Star Observers (AAVSO), the time for the optical light to decrease by two magnitudes was days, and the time to decrease by three magnitude was days. We take the start of the eruption, , to be 2012 April 21.0 (MJD 56038.0), near the beginning of the optical brightening.
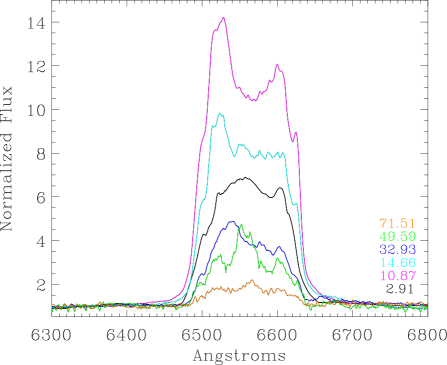
V5589 Sgr was classified as a fast ‘hybrid’ nova, with Fe II emission on day 3 and He/N features by day 8 (Esipov et al., 2012; Walter et al., 2012; Williams, 2012). The rapidly evolving, complex profiles of the emission lines in the optical spectra from SMARTS reveal that the ejecta were most likely aspherical and that they consisted of multiple flows. The half width at zero intensity (HWZI) of the dominant component in the H and H emission lines from the SMARTS spectra (Walter et al., 2012) during the first few days of the eruption was (see Figure 1). We refer to the outflow that generated this emission component as the fast flow.
Mróz et al. (2015) determined an orbital period of P = 1.59230(5) days using data from the OGLE survey, and suggest that the system likely contains a subgiant secondary and a massive white dwarf. This is a relatively unusual part of nova-progenitor parameter space, with only a few such systems known (Darnley et al., 2012). Mróz et al. (2015) additionally observed eclipses in the quiescent optical light curve, indicating that the inclination is close to 90∘ (Mróz et al., 2015). The early line profiles of V5589 Sgr have some similarities to the recurrent nova U Sco – another eclipsing system which has a period of 1.2 days, and may contain an early K subgiant secondary (see, e.g., Anupama et al., 2013).
On MJD 56038.9, Sokolovsky et al. (2012) spent 1500 s on source with Swift / X-ray Telescope (XRT), finding no detectable X-rays and placing an upper limit on the 0.3-10 keV flux of 0.02 XRT counts per second222Their ATel actually quoted an upper limit of “” 0.02 XRT counts per second, but we assume that the “” sign was a typo.; in UV, they found the source to have a magnitude of . V5589 Sgr is not a known /LAT -ray source: it is not in the 3FGL catalogue (Acero et al., 2015), nor was it detected as a transient in a blind search (Cheung, 2013).
In this paper, we describe how radio observations with the Karl G. Jansky Very Large Array (VLA), X-ray observations with /XRT, and optical spectra from SMARTS and the Tillinghast Reflector Echelle Spectrograph (TRES) at the Fred L. Whipple Observatory suggest that the radio emission from V5589 Sgr consisted of two components: weak thermal emission from a rapidly expanding photoionized plasma, and a strong non-thermal, shock-driven flare. We describe the observations in § 2 and our results, along with a determination of the distance, in § 3. In § 4, we describe the evidence that the radio flare was due to non-thermal emission from particles accelerated in shocks, and discuss the relationship between V5589 Sgr and -ray bright novae such as V959 Mon. Finally, in § 5 we summerise our conclusions.
2 Observations
| Observation date | MJD | Day | Obs ID | Count rate | kT † | kT error | kT error | EM†† | EM error | EM error | N(H)† | N(H) error | N(H) error |
| (counts per s) | (keV) | (-) | (+) | (cm-3) | (-) | (+) | (cm-2) | (-) | (+) | ||||
| 2012 Apr 21.9 | 56038.91 | 0.91 | 00032442001 | 0.01 | … | … | … | … | … | … | … | … | … |
| 2012 Apr 25.7 | 56042.67 | 4.7 | 00032443001 | 0.0021 | … | … | … | … | … | … | … | … | … |
| 2012 Apr 26.1 | 56043.13 | 5.1 | 00032443002 | 0.0078 | … | … | … | … | … | … | … | … | … |
| 2012 May 10.5 | 56057.50 | 19.5 | 0032443003 | 0.045 0.003 | 32.7 | … | … | 3.62 | -3.62 | +5.43 | 0.43 | -0.30 | 0.60 |
| 2012 May 17.7 | 56064.66 | 26.7 | 00032442002 | 0.083 0.010 | 5.2 | … | … | 5.43 | -1.27 | +1.99 | 0.68 | … | … |
| 2012 May 25.6 | 56072.60 | 34.6 | 00032442004 | 0.091 0.011 | 3.5 | … | … | 6.15 | -2.71 | +1.63 | 0.52 | -0.09 | 1.04 |
| 2012 May 28.6 | 56075.55 | 37.6 | 00032442005 | 0.055 0.008 | 3.1 | … | … | 2.53 | -7.23 | +7.23 | 0.18 | … | … |
| 2012 May 31.6 | 56078.62 | 40.6 | 00032442006 | 0.074 0.009 | 4.3 | -1.9 | +11.0 | 4.16 | -1.63 | +1.27 | 0.32 | -0.06 | 0.67 |
| 2012 Jun 6.9 | 56084.91 | 46.9 | 00032442007 | 0.077 0.015 | 1.9 | -0.9 | +9.2 | 3.26 | -1.63 | +1.09 | 1.19 | … | … |
| 2012 Jun 10.1 | 56088.10 | 50.1 | 00032442008/9 | 0.038 0.003 | 1.3 | -0.1 | +0.1 | 2.53 | -5.43 | +5.43 | 0.36 | -0.23 | 0.55 |
| 2012 Jun 12.8 | 56090.84 | 52.8 | 00032442010 | 0.061 0.008 | 3.5 | -1.4 | +4.4 | 2.53 | -7.23 | +3.63 | 9.5 | -0.009 | 0.22 |
| 2012 Jun 23.5 | 56102.49 | 64.5 | 00032442011 | 0.061 0.010 | 0.14 | -0.05 | +0.14 | … | … | 0.51 | -0.31 | 0.75 | |
| 2012 Jun 28.3 | 56106.34 | 68.3 | 00032442012 | 0.071 0.009 | 1.37 | -0.38 | 1.45 | -9.04 | +7.23 | 0.42 | -0.39 | 0.64 | |
| 2012 Jul 8.1 | 56116.10 | 78.1 | 00032442013 | 0.043 0.008 | too few counts for spectroscopy | … | … | … | … | … | |||
| 2012 Jul 10.8 | 56118.84 | 80.8 | 00032442014 | 0.065 0.010 | too few counts for spectroscopy | … | … | … | … | … | |||
| 2012 Jul 14.8 | 56122.80 | 84.8 | 00032442015 | 0.034 0.013 | too few counts for spectroscopy | … | … | … | … | … | |||
| 2012 Aug 7.3 | 56146.25 | 108.3 | 00032442017 | 0.011 | … | … | … | … | … | … | … | … | … |
†Values of kT and the column density, N(H), are from model fits using the tbabs*apec model in Xspec.
††We used a distance of 4 kpc in calculations of the emission measure, EM.
The VLA observed V5589 Sgr beginning three days after initial discovery through the 16 months following with the WIDAR correlator at frequencies between 1 and 37 GHz. The observations used 8-bit samplers with band widths of 2048 MHz in two tunable 1048 MHz sub-bands at all frequencies except L-band, which had a bandwidth of 1024 MHz split into two sub-bands. VLA observations of V5589 Sgr were alternated with a nearby phase reference calibrator (J1751-2524 or J1755-2232). Each observation additionally included the observation of a standard flux calibrator (3C 48 or 3C 286). VLA observations were reduced either using Astronomical Image Processing System (AIPS) and following the standard procedures, or with the Common Astronomical Processing System (CASA) v4.2.2 (McMullin et al., 2007), using the VLA calibration pipeline v1.3.1. For imaging, we used the CLEAN algorithm (Högbom, 1974) with Briggs robust weighting of 0.5. Based on the distance and size of the source, as well as the timing of our observations, we did not expect to resolve the ejecta from V5589 Sgr, and this proved to be the case. For all detections, we determined flux densities by fitting the source with a gaussian using the imfit task in CASA or the JMFIT task in AIPS. For non-detections, we either used our usual imaging routines to determine the RMS and flux density at the target location, or we used difmap (Shepherd, 1997) to find the flux density at the target location and the off-source RMS. We estimated uncertainties in flux density by adding the error from the gaussian fits in quadrature with estimated systematic errors of 5 per cent below 19 GHz and 10 per cent above, with 1 error bars from error propagation thereafter. For all non-detections we quote upper limits as 2RMS. Table 1 lists the VLA observations. To determine the spectral index (where and is the flux density at frequency ) of the emission at each epoch, we used IDL’s linfit function to fit the data with a power-law model in log space.
Additionally, we obtained two observations at 225 GHz on the Submillimeter Array (SMA) under program 2012A-S016. Observations with the SMA were both obtained in compact configuration, with 60 minutes and 21 baselines on MJD 56069.0 (day 31.0) and 208 minutes and 15 baselines on MJD 56117.9 (day 79.9). These data were reduced using standard routines in IDL and Miriad.
We also monitored the V5589 Sgr outburst using the XRT instrument onboard the Swift satellite, which resulted in a series of 17 observations carried out over 15 weeks. An additional follow-up observation was obtained on 2014 April 21. All observations were carried out in the XRT’s photon counting (PC) mode, and had durations ranging from 300 to 6300 s (see Table 2). We extracted spectra following the usual reduction prescription for XRT data – counts were extracted from a circular region with a radius of 5″centred on the source using Select v.2.4c. Background counts were extracted from a larger circular region (radius 155″) away from the source. Ancillary response files were produced using the xrtmkarf tool, correcting for the profile of the psf. Finally, we used the latest response matrix file from the Swift calibration database (swxpc0to12s6_20110101v014. rmf). In observations where V5589 Sgr was not detected, we utilised the Bayesian method outlined in Kraft et al. (1991) to calculate upper limits on the count rate.
We obtained optical spectra of V5589 Sgr using the Tillinghast Reflector Echelle Spectrograph (TRES) on the 60-inch reflector at the Fred L. Whipple Observatory on MJD 56046.0 (day 8) and MJD 56057.0 (day 19). We reduced the data using the standard reduction procedure (Mink, 2011).
3 Results
| Day | Observed flux density (mJy) | |||||||||
| 1.4 GHz | 1.8 GHz | 4.7 GHz | 7.6 GHz | 8.5 GHz | 11.4 GHz | 13.3 GHz | 17.5 GHz | 27.5 GHz | 36.5 GHz | |
| (L band) | (L band) | (C band) | (C band) | (X band) | (X band) | (Ku band) | (Ku band) | (Ka band) | (Ka band) | |
| 2.4 | … | … | … | … | … | … | … | … | … | 0.05a |
| 46.4 | … | … | 1.09 0.06b | 1.38 0.07c | … | … | … | … | … | … |
| 54.2 | … | … | … | … | … | … | 3.520.18 | 3.980.20 | 5.730.58 | 5.960.61 |
| 62.3 | 3.090.16d | 3.200.16 e | 3.420.17 b | 3.630.18c | 3.680.19 | 3.780.20 | … | … | … | … |
| 81.1 | 1.680.15 | 1.390.10 | 1.910.10 | 1.920.10 | … | … | … | … | … | … |
| 90.3 | … | … | … | … | … | … | … | 1.370.11 | 1.440.20 | 1.140.22 |
| 110.0 | 0.340.07 | 0.560.08 | 0.520.04 | 0.53 0.04 | 0.560.04 | 0.570.07 | … | … | … | … |
| 112.2 | … | … | … | … | … | … | 0.500.05 | 0.380.05 | 0.470.09 | 0.390.09 |
| 113.3 | 0.18 | 0.500.09 | 0.500.04 | 0.470.03 | 0.440.03 | 0.420.04 | … | … | … | … |
| 129.0 | 0.240.05 | 0.430.05 | … | … | … | … | … | … | … | … |
| 129.0 | 0.15 | … | 0.350.03 | 0.290.02 | 0.290.02 | 0.370.04 | … | … | … | … |
| 129.2 | 0.17 | 0.350.09 | 0.280.04 | 0.290.03 | … | … | … | … | … | … |
| 136.2 | … | … | … | … | … | … | 0.190.02 | 0.110.03 | 0.110.03 | 0.370.14 |
| 140.0 | 0.230.05 | 0.200.04 | … | … | … | … | … | … | … | … |
| 193.0 | … | … | … | … | … | … | 0.05 | 0.05 | 0.09 | 0.10 |
| 232.8 | 0.17 | 0.17 | 0.04 | 0.03 | 0.04 | 0.06 | … | … | … | … |
| 248.1 | … | … | … | … | … | … | 0.04 | 0.05 | 0.10 | 0.14 |
| 259.7 | 0.20 | 0.14 | 0.07 | 0.05 | 0.04 | 0.05 | … | … | … | … |
| 309.7 | 1.01 | 0.74 | 0.23 | 0.32 | 0.40 | 0.60 | … | … | … | … |
| 320.5 | … | … | … | … | … | … | 0.05 | 0.05 | 0.10 | 0.12 |
| 321.6 | … | … | … | … | … | … | 0.05 | 0.06 | 0.13 | 0.17 |
| 403.4 | 0.79 | 0.65 | 0.07 | 0.04 | 0.04 | 0.04 | … | … | … | … |
| 408.2 | … | … | … | … | … | … | 0.05 | 0.06 | 0.15 | 0.19 |
| 488.2 | 0.55 | 0.34 | 0.06 | 0.04 | 0.04 | 0.05 | … | … | … | … |
| 492.2 | … | … | … | … | … | … | 0.06 | 0.11 | 0.02 | 0.22 |
a Observed at 33 GHz on this date
b Observed at 5.0 GHz on this date
c Observed at 6.8 GHz on this date
d Observed at 2.5 GHz (S-band) on this date
e Observed at 3.5 GHz (S-band) on this date
3.1 Optical emission and estimate of distance
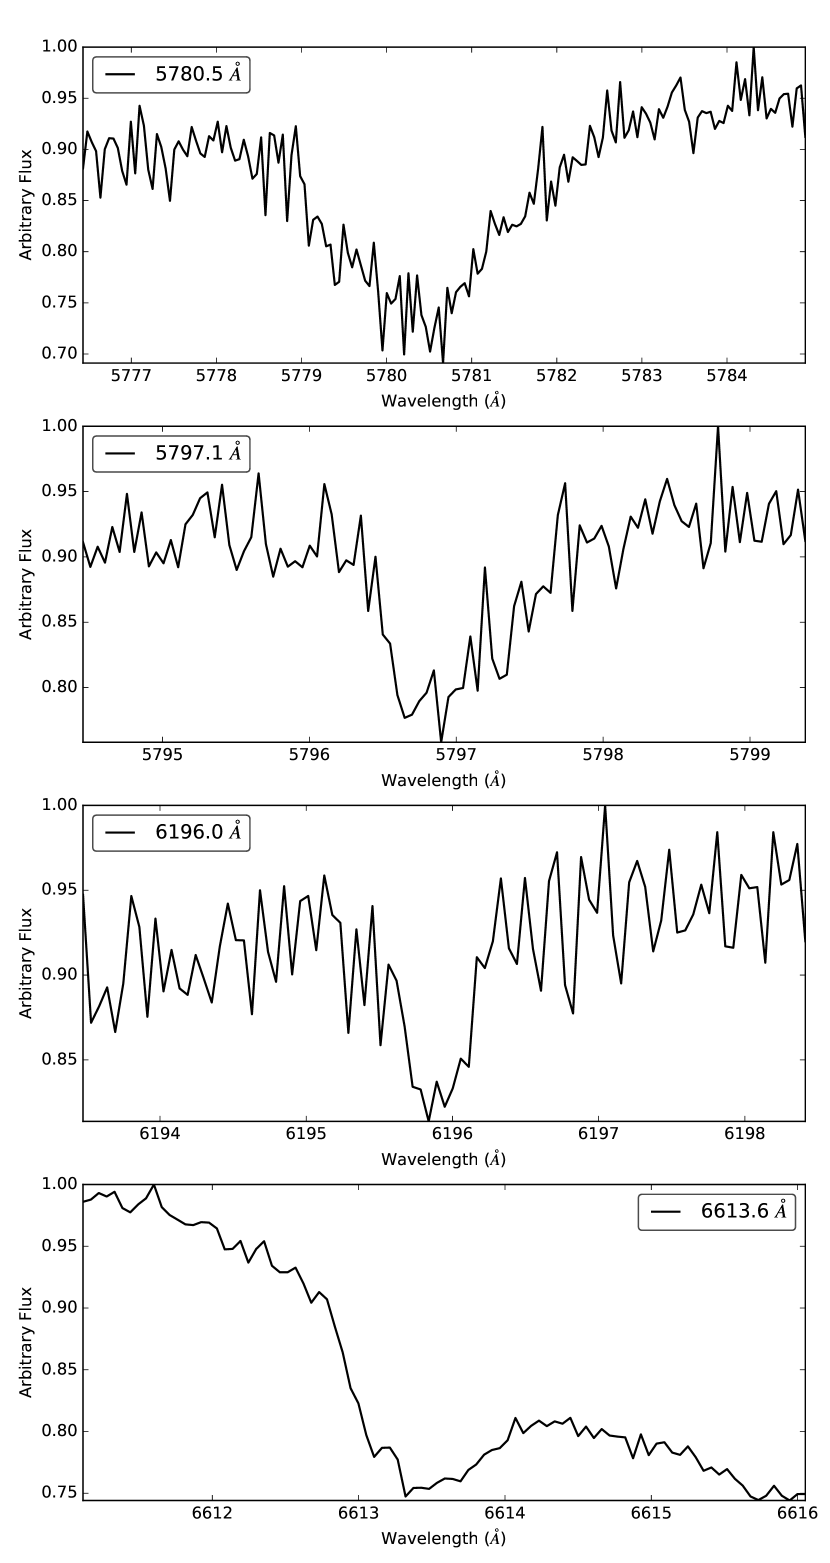

To obtain a first estimate of the distance to V5589 Sgr, we used optical spectroscopy guided by the typical peak optical brightness of novae. From the TRES spectra, we derived a reddening value by measuring the equivalent width of diffuse interstellar band (DIB) features and using the calibration technique of Friedman et al. (2011), a method which is independent of any assumptions about the properties of the nova. Using four DIB features (5780 Å, 5796 Å, 6195 Å, and 6613 Å, see Figure 2), we obtained a reddening of (see Finzell et al., 2015, for details of this technique; we were unable to use the Na I D lines at and due to saturation, or the K I line at 7698.9 Å, which fell into a chip gap in the CCD). This reddening value, in conjunction with the 3D reddening map of Green et al. (2015), suggests a distance of 3.6 kpc. However, taking into account the uncertainties on the reddening of V5589 Sgr and in the reddening map, the most likely distance modulus is 12.9 1.4. This value corresponds to a distance of kpc.
The peak optical brightness of V5589 Sgr is consistent with a distance of around 4 kpc. The distance and the extinction, , are strongly coupled. Taking the peak apparent V magnitude to be 8.8 (Korotkiy et al., 2012), extinction given by , and therefore peak absolute magnitude of , we find as a function of distance modulus (see Figure 3). Despite a limiting magnitude of , the faintest nova in the Cao et al. (2012) Palomar Transient factory list of M31 novae had an of , with the vast majority between and . Therefore, even if we assume that V5589 Sgr was a relatively faint nova with , we can eliminate the lowest part of the distance modulus range that is formally allowed by the 3D reddening map. Taking the distance constraints from both reddening and peak optical brightness into consideration, it is unlikely that V5589 Sgr is closer than 3.2 kpc (a distance modulus of 12.5), at which . We therefore take the distance of the source to be approximately 4 kpc (or within the range 3.2 to 4.6 kpc).
3.2 Radio emission
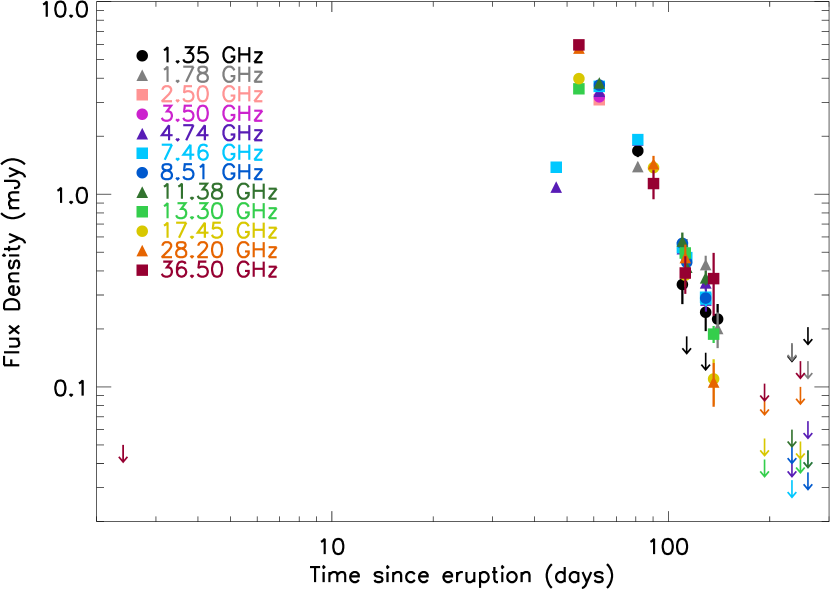
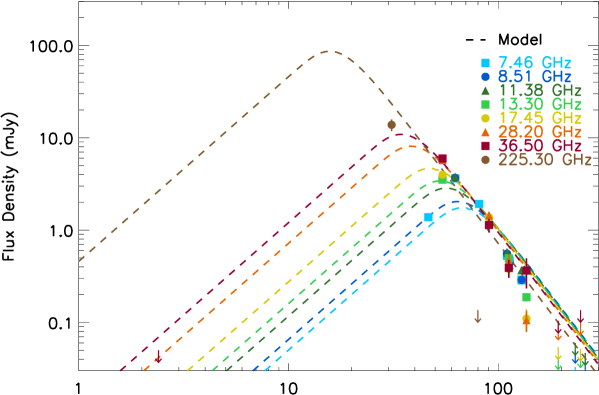
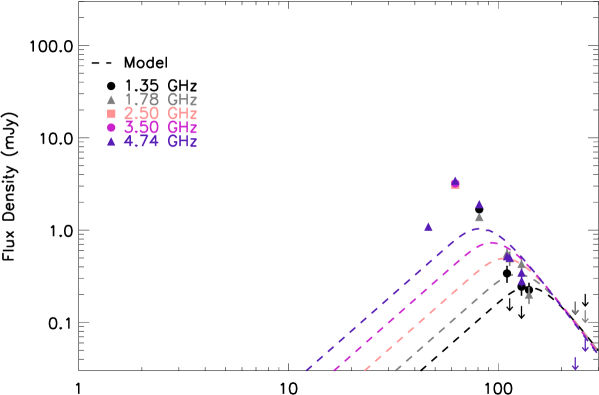
A month after an early radio non-detection on day 2.4, V5589 Sgr brightened exceptionally quickly at low frequencies to a peak approximately 2 months after the start of the eruption (see Figure 4). Although we were not able to obtain low-frequency (L and C-band) observations between days 2.4 and 46.2, the flux rose as at 5.0 GHz and as at 6.8 GHz between days 46.4 and 62.3 (where t is the time from , again using MJD 56038.0 as ). The speed of the low-frequency radio brightening is noteworthy because the strength of thermal emission from a source with constant temperature is proportional to the size of the source on the sky; for a freely expanding source, the size cannot increase faster than . The VLA did not obtain observations at high frequencies during the rapid, low-frequency brightening. The flux densities reached global maxima in Ku-band (13.3/17.5 GHz) and Ka-band (27.5/36.6 GHz) on day 54.2. L-band (1.2/1.8 GHz), C-band (4.7/7.6 GHz), and X-band (8.5/11.2 GHz) experienced their peak flux densities on day 62.3. Observations with the SMA at 225 GHz revealed a flux density of 13.802.43 mJy on day 31.0 and an upper limit of 0.14 mJy on day 79.9. After these epochs, the flux densities fell monotonically at all frequencies (see Figure 4 and Table 3). The flux fell as at 1.2 GHz between days 62.3 and 140.0 and as at 36.5 GHz between days 54.2 and 136.2. After day 140.0, all observations resulted in non-detections.
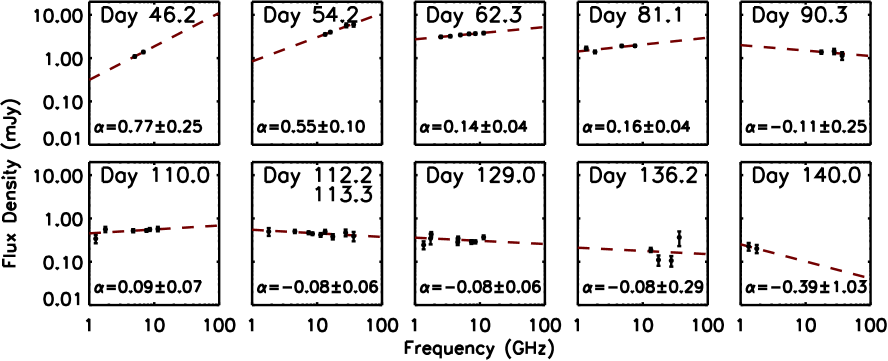
Because the low-frequency emission strengthened so quickly, the radio spectrum flattened as the source brightened (see Figure 5). The radio spectrum initially rose towards high frequencies with a spectral index of between 5.0 and 6.8 GHz on day 46.2. On day 54.2, the spectrum had flattened to between 13.0 and 36.5 GHz. And by day 62.3, it had flattened further to between 2.5 and 11.4 GHz. Thereafter, it remained roughly flat or falling with frequency for all subsequent observations (see Figure 5). A freely expanding isothermal remnant (as in the so-called Hubble-flow model) is expected to remain completely optically thick during the initial period of radio brightening, producing the characteristic steeply rising spectrum of a blackbody in the Rayleigh-Jeans limit (e.g., Seaquist & Palimaka, 1977; Hjellming et al., 1979; Bode & Evans, 2008). Indeed, radio emission from novae during the early stages of expansion of the remnant often has a spectral index (e.g., 1.5 at low frequencies for V705 Cas, 1.6 for V339 Del; Eyres et al., 2000; Chomiuk et al., 2013). The spectral index of emission from such a freely expanding, thermal remnant then flattens – first at the highest and then at lower frequencies – to as the ejecta become optically thin (Bode & Evans, 2008). The flattening of the radio spectrum from V5589 Sgr as the radio flux rose is thus one of the first hints that the radio emission was not all thermal.
Moreover, the VLA observations uncovered possible signs of linear polarization, as would be expected from non-thermal, synchrotron emission. While we did not observe a polarization calibrator during the peak of the flux density, there was a standard VLA polarization TPOL observation several days prior to our observation at similar, though not identical, frequencies in Ku-band. Using this dataset and our observation of 3C286, we were able to perform rough polarization calibrations for Ku and Ka-bands, albeit with large margins of uncertainty. On day 54.2, we found upper limits to polarization in Ka-band of 0.116 mJy ( per cent) at 27.5 GHz, and 0.122 mJy ( per cent) at 36.5 GHz. In Ku-band, we found a possible 0.2 mJy (5 per cent) of linearly polarized flux. While this detection is of a similar order to our uncertainty at Ku-band if we include our systematic error factor, it could hint at the presence of synchrotron emission.
To investigate the surprising radio spectral evolution and fast rise, we
tested whether any of the radio emission could be described by a
‘Hubble-flow’ type
ejection (see, e.g., Seaquist &
Palimaka, 1977; Hjellming et al., 1979; Weston et al., 2016)
with velocity proportional to the distance from the source, , between
vmin and vHWZI and a density profile.
We take any Hubble-flow to have begun around .
Although a linear extrapolation of the optical light curve backward in
time suggests that the thermonuclear runaway could have occurred a day
or two before our chosen , the VLA observations support a start
of the fast, 4,000 km s-1 flow on or after ;
if the fast flow started before and remained very optically
thick at all radio frequencies for at least a few days, the flux
density at 33 GHz would have been
| (1) |
where is the temperature of the ejecta. The first VLA observation, however, produced a non-detection at 33 GHz, with a 3 upper limit of 0.08 mJy on day 2.4 (MJD 56040.4), suggesting that the fast flow did not start before . Because the 4,000 km s-1 flow was clearly evident in optical spectra on day 2.0 (Buil, 2012) and day 2.4 (Walter et al., 2012), it must therefore have started between (day 0) and day 2.
Moving forward with the test of the Hubble-flow model, we fit the data at all frequencies simultaneously to minimize the value, weighted by total measurement and systematic errors. To obtain our fit, we fixed the distance to 4 kpc, the maximum ejecta velocity to km s-1, and the ejection time to MJD, allowing the temperature , the mass ejected Mej, and the ratio between minimum and maximum velocity, , to vary. The best-fit parameters for these values were K, M M⊙, and . The fit appears roughly consistent with the data during the decline portion of the radio light curve, after approximately day 100 (see Figure 6, top panel). At the lowest frequencies, however, the data deviate strongly from the model (see Figure 6, middle panel), with observed flux density an order of magnitude greater than the model around the radio peak. The of 387 indicates that the overall fit is unacceptable. We refer to the emission that dominated at low frequencies before day 100, and that deviated strongly from the Hubble-flow expectations, as the radio flare. Both the radio flare and the radio emission from the photoionized flow peaked around day 60.
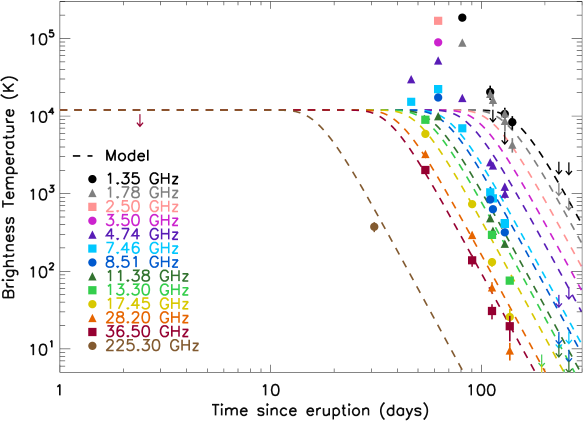
A comparison among the brightness temperatures for the Hubble-flow model and for our observations reveals the character of the deviation from the Hubble-flow model. At radio frequencies, the brightness temperature of an expanding shell is:
| (2) |
where D is the distance to the source, is the speed of light, is Boltzmann’s constant, and is the velocity of the ejecta (e.g., Bode & Evans, 2008). This approximation assumes a spherical geometry for the nova shell; however, it remains a useful measure even for non-spherical geometries (see discussion in section 4.2). Brightness temperature acts as a measure of surface brightness, giving a lower limit to the physical temperature of thermally emitting material. For freely expanding spherical ejecta with K, would remain at the physical temperature of the ejecta while they were optical thick, and then drop as the ejecta became optically thin (as shown by the dashed lines in Figure 6 bottom panel). In contrast to expectations for freely expanding ejecta with a constant temperature, the brightness temperature rose dramatically to a peak above K at low frequencies 60 to 80 days after the start of the eruption (see Figure 6 bottom panel). At high frequencies and after about day 100, the Hubble-flow model appears consistent the data.
3.3 X-ray emission
The X-ray spectra obtained through day 53 are reasonably well described by an absorbed thermal plasma model (tbabs*apec in Xspec), with a temperature that decreased over time. To determine parameters associated with the X-ray emission, we modelled each spectrum in Xspec v.12.8.2, obtaining only limits on parameters for many of the observations due to the small number of detected counts. We fixed the elemental abundances of the plasma to the solar values of Wilms et al. (2000), which is likely an over-simplification, as most novae are observed to have highly non-solar abundances. The absorbing column constraints in all observations are consistent with absorption due to the interstellar medium only – we find no evidence of the highly absorbed X-ray emission found in other novae at early times (e.g., V382 Vel; Mukai & Ishida, 2001). Based on the fits to the longer observations on days 19 and 49/50, we see clear evidence for a large drop in the plasma temperature, from 33 keV to keV.
Starting with the day 64.5 spectrum, we find a rise in counts at energies lower than 1.0 keV, consistent with the appearance of a supersoft source at that time. Fits to these spectra with a single absorbed-thermal plasma are poor, and also result in much larger values of N(H) than observed in earlier spectra. It is likely that this rise in soft flux is due to the emergence of the supersoft emission from the still-burning white dwarf photosphere. Adding a blackbody component to the model does improve the fit, but the low number of counts mean that the parameters are unconstrained in most of the observations. In the observation on day 68, sufficient counts were obtained to result in a constrained model fit, with best fitting blackbody temperature of 50 (+36,-18) eV. The normalization of the blackbody (0.0065 +0.06, -0.004) implies a luminosity in the range 3 x 1035 to 1037 erg s-1, typical of emission-line dominated supersoft sources (Ness et al., 2013). Given our estimate of the ejecta mass from fits to the thermal component of the radio emission, and the velocity of the ejecta (from optical line profiles), it is reasonable that the ejecta became diffuse enough to reveal the supersoft X-ray emission from the surface of the WD at around day 60.
4 Discussion and Interpretation
4.1 Evidence for non-thermal emission
The strongest radio emission from V5589 Sgr at low frequencies – which we term the radio flare – does not appear to have been produced by unshocked, isothermal ejecta. The properties of the radio-flare emission deviate strongly from the Hubble-flow model, which was proposed to reproduce the behaviour of unshocked ejecta (Seaquist & Palimaka, 1977; Hjellming et al., 1979). In addition, the maximum for V5589 Sgr, which occurred during the radio flare, was higher than expected for a photoionized outflow (Cunningham et al., 2015). For the high radio flux densities at low frequencies on days 62 and 81 (MJD 56100.3 and 56119.1) to have been thermal, the emitting material would have required an electron temperature well in excess of the brightness temperature K (as measured at 2.5 GHz on day 62 and at 1.35 GHz on day 81). Ejecta with K could in principle have produced the emission if the ejecta were optically thick (such that the radio photosphere closely traced the outermost edge of the ejecta) at low frequencies. However, the very flat radio spectra – on day 62.3 and on day 81.1 – are inconsistent with optically thick thermal emission. Therefore, if the radio-flare emission was thermal, the emitting material most likely had a physical temperature significantly greater than K. Unshocked ejecta, however, are typically observed to have K (Seaquist & Palimaka, 1977; Hjellming et al., 1979; Nelson et al., 2014; Weston et al., 2016). Moreover, Cunningham et al. (2015) argued on theoretical grounds that photoionziation heating of ejecta by the residual burning of nuclear fuel in a shell on the surface of the WD leads to temperatures of at most a few times K, even for photoionization by hot, luminous high-mass WDs (T. Cunningham, private communication; see also Table 2 of Cunningham et al., 2015). Given that the temperature of any thermally emitting material would have had to have been at least order of magnitude greater than expected for photoionized ejecta (for a distance of 4 kpc), we conclude that photoionized flows were insufficient to generate the radio flare.
The strength, spectrum, and rapid rise of the radio flare from V5589 Sgr instead imply that it was produced by shocks. Shocks can both heat ejecta to temperatures of around K and accelerate particles that subsequently produce synchrotron emission, as in the -ray bright classical nova V959 Mon (Chomiuk et al., 2014), the early radio flare from classical-nova V1723 Aql (Weston et al., 2016), and as is well established in supernovae (e.g., Chevalier, 1982; Weiler et al., 2002; Chandra et al., 2015). In V5589 Sgr, the X-ray emission from plasma with K that /XRT detected between days 19 and 68 (see Table 2) confirms that colliding flows generated shocks in V5589 Sgr.
Comparing the radio and X-ray fluxes approximately two months after the start of the outburst, however, shows that shocks probably did not heat enough material to explain the radio flare as bremsstrahlung from hot gas. In particular, the emission measure of the X-ray emitting gas (, where is the electron density and is the emitting volume) was several orders of magnitude too small for the hot ( K) plasma to have produced the observed radio emission between day 60 and day 80, independent of distance. Although on day 65 was quite uncertain due to the short duration of the /XRT observation on that day, it had remained approximately constant between day 19 and day 53 at a few times cm-3. Given the continuous expansion of the remnant, and presumed subsequent gradual decrease in density of shocked material, is unlikely to have suddenly increased between day 53 and 65. In contrast, an X-ray emission measure on the order of cm-3 would have been needed to explain the radio brightness (assuming that the hot gas was situated in a thin enough shell to justify having an approximately constant density profile). The amount of K gas was therefore too small to explain the radio flare by more than three orders of magnitude. This finding is independent of the distance to V5589 Sgr. Moreover, although the peak radio brightness temperature could in principle have been generated by of warm ( K) gas, the SMARTS optical spectra do not provide any evidence for such a large quantity of warm gas. In addition, that stayed roughly constant (even while the density was almost certainly dropping) shows that large quantities of shock-heated gas were not being cooled out of the X-ray regime to K. It is therefore difficult to reconcile the radio flare with bremsstrahlung from shock-heated hot plasma.
With not enough warm ( K) or hot ( K) gas to produce the observed peak radio flux, we propose that non-thermal, synchrotron emission from particles accelerated in shocks dominated the radio flare. One concern about this proposal is that the radio emission near the peak of the radio flare did not have the spectral index of typically associated with synchrotron emission (Chevalier, 1982; Weiler et al., 2002). Weston et al. (2016) encountered this same issue when interpreting the early-time flare from the V1723 Aql. They argued that the radio spectrum near the peak of the flare in that source could have been affected by free-free absorption. Given that we expect plenty of K gas to be present in the ejecta, and that we expect shocks themselves to photoionize upstream material (Metzger et al., 2014), it is plausible that free-free absorption could also be affecting the radio spectrum near the peak of the flare in V5589 Sgr. Because the hot, X-ray emitting gas was insufficient to produce the radio flare and free-free absorption is plausible, we consider synchrotron emission to be the most likely explanation for the radio flare despite the slightly rising radio spectrum.
The rapid radio brightening, or flare, between days 46.2 and 62.3 also provides evidence for shocks as the origin of the strongest low-frequency radio emission from V5589 Sgr. At both 5.0 and 6.8 GHz, the radio flux densities increased much faster than possible for a freely expanding, K (i.e., photoionized) remnant ejected at the start of the eruption. Whereas a freely expanding, constant-temperature flow can produce radio flux densities that increase as fast as (for an optically thick spherical outflow), the 5.0-GHz flux density rose as , even while the radio spectra showed that the emitting material were not optically thick. For the radio flare to have been due to freely expanding ejecta with K, the emitting material would have had to have been ejected not at the start of the eruption, but more than 26 days after . Neither the optical spectra (Walter et al., 2012) nor the optical light curve (Mróz et al., 2015), however, show evidence for a strong new outflow a month into the eruption. Furthermore, the contrast between the fairly constant X-ray emission measure, , and the rapidly rising radio flux between 46.2 and 62.3 days after the start of the eruption further supports our contention that the radio flare was not thermal emission from shock-heated gas. Like our analysis of the emission measure, this result is also independent of distance. The appearance of a new source of radio emission on the order of months after the start of the eruption was more consistent with the synchrotron knots tracing shocks in V959 Mon, at least one of which was still brightening months after the detection of -rays (Chomiuk et al., 2014). In the speed of its radio brightening, the radio flare from V5589 Sgr was very similar to the shock-powered early flare in V1723 Aql (Weston et al., 2016).
4.2 Connection to -ray producing novae
The similar viewing angles of V5589 Sgr and the -ray bright novae V959 Mon enable us to speculate about the velocity and structure of the colliding flows from V5589 Sgr. Because light curves of both V959 Mon and V5589 Sgr show eclipses (Page et al., 2013; Mróz et al., 2015), both binaries have inclinations that are close to , so that the orbital planes are observed nearly edge on. In V959 Mon, this viewing angle led to a horn-shaped component in optical emission line profiles (e.g., see Fig. 4 of Ribeiro et al., 2013) – from what radio and HST observations revealed to be a slow, dense inner flow (Chomiuk et al. 2014; Sokoloski et al. in preparation). This slow flow in V959 Mon consisted of a spherical shell-like structure with a strong equatorial density enhancement (Chomiuk et al. 2014; Sokoloski et al. in preparation). Because the optical emission lines in SMARTS spectra of V5589 Sgr contain a similar horn-shaped component, with peaks near Doppler shifts of approximately km s-1 (e.g., in H on MJD 56048.4, 56101.0, and 56103.0, and in OIII on MJD 56057.1; Walter et al., 2012, see Figure 1), we hypothesize that the remnant around V5589 Sgr also included an inner shell-like structure expanding at a speed of around km s-1, with a strong equatorial density enhancement333If such an inner, slow structure with an equatorial density enhancement is common in novae, that could explain the narrow cores in the optical emission lines of some novae that are viewed more pole on, such as V339 Del (Schaefer et al., 2014). In those systems, the face-on equatorial torus would generate an emission component with very low radial velocities.. In V959 Mon, the slow equatorial torus collimated a faster flow into a bi-conical shape (Ribeiro et al. 2013; Shore et al. 2013; Chomiuk et al. 2014; Sokoloski et al. in preparation), which produced ‘shoulders’ in the optical line profiles that were similar to the shoulders out to radial velocities of km s-1 in V5589 Sgr.
In V959 Mon, projection effects caused the shoulders in the optical emission lines to have velocity widths that were less than the the maximum speed of the bi-conical fast flow. For V5589 Sgr, the high temperature of the X-ray emitting plasma on day 19 ( K) reveals that the difference between the speeds of the fast and slow flows was at least initially greater than 3,800 km s-1 (using the expression for the post-shock temperature, and assuming that the shock speed was times the difference between the speeds of the fast and slow flows). The fast flow thus probably had a maximum velocity of more than 5,000 km s-1. In fact, faint extended H wings in the early spectra from SMARTS, as well as spectroscopy in the first few days of eruption from the Crimean Laboratory, Moscow State University (Esipov et al., 2012) support the existence of flows with speeds in excess of 4,000 km s-1. That the core of the optical emission lines only extended out to 4,000 km s-1 is thus consistent with a bi-conical outflow, as in V959 Mon. The optical, radio, and X-ray observations are therefore consistent with V5589 Sgr having a similar ringbipolar structure as V959 Mon.
Our previous arguments regarding the origin of the radio flare remain valid under this slightly refined picture of the structure of the V5589 Sgr remnant. For example, in our calculation of the brightness temperature in equation 2, the maximum outflow velocity of the ejecta was probably actually greater than km s-1. However, the area of the bi-conical remnant on the sky is smaller than in the case of the spherical remnant (as long as the half-opening angles for the cones are wider than 45∘), making the value of even higher than in the spherical case. Thus, the radio flare is still more consistent with being shock powered than being bremsstrahlung from unshocked, photoionized ejecta.
A torus of relatively slow-moving material in the equatorial plane may originate in one of several ways. As suggested by Chomiuk et al. (2014) for V959 Mon, the development of a dense toroidal outflow is consistent with hydrodynamic simulations of how the binary companion might influence the behaviour of nova ejecta (Livio et al., 1990; Lloyd et al., 1997; Chomiuk et al., 2014). Therefore, interactions between the companion and the common envelope may lead to a more dense concentration of material in the orbital plane of the binary. Alternatively, there may be a pre-existing circumbinary material stemming from ejections of material from the accretion disk (e.g., Sytov et al., 2007). Rings also may form in the nebulae of post-main sequence rotating stars from Eddington-luminosity driven outflow, due to the interaction of stellar winds (e.g., Chita et al., 2008). Although the mass in the accretion disk could be significant for very wide binaries with red-giant donors, it is not likely to be high enough in V5589 Sgr to generate an equatorial torus with mass comparable to that of the rest of the ejecta. No matter what their origin, equatorial density enhancements in the remnants of novae provide important constraints on either the mass transfer before the eruption or the ejection mechanism for the nova.
The radio emission from V5589 Sgr was probably dominated by a shock-powered flare rather than the more usual case of bremsstrahlung from the K photoionized remnant because of the high speed and relatively low mass of the ejecta. The 2010 eruption of V1723 Aql first produced a shock-powered radio flare and then a period of strong thermal radio emission from a K expanding remnant with a mass of M⊙ and maximum velocity of 1500 km s-1; both the flare and the later peak in the radio light curve reached approximately the same brightness level (Weston et al., 2016). But the expected peak radio brightness from photoionized ejecta is a strong function of the ejecta mass and the speed of the outflow (Bode & Evans, 2008), both in the sense that would diminish the expected radio emission from photoionized ejecta in V5589 Sgr. If the strength of shock-powered synchrotron emission is less sensitive to these parameters, or enhanced in a high-speed shock, then the shock-powered flare could become the dominant element of the radio light curve.
Interestingly, despite the importance of shocks and possibly even relativistic particles in generating its radio emission, V5589 Sgr was less bright in -rays than several other classical novae at similar distances. Since the /LAT sensitivity for the location of V5589 Sgr (, ) is comparable to that for V1324 Sco (l=357.4, b=-2.9), the daily GeV flux of V5589 Sgr almost certainly stayed below photons cm-2 s-1, which is below the level seen in V1324 Sco and V959 Mon (Ackermann et al., 2014). It remains to be seen how the upper limit on the -ray flux from V5589 Sgr compares with the detections of the four later Fermi-detected novae, all of which were observed in pointed mode with fluxes as faint as 2–3 photons cm-2 s-1. When the distances of kpc for V959 Mon (Linford et al., 2015), kpc for V1324 Sco (Finzell et al., 2015), and kpc for V339 Del (Schaefer et al., 2014) are taken into account, V5589 Sgr appears to have been less luminous in the -rays than at least V1324 Sco and V339 Del. Since V339 Del is thought to have a low inclination and therefore to be viewed pole on (Schaefer et al., 2014), viewing angle could play a role in setting the -ray luminosity. Alternatively, whereas Metzger et al. (2015) argued that most relativistic protons in V1324 Sco and V339 Del were trapped and collided with proton targets to produce -rays, the low X-ray absorbing column for V5589 Sgr suggests that the ejecta mass might have been too low and/or the expansion speeds too high for this to have been the case for V5589 Sgr.
The presence of high energy shocks and -rays from novae is still an active area of research with many complexities and open questions. Shocks themselves may be apparently absent in systems where expected to appear, such as in the symbiotic Nova Sco 2014 (Joshi et al., 2015). The speed of the shocks and the angle at which the shocks are viewed may play a large part in determining whether -rays are detected in nearby novae (Metzger et al., 2015; Dmitrievich Vlasov et al., 2016). If this were the case, it could explain systems such as the clearly shock-powered yet -ray faint V5589 Sgr.
Strengthening the connection between V5589 Sgr and classical novae that have been detected in the -rays, V5589 Sgr is not the only nova to show a notable excess of radio flux at lower frequencies. The 1.75 GHz flux density from -detected nova V959 Mon peaked around 170 days after the start of that eruption, counter to expectations based on models of expanding thermal ejecta. This excess is pictured in Chomiuk et al. 2014 (Extended Data Figure 4); while none of the light curves at frequencies spanning 7.4–225 GHz are very well fit by a simple Hubble flow model, by far the most divergent is the lowest frequency light curve, which shows a peak flux density of 11.2 mJy at 1.75 GHz, when a peak of just 4.5 mJy is predicted by the Hubble flow model. As in the case of V5589 Sgr, this lower-frequency radio peak in V959 Mon occurred around the same time as the maxima at higher frequencies (30 GHz). High-resolution VLBI images of V959 Mon confirm the presence of synchrotron-emitting shocks in that nova. So it is likely that the radio spectral evolution of both V959 Mon and V5589 Sgr can be explained by the same type of model.
5 Conclusions
Despite not being detected in the -rays, V5589 Sgr adds to the growing body of evidence that shocks play an important role in normal novae, and that these shocks can accelerate particles to relativistic speeds. In particular,
-
•
The low-frequency radio emission from V5589 Sgr during its 2012 eruption was dominated by a flare that appears to have been too strong to have been due to bremsstrahlung from photoionized ejecta. The speed with which the radio flare appeared and its radio spectral evolution, are inconsistent with expectations for freely expanding, photoionized ejecta. We conclude that the radio flare from V5589 Sgr was powered by shocks.
-
•
Hard ( keV) X-ray emission confirms that shocks were present, but that they did not heat enough plasma for the radio flare two months after the start of the eruption to have been due to thermal bremsstrahlung from hot, K shock-heated gas.
-
•
Synchrotron emission from relativistic particles accelerated in shocks is the most natural alternative mechanism for the radio flare.
-
•
V5589 Sgr is one of the best examples of shock-powered radio emission from a nova without a red-giant donor. Another clear example is V1723 Aql. We expect that other novae with ejecta that have high speeds and fairly low masses could also produce strong, shock-powered radio emission.
-
•
Using the similar edge-on inclinations of V5589 Sgr and V959 Mon to aid in the interpretation of optical emission-line profiles, and the temperature of the shock-heated X-ray emitting plasma to infer flow speeds in the shock, we hypothesize that in V5589 Sgr a fast flow with a maximum speed of more than 5000 km s-1 collided with, and was loosely collimated by, a slower flow that was concentrated in the equatorial plane.
-
•
The lack of detectable -ray emission from V5589 Sgr, despite direct evidence for strong shocks and indirect evidence for relativistic particles, hints at the possibility that low ejecta densities due to high outflow speeds could have played a role in V5589 Sgr’s low -ray luminosity.
6 Acknowledgements
We thank NRAO for its generous allocation of time which made this work possible. The National Radio Astronomy Observatory is a facility of the National Science Foundation operated under cooperative agreement by Associated Universities, Inc. J. Weston and J.L. Sokoloski acknowledge support from NSF award AST-1211778. J. Weston was supported in part by a Student Observing Support award from NRAO (NRAO 343777). L. Chomiuk, J. Linford, and T. Finzell are supported by NASA Fermi Guest Investigator grant NNH13ZDA001N-FERMI. T. Nelson was supported in part by NASA award NNX13A091G. F. M. Walter thanks the Provost of Stony Brook University for providing support for continued participation in SMARTS. We acknowledge with thanks the variable star observations from the AAVSO International Database contributed by observers worldwide and used as reference in this work. Thanks to C.C. Cheung for use of data from VLA program S4322. Thanks to Glen Petitpas for SMA data reduction. Thanks to Tim Cunningham, Eric Gotthelf, David Schiminovich, and Slavko Bogdanov for useful discussion.
References
- Abdo et al. (2010) Abdo A. A., Ackermann M., Ajello M., Atwood W. B., Baldini L., Ballet J., Barbiellini G., Bastieri D., Bechtol K., Bellazzini R., et al. 2010, Science, 329, 817
- Acero et al. (2015) Acero F., Ackermann M., Ajello M., Albert A., Wood K. S., Wood M., Zimmer S., 2015, ApJ Supplements, 218, 23
- Ackermann et al. (2014) Ackermann M., Ajello M., Albert A., Baldini L., Teyssier F., Fermi-LAT Collaboration 2014, Science, 345, 554
- Anupama et al. (2013) Anupama G. C., Kamath U. S., Ramaprakash A. N., Kantharia N. G., Hegde M., Mohan V., Kulkarni M., Bode M. F., Eyres S. P. S., Evans A., O’Brien T. J., 2013, A&A, 559, A121
- Banerjee et al. (2014) Banerjee D. P. K., Joshi V., Venkataraman V., Ashok N. M., Marion G. H., Hsiao E. Y., Raj A., 2014, ApJL, 785, L11
- Bode & Evans (2008) Bode M. F., Evans A., 2008, Classical Novae. Cambridge University Press
- Bode et al. (2006) Bode M. F., O’Brien T. J., Osborne J. P., Page K. L., Senziani F., Skinner G. K., Starrfield S., Ness J.-U., Drake J. J., Schwarz G., Beardmore A. P., Darnley M. J., Eyres S. P. S., Evans A., Gehrels N., Goad M. R., Jean P., Krautter J., Novara G., 2006, ApJ, 652, 629
- Buil (2012) Buil C., 2012, Central Bureau Electronic Telegrams, 3089, 3
- Cao et al. (2012) Cao Y., Kasliwal M. M., Neill J. D., Kulkarni S. R., Lou Y.-Q., Ben-Ami S., Bloom J. S., Cenko S. B., Law N. M., Nugent P. E., Ofek E. O., Poznanski D., Quimby R. M., 2012, ApJ, 752, 133
- Chandra et al. (2015) Chandra P., Chevalier R. A., Chugai N., Fransson C., Soderberg A. M., 2015, ApJ, 810, 32
- Cheung et al. (2010) Cheung C. C., Donato D., Wallace E., Corbet R., Dubus G., Sokolovsky K., Takahashi H., 2010, The Astronomer’s Telegram, 2487, 1
- Cheung (2013) Cheung C. C. o., 2013, arXiv:1304.3475
- Chevalier (1982) Chevalier R. A., 1982, ApJ, 259, 302
- Chita et al. (2008) Chita S. M., Langer N., van Marle A. J., García-Segura G., Heger A., 2008, A&A, 488, L37
- Chomiuk et al. (2012) Chomiuk L., Krauss M. I., Rupen M. P., Nelson T., Roy N., Sokoloski J. L., Mukai K., Munari U., Mioduszewski A., Weston J., O’Brien T. J., Eyres S. P. S., Bode M. F., 2012, ApJ, 761, 173
- Chomiuk et al. (2013) Chomiuk L., Linford J., Finzell T., Sokoloski J., Weston J., Zheng Y., Nelson T., Mukai K., Rupen M., Mioduszewski A., 2013, The Astronomer’s Telegram, 5382, 1
- Chomiuk et al. (2014) Chomiuk L., Linford J. D., Yang J., O’Brien T. J., Paragi Z., Mioduszewski A. J., Beswick R. J., Cheung C. C., Mukai K., Nelson T., Ribeiro V. A. R. M., Rupen M. P., Sokoloski J. L., Weston J., Zheng Y., Bode M. F., Eyres S., Roy N., Taylor G. B., 2014, Nature, 514, 339
- Chomiuk et al. (2014) Chomiuk L., Nelson T., Mukai K., Sokoloski J. L., Rupen M. P., Page K. L., Osborne J. P., Kuulkers E., Mioduszewski A. J., Roy N., Weston J., Krauss M. I., 2014, ApJ, 788, 130
- Cunningham et al. (2015) Cunningham T., Wolf W. M., Bildsten L., 2015, ApJ, 803, 76
- Darnley et al. (2012) Darnley M. J., Ribeiro V. A. R. M., Bode M. F., Hounsell R. A., Williams R. P., 2012, ApJ, 746, 61
- Das et al. (2006) Das R., Banerjee D. P. K., Ashok N. M., 2006, ApJL, 653, L141
- Dmitrievich Vlasov et al. (2016) Dmitrievich Vlasov A., Vurm I., Metzger B. D., 2016, ArXiv: 1603.05194
- Esipov et al. (2012) Esipov V. F., Sokolovsky K. V., Korotkiy S. A., 2012, The Astronomer’s Telegram, 4094, 1
- Eyres et al. (2000) Eyres S. P. S., Bode M. F., O’Brien T. J., Watson S. K., Davis R. J., 2000, MNRAS, 318, 1086
- Finzell et al. (2015) Finzell T., Chomiuk L., Munari U., Walter F. M., 2015, ApJ, 809, 160
- Friedman et al. (2011) Friedman S. D., York D. G., McCall B. J., Dahlstrom J., Sonnentrucker P., Welty D. E., Drosback M. M., Hobbs L. M., Rachford B. L., Snow T. P., 2011, ApJ, 727, 33
- Green et al. (2015) Green G. M., Schlafly E. F., Finkbeiner D. P., Rix H.-W., Martin N., Burgett W., Draper P. W., Flewelling H., Hodapp K., Kaiser N., Kudritzki R. P., Magnier E., Metcalfe N., Price P., Tonry J., Wainscoat R., 2015, ApJ, 810, 25
- Hjellming et al. (1979) Hjellming R. M., Wade C. M., Vandenberg N. R., Newell R. T., 1979, ApJ, 84, 1619
- Högbom (1974) Högbom J. A., 1974, A&A Supplement, 15, 417
- Joshi et al. (2015) Joshi V., Banerjee D. P. K., Ashok N. M., Venkataraman V., Walter F. M., 2015, MNRAS, 452, 3696
- Korotkiy et al. (2012) Korotkiy S., Sokolovsky K., Brown N. J., Gao R. J., Seach J., Kiytota S., Guido E., Howes N., Sostero G., Elenin L., Molotov I., Koff R. A. A., Nissinen M., Nishiyama K., Kabashima F., Koberger H., Vollmann W., Gerke V., 2012, Central Bureau Electronic Telegrams, 3089, 1
- Kraft et al. (1991) Kraft R. P., Burrows D. N., Nousek J. A., 1991, ApJ, 374, 344
- Krauss et al. (2011) Krauss M. I., Chomiuk L., Rupen M., Roy N., Mioduszewski A. J., Sokoloski J. L., Nelson T., Mukai K., Bode M. F., Eyres S. P. S., O’Brien T. J., 2011, ApJ, 739, L6
- Linford et al. (2015) Linford J. D., Ribeiro V. A. R. M., Chomiuk L., Nelson T., Sokoloski J. L., Rupen M. P., Mukai K., O’Brien T. J., Mioduszewski A. J., Weston J., 2015, ApJ, 805, 136
- Livio et al. (1990) Livio M., Shankar A., Burkert A., Truran J. W., 1990, ApJ, 356, 250
- Lloyd et al. (1997) Lloyd H. M., O’Brien T. J., Bode M. F., 1997, MNRAS, 284, 137
- McMullin et al. (2007) McMullin J. P., Waters B., Schiebel D., Young W., Golap K., 2007, in Shaw R. A., Hill F., Bell D. J., eds, Astronomical Data Analysis Software and Systems XVI Vol. 376 of Astronomical Society of the Pacific Conference Series, CASA Architecture and Applications. p. 127
- Metzger et al. (2015) Metzger B. D., Finzell T., Vurm I., Hascoët R., Beloborodov A. M., Chomiuk L., 2015, MNRAS, 450, 2739
- Metzger et al. (2014) Metzger B. D., Hascoët R., Vurm I., Beloborodov A. M., Chomiuk L., Sokoloski J. L., Nelson T., 2014, MNRAS, 442, 713
- Mink (2011) Mink D. J., 2011, in Evans I. N., Accomazzi A., Mink D. J., Rots A. H., eds, Astronomical Data Analysis Software and Systems XX Vol. 442 of Astronomical Society of the Pacific Conference Series, Data Pipelines for the TRES Echelle Spectrograph. p. 305
- Mróz et al. (2015) Mróz P., Udalski A., Poleski R., Soszyński I., Szymański M. K., Pietrzyński G., Wyrzykowski Ł., Ulaczyk K., Kozłowski S., Pietrukowicz P., Skowron J., 2015, ApJ Supplements, 219, 26
- Mukai & Ishida (2001) Mukai K., Ishida M., 2001, ApJ, 551, 1024
- Munari et al. (2011) Munari U., Joshi V. H., Ashok N. M., Banerjee D. P. K., Valisa P., Milani A., Siviero A., Dallaporta S., Castellani F., 2011, MNRAS, 410, L52
- Nelson et al. (2014) Nelson T., Chomiuk L., Roy N., Sokoloski J. L., Mukai K., Krauss M. I., Mioduszewski A. J., Rupen M. P., Weston J., 2014, ApJ, 785, 78
- Nelson et al. (2012) Nelson T., Donato D., Mukai K., Sokoloski J., Chomiuk L., 2012, ApJ, 748, 43
- Ness et al. (2013) Ness J.-U., Osborne J. P., Henze M., Dobrotka A., Drake J. J., Ribeiro V. A. R. M., Starrfield S., Kuulkers E., Behar E., Hernanz M., Schwarz G., Page K. L., Beardmore A. P., Bode M. F., 2013, A&A, 559, A50
- O’Brien et al. (2006) O’Brien T. J., Bode M. F., Porcas R. W., Muxlow T. W. B., Eyres S. P. S., Beswick R. J., Garrington S. T., Davis R. J., Evans A., 2006, Nature, 442, 279
- Orio et al. (2015) Orio M., Rana V., Page K. L., Sokoloski J., Harrison F., 2015, MNRAS, 448, L35
- Page et al. (2013) Page K. L., Osborne J. P., Wagner R. M., Beardmore A. P., Shore S. N., Starrfield S., Woodward C. E., 2013, ApJL, 768, L26
- Ribeiro et al. (2013) Ribeiro V. A. R. M., Munari U., Valisa P., 2013, ApJ, 768, 49
- Rupen et al. (2008) Rupen M. P., Mioduszewski A. J., Sokoloski J. L., 2008, ApJ, 688, 559
- Schaefer et al. (2014) Schaefer G. H., Brummelaar T. T., Gies D. R., Farrington C. D., Kloppenborg B., Chesneau O., 2014, Nature, 515, 234
- Seaquist & Palimaka (1977) Seaquist E. R., Palimaka J., 1977, ApJ, 217, 781
- Shepherd (1997) Shepherd M. C., 1997, in Hunt G., Payne H., eds, Astronomical Data Analysis Software and Systems VI Vol. 125 of Astronomical Society of the Pacific Conference Series, Difmap: an Interactive Program for Synthesis Imaging. p. 77
- Shore et al. (2013) Shore S. N., Schwarz G. J., De Gennaro Aquino I., Augusteijn T., Walter F. M., Starrfield S., Sion E. M., 2013, A&A, 549, A140
- Sokoloski et al. (2006) Sokoloski J. L., Luna G. J. M., Mukai K., Kenyon S. J., 2006, Nature, 442, 276
- Sokoloski et al. (2008) Sokoloski J. L., Rupen M. P., Mioduszewski A. J., 2008, ApJ, 685, L137
- Sokolovsky et al. (2012) Sokolovsky K., Korotkiy S., Elenin L., Molotov I., 2012, The Astronomer’s Telegram, 4061, 1
- Sytov et al. (2007) Sytov A. Y., Kaigorodov P. V., Bisikalo D. V., Kuznetsov O. A., Boyarchuk A. A., 2007, Astronomy Reports, 51, 836
- Thompson (2012) Thompson W., , 2012, STEREO HI1-B observations of Nova Sagittarii 2012, http://stereo.gsfc.nasa.gov/~thompson/nova_sagittarii_2012
- Walter et al. (2012) Walter F. M., Battisti A., Towers S. E., Bond H. E., Stringfellow G. S., 2012, PASP, 124, 1057
- Weiler et al. (2002) Weiler K. W., Panagia N., Montes M. J., Sramek R. A., 2002, ARA&A, 40, 387
- Weston et al. (2016) Weston J. H. S., Sokoloski J. L., Metzger B. D., Zheng Y., Chomiuk L., Krauss M. I., Linford J. D., Nelson T., Mioduszewski A. J., Rupen M. P., Finzell T., Mukai K., 2016, MNRAS, 457, 887
- Weston et al. (2014) Weston J. H. S., Sokoloski J. L., Zheng Y., Chomiuk L., Mioduszewski A., Mukai K., Rupen M. P., Krauss M. I., Roy N., Nelson T., 2014, in Woudt P. A., Ribeiro V. A. R. M., eds, Stell Novae: Past and Future Decades Vol. 490 of Astronomical Society of the Pacific Conference Series, Shocks and Ejecta Mass: Radio Observations of Nova V1723 Aql. p. 339
- Williams (2012) Williams R., 2012, AJ, 144, 98
- Wilms et al. (2000) Wilms J., Allen A., McCray R., 2000, ApJ, 542, 914