High-Resolution Spectroscopy of Extremely Metal-Poor Stars in the Least Evolved Galaxies: BOÖTES II**affiliation: This paper includes data gathered with the 6.5 m Magellan Telescopes located at Las Campanas Observatory, Chile.
Abstract
We present high-resolution Magellan/MIKE spectra of the four brightest confirmed red giant stars in the ultra-faint dwarf galaxy Boötes II (Boo II). These stars all inhabit the metal-poor tail of the Boo II metallicity distribution function. The chemical abundance pattern of all detectable elements in these stars is consistent with that of the Galactic halo. However, all four stars have undetectable amounts of neutron-capture elements Sr and Ba, with upper limits comparable to the lowest ever detected in the halo or in other dwarf galaxies. One star exhibits significant radial velocity variations over time, suggesting it to be in a binary system. Its variable velocity has likely increased past determinations of the Boo II velocity dispersion. Our four stars span a limited metallicity range, but their enhanced -abundances and low neutron-capture abundances are consistent with the interpretation that Boo II has been enriched by very few generations of stars. The chemical abundance pattern in Boo II confirms the emerging trend that the faintest dwarf galaxies have neutron-capture abundances distinct from the halo, suggesting the dominant source of neutron-capture elements in halo stars may be different than in ultra-faint dwarfs.
Subject headings:
galaxies: dwarf — galaxies: individual (Boo II) — Local Group — stars: abundances1. Introduction
The ultra-faint dwarf galaxies (UFDs) in orbit around the Milky Way are important probes of several extreme regimes. They are the smallest and the most metal-poor galaxies, falling at the bottom of the luminosity-metallicity relation (Kirby et al., 2008, 2013). As the most dark-matter dominated systems known (Simon & Geha, 2007; Strigari et al., 2008; Simon et al., 2011), UFDs are promising targets in the search for a dark matter annihilation signal (e.g., Drlica-Wagner et al. 2015). There are hints that the stellar initial mass function in dwarf galaxies is bottom-light, suggesting differences in the nature of early metal-poor star formation (Geha et al., 2013). The UFDs are distinctly tied to reionization, both as important sources of ionizing photons (Wise et al., 2014; Weisz et al., 2014) and as victims of ionizing radiation (Brown et al., 2014). Stars stripped from dwarf galaxies may be important contributors to the metal-poor tail of the galactic stellar halo (Kirby et al., 2008; Frebel et al., 2010a; Frebel & Norris, 2015). Furthermore, the most metal-poor of these UFDs may be relics of the era of first galaxies, taking a snapshot of the first stages of chemical enrichment and potentially opening up a window to study the first stars and galaxies (Frebel & Bromm, 2012; Frebel et al., 2014; Ji et al., 2015).
Boötes II (hereafter Boo II) is a UFD discovered in the Sloan Digital Sky Survey (Walsh et al., 2007). At a distance of 42 kpc, it is one of the closest UFDs known (Walsh et al., 2008). Its size, luminosity, and average metallicity show it to be at the very low end of the size-luminosity and luminosity-metallicity relations (Geha et al. (in prep)), comparable to systems like Segue 1, Willman 1, Ursa Major II, and Coma Berenices (e.g., Martin et al. 2008; Kirby et al. 2013). Photometric and medium-resolution spectroscopic observations have further established that Boo II has an extreme mass-to-light ratio consistent with other UFDs (Walsh et al. 2008; Martin et al. 2008; Koch et al. 2009, Geha et al. (in prep)). However, several important questions require chemical abundances from high-resolution spectroscopy, ideally for multiple stars in the system. In particular, as Boo II is one of the smallest galaxies, it is a candidate to be a relic of one of the first galaxies, like Segue 1 (Frebel et al., 2014).
Here, we present chemical abundance results from high-resolution spectroscopy of the four brightest stars in Boo II. In Section 2, we describe our observations. Section 3 details our abundance analysis procedure and compares the chemical signature of Boo II to that of other UFDs and to metal-poor stars in the halo. One of the stars in Boo II appears to be a binary system, which we investigate in Section 4. We summarize our results and conclude in Section 5.
2. Observations
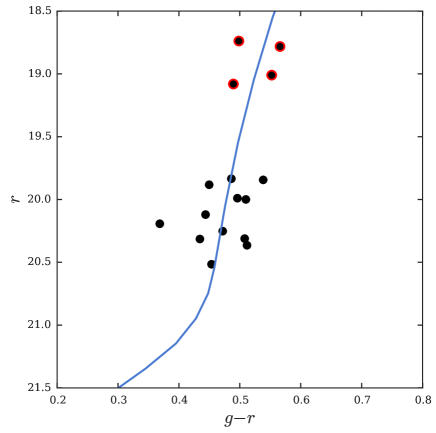
A total of 16 Boo II member stars were identified with Keck/DEIMOS observations (Geha et al. (in prep)). We selected the four brightest members on the red giant branch from the Geha et al. (in prep) sample for high-resolution followup (see Figure 1). Despite being the brightest members, all four stars push the limit of high-resolution spectroscopy with current telescopes. Two of the stars have and two have . The next-brightest member stars are over 1 magnitude fainter. We label the stars by their Sloan Digital Sky Survey coordinates.
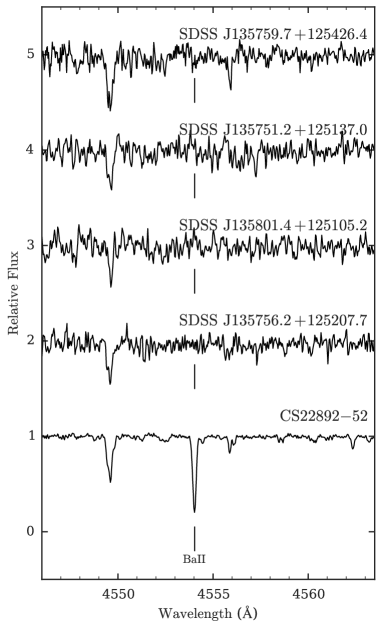
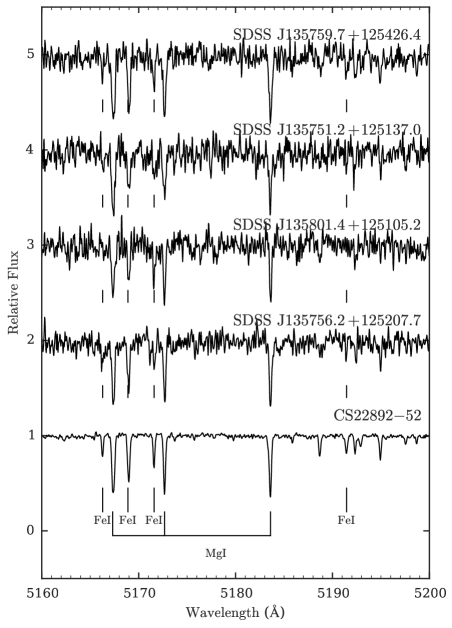
The four target stars were observed with the Magellan Inamori Kyocera Echelle (MIKE) spectrograph (Bernstein et al., 2003) on the Clay telescope. MIKE covers the full optical wavelength range, from 3500 Å to 9000 Å. Details of the observations are shown in Table 1, and important spectral regions are shown in Figure 2. Three of our stars were observed with a 10 slit, and one was observed with a 07 slit. A 10 slit leads to a spectral resolution of at red wavelengths and at blue wavelengths. A 07 slit yields a spectral resolution of and in the red and blue, respectively. We used on-chip binning to reduce read noise. Stars were observed from to hours, and individual frame exposure times were typically minutes to minimize cosmic rays while collecting enough photons to avoid the read noise limit. This was a problem particularly on the blue chip. The signal-to-noise per pixel is modest, about 13 around 5300 Å and 26 around 6000 Å.
Data were reduced with the CarPy MIKE python pipeline (Kelson, 2003)111http://code.obs.carnegiescience.edu/mike. Consecutive observations were reduced together. We normalized and stitched echelle orders before Doppler correcting and combining spectra from different observation dates. The Doppler correction was found by cross-correlation with a template spectrum using the Mg triplet lines near 5200 Å.
Boo II was also observed at low resolution by Koch et al. (2009). Our brightest star (SDSS J135751.2+125137.0) was the subject of Koch & Rich (2014). Of our other three target stars, two were identified as members of Boo II in Koch et al. (2009) (SDSS J135759.7+125426.4 and SDSS J135801.4+125105.2).
| Star | Date of Observation | Slit | aaConverted from SDSS photometry using Schlafly & Finkbeiner (2011) and Jordi et al. (2006). | S/NbbSignal-to-noise is per pixel. | S/NbbSignal-to-noise is per pixel. | ||||
|---|---|---|---|---|---|---|---|---|---|
| (J2000) | (J2000) | width | (hr) | (mag) | (mag) | (5300 Å) | (6000 Å) | ||
| SDSS J135751.2+125137.0 | 13 57 51.2 | +12 51 37.0 | 2014 Mar 21, 2015 Jun 17/18 | 10 | 5.8 | 19.24 | 18.86 | 11 | 21 |
| SDSS J135759.7+125426.4 | 13 57 59.7 | +12 54 26.4 | 2014 Mar 11/12 | 10 | 7.7 | 19.35 | 18.93 | 15 | 28 |
| SDSS J135756.2+125207.7 | 13 57 56.2 | +12 52 07.7 | 2011 Mar 10/13, 2014 Mar 10/11 | 07 | 9.2 | 19.56 | 19.15 | 17 | 29 |
| SDSS J135801.4+125105.2 | 13 58 01.4 | +12 51 05.2 | 2010 Mar 18/19/21/22 | 10 | 12.2 | 19.57 | 19.19 | 12 | 26 |
3. Chemical Abundances
3.1. Abundance Analysis
We used analysis software from Casey (2014) to measure equivalent widths, determine stellar parameters, and obtain chemical abundances. We use the Castelli & Kurucz (2004) 1D plane-parallel model atmospheres with -enhancement and the LTE abundance analysis code MOOG (Sneden, 1973) that accounts for Rayleigh scattering (Sobeck et al., 2011). Final abundance ratios [X/Fe] are relative to the Asplund et al. (2009) solar abundances222 for element X,Y.
Equivalent widths of metal absorption lines were measured by fitting Gaussian profiles to the line list from Roederer et al. (2010). The measurements are given in Table 2. We exclude lines whose reduced equivalent width () is larger than , as such lines are likely past the linear regime of the curve of growth. Uncertainties on equivalent width measurements were calculated with the equation from Frebel et al. (2006), resulting in typical uncertainties of %. For blended lines and the molecular CH features, we determined the abundance with spectrum synthesis.
| El. | EW (mÅ) | (dex) | EW (mÅ) | (dex) | EW (mÅ) | (dex) | EW (mÅ) | (dex) | |||
|---|---|---|---|---|---|---|---|---|---|---|---|
| (Å) | (eV) | (dex) | SDSS J135751.2+125137.0 | SDSS J135759.7+125426.4 | SDSS J135756.2+125207.7 | SDSS J135801.4+125105.2 | |||||
| CH | 4313 | syn | 5.97 | syn | 6.10 | syn | 5.91 | syn | 6.06 | ||
| CH | 4323 | syn | 5.97 | syn | 6.15 | syn | 5.91 | syn | 6.06 | ||
| Na I | 5889.95 | 0.00 | 151.4 | 3.84 | 186.0 | 4.09 | 168.2 | 3.96 | 133.4 | 3.68 | |
| Na I | 5895.92 | 0.00 | 142.7 | 4.00 | 160.3 | 4.04 | 144.2 | 3.89 | 114.5 | 3.66 | |
Note. — This table is available in its entirety in a machine-readable form in the online journal and the arXiv source. A portion is shown here for guidance regarding its form and content.
Stellar parameters are derived following the procedure in Frebel et al. (2013), including the effective temperature correction. Uncertainties in the stellar parameters are about 150K for , 0.3 dex for , and 0.15 km s-1 for . The uncertainties for SDSS J135751.2+125137.0 are slightly higher (200K, 0.4 dex, 0.2 km s-1) due to the lower signal-to-noise. The final stellar parameters are listed in Table 3. As an independent assessment of the effective temperature, we apply the Alonso et al. (1999) photometric temperature calibration assuming . The color is found using SDSS and , the recalibrated reddening maps of Schlafly & Finkbeiner (2011), and the filter conversions of Jordi et al. (2006). The two temperature determinations agree well within the uncertainty.
Random uncertainties in abundances are estimated from the dispersion in individual line measurements. For elements with only one line, the uncertainty is estimated by varying the placement of the continuum corresponding to the uncertainty on the equivalent width. A minimum abundance uncertainty of 0.1 dex is adopted for SDSS J135759.7+125426.4, SDSS J135756.2+125207.7, and SDSS J135801.4+125105.2; and 0.15 dex for SDSS J135751.2+125137.0. For elements with no detectable lines, we determined an upper limit by placing the continuum as high as reasonably possible around the strongest line. Systematic uncertainties due to differences in stellar parameters are estimated by varying each parameter individually within its uncertainties. Typical total uncertainties from stellar parameters are dex, except for carbon which has a larger uncertainty of 0.4 dex due to its larger temperature sensitivity.
| Star | [Fe/H] | aaUsing converted SDSS magnitudes and calibration from Alonso et al. (1999) | |||
|---|---|---|---|---|---|
| (K) | (km s-1) | (K) | |||
| SDSS J135751.2+125137.0 | 5102 | 2.20 | 2.00 | 5190 | |
| SDSS J135759.7+125426.4 | 4936 | 1.80 | 2.05 | 5005 | |
| SDSS J135756.2+125207.7 | 5013 | 2.00 | 2.00 | 5052 | |
| SDSS J135801.4+125105.2 | 5192 | 2.60 | 1.65 | 5217 |
3.2. Boo II Abundance Signature
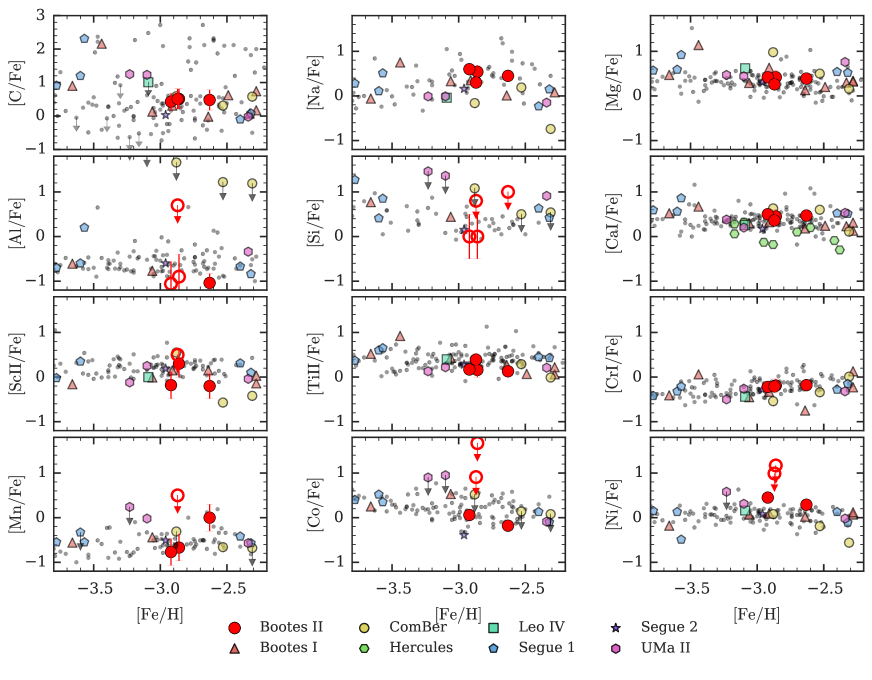
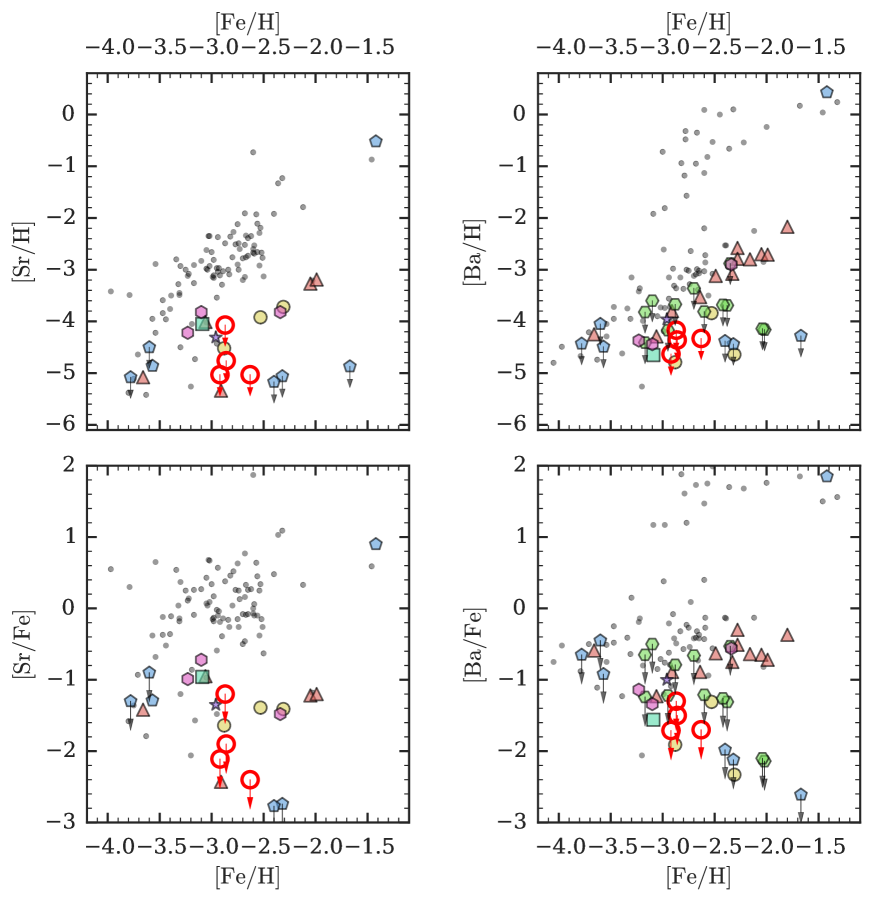
We now discuss the individual element abundances of our Boo II stars. We measure the abundances of C, Na, Mg, Al, Si, Ca, Sc, Ti, Cr, Mn, Fe, Co, Ni, Sr, and Ba. Unless otherwise indicated, abundances were obtained from equivalent width measurements. The abundances of all four stars are listed in Table 3.3 and plotted against halo stars and other ultra-faint dwarf galaxy stars in Figures 3 and 4. As a representative halo star sample, we use the homogeneous abundance analysis of 190 halo stars from Yong et al. (2013). Medium-resolution spectroscopy abundance determinations of stars in UFDs are consistent with the high-resolution spectroscopy abundances, though with larger error bars (Vargas et al., 2013).
3.2.1 Carbon
The carbon abundance of stars in dwarf galaxies may be an important tracer of nucleosynthesis in the first stars (e.g., Norris et al. 2013; Cooke & Madau 2014; Salvadori et al. 2015; Ji et al. 2015). We measure the carbon abundance through synthesis of the CH molecular bands at Å and 4323 Å and correct their abundance for the stars’ evolutionary status (Placco et al., 2014)333http://www3.nd.edu/~vplacco/carbon-cor.html. None of the stars are Carbon Enhanced Metal Poor (CEMP) stars, as all stars have (Aoki et al., 2007). However, all four stars display a mild [C/Fe] enhancement () comparable to other stars in UFDs (see Figure 3). Note that we have corrected the dwarf galaxy stars according to Placco et al. (2014), but not the halo star sample. This correction is small for our hot stars ( dex), but larger for the cool star SDSS J135759.7+125426.4 ( dex).
Besides its role in understanding Population III nucleosynthesis, carbon also plays a role in forming the first low-mass stars, where it (along with oxygen) is an important contributor to atomic metal line cooling in the early universe (Bromm & Loeb, 2003). A sufficient amount of carbon and oxygen will trigger vigorous fragmentation in a primordial galaxy, resulting in the formation of multiple stars and star clusters (Bromm et al., 2001; Safranek-Shrader et al., 2014). The critical amount of carbon and oxygen is specified by the criterion, which quantifies the minimum amount of C and O required for metal line cooling to overcome heating from adiabatic contraction (Frebel et al., 2007). Oxygen is not detectable in our spectra, but a carbon abundance of in all our stars is already sufficient to satisfy the criterion and trigger significant atomic line cooling, allowing atomic cooling to play an important role in forming the first low-mass stars in Boo II.
3.2.2 -elements: Mg, Si, Ca, Ti
The -element abundances of metal-poor halo stars are generally enhanced at a level of , which is typical of stars whose birth cloud was enriched only by core-collapse supernovae. We measure the -elements magnesium, silicon, calcium, and titanium, of which [Mg/Fe], [Ca/Fe], and [Ti/Fe] are enhanced. This is completely consistent with halo star abundances and suggests enrichment only by massive stars.
Due to its potential significance in understanding the role of dust cooling during the formation of the first low-mass stars (Cherchneff & Dwek, 2010; Ji et al., 2014), we have attempted to obtain silicon measurements or upper limits for all of our stars. Only the 3905 Å Si I line, which is blended with carbon, is strong enough to be detected. However, this line is in a region of our spectra with relatively low signal-to-noise. For SDSS J135759.7+125426.4 and SDSS J135801.4+125105.2, we set upper limits. The silicon abundance in both SDSS J135751.2+125137.0 and SDSS J135756.2+125207.7 is clearly nonzero, but the signal-to-noise in this region is insufficient to allow a good determination of the abundance (i.e., uncertainties at least 0.5 dex). We mark these points as open circles with error bars in Figure 3. Adding 1.0 dex to the tabulated abundances is also an appropriate upper limit. All silicon abundances and upper limits are consistent with the standard halo pattern of . None of these upper limits or measurements is low enough to exclude silicate dust cooling in the formation of these low-mass stars (Ji et al., 2014).
3.2.3 Iron-peak elements: Cr, Mn, Co, Ni
The chromium abundances in all our stars conform well to the tight [Cr/Fe] relation found in halo stars. We determine the manganese abundance from synthesis of the triplet at 4030 Å. In SDSS J135801.4+125105.2, we detect no clear manganese lines and give a conservative upper limit. Co and Ni are detected with few lines only in the cooler two stars (SDSS J135759.7+125426.4 and SDSS J135756.2+125207.7), and we determined upper limits for the remaining two stars. Overall, the abundances of the iron-peak elements are consistent with the abundances of halo stars.
3.2.4 Odd elements: Na, Al, Sc
Sodium abundances were determined from the Na D doublet. The abundance derived from these lines usually has a large NLTE correction, but corrections were not applied to our comparison halo sample (Yong et al., 2013). Thus to compare to that sample, we do not apply a correction to the abundances in Figure 3, and only LTE abundances are listed in Table 3.3. For reference, we also determine the NLTE corrections using Lind et al. (2011)444www.inspect-stars.com with our equivalent widths and stellar parameters. The NLTE abundances are typically lower by dex. The exact abundance differences for the 5889.95Å line are 0.46, 0.52; 0.57; and 0.39 dex; for the 5895.92Å line are 0.43, 0.46, 0.47, and 0.31 dex; for SDSS J135751.2+125137.0, SDSS J135759.7+125426.4, SDSS J135756.2+125207.7, and SDSS J135801.4+125105.2, respectively.
We determine the aluminum abundance from two lines. The 3944 Å line is blended with carbon, requiring spectrum synthesis. As in the case of silicon, for SDSS J135756.2+125207.7 and SDSS J135751.2+125137.0 we detect nonzero aluminum but cannot put good bounds on the error (open circles with error bars in Figure 3) due to low signal-to-noise. Again, adding 1.0 dex to the abundance in Table 3.3 is an appropriate upper limit.
The scandium abundances are determined through synthesis of up to five different lines. In all four stars, the abundances are consistent with the halo, though biased slightly lower. Upon investigating this slight bias, we found that the Sc abundances from Yong et al. (2013) were determined using the blends driver of MOOG, rather than from synthesis. When we determine the Sc abundance with blends, we find our derived Sc abundance to be systematically dex higher. This difference deserves further investigation, but since the uncertainty on the scandium measurements in Boo II is large we do not consider it further here.
3.2.5 Neutron-capture elements: Sr, Ba
None of the four stars have strontium or barium line detections (e.g., Figure 2). We use the strongest lines to place upper limits, i.e. the 4077 Å line for Sr and the 4554 Å line for Ba. We find , except for SDSS J135801.4+125105.2 which has . The limit for Ba is . Such a deficiency of neutron-capture elements has been observed in other UFDs, including Hercules (Koch et al., 2013) and Segue 1 (Frebel et al., 2014). We discuss this more in Section 5.
3.3. Comparison with Koch & Rich (2014)
SDSS J135751.2+125137.0 has also been observed at high resolution by Koch & Rich (2014), who number the star as Boo II-15. For their stellar parameters, they obtain K, , km s-1, and . These parameters are consistent within 1 error bars of our stellar parameters. We adopt their stellar parameters but use our equivalent widths to do an abundance comparison. The new abundances agree with Koch & Rich (2014) within the 1 uncertainties, except for chromium. Our chromium abundance of is only slightly more than 1 discrepant with their measurement of .
| Species | [X/H] | [X/Fe] | |||
|---|---|---|---|---|---|
| SDSS J135751.2+125137.0 | |||||
| CH | 2 | 5.97 | 0.30 | 2.46 | 0.41 |
| Na I | 2 | 3.92 | 0.15 | 2.32 | 0.54 |
| Mg I | 4 | 5.16 | 0.15 | 2.44 | 0.42 |
| Al I | 2 | 2.69: | 0.50 | 3.76: | 0.90: |
| Si I | 1 | 4.65: | 0.50 | 2.86: | 0.00: |
| Ca I | 4 | 3.93 | 0.15 | 2.41 | 0.45 |
| Sc II | 3 | 0.59 | 0.30 | 2.56 | 0.30 |
| Ti II | 11 | 2.25 | 0.15 | 2.70 | 0.16 |
| Cr I | 4 | 2.59 | 0.15 | 3.05 | 0.19 |
| Mn I | 3 | 1.90 | 0.30 | 3.53 | 0.67 |
| Fe I | 60 | 4.64 | 0.20 | 2.86 | 0.00 |
| Fe II | 7 | 4.66 | 0.15 | 2.84 | 0.02 |
| Co I | 2 | 3.81 | 1.19 | 1.68 | |
| Ni I | 1 | 4.53 | 1.69 | 1.17 | |
| Sr II | 1 | 1.89 | 4.76 | 1.90 | |
| Ba II | 1 | 2.18 | 4.36 | 1.50 | |
| SDSS J135759.7+125426.4 | |||||
| CH | 2 | 6.12 | 0.20 | 2.30 | 0.51 |
| Na I | 2 | 4.06 | 0.10 | 2.18 | 0.45 |
| Mg I | 5 | 5.36 | 0.12 | 2.24 | 0.39 |
| Al I | 2 | 2.78 | 0.31 | 3.67 | 1.18 |
| Si I | 1 | 5.88 | 1.63 | 1.00 | |
| Ca I | 8 | 4.18 | 0.10 | 2.16 | 0.47 |
| Sc II | 5 | 0.32 | 0.28 | 2.83 | 0.20 |
| Ti I | 2 | 2.69 | 0.10 | 2.27 | 0.36 |
| Ti II | 17 | 2.45 | 0.11 | 2.50 | 0.13 |
| Cr I | 6 | 2.83 | 0.10 | 2.81 | 0.18 |
| Mn I | 3 | 2.80 | 0.30 | 2.63 | 0.00 |
| Fe I | 109 | 4.87 | 0.13 | 2.63 | 0.00 |
| Fe II | 9 | 4.89 | 0.10 | 2.61 | 0.02 |
| Co I | 3 | 2.18 | 0.10 | 2.81 | 0.18 |
| Ni I | 3 | 3.88 | 0.12 | 2.34 | 0.29 |
| Sr II | 1 | 2.16 | 5.03 | 2.40 | |
| Ba II | 1 | 2.15 | 4.33 | 1.70 | |
| SDSS J135756.2+125207.7 | |||||
| CH | 2 | 5.91 | 0.25 | 2.49 | 0.43 |
| Na I | 2 | 3.92 | 0.10 | 2.32 | 0.61 |
| Mg I | 5 | 5.10 | 0.12 | 2.50 | 0.42 |
| Al I | 2 | 2.47: | 0.50 | 3.98: | 1.05: |
| Si I | 1 | 4.59: | 0.50 | 2.92: | 0.00: |
| Ca I | 6 | 3.92 | 0.10 | 2.42 | 0.50 |
| Sc II | 3 | 0.05 | 0.30 | 3.10 | 0.18 |
| Ti II | 12 | 2.20 | 0.10 | 2.75 | 0.17 |
| Cr I | 4 | 2.50 | 0.10 | 3.14 | 0.21 |
| Mn I | 3 | 1.74 | 0.27 | 3.69 | 0.76 |
| Fe I | 71 | 4.58 | 0.17 | 2.92 | 0.00 |
| Fe II | 5 | 4.56 | 0.10 | 2.94 | 0.02 |
| Co I | 2 | 2.13 | 0.10 | 2.86 | 0.06 |
| Ni I | 2 | 3.75 | 0.10 | 2.47 | 0.45 |
| Sr II | 1 | 2.05 | 4.92 | 2.00 | |
| Ba II | 1 | 2.24 | 4.42 | 1.50 | |
| SDSS J135801.4+125105.2 | |||||
| CH | 2 | 6.06 | 0.30 | 2.37 | 0.51 |
| Na I | 2 | 3.67 | 0.10 | 2.57 | 0.30 |
| Mg I | 4 | 4.99 | 0.10 | 2.61 | 0.26 |
| Al I | 1 | 4.28 | 2.17 | 0.70 | |
| Si I | 1 | 5.64 | 1.87 | 1.00 | |
| Ca I | 2 | 3.83 | 0.10 | 2.51 | 0.35 |
| Sc II | 3 | 0.78 | 2.37 | 0.50 | |
| Ti II | 11 | 2.47 | 0.14 | 2.48 | 0.39 |
| Cr I | 3 | 2.56 | 0.11 | 3.08 | 0.21 |
| Mn I | 3 | 3.06 | 2.37 | 0.50 | |
| Fe I | 42 | 4.63 | 0.11 | 2.87 | 0.00 |
| Fe II | 3 | 4.63 | 0.10 | 2.87 | 0.00 |
| Co I | 1 | 3.03 | 1.96 | 0.91 | |
| Ni I | 1 | 4.34 | 1.88 | 0.99 | |
| Sr II | 1 | 1.20 | 4.07 | 1.20 | |
| Ba II | 1 | 1.99 | 4.17 | 1.30 | |
Note. — : Denotes highly uncertain abundance (see text for details)
4. A Binary Star: SDSS J135751.2+125137.0
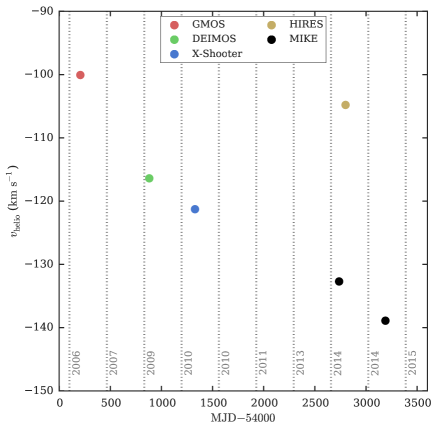
The star SDSS J135751.2+125137.0 (Boo II-15 in Koch et al. 2009; Koch & Rich 2014) has exhibited significant variations in its heliocentric radial velocity with time. We combine our radial velocity measurements with those from the literature (Koch et al. 2009; Koch & Rich 2014, Geha et al. (in prep)) as well as a publically available spectrum of this star taken with VLT/X-Shooter. The velocity measurements are plotted in Figure 5. Other than our two measurements from MIKE, we note that every data point has been taken with a different instrument (the others are from Gemini/GMOS, Keck/DEIMOS, VLT/X-Shooter, Keck/HIRES). There may be systematic zero-point offsets from instrument to instrument of the order a few km s-1, but not enough to account for the observed differences. In contrast, the velocities of the other two stars observed with MIKE are consistent with Koch et al. (2009) to within km s-1.
This amount of velocity variation would be consistent with a RR Lyrae star, but no line distortions (e.g., in the hydrogen lines) from rapidly changing stellar parameters are seen in our MIKE spectra that would be consistent with this type of variable star. Our two observations are at a similar phase in the velocity variations, but the stellar parameters from our study and Koch & Rich (2014) are consistent within errors despite being determined at different very different phases of the velocity variations, while an RR Lyrae’s effective temperature changes by almost 1000 K (Fossati et al., 2014). Thus, we conclude it is likely that this star is in a binary system. If so, it would be the third binary system confirmed in an ultra-faint dwarf. A full binary orbit was established for a star in Hercules (Koch et al., 2014), and one star in Segue 1 shows clear signs of a past mass transfer event (Frebel et al., 2014). One star in Ursa Major II may also show a signature of binary mass transfer (Frebel et al., 2010b). We note that one of our MIKE observations and the HIRES observation from Koch & Rich (2014) are only two months apart, but the measurements differ by km s-1. This rapid velocity shift is consistent with the eccentric orbit seen in the Hercules system (Koch et al., 2014). Given only six observations and no clear way to determine velocity errors across different instruments, we were unable to robustly determine a period, amplitude, or mean velocity for the orbit.
The binarity of this system has had an adverse effect on the mass determination of Boo II. The velocity dispersion in Koch et al. (2009) was determined to be km s-1, where the large error bar is due to the low spectral resolution and only using five stars to determine the dispersion. However, they observed SDSS J135751.2+125137.0 to have a velocity of km s-1, and this star is the most extreme value in their velocity distribution. Although we cannot robustly determine the mean velocity of SDSS J135751.2+125137.0, it is likely much closer to the systemic velocity of km s-1 than the originally observed velocity of km s-1. If we remove SDSS J135751.2+125137.0 from their sample, the large errors on the remaining four velocities result in only an upper limit on the velocity dispersion for this system. In comparison, Geha et al. (in prep) find a velocity dispersion in line with other UFDs of similar size and luminosity. We note that the large velocity dispersion was included as part of the commonly-used compilation of Local Group properties in McConnachie (2012), where as a result Boo II is listed as the galaxy with the largest mass-to-light ratio currently known. The discrepancy can affect works that use the McConnachie (2012) compilation (e.g., Jiang & van den Bosch 2015).
5. Discussion and Conclusion
We have obtained high-resolution spectra of four metal-poor red giants in the ultra-faint dwarf galaxy Boo II. Chemical abundance analysis shows that all detectable elements have abundance ratios consistent with metal-poor stars in the stellar halo (Yong et al., 2013), with the exception of Sr and Ba. The two neutron-capture elements have very low abundance limits, consistent with what has been observed in other UFDs (Koch et al., 2013; Frebel et al., 2014). In addition, one of the stars exhibits significant radial velocity variations and is likely a single-lined spectroscopic binary. The binary system has led to an overestimation of the Boo II velocity dispersion in the past (see Section 4 for the resulting consequences). We now discuss some possible interpretations of the chemical abundance pattern found in Boo II.
Boo II as a first galaxy. Frebel & Bromm (2012) define a first galaxy as a galaxy that has experienced very few metal enrichment events, perhaps only from Pop III stars. They suggest that some UFDs may be surviving first galaxies. This scenario results in a wide metallicity spread ( dex), super-solar -abundances at all metallicities, and low neutron-capture abundances. Based on these criteria, Segue 1 is potentially a surviving first galaxy (Frebel et al., 2014), and we now consider whether Boo II has a chemical signature consistent with being a first galaxy.
The overall metallicity distribution function of Boo II is wide, similar to the other UFDs (Geha et al. (in prep)). However, our high-resolution abundances span only the metal-poor end of the metallicity distribution. Thus, although we find enhanced -abundances in all our stars, the limited metallicity range is insufficient to conclusively determine that Boo II shows the enhanced signature across its entire metallicity range. If the high -abundances seen at low metallicity in Boo II extend to the higher metallicity stars, this is a strong indication that star formation in Boo II ended before the onset of Type Ia supernovae, suggesting Boo II is a candidate first galaxy. In contrast, a downturn in the [/Fe] ratio at higher metallicities would suggest that Boo II experienced some extended but inefficient star formation. Unfortunately, the higher-metallicity stars in Boo II are all too faint to be observed with high-resolution spectrographs on current telescopes. Medium-resolution spectra may be able to constrain the -abundances of these fainter stars (Vargas et al., 2013). Either way, the low neutron-capture abundances in Boo II stars are clearly lower than the pattern established by halo stars and likely indicates these stars in Boo II formed before standard neutron-capture enrichment processes began to enrich the system.
Source of neutron-capture elements in UFDs. Although we only have upper limits on the neutron-capture abundances, Roederer (2013) points out that no stars have yet been observed with enough signal-to-noise to clearly rule out the presence of neutron-capture elements. In addition, very low but non-zero neutron-capture abundances have been detected in many other UFDs. Supposing that Boo II and other dwarf galaxies contain nonzero but small amounts of neutron-capture elements, it is interesting to consider the potential source of these heavy elements. Following Frebel et al. (2014), we can use the current upper limits to estimate the maximum mass of neutron-capture material in a galaxy like Boo II by assuming it formed from of gas. Then the upper limits and suggest the mass of each element is . If the initial gas reservoir is larger, the mass limit scales accordingly (e.g., a gas reservoir puts the limit at ).
The standard source of both Sr and Ba is the stellar winds from intermediate mass AGB stars (see references in Jacobson & Frebel 2014). From Lugaro et al. (2012), we estimate that a typical intermediate-mass AGB star releases of stellar winds with and . Assuming the star has , this results in of Sr and Ba per AGB star. The neutron-capture mass constraint in Boo II allows Pop II AGB stars to enrich the system. However, we believe standard AGB enrichment to be unlikely in these systems, because the [Sr,Ba/Fe] ratios are distinct from the halo stars. This suggests the dominant source of neutron-capture elements in halo stars is different than in UFDs. We thus look to other explanations for the low neutron-capture abundances in UFDs.
One possibility is that this low neutron-capture abundance signature indicates unique nucleosynthesis processes in the first (Pop III) stars. For example, massive rapidly-rotating Pop III stars could produce Sr and Ba masses around per star through a special s-process (Frischknecht et al., 2012). However, this amount depends heavily on the presence of seed nucleii, and these models typically invoke a small initial metallicity in their star to seed the s-process.
Alternatively, Pop III core-collapse supernovae (CCSNe) can produce neutron-capture elements if they undergo the r-process, a possibility that has support from abundances of metal-poor halo stars (Roederer et al., 2014). Note that theoretically, the conditions for producing a realistic r-process pattern in CCSNe are not easily achieved, leading many to look to merging neutron star binaries as the primary source of the r-process (e.g., Lattimer & Schramm 1976; Freiburghaus et al. 1999; Korobkin et al. 2012). While this pathway may be important for higher metallicity stars, the rarity of these binaries and the long merging timescales suggests they are not important at low metallicities (Argast et al. 2004, although see Shen et al. 2015). In addition, a single compact binary merger typically produces a neutron-capture mass of (Goriely et al., 2011), which is far above the observed limit in UFDs. Thus, it appears CCSNe may be the most likely source of detected neutron-capture elements in UFDs discovered so far.
Lee et al. (2013) suggest that the difference between halo and UFD neutron-capture abundance distributions is a stochastic effect due to a small number of stars enriching UFDs combined with a strongly mass-dependent yield. This would imply that some UFDs should have members with neutron-capture abundance ratios above the halo mean. This has not been seen yet even though the number of stars observed with high-resolution spectroscopy in UFDs has roughly doubled compared to two years ago. Still, these additional data may not be enough to exclude the possibility of mass-dependent yields. However, there is also evidence that the Initial Mass Function (IMF) in UFDs is top-heavy (Geha et al., 2013). If neutron-capture elements are preferentially produced in core-collapse supernovae (e.g., Wanajo et al. 2003) then a biased IMF could suppress neutron-capture abundances in UFDs. Note that the galaxy would have to undergo at least one episode of self-enrichment for this bias to manifest itself in the surviving stars.
Signatures of first stars. As they are likely enriched by very few generations of stars, UFDs are a promising place to look for chemical signatures from the first stars (Ji et al., 2015). The CEMP signature in particular has attracted a lot of attention, with Pop III stars emerging as a strong candidate to produce these strange abundance signatures (see Norris et al. 2013 for a comprehensive overview). The four stars in Boo II have mild carbon overabundances (), but not beyond the CEMP threshold of . Compared to the halo stars, this is not too surprising: only of halo stars with are CEMP stars, and thus the probability that four stars with are all not CEMP is (Placco et al., 2014). In addition, when comparing to other UFD stars, stars with have at most mild carbon enhancements. It is only stars with that begin showing large [C/Fe] values. If most or all Pop III stars produce carbon-enhanced metal yields (e.g., Salvadori et al. 2015), this would suggest that the four stars we observed have additionally been enriched by some standard core-collapse supernovae. These could be either Pop III or Pop II supernovae, and a better understanding of Boo II’s metal enrichment history is needed to decide whether Boo II is a sufficiently unenriched system to cleanly study Pop III yields.
While UFD abundance patterns have traditionally been compared to abundances of Milky Way halo stars, there are now enough UFDs (defined as dwarf galaxies around the Milky Way with ) with chemical abundances to begin establishing their own abundance pattern. The halo is a complicated amalgam of stars from several different sources (e.g., small satellites, large satellites, heated disk stars, etc.), and the faintest dwarfs may be a more homogeneous population all probing a more specific time in cosmic history. Boo II exemplifies the emerging UFD abundance pattern, which is similar to the halo in all elements except the particularly low neutron-capture abundances. The chemical signature in more and more UFDs suggests they are clear candidates to be ancient survivors from the beginning of the universe, consistent with their star-formation histories (Brown et al., 2014).
References
- Alam et al. (2015) Alam, S., Albareti, F. D., Allende Prieto, C., et al. 2015, ApJS, 219, 12
- Alonso et al. (1999) Alonso, A., Arribas, S., & Martínez-Roger, C. 1999, A&AS, 140, 261
- Aoki et al. (2007) Aoki, W., Beers, T. C., Christlieb, N., et al. 2007, ApJ, 655, 492
- Argast et al. (2004) Argast, D., Samland, M., Thielemann, F.-K., & Qian, Y.-Z. 2004, A&A, 416, 997
- Asplund et al. (2009) Asplund, M., Grevesse, N., Sauval, A. J., & Scott, P. 2009, ARA&A, 47, 481
- Bernstein et al. (2003) Bernstein, R., Shectman, S. A., Gunnels, S. M., Mochnacki, S., & Athey, A. E. 2003, Proc. SPIE, 4841, 1694
- Bromm et al. (2001) Bromm, V., Ferrara, A., Coppi, P. S., & Larson, R. B. 2001, MNRAS, 328, 969
- Bromm & Loeb (2003) Bromm, V., & Loeb, A. 2003, Nature, 425, 812
- Brown et al. (2014) Brown, T. M., Tumlinson, J., Geha, M., et al. 2014, ApJ, 796, 91
- Casey (2014) Casey, A. R. 2014, ArXiv, arXiv:1405.5968
- Castelli & Kurucz (2004) Castelli, F., & Kurucz, R. L. 2004, ArXiv, astro-ph/0405087
- Cherchneff & Dwek (2010) Cherchneff, I., & Dwek, E. 2010, ApJ, 713, 1
- Clem et al. (2008) Clem, J. L., Vanden Berg, D. A., & Stetson, P. B. 2008, AJ, 135, 682
- Cooke & Madau (2014) Cooke, R. J., & Madau, P. 2014, ApJ, 791, 116
- Drlica-Wagner et al. (2015) Drlica-Wagner, A., Albert, A., Bechtol, K., et al. 2015, ApJ, 809, L4
- Fossati et al. (2014) Fossati, L., Kolenberg, K., Shulyak, D. V., et al. 2014, MNRAS, 445, 4094
- Frebel & Bromm (2012) Frebel, A., & Bromm, V. 2012, ApJ, 759, 115
- Frebel et al. (2013) Frebel, A., Casey, A. R., Jacobson, H. R., & Yu, Q. 2013, ApJ, 769, 57
- Frebel et al. (2006) Frebel, A., Christlieb, N., Norris, J. E., Aoki, W., & Asplund, M. 2006, ApJ, 638, L17
- Frebel et al. (2007) Frebel, A., Johnson, J. L., & Bromm, V. 2007, MNRAS, 380, L40
- Frebel et al. (2010a) Frebel, A., Kirby, E. N., & Simon, J. D. 2010a, Nature, 464, 72
- Frebel & Norris (2015) Frebel, A., & Norris, J. E. 2015, ARA&A, 53, 631
- Frebel et al. (2010b) Frebel, A., Simon, J. D., Geha, M., & Willman, B. 2010b, ApJ, 708, 560
- Frebel et al. (2014) Frebel, A., Simon, J. D., & Kirby, E. N. 2014, ApJ, 786, 74
- Freiburghaus et al. (1999) Freiburghaus, C., Rosswog, S., & Thielemann, F.-K. 1999, ApJ, 525, L121
- Frischknecht et al. (2012) Frischknecht, U., Hirschi, R., & Thielemann, F.-K. 2012, A&A, 538, L2
- Geha et al. (2013) Geha, M., Brown, T. M., Tumlinson, J., et al. 2013, ApJ, 771, 29
- Gilmore et al. (2013) Gilmore, G., Norris, J. E., Monaco, L., et al. 2013, ApJ, 763, 61
- Goriely et al. (2011) Goriely, S., Bauswein, A., & Janka, H.-T. 2011, ApJ, 738, L32
- Gustafsson et al. (2008) Gustafsson, B., Edvardsson, B., Eriksson, K., et al. 2008, A&A, 486, 951
- Ishigaki et al. (2014) Ishigaki, M. N., Aoki, W., Arimoto, N., & Okamoto, S. 2014, A&A, 562, A146
- Jacobson & Frebel (2014) Jacobson, H. R., & Frebel, A. 2014, Journal of Physics G Nuclear Physics, 41, 044001
- Ji et al. (2014) Ji, A. P., Frebel, A., & Bromm, V. 2014, ApJ, 782, 95
- Ji et al. (2015) —. 2015, MNRAS, 454, 659
- Jiang & van den Bosch (2015) Jiang, F., & van den Bosch, F. C. 2015, MNRAS, 453, 3575
- Jordi et al. (2006) Jordi, K., Grebel, E. K., & Ammon, K. 2006, A&A, 460, 339
- Kelson (2003) Kelson, D. D. 2003, PASP, 115, 688
- Kirby et al. (2013) Kirby, E. N., Cohen, J. G., Guhathakurta, P., et al. 2013, ApJ, 779, 102
- Kirby et al. (2008) Kirby, E. N., Simon, J. D., Geha, M., Guhathakurta, P., & Frebel, A. 2008, ApJ, 685, L43
- Koch et al. (2013) Koch, A., Feltzing, S., Adén, D., & Matteucci, F. 2013, A&A, 554, A5
- Koch et al. (2014) Koch, A., Hansen, T., Feltzing, S., & Wilkinson, M. I. 2014, ApJ, 780, 91
- Koch et al. (2008) Koch, A., McWilliam, A., Grebel, E. K., Zucker, D. B., & Belokurov, V. 2008, ApJ, 688, L13
- Koch & Rich (2014) Koch, A., & Rich, R. M. 2014, ApJ, 794, 89
- Koch et al. (2009) Koch, A., Wilkinson, M. I., Kleyna, J. T., et al. 2009, ApJ, 690, 453
- Korobkin et al. (2012) Korobkin, O., Rosswog, S., Arcones, A., & Winteler, C. 2012, MNRAS, 426, 1940
- Lattimer & Schramm (1976) Lattimer, J. M., & Schramm, D. N. 1976, ApJ, 210, 549
- Lee et al. (2013) Lee, D. M., Johnston, K. V., Tumlinson, J., Sen, B., & Simon, J. D. 2013, ApJ, 774, 103
- Lind et al. (2011) Lind, K., Asplund, M., Barklem, P. S., & Belyaev, A. K. 2011, A&A, 528, A103
- Lugaro et al. (2012) Lugaro, M., Karakas, A. I., Stancliffe, R. J., & Rijs, C. 2012, ApJ, 747, 2
- Martin et al. (2008) Martin, N. F., de Jong, J. T. A., & Rix, H.-W. 2008, ApJ, 684, 1075
- McConnachie (2012) McConnachie, A. W. 2012, AJ, 144, 4
- Norris et al. (2010a) Norris, J. E., Wyse, R. F. G., Gilmore, G., et al. 2010a, ApJ, 723, 1632
- Norris et al. (2010b) Norris, J. E., Yong, D., Gilmore, G., & Wyse, R. F. G. 2010b, ApJ, 711, 350
- Norris et al. (2013) Norris, J. E., Yong, D., Bessell, M. S., et al. 2013, ApJ, 762, 28
- Placco et al. (2014) Placco, V. M., Frebel, A., Beers, T. C., & Stancliffe, R. J. 2014, ApJ, 797, 21
- Roederer (2013) Roederer, I. U. 2013, AJ, 145, 26
- Roederer & Kirby (2014) Roederer, I. U., & Kirby, E. N. 2014, MNRAS, 440, 2665
- Roederer et al. (2014) Roederer, I. U., Preston, G. W., Thompson, I. B., Shectman, S. A., & Sneden, C. 2014, ApJ, 784, 158
- Roederer et al. (2010) Roederer, I. U., Sneden, C., Thompson, I. B., Preston, G. W., & Shectman, S. A. 2010, ApJ, 711, 573
- Safranek-Shrader et al. (2014) Safranek-Shrader, C., Milosavljević, M., & Bromm, V. 2014, MNRAS, 438, 1669
- Salvadori et al. (2015) Salvadori, S., Skúladóttir, Á., & Tolstoy, E. 2015, MNRAS, 454, 1320
- Schlafly & Finkbeiner (2011) Schlafly, E. F., & Finkbeiner, D. P. 2011, ApJ, 737, 103
- Shen et al. (2015) Shen, S., Cooke, R. J., Ramirez-Ruiz, E., et al. 2015, ApJ, 807, 115
- Simon et al. (2010) Simon, J. D., Frebel, A., McWilliam, A., Kirby, E. N., & Thompson, I. B. 2010, ApJ, 716, 446
- Simon & Geha (2007) Simon, J. D., & Geha, M. 2007, ApJ, 670, 313
- Simon et al. (2011) Simon, J. D., Geha, M., Minor, Q. E., et al. 2011, ApJ, 733, 46
- Sneden (1973) Sneden, C. A. 1973, PhD thesis, The University of Texas at Austin.
- Sobeck et al. (2011) Sobeck, J. S., Kraft, R. P., Sneden, C., et al. 2011, AJ, 141, 175
- Strigari et al. (2008) Strigari, L. E., Bullock, J. S., Kaplinghat, M., et al. 2008, Nature, 454, 1096
- Vargas et al. (2013) Vargas, L. C., Geha, M., Kirby, E. N., & Simon, J. D. 2013, ApJ, 767, 134
- Walsh et al. (2007) Walsh, S. M., Jerjen, H., & Willman, B. 2007, ApJ, 662, L83
- Walsh et al. (2008) Walsh, S. M., Willman, B., Sand, D., et al. 2008, ApJ, 688, 245
- Wanajo et al. (2003) Wanajo, S., Tamamura, M., Itoh, N., et al. 2003, ApJ, 593, 968
- Weisz et al. (2014) Weisz, D. R., Johnson, B. D., & Conroy, C. 2014, ApJ, 794, L3
- Wise et al. (2014) Wise, J. H., Demchenko, V. G., Halicek, M. T., et al. 2014, MNRAS, 442, 2560
- Yong et al. (2013) Yong, D., Norris, J. E., Bessell, M. S., et al. 2013, ApJ, 762, 26