Molecular clustering digitizes signaling and increases fidelity
Abstract
Many membrane-bound molecules in cells form small clusters. It has been hypothesized that these clusters convert an analog extracellular signal into a digital intracellular signal and that this conversion increases signaling fidelity. However, the mechanism by which clusters digitize a signal and the subsequent effects on fidelity remain poorly understood. Here we demonstrate using a stochastic model of cooperative cluster formation that sufficient cooperation leads to digital signaling. We show that despite reducing the number of output states, which decreases fidelity, digitization also reduces noise in the system, which increases fidelity. The tradeoff between these effects leads to an optimal cluster size that agrees with experimental measurements.
Introduction
Signaling at the cell membrane occurs in a highly organized manner. Many membrane-bound sensory molecules are not uniformly distributed, but instead exhibit a high degree of spatial patterning. A key example is found on the membranes of eukaryotic cells, where signaling proteins such as receptors, kinases, and GTPases form small clusters of order molecules [1, 2, 3, 4, 5]. These clusters are thought to be maintained by dimer and larger complex formation [6, 7, 8, 9], dynamical instabilities [10, 11], and features of the membrane environment such as cytoskeletal partitioning and lipid segregation [12, 13, 1]. Despite the prevalence of molecular clustering, the precise role of clustering in the signaling process remains unclear.
Here we investigate the possibility that clusters improve signal transmission by discretizing a continuous input signal. Previous experimental and computational work on the Ras GTPase [2, 14] and the CD59 receptor [3, 4] has suggested that clusters operate at saturation, meaning that each individual cluster produces a pulse of signaling output that is independent of the input stimulus and constant over the cluster lifetime. This observation has led to the speculation that clusters turn an “analog” (smooth) signal into a “digital” (step-like) signal [15]. However, explicit evidence of cluster-induced digitization, e.g. in dose-response curves, is lacking. Previous work has also demonstrated that operating at saturation allows the total signaling output to remain a linear function of the input [2, 14]. Linearity has then been identified with high signaling fidelity, leading to the speculation that clustering increases fidelity [15]. However, this definition of fidelity ignores noise in the signaling process. Low noise is a central requirement of any high-fidelity transmitter. Indeed, the importance of noise reduction has been recognized in the context of Ras clusters [9], but its relation to digital signaling and transmission fidelity has yet to be elucidated.
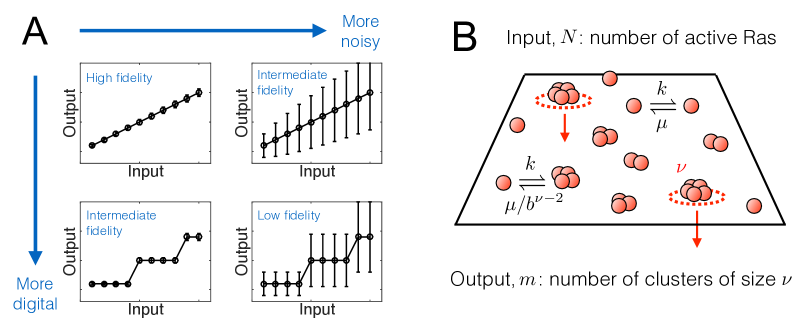
Intuitively, a high-fidelity signaling system should map many input states to distinct output states with as little noise as possible (Fig. 1A). From this perspective, the expected effects of digitization on fidelity are not immediately clear. On the one hand, digitizing an input-output curve reduces the number of output states because nearby inputs redundantly give the same output (compare the upper left and lower left panels in Fig. 1A). Therefore, just as pixelating an image reduces its recognizability, we might expect that digitizing a signal should reduce its fidelity. On the other hand, fidelity benefits from noise reduction (compare the upper left and upper right panels in Fig. 1A). Therefore, if digitizing concomitantly reduces noise in a signaling system, we might expect that digitizing a signal should increase its fidelity. The existence of both opposing factors makes it difficult to predict the effect of digitization on fidelity a priori.
We investigate the relationship among clustering, digitization, and fidelity using theory and stochastic simulation. We develop a minimal model for cluster formation based on the Ras signaling system, for which several key parameters are experimentally known. We quantify fidelity using the mutual information [16], which captures in a natural and principled way the aforementioned benefits of increasing the state space and reducing the noise. The fidelity is then the (log of the) number of input signals that can be uniquely and reliably mapped to an output. We find that with sufficient binding cooperativity, digital signaling emerges naturally. Associated with digital signaling is a noise reduction that initially increases the fidelity as a function of the cluster size. Ultimately, however, when the cluster size grows large, digitization reduces the number of available output states. The tradeoff between these two effects leads to an optimal cluster size that maximizes the signaling fidelity. Varying the only unknown model parameter reveals that the range of optimal cluster sizes is tightly constrained and agrees well with experimentally observed ranges. This suggests, in line with our related work on spatial partitioning [17], that protein clusters on cell membranes are tuned to maximize the transmission of signaling information.
Materials and Methods
We consider a minimal stochastic model in which clusters form by the sequential addition of monomers (see Fig. 1B):
| (1) |
The first reversible reaction describes the formation and dissociation of dimers. Subsequent reactions describe the addition of monomers one-by-one up to a maximum cluster size . Binding is cooperative, meaning that molecular affinity within a cluster increases with cluster size. We assume that the association rate is diffusion-limited, and therefore cooperativity is modeled by allowing the dissociation rate to decrease with cluster size. Specifically, dimers dissociate with rate , and each subsequent dissociation rate is reduced by a factor as the cluster size increases [18]. Thus there are two key parameters: sets the strength of cooperativity, and sets the maximum cluster size, independent of . Eq. 1 and similar models are well studied in the context of nucleation and growth processes, but typical treatments are deterministic (e.g. the Becker-Döring equations [19]). A more recent stochastic treatment has revealed interesting digitization phenomena [20]. Cooperativity was not considered, and importantly, the impact of signaling noise and the ensuing effects on signaling fidelity remain unexplored.
In the context of the Ras system, the monomers represent active Ras molecules. Ras molecules dimerize on the cell membrane [6, 7] with a measured dissociation constant of m-2 [6]. Ras is known to form not only dimers, but also larger clusters. Here we use the dimer data to set the basic timescale for cluster dissociation. Larger cluster formation is thought to be promoted by the presence of scaffolds [21, 22] or other proteins [8], as well as the confinement of molecules within cytoskeletal or lipid domains [23]. Stimulation of growth factor receptors increases the abundance of active Ras molecules. Thus we take the total number of active Ras molecules as the input parameter in our model. Our results are not sensitive to this choice: we later show that taking as our input parameter the rate of monomer activation, which is more directly a function of growth factor concentration, leads to similar results. Disruption of clustering leads to loss of downstream signaling, suggesting that the signal only propagates from clustered molecules [1, 2]. Thus we take the number of maximally sized clusters as the output of the model. Our results are also not sensitive to this choice: we later show that taking the number of clusters larger than a certain threshold as our output leads to similar results.
We simulate the reactions in Eq. 1 in stationary state using the Gillespie algorithm [24] (and later make analytic progress using the fact that Eq. 1 is a closed system in equilibrium). The two-dimensional diffusion-limited association rate is given by the measured diffusion coefficient of Ras molecules, m2/s [25, 6, 26], such that s-1. In a given simulation we take both and to be fixed, although as mentioned above we later relax both of these assumptions. Fixing is valid if clusters are limited in size, e.g. by available binding sites on a scaffold protein [21, 22]. Fixing is valid if (i) the total number of molecules in a reaction area changes slowly, e.g. if molecules are confined within a domain [27, 17]; and (ii) if either Ras deactivation is slow compared to clustering dynamics, or cluster formation and signaling is only weakly dependent on Ras activation state. We perform simulations for in the range , where molecules (we find qualitatively similar results for different values, with fidelity scaling as in general). Given the typical measured Ras densities of molecules/m2 [6, 2], this corresponds to a domain area of m2. We therefore set the association propensity to s-1.
Results
Cooperativity leads to digital signaling and increased fidelity
First we consider a single maximum cluster size and investigate the effects of cooperative binding. Fig. 2A illustrates the input-output response of our clustering model with and for several values of the cooperativity parameter . We see that as more molecules are added to the system, more clusters form. The number of clusters is a random variable, and therefore at a given molecule number there is a distribution of cluster numbers . In Fig. 2A we characterize each distribution by its mean and standard deviation, which illustrates not only the average response but also the associated noise.
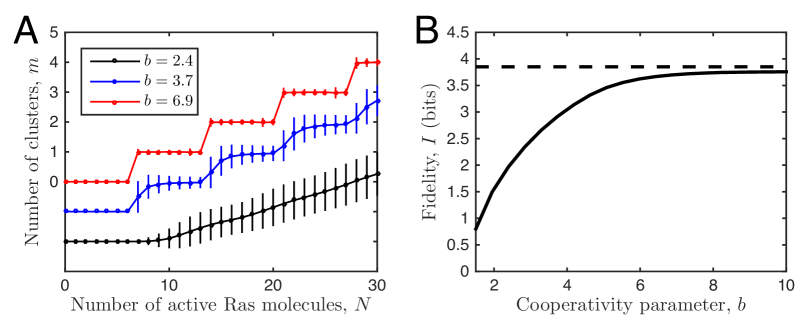
Fig. 2A demonstrates that at low cooperativity the response is analog (smooth), whereas at high cooperativity the response is digital (step-like). Therefore cooperativity is required for digital signaling in our model. The reason is that the propensity to form dimers, which is a necessary step to cluster formation in our model, is low: the forward propensity s-1 is much smaller than the backward propensity s-1. This means that among monomers and dimers alone, most molecules will be found in the monomer state. This result is supported by observations of Ras dimerization on lipid bilayers [6]. Thus without cooperativity, even if larger clusters are allowed, the monomer state will dominate. The effect of increasing cooperativity is to slow down dissociation from the larger clusters, and thereby push the system further into the maximally clustered state.
Then, when the majority of molecules are found in the maximally clustered state, the number of clusters becomes highly sensitive to the total number of molecules. Specifically, when the system contains less than molecules, no clusters can form, but when the system contains molecules exactly, one cluster forms with high probability. This effect continues as the number of molecules increases, such that with molecules, the maximum number of clusters form with high probability. The propensity for the system to form as many clusters as possible creates the digital signaling effect.
Fig. 2A also demonstrates that in addition to digitizing the signal, increasing cooperativity reduces the noise. This also makes sense in light of the above intuition: maximizing the propensity to cluster narrows the distribution of cluster number for a given total molecule number . In the extreme case, the system would form clusters with certainty, and the distribution would have zero noise. This is the key mechanism of noise reduction induced by digitization.
Fig. 2B shows the fidelity as a function of cooperativity. Fidelity is defined by the mutual information between the input and the output [16],
| (2) |
We take to be uniform, meaning that all possible values of from to are equiprobable. We see in Fig. 2B that the fidelity increases with cooperativity. This implies that for a given maximal cluster size, noise reduction outweighs the state-space reduction that is associated with digitization (Fig. 2A). That is, as cooperativity increases, even though fewer distinct output states can be transmitted, these states are far less noisy. The fidelity ultimately saturates with cooperativity, since in a noiseless system with uniform input the mutual information is given by the log of the number of output states, . This value is approached in the limit of high cooperativity (Fig. 2B) and mathematically is obtained from Eq. 2 in the limit where , and is divisible by .
Digital signaling results in an optimal cluster size
We next investigate how the signaling fidelity is affected by the cluster size. Fig. 3A shows the input-output response for several values of the cluster size . For small , the effect of cooperativity is insufficient to drive the system into the maximally clustered state. The input-output response is smooth and the noise is high (black curve in Fig. 3A). The high noise corresponds to low fidelity, as shown by the blue curve in Fig. 3B at small . However, as increases, the fraction of monomers that are in the maximally clustered state increases, and the input-output relation becomes digital (blue curve in Fig. 3A). The noise reduction associated with digital signaling leads to an increase in fidelity with , as shown by the blue curve in Fig. 3B at intermediate . Finally, as becomes large, only a few output states are possible, since only a few clusters can be populated (red curve in Fig. 3A). The state-space reduction leads to a decrease in fidelity with , as shown by the blue curve in Fig. 3B at large . The tradeoff between noise reduction and state-space reduction leads to the optimum in Fig. 3B at which the fidelity is maximal.
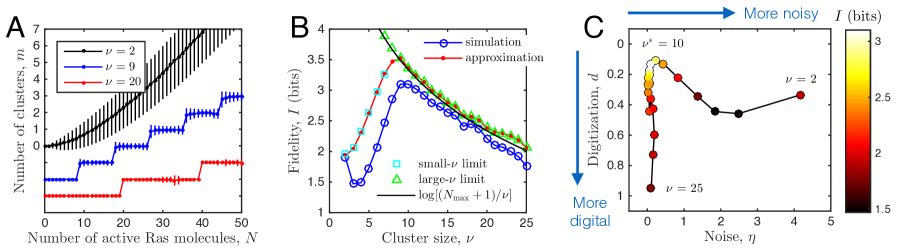
To elucidate these effects quantitatively, we derive analytic approximations to the cluster distribution and the fidelity . First, in the limit of large , we recognize that the system is almost entirely driven to the maximally clustered state, . Then, as above, the fidelity reduces to when is divisible by (Fig. 3B, black curve). A careful accounting of the available output states when is not divisible by leads to the refined expression
| (3) |
where is the remainder when is divided by . Eq. 3 is shown in Fig. 3B (green triangles) and accounts for the minor bumps in the fidelity at large that occur due to this effect of indivisibility.
To understand the limit of small , we seek a more general expression for the cluster distribution . In fact, the joint distribution over the numbers of all molecule types is obtained exactly by recognizing that Eq. 1 is a closed system in equilibrium. The joint probability is then given by the grand canonical distribution [28],
| (4) |
where , the constant is set by normalization, the free monomer number is set by molecule conservation, and is set by detailed balance: it is the ratio of the product of all forward rates to the product of all backward rates governing the formation of species . To obtain we would sum over all other molecule numbers, but this is difficult analytically. Therefore we make the approximation that at sufficiently high cooperativity all molecules are either in the monomer state or the maximally clustered state, i.e. . Then,
| (5) |
where is a new normalization constant. Intuitively, Eq. 5 is the stationary distribution corresponding to the effective scheme where cluster formation happens in one instantaneous step,
| (6) |
Fig. 3B (red curve) shows the fidelity computed using Eq. 5. We see that the approximation captures the key features seen in the simulation result, including the increase in with at small , the decrease at large , and the location of the optimum . We therefore turn to Eq. 5 to understand the benefit of noise reduction.
To approximate the noise in Eq. 5, we rewrite the factorials using Stirling’s approximation and expand to second order around its minimum to obtain the Gaussian noise . The result is that the mean satisfies the equation
| (7) |
and is given by
| (8) |
Eq. 7 is expected because it is the steady state of the macroscopic rate equation corresponding to Eq. 6. Eqs. 7 and 8 are validated in Fig. 3B by confirming that at small the fidelity computed numerically from the Gaussian approximation (cyan squares) agrees with that calculated analytically from Eq. 5 (red curve).
Because Eq. 7 is a polynomial equation of arbitrary degree, it is difficult to find a general expression for . Nonetheless, for small when the number of clusters is far from its maximum value , we can make the approximation . Expanding Eqs. 7 and 8 to first order in gives and , and therefore a signal-to-noise ratio of
| (9) |
Recalling that , we obtain . This expression is an increasing function of when , which is easily verified by differentiating the log. For example, setting and produces the range of small values . Thus we see that after a brief decrease, the SNR increases with . This behavior is consistent with the dependence of the fidelity on seen in Fig. 3B for . Indeed, this behavior is precisely the effect of noise reduction: except at the smallest values, increasing allows for higher cooperativity, thereby reducing the noise and causing the SNR (and in turn the fidelity) to increase with cluster size.
Finally, we demonstrate in Fig. 3C how varying the cluster size moves the system through the phase space suggested by Fig. 1A. We compute the average noise in the response and quantify the degree of digitization as , where . In these expressions, averages and maxima are over , and as above and are the -dependent mean and variance of . The digitization is the average deviation from the straight line from to , with the normalization ensuring that ranges from to . The value corresponds to a mean response that is completely analog and linear, while the value corresponds to a mean response that is a maximally digital two-state switch.
Fig. 3C demonstrates that as the cluster size increases, first the noise is reduced (), then the state space is reduced (). Optimal fidelity is achieved for an intermediate cluster size (), when the noise is low, but the digitization is not so severe that too few states are available. Such a “fine” degree of digitization, wherein each cluster signals digitally but there are many clusters (see the blue curve in Fig. 3A), has been described as a “digital-analog” system, such that clusters act collectively as an “analog-to-digital-to-analog” (ADA) converter of an external analog signal [2, 15, 29]. Our results demonstrate explicitly and quantitatively that this ADA regime is optimal for signaling fidelity.
Optimum is robust to model assumptions
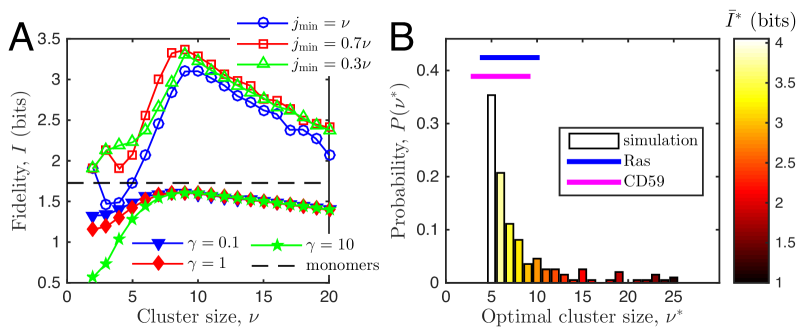
We now relax both model assumptions, namely that and are fixed. Allowing to vary means that signaling is no longer restricted to only the clusters of maximal size . Instead, we allow clusters of many sizes to signal. Specifically, we define a threshold such that all clusters with can signal, and we then vary . We continue to use to denote the number of clusters that signal downstream, and we compute the fidelity as before. Fig. 4A shows that the presence of an optimum is robust to the choice of . In fact, the optimum persists even when is as low as , for which clusters of almost any size can signal downstream.
Allowing to vary corresponds to accounting for the upstream process by which Ras molecules are activated and deactivated. For simplicity, we incorporate upstream activation using the approximate model in Eq. 6. We allow Ras molecules to be activated from a large pool of inactive molecules at a constant rate, in bursts of size , and deactivated at a constant rate . Deactivation can occur within a cluster, at which point the cluster dissociates into the remaining active monomers. Together with Eq. 6, we have
| (10) |
The first two reactions describe the gain and loss of active Ras molecules , respectively. The activation rate is defined such that the mean number of molecules is . Therefore, is now the mean of a fluctuating number of molecules, instead of the fixed total number of molecules. The third reaction describes the dissociation of a cluster when any one of the monomers deactivates with rate . As before we compute the fidelity .
Fig. 4A shows that the optimum persists in this model with upstream activation dynamics. The overall value of the fidelity is reduced in this model, which makes sense since the upstream activation process introduces additional input fluctuations into the system. We also see that fidelity decreases as increases, because larger promotes cluster break-up via the third reaction in Eq. 10. Fewer clusters means a narrower output range, and thus a decreased fidelity. While increasing decreases fidelity because of cluster break-up, we also find that larger makes clustering more beneficial than signaling via the monomers themselves, as detailed further in the Discussion. Altogether, Fig. 4A demonstrates that the presence of an optimal cluster size , as well as its value, is robust to the model assumptions.
Optimal cluster size agrees with experiments
What sets the value of the optimal cluster size ? The only unknown parameter in the model of Eq. 1 is the cooperativity , and indeed varies with . However, even when is varied over two orders of magnitude, the majority of high-fidelity values remain within the range (Fig. 4B). The lower bound occurs because even for very large , a minimum number of binding events is required for cooperativity to take effect and drive the system to the clustered state. The upper bound occurs because although very small leads to larger values of , these solutions then suffer from low fidelity due to the unavoidable state-space reduction at large (Fig. 3B). Together these effects keep tightly constrained within the range . Interestingly, this range agrees remarkably well with cluster sizes observed in experiments, both for Ras and the CD59 protein (Fig. 4B).
It is worth emphasizing that Fig. 4B contains no free parameters. All parameters that are not optimized or varied are taken from measurements of Ras density, diffusion, and dissociation. Therefore, the agreement of the model predictions with the experimental cluster size data in Fig. 4B presents strong evidence that clustered sensory molecules are tuned to maximize fidelity via digital signaling.
Discussion
We have seen that cooperative molecular clustering leads to digital signaling and increased signaling fidelity. The increase in fidelity is surprising, because digitization reduces the number of available output states, which makes many input values redundant. Alone, this effect would reduce fidelity. However, this effect is compensated by a noise reduction that accompanies digital signaling. Noise reduction increases fidelity. The tradeoff between state-space reduction and noise reduction results in an optimal cluster size that maximizes signaling fidelity. The range of optimal cluster sizes predicted by the model with no free parameters agrees strikingly well with data on the Ras and CD59 systems.
In our model, the number of clusters increases roughly linearly with the total number of molecules , both for analog and digital signals (Fig. 2A and Fig. 3A). It has been argued that an equilibrium model, such as Eq. 6, would not yield a linear relationship because mass-action kinetics imply a sharp polynomial increase of with the free monomer number [2, 9]. Indeed, this polynomial dependence appears directly in Eq. 7. However, because the total molecule number is fixed, , even though increases sharply with , it does not necessarily increase sharply with . Instead, we find that increases roughly linearly with . Therefore, our results imply that if the total molecule number is fixed or varies sufficiently slowly, an equilibrium model can produce a linear input-output relationship, which has been argued to be necessary to explain clustering data in the Ras system [1, 2].
Our model predicts that due to cooperativity, the typical cluster lifetime is longer than the typical dimer lifetime. We estimated the dimer lifetime from Ras dissociation and density data [6] to be ms. On the other hand, the cluster lifetime is set by the rate-limiting step for cluster dissociation, (Eq. 1). This time is longer than ms: for example, with typical values and we would predict s. Indeed, cluster lifetimes inferred from transient immobility data are also on the order of tenths of seconds, not a millisecond: for Ras s [8, 29] and for CD59 s [3, 4]. This agreement with experiments supports the model presented here, and it also raises the interesting question of what are the benefits and limitations of longer-lived clusters.
We have found that an optimal cluster size in the range of about to molecules allows for higher fidelity than any other cluster size. Does it allow for higher fidelity than a strategy of not clustering at all, and instead signaling using monomers only? To investigate the scenario in which signaling proceeds via monomers (instead of larger clusters), we consider a system consisting of only the reactions in Eq. 10, thus without those describing cluster formation. The output in this scenario is simply the active monomer number, and the fidelity is computed from the stationary distribution . In Fig. 4A, for example, the fidelity is bits (black dashed line). This is higher than the fidelity with clustering (filled symbols), meaning that clustering is not the optimal strategy. In general, we find that clustering is only the optimal strategy at large , , and in Eqs. 6 and 10. Large is expected because then monomer activation is bursty and thus noisy. Large is also expected because then the monomer activation dynamics are faster than the cluster formation dynamics, and clustering integrates over the upstream noise. The benefit of integration persists despite the fact that large promotes cluster break-up as described in the previous section. Finally, large keeps the mean cluster number high, which is necessary for a large output range and thus high fidelity. Outside of this regime, clustering may have additional advantages over using only monomers, such as introducing a delay from a millisecond to tenths of a second as described above, which could prevent premature propagation of a spurious input signal. Given that clustering occurs, our study shows that an optimal cluster size exists, is robust to modeling assumptions, is tightly constrained, and agrees with experimental estimates.
Our results relate to recent findings on the accuracy of sensing a single, constant input concentration using cooperative cluster formation. In equilibrium systems, such as the system studied here (Eq. 1), it has been shown that cooperativity increases sensing accuracy [31]. Indeed, we also find here that accuracy is maximized in the limit of maximal cooperativity (Fig. 2B). It was also found that in equilibrium systems, accuracy is maximized in the limit of maximal cluster size [31], which would correspond to here. However, we do not find here. Instead we find a finite optimal . The reason is that we do not maximize the accuracy of sensing a single input, but rather a range of inputs. While a large cluster size allows a system to measure one input very reliably, it also reduces the number of inputs that can be measured. This tradeoff leads to the optimal cluster size . Finally, in contrast to purely equilibrium systems, it has been shown in the context of an Ising-like model of receptor activation in the bacterial chemotaxis system that in non-equilibrium systems that time-integrate the receptor dynamics [33, 32], cooperativity does not improve sensing accuracy. The reason is that cooperativity not only increases the gain, but also slows down the receptor dynamics. The slowing down then actually decreases the time-averaged accuracy [33, 32], unlike in equilibrium systems, which do not time-integrate the receptor dynamics but rather rely on an instantaneous readout of the receptor [31]. As mentioned above, we also find here that clustering slows down the dynamics, and for the same reason this may hamper time-integrated sensing accuracy downstream. We leave the question of how the downstream system integrates the Ras clustering dynamics as an interesting topic for future work.
The mechanism we investigate likely integrates with other features of the Ras system that contribute to high-fidelity signaling. For example, it is been shown that enzyme-mediated positive feedback leads to digital, two-state activation of Ras [34], which could very well enhance the subsequent cluster-induced digitization elucidated here. Moreover, confinement alone, even without cooperative binding, has been shown to increase the fidelity of Ras signaling [17], and clustering could therefore further enhance this effect. Clustering also enhances downstream signal propagation in the Ras-mediated mitogen-activated protein kinase cascade [35]. It will be interesting to explore how these mechanisms are integrated, as well as the extent to which cluster-driven digitization occurs across other domains of biology.
Acknowledgements
We thank Nils Becker and Aleksandra Walczak for useful comments on the manuscript.
References
- [1] Sarah J Plowman, Cornelia Muncke, Robert G Parton, and John F Hancock. H-ras, k-ras, and inner plasma membrane raft proteins operate in nanoclusters with differential dependence on the actin cytoskeleton. Proc Natl Acad Sci USA, 102(43):15500–5, Oct 2005.
- [2] Tianhai Tian, Angus Harding, Kerry Inder, Sarah Plowman, Robert G Parton, and John F Hancock. Plasma membrane nanoswitches generate high-fidelity ras signal transduction. Nat Cell Biol, 9(8):905–14, Aug 2007.
- [3] Kenichi GN Suzuki, Takahiro K Fujiwara, Fumiyuki Sanematsu, Ryota Iino, Michael Edidin, and Akihiro Kusumi. Gpi-anchored receptor clusters transiently recruit lyn and g for temporary cluster immobilization and lyn activation: single-molecule tracking study 1. The Journal of cell biology, 177(4):717–730, 2007.
- [4] Kenichi GN Suzuki, Takahiro K Fujiwara, Michael Edidin, and Akihiro Kusumi. Dynamic recruitment of phospholipase c at transiently immobilized gpi-anchored receptor clusters induces ip3–ca2+ signaling: single-molecule tracking study 2. The Journal of cell biology, 177(4):731–742, 2007.
- [5] Nicholas Ariotti, Hong Liang, Yufei Xu, Yueqiang Zhang, Yoshiya Yonekubo, Kerry Inder, Guangwei Du, Robert G Parton, John F Hancock, and Sarah J Plowman. Epidermal growth factor receptor activation remodels the plasma membrane lipid environment to induce nanocluster formation. Molecular and cellular biology, 30(15):3795–3804, 2010.
- [6] Wan-Chen Lin, Lars Iversen, Hsiung-Lin Tu, Christopher Rhodes, Sune M Christensen, Jeffrey S Iwig, Scott D Hansen, William YC Huang, and Jay T Groves. H-ras forms dimers on membrane surfaces via a protein–protein interface. Proceedings of the National Academy of Sciences, 111(8):2996–3001, 2014.
- [7] Jörn Güldenhaupt, Till Rudack, Peter Bachler, Daniel Mann, Gemma Triola, Herbert Waldmann, Carsten Kötting, and Klaus Gerwert. N-ras forms dimers at popc membranes. Biophysical journal, 103(7):1585–1593, 2012.
- [8] Hideji Murakoshi, Ryota Iino, Takeshi Kobayashi, Takahiro Fujiwara, Chika Ohshima, Akihiko Yoshimura, and Akihiro Kusumi. Single-molecule imaging analysis of Ras activation in living cells. Proc. Natl. Acad. Sci., 101(19):7317–22, May 2004.
- [9] Thomas Gurry, Ozan Kahramanogulları, and Robert G. Endres. Biophysical Mechanism for Ras-Nanocluster Formation and Signaling in Plasma Membrane. PLoS ONE, January 2009.
- [10] Jayajit Das, Mehran Kardar, and Arup K Chakraborty. Positive feedback regulation results in spatial clustering and fast spreading of active signaling molecules on a cell membrane. J. Chem. Phys, 130:245102, 2009.
- [11] Martijn Wehrens, Pieter Rein ten Wolde, and Andrew Mugler. Positive feedback can lead to dynamic nanometer-scale clustering on cell membranes. The Journal of chemical physics, 141(20):205102, 2014.
- [12] Akihiro Kusumi, Chieko Nakada, Ken Ritchie, Kotono Murase, Kenichi Suzuki, Hideji Murakoshi, Rinshi S Kasai, Junko Kondo, and Takahiro Fujiwara. Paradigm shift of the plasma membrane concept from the two-dimensional continuum fluid to the partitioned fluid: high-speed single-molecule tracking of membrane molecules. Annu. Rev. Biophys. Biomol. Struct., 34:351–378, 2005.
- [13] Ian A Prior, Cornelia Muncke, Robert G Parton, and John F Hancock. Direct visualization of ras proteins in spatially distinct cell surface microdomains. J. Cell Biol., 160(2):165–70, Jan 2003.
- [14] M Ángeles Serrano, Manuel Jurado, and Ramon Reigada. Negative feedback self-regulation contributes to robust and high-fidelity transmembrane signal transduction. Journal of The Royal Society Interface, 10(88):20130581, 2013.
- [15] Boris N Kholodenko, John F Hancock, and Walter Kolch. Signalling ballet in space and time. Nat Rev Mol Cell Biol, 11(6):414–26, Jun 2010.
- [16] C. E. Shannon. A Mathematical Theory of Communication. Bell Syst. Tech. J., 27:379–423, 623–656, 1948.
- [17] Andrew Mugler, Filipe Tostevin, and Pieter Rein ten Wolde. Spatial partitioning improves the reliability of biochemical signaling. Proc. Natl. Acad. Sci., 110(15):5927–32, Apr 2013.
- [18] Thorsten Erdmann, Martin Howard, and Pieter Rein Ten Wolde. Role of spatial averaging in the precision of gene expression patterns. Physical review letters, 103(25):258101, 2009.
- [19] Dimo Kashchiev. Nucleation. Butterworth-Heinemann, 2000.
- [20] MR D’Orsogna, Greg Lakatos, and Tom Chou. Stochastic self-assembly of incommensurate clusters. The Journal of chemical physics, 136(8):084110, 2012.
- [21] Liron Belanis, Sarah J Plowman, Barak Rotblat, John F Hancock, and Yoel Kloog. Galectin-1 is a novel structural component and a major regulator of h-ras nanoclusters. Molecular biology of the cell, 19(4):1404–1414, 2008.
- [22] Ruby Shalom-Feuerstein, Sarah J Plowman, Barak Rotblat, Nicholas Ariotti, Tianhai Tian, John F Hancock, and Yoel Kloog. K-ras nanoclustering is subverted by overexpression of the scaffold protein galectin-3. Cancer research, 68(16):6608–6616, 2008.
- [23] Hernán E Grecco, Malte Schmick, and Philippe I H Bastiaens. Signaling from the living plasma membrane. Cell, 144(6):897–909, Mar 2011.
- [24] Daniel T Gillespie. Exact stochastic simulation of coupled chemical reactions. The journal of physical chemistry, 81(25):2340–2361, 1977.
- [25] Piet H M Lommerse, B Ewa Snaar-Jagalska, Herman P Spaink, and Thomas Schmidt. Single-molecule diffusion measurements of H-Ras at the plasma membrane of live cells reveal microdomain localization upon activation. J. Cell Sci., 118(Pt 9):1799–809, May 2005.
- [26] Sharon Eisenberg, Alison J Beckett, Ian A Prior, Frank J Dekker, Christian Hedberg, Herbert Waldmann, Marcelo Ehrlich, and Yoav I Henis. Raft protein clustering alters N-Ras membrane interactions and activation pattern. Mol. Cell. Biol., 31(19):3938–52, October 2011.
- [27] Kotono Murase, Takahiro Fujiwara, Yasuhiro Umemura, Kenichi Suzuki, Ryota Iino, Hidetoshi Yamashita, Mihoko Saito, Hideji Murakoshi, Ken Ritchie, and Akihiro Kusumi. Ultrafine membrane compartments for molecular diffusion as revealed by single molecule techniques. Biophysical journal, 86(6):4075–4093, 2004.
- [28] N G van Kampen. Stochastic Processes in Physics and Chemistry. North-Holland Personal Library, Amsterdam, 3rd edition, 2007.
- [29] Yong Zhou and John F Hancock. Ras nanoclusters: Versatile lipid-based signaling platforms. Biochimica et Biophysica Acta (BBA)-Molecular Cell Research, 2014.
- [30] Lorant Janosi, Zhenlong Li, John F Hancock, and Alemayehu A Gorfe. Organization, dynamics, and segregation of ras nanoclusters in membrane domains. Proceedings of the National Academy of Sciences, 109(21):8097–8102, 2012.
- [31] Christopher C Govern and Pieter Rein ten Wolde. Energy dissipation and noise correlations in biochemical sensing. Physical review letters, 113(25):258102, 2014.
- [32] Monica Skoge, Sahin Naqvi, Yigal Meir, and Ned S Wingreen. Chemical sensing by nonequilibrium cooperative receptors. Physical review letters, 110(24):248102, 2013.
- [33] Monica Skoge, Yigal Meir, and Ned S Wingreen. Dynamics of cooperativity in chemical sensing among cell-surface receptors. Physical review letters, 107(17):178101, 2011.
- [34] Jayajit Das, Mary Ho, Julie Zikherman, Christopher Govern, Ming Yang, Arthur Weiss, Arup K Chakraborty, and Jeroen P Roose. Digital signaling and hysteresis characterize ras activation in lymphoid cells. Cell, 136(2):337–51, January 2009.
- [35] Andrew Mugler, Aimee Gotway Bailey, Koichi Takahashi, and Pieter Rein ten Wolde. Membrane clustering and the role of rebinding in biochemical signaling. Biophys. J., 102(5):1069–78, Mar 2012.