Planetary Nebulae and their parent stellar populations. Tracing the mass assembly of M87 and Intracluster light in the Virgo cluster core
Abstract
The diffuse extended outer regions of galaxies are hard to study because they are faint, with typical surface brightness of of the dark night sky. We can tackle this problem by using resolved star tracers which remain visible at large distances from the galaxy centers. This article describes the use of Planetary Nebulae as tracers and the calibration of their properties as indicators of the star formation history, mean age and metallicity of the parent stars in the Milky Way and Local Group galaxies . We then report on the results from a deep, extended, planetary nebulae survey in a deg2 region centered on the brightest cluster galaxy NGC 4486 (M87) in the Virgo cluster core, carried out with SuprimeCam@Subaru and FLAMES-GIRAFFE@VLT. Two PN populations are identified out to 150 kpc distance from the center of M87. One population is associated with the M87 halo and the second one with the intracluster light in the Virgo cluster core. They have different line-of-sight velocity and spatial distributions, as well as different planetary nebulae specific frequencies and luminosity functions. The intracluster planetary nebulae in the surveyed region correspond to a luminosity of four times the luminosity of the Large Magellanic Cloud. The M87 halo planetary nebulae trace an older, more metal-rich, parent stellar population. A substructure detected in the projected phase-space of the line-of-sight velocity vs. major axis distance for the M87 halo planetary nebulae provides evidence for the recent accretion event of a satellite galaxy with luminosity twice that of M33. The satellite stars were tidally stripped about Gyr ago, and reached apocenter at a major axis distance of kpc from the center of M87. The M87 halo is still growing significantly at the distances where the substructure is detected.
keywords:
Stars: AGB and post-AGB. (ISM) Planetary nebulae: general. Galaxies: general, abundances, Virgo cluster, elliptical and lenticular, cD, halos, formation, NGC 4486, kinematics and dynamics, structure.1 Introduction
Accretion events are believed to be responsible for the build up of stellar halos in elliptical galaxies ([Delucia & Blaziot 2007, Delucia & Blaizot 2007]) at relatively low redshift (; [Oser et al. 2010, Oser et al. 2010]). In the dynamical centers of galaxy clusters, brightest cluster galaxies (BCGs) are expected to have the majority of their stars accreted ([Cooper et al. 2015, Cooper et al. 2015]). The galaxy NGC 4486 (M87) is one of the nearest BCGs (at D=14.5 Mpc) in the densest region of the Virgo cluster ([Binggeli et al. 1987, Binggeli et al. 1987]). Its halo represents a benchmark for studies of the assembly history of extended halos in high density environments. Because of the large orbital time in their outer regions, these halos may still contain fossil records of the mass accretion events that lead to their hierarchical build up.
M87 has been the target of several imaging surveys and its close proximity made it possible to identify planetary nebulae (PNs) with 8 meter class telescopes ([Arnaboldi et al. 2003, Arnaboldi et al. 2003], [Aguerri et al. 2005, Aguerri et al. 2005], [Castro-Rodriguez et al. 2009, Castro-Rodriguez et al. 2009]). The goal is to use PN as kinematic tracers and their general PN population properties as probes for star formation history, age and metallicity of the parent stellar population in those regions of M87 where the surface brightness is too low to carry out absorption line spectroscopy.
In the next sections, we present a concise summary of the general characteristics of PN population as tracers of stars and motions in galaxies and then describe the results from the extended PN survey in M87.
2 General properties of PN population
PNs are the final evolutionary stage for most stars in the mass range . In the Milky Way (MW), about 95% of the stars will end their lives as PNs, while only 5% explode as supernovae. The PN phase lasts years at most, and its duration depends on the age and metallicity of the parent stellar population ([Buzzoni et al. (2006), Buzzoni et al. 2006]). is also related to the expansion time of a nebular shell , where is the diameter and is the expansion velocity of a PN shell; typical expansion velocities for the brightest PNs are in the range kms-1 ([Arnaboldi et al. 2008, Arnaboldi et al. 2008]). could be shortened by the presence of a hot interstellar medium ([Dopita et al. 2000, Dopita et al. 2000], [Villaver & Stanghellini 2005, Villaver & Stanghellini 2005]) which may remove the gaseous shell during its expansion.
Because the diffuse nebula around the core is very efficient in re-emitting of the UV energy radiated by the central star in the optical Oxygen forbidden line [OIII] at Å [which is the brightest optical emission of a PN ([Dopita et al. (1992), Dopita et al. 1992])], PN stars can be efficiently selected via narrow band imaging centered on the Oxygen line.
There are about 2000 PNs known out of 200 billion stars in the MW, and they are mostly concentrated towards the MW plane. A typical Galactic PN has an average shell diameter of about pc. Hence when a sample of PNs similar to those in the MW are detected in external galaxies at distances larger than Mpc, they are identified as spatially unresolved emissions of monochromatic green light at 5007Å.
The integrated [OIII] flux of a spatially unresolved PN can be expressed as magnitude via the formula:
| (1) |
([Jacoby 1989, Jacoby 1989]). Narrow band imaging of external galaxies provide magnitudes for the entire PN population of the surveyed galaxy, down to a given limiting flux. It is then possible to derive the Planetary Nebulae luminosity function (PNLF) for that PN population at the galaxy distance. The PNLF has been used extensively as secondary distance indicator in early and late-type galaxies within Mpc distance (see [Ciardullo+2002, Ciardullo et al. (2002)] for a review). The PNLF is often approximated by an analytical formula given by
| (2) |
as introduced by [Ciardullo et al. 1989, Ciardullo et al. (1989)], where is the absolute magnitude of the bright cut-off of the PNLF ([Ciardullo et al. 1998, Ciardullo et al. 1998]). This analytical formula is the product of two exponential terms: the first term can be thought of as the dimming of the [OIII] flux as the shell expands at uniform speed ([Heinze & Westerlund (1963), Heinze & Westerlund 1963]), and the second term models the cut-off at bright magnitudes. Hence the formula in Eq. 2 describes a PN population as an ensemble of diffuse expanding shells powered by unevolving massive cores, all at about , which are emitting a total luminosity of ([Ciardullo+2002, Ciardullo et al. 2002]).
Simple stellar population theory predicts that PN cores should become fainter as the stellar population ages, with core masses as low as in a 10 Gyr old, solar-enriched, stellar population ([Buzzoni et al. (2006), Buzzoni et al. 2006]). [Marigo+2004, Marigo et al. (2004)] computed a relative dimming of 4 magnitudes for the bright cut-off of the PNLF for a 10 Gyr old population with respect to that of a 1 Gyr old population. Such a strong dependence of on age is not observed though: empirically, the absolute magnitude of the PNLF bright cut-off is the same for PN populations in star forming disks and in ellipticals ([Longobardi et al. 2013, Longobardi et al. (2013)]). A possible explanation is that binary stars are progenitors to the brightest PNs in old populations ([Ciardullo et al. 2005, Ciardullo et al. 2005]). Still there may be systematic variations of the PNLF that correlate with the star formation history, mean age and metallicity of the parent stellar population, which can be used to constrain their values and any spatial variations in extended stellar halos.
2.1 PN visibility lifetime and luminosity functions in the Milky Way and Local Group galaxies
PN specific frequency - The total number of PNs associated with the bolometric luminosity of a parent stellar population is expressed as , where is the PN specific frequency. The value of the parameter is related to the normalization in Eq. 2; i.e. to the observed total number of PNs of a given detected population. The value of is related to the PN visibility lifetime by the equation
| (3) |
where (independent of the stellar population) is the PN formation rate (stars/yr/; [Buzzoni et al. (2006), Buzzoni et al. 2006]). The measured values for the parameter show strong scatter for stellar populations redder than ([Coccato et al. 2009, Coccato et al. 2009], [Cortesi et al. 2013, Cortesi et al. 2013]) with an inverse correlation with the far ultraviolet (FUV) color excess, that is stellar populations with a strong FUV excess are PN-starved. Stellar populations with an UV up-turn or FUV color excess are the old and metal rich populations in massive elliptical galaxies. Differently, stellar populations in irregular galaxies like the LMC are PN-rich. In general PN populations show systematic variations of the values with the integrated photometric properties of the parent stellar population, hence variations of the measured values as function of radius in an extended stellar halo can be used as a signal for different stellar populations in the halo.
PNLF morphology - The PNLF shows systematic variations that correlate with the average age and metallicity of the parent stellar population. In the vs. plot, the gradient of the PNLF within magnitude below the brightest can be steeper or shallower than (as in Eq. 2). The PN population associated with the MW bulge has a steeper PNLF than that derived for the M31 PNs (Arnaboldi et al. 2015, in prep.), while those in the outer regions of star-forming disks have a shallower or no gradient ([Ciardullo et al. 2004, Ciardullo et al. 2004]). [Longobardi et al. 2013, Longobardi et al. 2013] proposed a generalized formula for the PNLF according to the equation
| (4) |
where is related to the value of the parameter to first order and is related to the gradient of the at faint magnitudes. We are planning to apply the generalized formula to complete and extended PN populations and to correlate the derived values with the mean ages and metallicities of the parent stellar populations from spectroscopic measurements, so that we can have a better calibration of the PN probes.
In addition to the gradient, the PNLF of stellar population in low luminosity - metal poor galaxies - shows the presence of a dip. This feature of the PNLF is measured with high significance in the well sampled PNLF for the LMC ([Reid & Parker 2010, Reid & Parker 2010]), the SMC ([Jacoby & De Marco 2002, Jacoby & De Marco (2002)]), NGC 6822 ([Hernández-Martínez & Peña 2009, Hernández-Martínez & Peña 2009]) and in the outer regions of M33 ([Ciardullo et al. 2004, Ciardullo et al. 2004]). This dip falls within an interval of to magnitudes below , but the magnitude at which the dip is detected varies between the PN populations sampled in the Local Group.
Strategy - we can use the global properties of the PN populations, their PNLFs, the gradients, dips and values to signal transition from old/metal-rich to fading/metal-poor populations when the individual stars cannot be resolved or their surface brightness is too low to carry out integrated light photometry or absorption line spectroscopy.
3 The PN populations in the Virgo cluster core
In 2010 we started an imaging survey with SuprimeCam@Subaru to cover deg2 in the M87 halo; at the distance of the Virgo cluster (D=14.5 Mpc) this is equivalent to an area of ( kpc)2. We wanted to use the general properties described in Sec. 2 to study its stellar population and kinematics.
We acquired deep narrow band images centered on the [OIII] emission redshifted to the systemic velocity of M87 ( kms-1) and deep off-band images in the V-band. We identified PN candidates as spatially unresolved [OIII] sources with no continuum following the procedure described in [Arnaboldi et al. 2002, Arnaboldi et al. (2002)]. The final magnitude limited catalog consisted of PN candidates down to 2.5 magnitude from the brightest PN ([Longobardi et al. 2013, Longobardi et al. 2013]). We then carried out the spectroscopic follow-up with FLAMES/GIRAFFE@VLT to acquire spectra for these candidates. We obtained spectra for confirmed PNs ([Longobardi et al. 2015a, Longobardi et al. 2015a]) which we analyzed together with previous identified PNs from [Doherty et al. 2009, Doherty et al. (2009)], for a total combined sample of PNs.
We built the line-of-sight velocity distribution (LOSVD) for the whole PN sample: this is shown in Fig. 1. The LOSVD is characterized by a strong peak at kms-1 and a second moment kms-1, with large asymmetric wings, with a tail extended towards zero and negative LOS velocities. These wings can be modeled with a broad Gaussian component, centered at kms-1 and kms-1.
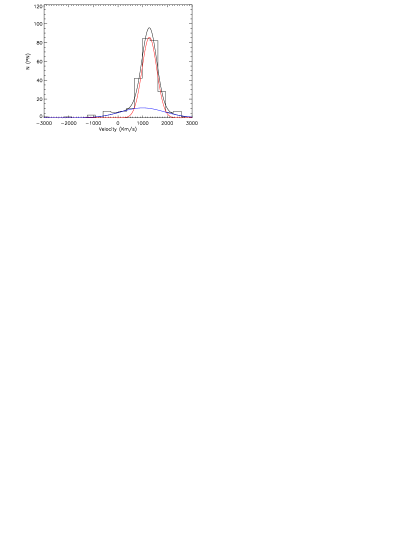
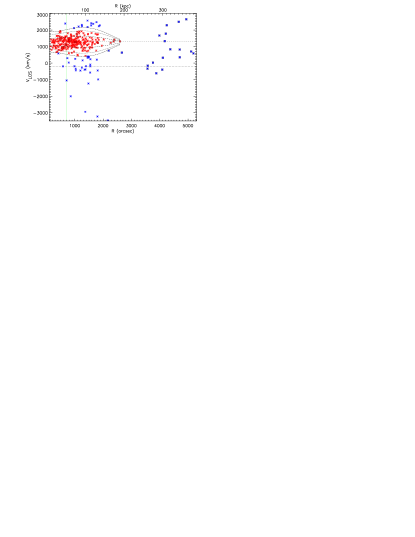
The narrow component is consistent with the LOSVD for the stars in the M87 halo, while the broad component has a LOSVD similar to that of Virgo cluster galaxies. We thus selected the M87 halo PNs as those associated with the narrow component in the LOSVD by means of a robust iterative procedure ([Longobardi et al. 2015a, Longobardi et al. 2015a]). The PNs in the broad asymmetric wings of the LOSVD are thereby tagged as Virgo intracluster (IC) PNs. In Figure 2 we show the projected phase space diagram for the 301 PNs around M87 and the additional ICPNs from [Doherty et al. 2009, Doherty et al. (2009)].
We studied the spatial distribution of the two selected PN samples and compared their profiles with the V band photometry of M87 by [Kormendy et al. 2009, Kormendy et al. (2009)]. The number density profile of the M87 halo PNs follows the Sersic surface brightness profile, while that of the ICPNs follows a much flatter radial profile, which is consistent with a power law, with . By scaling the M87 PN density profile to the inner regions we derived the value of the parameter for the M87 PN halo population: . The value of the parameter for the intracluster light is different: the same procedure applied to the ICPN number density profile returns .
We then compared our and values with those for PN populations in nearby galaxies. Galaxies with have PN specific frequency values similar to that of . For redder galaxies, the scatter increases; the value of is the same as for populations with an FUV excess that are PN-starved. Hence the IC component contributes three times more PN per unit bolometric luminosity than the M87 halo light, signaling a change of population from halo to ICL. This transition is consistent with the existence of a color gradient towards bluer colors in M87 at large radii ([Rudick et al. 2010, Rudick et al. 2010]), and an ICL population that is mostly old (age Gyr) with a mean metallicity of ([Williams et al. 2007, Williams et al. 2007]).
On the basis of the kinematic separation of the M87 halo and intracluster PNs, we built the two independent PNLFs, and examined them in turn. The PNLF for the M87 halo PNs is steeper than in Eq. 2. We used the generalized formula from Eq. 4 and derived and a distance modulus of . The PNLF of the ICPNs shows a dip at mag below , reminiscent of the morphology of the PNLF observed in PN populations associated with low luminosity/metal poor galaxies. We fitted the generalized PNLF formula to the PNLF of the ICPNs, and found and a distance modulus of .
We could estimate the luminosity associated with the ICPNs by integrating the ICL surface brightness profile over the surveyed area, which amounts to . From the presence of the “dip” of the PNLF, the parent stellar population is similar to that of the Magellanic Clouds or in the outer regions of the M33 disk. Thus the sampled luminosity of the ICL is equivalent to four time the luminosity of the or 1.5 times that of , over the whole surveyed area of ( kpc)2.
4 The late mass assembly of the M87 halo
We then turned to the M87 halo PNs and studied the projected phase-space diagram for this component. The density of points is not uniform in the range of velocities covered by the M87 halo. There is a clearly identifiable V-shaped over-density, or “Chevron”, between 30 and 90 kpc radii, with its vertex, or edge, culminating at kpc or ([Longobardi et al. 2015b, Longobardi et al. 2015b]) . These high density substructures in phase-space are likely to be associated with the disruption of a satellite galaxy in the deeper potential of a massive host ([Quinn 1984, Quinn 1984]).
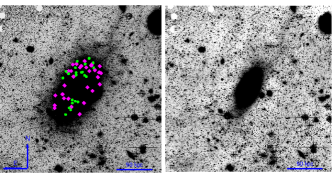
We looked at the LOSVD in three radial bins over the radial range of the Chevron, and employed a Gaussian Mixture Model to assign each M87 halo PN a probability to belong to the V substructure or to the smooth halo. A total of 54 PNs are thereby associated to the V substructure and 200 PNs to the smooth halo component ([Longobardi et al. 2015b, Longobardi et al. 2015b]). We then looked at the spatial distribution of the Chevron PNs: the highest density occurs at NW along the M87 major axis, and is spatially correlated with a diffuse, extended substructure, labeled “the crown” of M87 ([Longobardi et al. 2015b, Longobardi et al. 2015b]), see Figure 3. The luminosity of the substructure is about of the light at the location where the crown is found. We computed the total luminosity of the disrupted satellite from the 54 PNs: it amounts to . We also looked at correlation between the high density of the chevron PNs and the (B-V) color in the M87 halo. A strong correlation is found, with bluer color (B-V = 0.76) measured at the position of the “crown”. From the luminosity and the color we infer that the luminosity of the dissolved satellite is equivalent to about twice the luminosity of M33.
From the distribution and velocities of Chevron PNs in Figure 3, a possible interpretation of the satellite orbit could be that it was first disrupted entering M87 from the south (along the green dots), with the debris then moving up north, turning around in the crown region, coming back down on both sides across M87 (magenta dots). The velocities would then imply that the northern side of M87 is closer to the observer. The dynamical time for such an orbit is of the order of 1 Gyr ([Weil et al. 1997, Weil et al. 1997]).
5 Conclusions
Using PNs as tracers we showed that the stellar halo of the BCG M87 is distinct from the surrounding ICL in its kinematics, density profile, and parent stellar population, consistent with the halo of M87 being redder and more metal-rich that the ICL. The ICL in our surveyed fields corresponds to about four times the luminosity of the LMC, spread out over a region of (130 kpc)2. It is remarkable that population properties can be observed for such a diffuse component. Based on its population properties we propose that the progenitors of the Virgo ICL were low-mass star forming galaxies.
We also presented kinematic and photometric evidence for an accretion event in the halo of M87. This event is traced by PNs whose phase space shows a distinct chevron-like feature, which is the result of the incomplete phase-space mixing of a disrupted galaxy. At a major axis distance of kpc where the width of the chevron goes to zero, a deep optical image shows the presence of a crown-like substructure that contribute more than of the light in this area. The luminosity of the satellite corresponds to about two times M33 with color . The similar colors of the accreted satellite and ICL suggest that the halo of M87 is presently growing through the accretion of similar star-forming systems as those that build up the diffuse ICL component. The newly discovered substructure within the halo of M87 demonstrates that beyond a distance of 60 kpc its halo is still assembling.
6 Acknowledgments
The authors wish to thank J.C Mihos, R. Hanuschik for their contribution, and the time allocation committees of the Subaru Telescope and the ESO OPC for the opportunity to carry out this exciting project. Based on observations made with the VLT at Paranal Observatory under programmes 088.B-0288(A) and 093.B-066(A), and with the Subaru Telescope under programme S10A-039.
References
- [Aguerri et al. 2005] Aguerri, J. A. L., Gerhard, O. E., Arnaboldi, M., Napolitano, N. R., et al. 2005, AJ, 129, 2585
- [Arnaboldi et al. 2008] Arnaboldi, M., Doherty, M., Gerhard, O. E., Ciardullo, R. et al. 2008, ApJ, 674, L17
- [Arnaboldi et al. 2003] Arnaboldi, M., Freeman, K. C., Okamura, S., Yasuda, N. et al. 2003, AJ, 125, 514
- [Arnaboldi et al. 2002] Arnaboldi, M., Aguerri, J. A. L., Napolitano, N. R., Gerhard, O.E. et al. 2002, AJ, 123, 760
- [Binggeli et al. 1987] Binggeli, B., Tammann, G. A., & Sandage, A. 1987, AJ, 94, 251
- [Buzzoni et al. (2006)] Buzzoni, A., Arnaboldi, M., Corradi, R. 2006, MNRAS, 368, 877
- [Castro-Rodriguez et al. 2009] Castro-Rodriguez, N., Arnaboldi, M., Aguerri, J. A. L., Gerhard, O. et al. 2009, A&A, 507, 621
- [Ciardullo et al. 2005] Ciardullo, R., Sigurdsson, S., Feldmeier, J.J., Jacoby, G. H. 2005 ApJ 629, 499
- [Ciardullo et al. 2004] Ciardullo, R., Durrell, P.R., Laychak, M.B. et al. 2004, ApJ, 614, 167
- [Ciardullo et al. 2002] Ciardullo, R., Feldmeier, J. J., Jacoby, G. H., Kuzio de Naray, R. et al. 2002, ApJ, 577, 31
- [Ciardullo et al. 1998] Ciardullo, R., Jacoby, G. H., Feldmeier, J. J., Bartlett, R. E. 1998, ApJ, 492, 62
- [Ciardullo et al. 1989] Ciardullo, R., Jacoby, G. H., Ford, H. C., Neill, J. D. 1989, ApJ, 339, 53
- [Coccato et al. 2009] Coccato, L., Gerhard, O., Arnaboldi, M. et al. 2009, MNRAS, 394, 1249
- [Cooper et al. 2015] Cooper, A. P., Gao, L., Guo, Q., Frenk, C. S., et al. 2015, MNRAS, 451, 2703
- [Cortesi et al. 2013] Cortesi, A., Arnaboldi, M., Coccato, L. et al. 2013, A&A, 549, 115
- [Delucia & Blaziot 2007] De Lucia, G.,& Blaizot, J. 2007, MNRAS, 375, 2
- [Doherty et al. 2009] Doherty, M., Arnaboldi, M., Das, P., Gerhard, O. et al. 2009, A&A, 502, 771
- [Dopita et al. 2000] Dopita, M., Massaglia, S., Bodo, G., Arnaboldi, M. et al. 2000, ASPC, 199, 423
- [Dopita et al. (1992)] Dopita, M., Jacoby, G. H., Vassiliadis, E. 1992, ApJ, 389, 27
- [Jacoby & De Marco 2002] Jacoby, G. H. & De Marco, O. 2002, AJ, 123, 269
- [Jacoby 1989] Jacoby, G. H. 1989, ApJ, 339, 39
- [Kormendy et al. 2009] Kormendy, J., Fisher, D. B., Cornell, M. E., Bender, R. 2009, ApJS, 182, 216
- [Hernández-Martínez & Peña 2009] Hernández-Martínez, L., & Peña, M. 2009, A&A, 495, 447
- [Heinze & Westerlund (1963)] Henize, K. G., & Westerlund, B. E. 1963, ApJ, 137, 747
- [Longobardi et al. 2015a] Longobardi, A., Arnaboldi, M., Gerhard, O., Hanuschik, R. 2015a, A&A 579, 135
- [Longobardi et al. 2015b] Longobardi, A., Arnaboldi, M., Gerhard, O., Mihos, J.C. 2015b, A&A 579L, 3
- [Longobardi et al. 2013] Longobardi, A., Arnaboldi, M., Gerhard, O., Coccato, L. et al. 2013, A&A 558, 42
- [Marigo et al. 2004] Marigo, P., Girardi, L., Weiss, A., Groenewegen, M. A. T., et al. 2004, A& A, 423,
- [Oser et al. 2010] Oser, L., Ostriker, J.P., Naab, T., Johansson, P. H., et al. 2010, ApJ, 725, 2312
- [Quinn 1984] Quinn, P. J. 1984, ApJ, 279, 596
- [Reid & Parker 2010] Reid, W.A. & Parker, Q.A. 2010, MNRAS, 405, 1349
- [Rudick et al. 2010] Rudick, C. S., Mihos, J.C., Harding, P., Feldmeier, J.J. et al. 2010, ApJ, 720, 569
- [Villaver & Stanghellini 2005] Villaver, E., & Stanghellini, L. 2005, ApJ, 632, 854
- [Weil et al. 1997] Weil, M. L., Bland-Hawthorn, J., Malin, D.F. 1997, ApJ 490, 664
- [Williams et al. 2007] Williams, B.F., Ciardullo, R., Durrell, P. R., Vinciguerra, M. et al. 2007, ApJ, 656, 756