The Deuteration Clock for
Massive Starless Cores
Abstract
To understand massive star formation requires study of its initial conditions. Two massive starless core candidates, C1-N & C1-S, have been detected in IRDC G028.37+00.07 in (3-2) with ALMA. From their line widths, either the cores are subvirial and are thus young structures on the verge of near free-fall collapse, or they are threaded by mG -fields that help support them in near virial equilibrium and potentially have older ages. We modeled the deuteration rate of to constrain collapse rates of the cores. First, to measure their current deuterium fraction, , we observed multiple transitions of and with CARMA, SMA, JCMT, NRO 45m and IRAM 30m, to complement the ALMA data. For both cores we derived , several orders of magnitude above the cosmic [D]/[H] ratio. We then carried out chemodynamical modeling, exploring how collapse rate relative to free-fall, , affects the level of that is achieved from a given initial condition. To reach the observed , most models require slow collapse with , i.e., th of free-fall. This makes it more likely that the cores have been able to reach a near virial equilibrium state and we predict that strong -fields will eventually be detected. The methods developed here will be useful for measurement of the pre-stellar core mass function.
1 Deuteration as a Tracer of Massive Starless Core Dynamics
Massive star formation involves many open questions, in part because examples of initial conditions of the process are rare, distant and deeply embedded in massive gas clumps, i.e., structures that eventually fragment into star clusters (Tan et al. 2014). A key question is whether the formation mechanism is a scaled-up version of low-mass star formation. Core Accretion models assume it is: e.g., the Turbulent Core model (McKee & Tan 2003 [MT03]) adopts an initial condition of a virialized massive starless core—a coherent gas cloud that will collapse via a central disk to form a single star or small- multiple. Alternatively, the Competitive Accretion model (Bonnell et al. 2001) forms massive stars at the center of a clump undergoing rapid global collapse and fragmentation mostly into a swarm of low-mass stars. A way to test the models is to identify and characterize initial conditions: do massive starless cores exist and, if so, what is their dynamical state?
However, a difficulty in such studies is estimating the strength of -fields, which may provide significant support in addition to turbulence (note, thermal pressure is unimportant in these massive, cold clouds). While strong -fields are seen around massive protostellar cores (e.g., Zhang et al. 2014), there are few measurements at earlier stages. Recently, Pillai et al. (2015) measured dynamically strong, mG -fields in dark, presumably starless regions of Infrared Dark Clouds (IRDCs).
As a complementary approach, we attempt to measure core ages by astrochemical means, especially the deuteration fraction of key species, and compare these with dynamical (i.e., free-fall) timescales. If the chemical age is greater than the free-fall time, then we expect that a core is likely to have reached approximate virial equilibrium, so that any global contraction is at a relatively slow rate, perhaps regulated by -field support. We also couple the chemical network to simple dynamical models to constrain the collapse rate relative to free-fall collapse.
The particular indicator we model is the deuterium fraction of , i.e., . It rises in cold, dense conditions of starless cores by 4 orders of magnitude above cosmic [D]/[H] . This is due to the parent exothermic reaction p- p- p- being favored at low temperatures (K) (Pagani et al. 1992). has been observed to be a good tracer of both low- and high-mass starless cores (e.g., Crapsi et al. 2005; Tan et al. 2013 [T13]), and is better than and (Fontani et al. 2015). Other methods, such as dust continuum (e.g., Rathborne et al. 2006), dust extinction (e.g., Butler & Tan 2012), are likely subject to contamination from the much more massive clump envelope surrounding the cores. Dust continuum emission is also more sensitive to warmer, protostellar cores, rather than starless cores.
2 Results for the Massive Starless Cores C1-N and C1-S
Two massive starless core candidates, C1-N and C1-S, were identified in IRDC G028.37+00.07, hereafter IRDC C, from their (3-2) emission observed with ALMA by T13. Based on 1.3 mm dust continuum emission, C1-S is more massive, with , while C1-N has . The cores are 0.1 pc in radius. C1-S is round and centrally concentrated (in both mm continuum and (3-2) integrated intensity), while C1-N appears more fragmented. Both cores are dark at wavelengths up to and there is no sign of star formation activity (e.g., from SiO(5-4)). Velocity dispersions inferred from (3-2) line widths are about half that of the fiducial MT03 Turbulent Core model, which assumes large-scale -fields that imply an Alfvén Mach number of . To achieve virial equilibrium would require stronger, mG fields, which imply .
Follow-up observations of multiple transitions of (1-0), (3-2), (4-3) and (1-0) and (2-1) have been presented by Kong et al. (2015a [K15a]). Excitation temperatures of –7 K are derived for the line emission, resulting in a range of values of –0.72 for C1-S and –0.44 for C1-N. However, additional factor of 2 uncertainties arise due to the difficulty in separating the emission of the cores from their more extended clump envelopes.
A gas-phase, spin-state astrochemical network was developed by Kong et al. (2015b [K15b]) to follow time evolution of for given density (), temperature (), cosmic ray ionization rate (), extinction of Galactic FUV radiation () and for either fixed or time-dependent heavy element gas phase depletion factor () via freeze-out onto dust grain ice mantles. For fiducial conditions of K, , mag and (i.e., gas phase underabundance by a factor of 10), the K15a results for chemical evolution at the densities of C1-S () and C1-N () are that it takes Myr to reach the equilibrium value of –0.3, if starting from an initial OPR=3. Starting from OPR=0.01 only leads to a factor of 2 reduction in this timescale. Note, the free-fall times for C1-S and C1-N are (0.5 and 1.0) yr, respectively. Thus the cores are consistent with being in chemical equilibrium and this would have taken local free-fall times to achieve.
K15a also present simple chemodynamical modeling of collapsing cores by controlling the density increase via , where is the local free-fall time at current density , and is a dimensionless parameter setting the collapse rate relative to free-fall. These models are then also parameterized by a target final density, , an initial density, , an initial heavy element depletion factor, , and an initial OPR, with , and being held fixed.
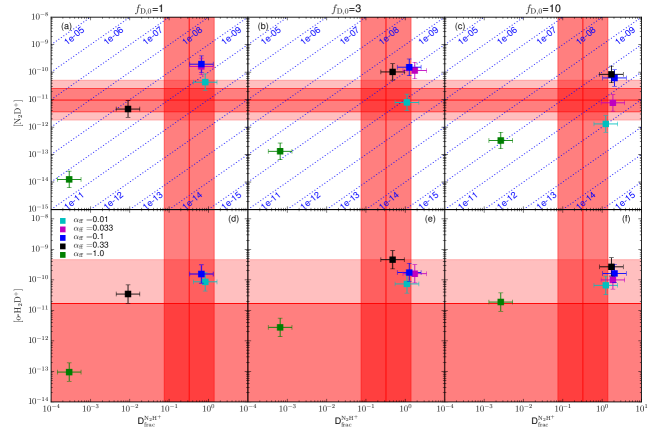
K15b applied these chemodynamical models to the specific cases of C1-S and C1-N, with K, mag, 0.1 to 10, OPR0.01 to 3, , set equal to present-day observed densities, set to 10 or 100 times smaller, and explored from 0.01 to 1. Fig. 1 shows example results for and applied to C1-S in the parameter space of present-day [], and [-]. The observed properties of C1-S, including an upper limit on [-], also observed by K15a) are shown by red shaded regions. Models in or near the overlapped red areas are consistent with all constraints. is the most stringent constraint and its high observed values of rules out fast collapsing models, regardless of initial depletion factor. Models with give a much better match. In fact, the observations are broadly consistent with chemical equilibrium values, which the slow-collapsing models have time to converge to. From the broader parameter space exploration of K15b, it is concluded that the most likely evolutionary history of C1-N and C1-S involves collapse with .
The above methods and results demonstrate the utility of using as a tracer of pre-stellar cores, especially in massive clump environments that exhibit extended emission. The ability to also estimate a deuteration age will also be helpful for assessing an unbiased pre-stellar core mass function, i.e., enabling accounting for the varying lifetimes of the cores.
References
- [Bonnell et al.(2001)] Bonnell, I. A., Bate, M. R., Clarke, C. J., & Pringle, J. E. 2001, MNRAS, 323, 785
- [Butler & Tan(2012)] Butler, M. J., & Tan, J. C. 2012, ApJ, 754, 5
- [Crapsi et al.(2005)] Crapsi, A., Caselli, P., Walmsley, M. C., et al. 2005, ApJ, 619, 379
- [Fontani et al.(2015)] Fontani, F., Busquet, G., Palau, A., et al. 2015, A&A, 575, A87
- [Kong et al.(2015b)] Kong, S., Caselli, P., Tan, J. C., Wakelam, V., & Sipilä, O. 2015b, ApJ, 804, 98 [K15b]
- [Kong et al.(2015a)] Kong, S., Tan, J. C., Caselli, P., et al. 2015a, arXiv:1509.08684 [K15a]
- [McKee & Tan(2003)] McKee, C. F., & Tan, J. C. 2003, ApJ, 585, 850 [MT03]
- [Pagani et al.(1992)] Pagani, L., Salez, M., & Wannier, P. G. 1992, A&A, 258, 479
- [Pillai et al.(2015)] Pillai, T., Kauffmann, J., Tan, J. C., et al. 2015, ApJ, 799, 74
- [Rathborne et al.(2006)] Rathborne, J. M., Jackson, J. M., & Simon, R. 2006, ApJ, 641, 389
- [Tan et al.(2014)] Tan, J. C., Beltrán, M. T., Caselli, P., et al. 2014, Protostars and Planets VI, 149
- [Tan et al.(2013)] Tan, J. C., Kong, S., Butler, M. J., Caselli, P., & Fontani, F. 2013, ApJ, 779, 96 [T13]
- [Zhang et al.(2014)] Zhang, Q., Qiu, K., Girart, J. M. et al. 2014, ApJ, 792, 116