Sc2Ga2CuO7: A possible Quantum spin liquid near the percolation threshold
Abstract
Sc2Ga2CuO7 (SGCO) crystallizes in a hexagonal structure (space group: ), which can be seen as an alternating stacking of single and double triangular layers. Combining neutron, x-ray, and resonant x-ray diffraction we establish that the single triangular layers are mainly populated by non-magnetic Ga3+ ions (85% Ga and 15% Cu), while the bi-layers have comparable population of Cu2+ and Ga3+ ions (43% Cu and 57% Ga). Our susceptibility measurements in the temperature range 1.8 - 400 K give no indication of any spin-freezing or magnetic long-range order (LRO). We infer an effective paramagnetic moment and a Curie-Weiss temperature of about K, suggesting antiferromagnetic interactions between the Cu2+() ions. Low-temperature neutron powder diffraction data showed no evidence for LRO down to 1.5 K. In our specific heat data as well, no anomalies were found down to 0.35 K, in the field range 0-140 kOe. The magnetic specific heat, , exhibits a broad maximum at around 2.5 K followed by a nearly power law m α behavior at lower temperatures, with increasing from 0.3 to 1.9 as a function of field for fields upto 90 kOe and then remaining at 1.9 for fields upto 140 kOe. Our results point to a disordered ground state in SGCO.
pacs:
75.10.Jm, 75.10.Kt, 75.40.CxIntroduction: Geometrically frustrated spin systems are full of surprises and continue to draw attention because of their tendency to host novel ground states 1 Balents . In particular, triangular lattice based geometrically frustrated Mott insulators have gained wide interest because their ground states were envisaged to be based on a Resonating Valence Bond (RVB) picture 2 Anderson . Anderson’s RVB proposal 2 Anderson pertained to the two dimensional (2D) edge-shared triangular lattice which, however, has a 120∘ ordered ground state 3 NEEL Support ; 4 NEEL Support ; 5 NEEL Support ; 6 NEEL Support . This, in particular, triggered the search for the RVB state (also called the quantum spin liquid QSL state 1 Balents ) in geometries such as triangular (anisotropic), Kagomé (2D), hyperkagomé (three dimensional 3D), and pyrochlore (3D). Finally, a QSL state was realized notably in the 2D triangular system -(BEDT-TTF)2Cu2(CN)37-Kappa CuCn , the Kagomé system ZnCu3(OH)6Cl2 8-Kagome neutron 50mK ; 9-Kagome musr 50mK ; 10 Kagome NMR =000026 50mK ; 11 kagome O =000026 Cl NMR ; 12-M Vries , and the hyperkagomé system Na4Ir3O8 13 Na4Ir3O8 Takagi ; 14-Yogesh singh . A frustrated geometry and a low value of spin (), which enhances quantum fluctuations, help in stabilizing a QSL state 1 Balents . However, even in the 6H-B and 3C phases of Ba3NiSb2O9 (Ni2+, ) 15-Ba3NiSb2O9 , which have 2D edge-shared triangular and 3D edge-shared tetrahedral lattices, respectively, a QSL state has been suggested. Also, the realization of a QSL state for Ba3IrTi2O9 16- Ba3Ir , containing a diluted triangular lattice, and Ba3YIr2O9 (high pressure cubic phase) 17- Ba3YIr2O9 , possibly suggests the importance of further neighbor interaction and/or deviations from the Heisenberg model. Recent experimental/theoretical results suggest that disorder might even drive the QSL state 18- AFM melt ; 19-Mila . The unconventional nature of its elementary excitations, which result from a chargeless sector of spin-1/2 fermions (commonly known as spinons), also drew interest from theorists and experimentalists 1 Balents ; 20- Wen order ; 21-Lee spinon . Spinons are believed to form a Fermi surface in such Mott insulators and a non-vanishing Sommerfeld coefficient () appears to be a generic feature for most of the previously discussed QSL 7-Kappa CuCn ; 13 Na4Ir3O8 Takagi ; 15-Ba3NiSb2O9 ; 17- Ba3YIr2O9 .
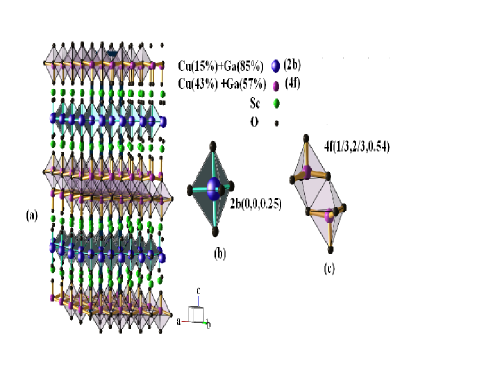
We have been exploring a variety of spin systems with the objective of finding new QSL especially investigating triangular lattices. Herein, we introduce a Cu based potential QSL system Sc2Ga2CuO7 (SGCO). This system was first reported by Kimizuka et al. 22-SGCO and the structure type was identified as similar to Yb2Fe3O7 23-Yb2Fe3O7 . However, no other data have been reported up to now. Here we report a thorough investigation of the structure and magnetic properties of SGCO by synchrotron x-ray diffraction (xrd), neutron diffraction (ND), susceptibility, and specific heat measurements. In the Yb2Fe3O7 structure as applied to SGCO, the 4f sites (forming triangular bi-layers) are expected to be occupied by Ga and 2b sites (forming single triangular layers) by Cu (see Fig. 1). However, we found a large deviation from this expectation. The Ga and Cu occupancies are not easy to obtain due to their similar scattering lengths for neutron as well as similar atomic scattering factors for xrd. From the xrd (synchrotron) data, where the x-ray energy was tuned to be near the K-absorption edge of Cu, we could reliably estimate the 4f and 2b site occupancies by Ga and Cu. Combined with our magnetization and heat capacity data, this allows us to suggest that the magnetic lattice of SGCO comprises of (i) triangular bi-planes, (double layers of triangular bi-pyramids), of Cu which are nearly 50% diluted by Ga but give rise to spin liquid behavior and (ii) some uncorrelated Cu located at a different site. For magnetic fields higher than 90 kOe the magnetic heat capacity exhibits a power law behavior with an exponent close to 2 as in many QSL systems 13 Na4Ir3O8 Takagi ; 15-Ba3NiSb2O9 .
Sample preparation and experimental details: Several batches of polycrystalline SGCO were synthesized by a conventional solid-state reaction route (see Supplementary Material 24-supplemental ). Xrd data were collected at 300 K using a PANalytical diffractometer using Cu-K radiation ( = 1.54182 Å). Synchrotron xrd data were measured at room temperature at the Materials Sciences Beamline 25- Beamline of the Swiss Light Source (SLS), with the wavelength 0.6204 Å, using the Mythen-II detector. Data were also taken at Å (E = 8.9548 keV) which is just below the K-absorption edge of Cu (E = 8.9789 keV). Silicon powder was added to the substance in order to substantially reduce the x-ray absorption in the sample. The ND measurements were carried out with the HRPT diffractometer 26- HRPT DIFF at the SINQ neutron source ( = 1.49 Å) of Paul Scherrer Institut at 300 K and 1.5 K using a standard orange cryostat. Magnetization measurements were done using a Quantum Design SQUID VSM in the temperature range 1.8 - 400 K and in magnetic fields upto 70 kOe. The ac susceptibility measurements were performed on a dilution refrigerator (0.3-7 K) and on a Quantum Design SQUID VSM in the range 2 - 30 K 24-supplemental . The heat capacity measurements were done in the -range 0.35 - 295 K, using a Quantum design PPMS.
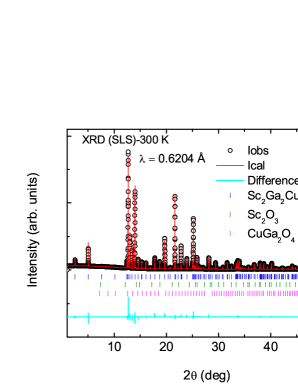
Structure and magnetic model: The powder xrd and ND patterns of SGCO could be indexed within the space group (194) and correspond to the Yb2Fe3O7 structure previously reported by Kimizuka et al. 22-SGCO ; 23-Yb2Fe3O7 . Our lab xrd data (not shown) did not show any impurity peaks, however in the much higher statistics synchrotron data we found Sc2O3 ( 1.2 wt.%) and CuGa2O4 ( 0.5 wt.%) impurities. A three phase Rietveld refinement using FullProf 27- FULL was done on our synchrotron data to obtain the lattice constants and the absolute amount of phases. The refined synchrotron data with ( Å) and the extracted atomic positions for SGCO are summarized in the Supplementary Material 24-supplemental . The obtained lattice constants are and , similar to those reported by Kimizuka et al. 22-SGCO .
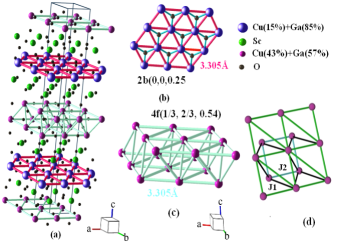
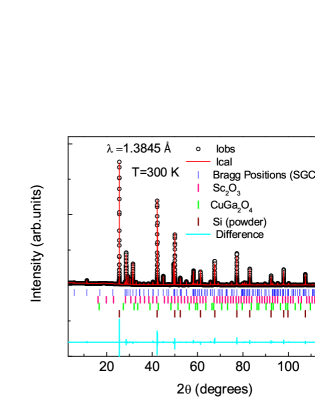
Since Cu and Ga have similar scattering lengths, both for x-rays and for neutrons, possible site sharing between the two is not easily addressed by analyzing the diffraction data. For instance, for x-rays ( Å) the atomic scattering factors for Ga and Cu are different by only 7%. However, if one tunes the x-ray energy near the K-absorption edge of Cu, the difference in scattering factors for Ga and Cu can be much more. In our case ( Å), the scattering factors for Ga and Cu are different by 25%. Xrd pattern under these conditions is shown in Fig. 2. The obtained lattice constants are a = b = 3.3045(2) Å, c = 28.1129(1) Å (see Supplementary Material 24-supplemental for details). We find that the 2b sites (0, 0, 1/4) contain 85% non-magnetic Ga3+ and 15% Cu2+. The 4f sites (1/3, 2/3, ) contain 57% Ga3+and 43% Cu2+ ions. As shown in Fig. 1 (b) the edge-shared single-triangular planes at the 2b sites (0, 0, 1/4), along with the neighboring oxygens atoms make single layers of corner-sharing triangular bi-pyramids (see Supplementary Material 24-supplemental ). On the other hand, the 4f sites (1/3, 2/3, 0.54) form triangular bi-planes (see Fig. 1 (c)) or rather double layers of triangular bi-pyramids when the oxygens are included. In a bi-plane (4f sites), a triangular layer is shifted with respect to the other such that the vertices of one layer are at the centroids of alternate triangles of the other layer. This is topologically equivalent to a honeycomb lattice with nearest () and next-nearest () neighbor coupling and based on exchange paths it is likely that , see Fig. 1 (d).
The preference for Ga for the 2b sites is supported by bond-valence sum (BVS) calculations. The BVS for Ga3+ is 2.91 on 2b sites and 2.69 on 4f sites, making 2b the preferred site for Ga3+. Likewise the BVS for Cu is 2.54 on 2b sites and 2.35 on 4f sites, giving a slight preference for Cu2+ to occupy 4f sites, in agreement with the results from the structural refinements.
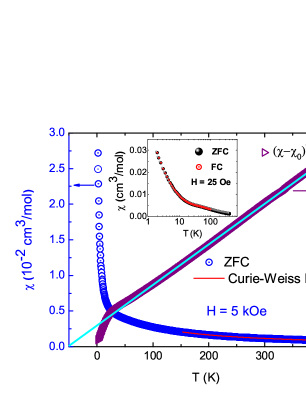
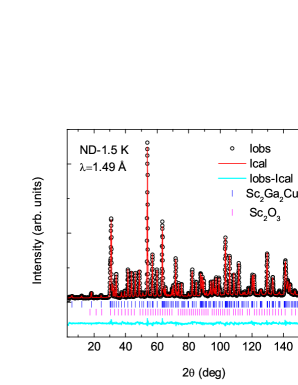
The dc susceptibility () of SGCO varies in a Curie-Weiss manner down to 100 K, where (-4.45110-5 cm3/mol), = 0.41 cm3 K/mol, and -44 K denote the -independent , the Curie constant, and the Curie-Weiss temperature, respectively. The negative suggests antiferromagnetic correlations and the inferred effective moment 0.09 is close to that for an moment. Measurements performed in a low field (25 Oe) and down to 2 K do not exhibit any anomaly or bifurcation between zero field cooled (ZFC) and field cooled (FC) data (inset of Fig. 3). AC measurements in the -range 0.3-30 K do not show any anomaly or frequency dependence (see the Supplemental material 24-supplemental ). This suggests the absence of LRO or any spin freezing. It is worth mentioning that the ND measurements carried out at 1.5 K did not show any signature of magnetic Bragg peaks, setting an upper limit of 0.5 for the ordered moment in case of LRO. Further, 71Ga NMR shift data 28-khuntia_nmr on SGCO indicate a leveling off of below about 50 K and the absence of LRO. While further evidence is needed to conclusively establish QSL behavior in SGCO, the essential features of in SGCO are as in other QSL materials.
To estimate the fraction of paramagnetic spins in SGCO, we have made use of the data from magnetic isotherms at low- (1.8 - 4.5 K) since the Cu at the 2b sites is expected to show paramagnetic Curie-like behavior while the contribution from the possibly correlated triangular bi-planes might be much lower. Our analysis (see the Supplemental material 24-supplemental ) of the data is consistent with about 12% of paramagnetic Cu2+() spins which is not far from the value of 15% Cu at the 2b sites obtained from resonant xrd data. In In2Ga2CuO7, structurally similar to SGCO, Taetz et al. 29-Teatz thesis obtained approximately 10% of paramagnetic impurities from a similar analysis. Given the site occupancies obtained from resonant xrd results on SGCO, the magnetic lattice (bi-layers from the atoms at 4f positions (1/3, 2/3, 0.54)) is more than 50% diluted. While this is beyond the percolation threshold of a 2D triangular lattice, for the bi-layer configuration (or the honeycomb lattice as mentioned before) here, the magnetic connectivity might still be maintained.
Based on our experiments, we suggest that SGCO appears to consist of (i) 10-15% of the 2b sites having paramagnetic moments and (ii) a nearly equal mixture of Cu2+ and Ga3+ at the 4f sites which magnetically form the triangular bi-planes. While it could be that the site occupation is correlated, maintaining the magnetic connectivity in the triangular bi-layers, it is surprising that there is no spin-freezing even after large dilution. One may speculate that the proximity of the site occupation to a percolation threshold may promote long range spin singlets as in an algebraic spin liquid 1 Balents .
Heat capacity: To obtain further insight into the low-energy excitations of SGCO, we measured its specific heat (Fig. 4) in the -range 0.35 - 300 K under various (0 kOe - 140 kOe). We found no signature of LRO down to 0.35 K. However, below about 15 K the displays a dependence on which is suggestive of a Schottky anomaly. This Schottky contribution Schottky most likely arises from the paramagnetic Cu2+ spins at the 2b sites. Note that our data analysis revealed a 12% contribution from paramagnetic species. We then analyzed as a combination of Schottky and lattice (the lattice heat capacity) in addition to a magnetic heat capacity (see Supplemental Material 24-supplemental ). The (which, we believe, comes from the correlated spins of the triangular bi-planes) is obtained after subtracting lattice and Schottky and is shown in Fig. 4 (b).
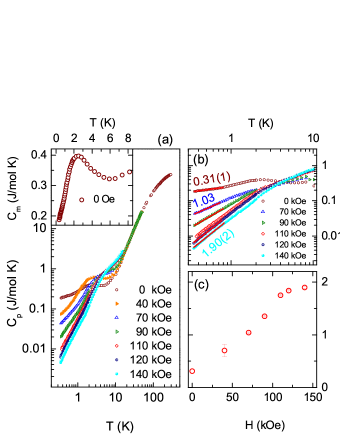
As shown in the inset of Fig. 4 (a), () shows a broad maximum (perhaps not related to any phase transition) at around 2.5 K in = 0. The appearance of a broad maximum is common for highly frustrated spin systems and has previously been noticed for NiGa2S4 30- NiGa2S4 , Na4Ir3O8 13 Na4Ir3O8 Takagi , Ba3CuSb2O9 31-Ba3CuSb2O9 , and Ba3NiSb2O9 15-Ba3NiSb2O9 However, its position in (in comparison to the strength of the exchange coupling) varies from material to material.
Finally the low- data ( < 1 K) were fitted to a power-law (where is a constant), to infer about the magnetic excitations (see Fig. 4 (b)). We found that in SGCO, increases from 0.3 to 1.9 with increasing . The error bars for in Fig. 4 (c) were arrived at by assuming a % uncertainty in Schottky. The value of is robust and reliable for kOe in the -range 0.35-1 K, and attains a value 1.9(2) for kOe. An exponent close to 2 might be an indication of a QSL and has previously been observed for the hyperkagomé compound Na4Ir3O8 13 Na4Ir3O8 Takagi as also the 3C phase of Ba3NiSb2O9 15-Ba3NiSb2O9 . In the case of a Kagomé lattice, a theoretical approach (spin-1/2 spinons obeying the Dirac spectrum 32- Dirac ) leads to a 2 dependence of specific heat. However, there could be other explanations. Recently, randomness-induced QSL (also called random singlet) has been suggested for organic triangular salts 33-random singlet 1 as also for inorganic ones such as herbertsmithite 34-random singlet 2 with the Kagomé structure. In herbertsmithite, a Zn/Cu disorder might cause a random Jahn-Teller distortion of the [Cu(OH)6]4- giving rise to a random modification of the exchange coupling in the Kagomé layer. For the resulting gapless QSL state, a -linear is expected. In the SGCO case, a similar Ga/Cu disorder exists which might drive the QSL state. However, In SGCO (in zero field), the power law exponent of is 0.3. This amounts to a divergence of at low-. Such a divergence in Pr2Ir2O7 (frustrated moments in a metallic background; different than SGCO) has been seen as an indication of proximity to a quantum critical point QCP 35-pr2ir2o7 . For SGCO, with the increasing () exponent (from 0.3 to 1.9) with field, one might speculate that the system moves from a QCP to deeper into the insulating QSL region with field. A cautionary note is that the inferred low-field might be affected by possible interaction between the correlated spins and the orphan spins.
It is worth mentioning that in our data at kOe, mJ/mol K2.9. A non zero value of , in general, indicates the presence of low-energy (likely) gapless excitations for these Mott insulators at low-. While the reason for the field-induced suppression of the (suggesting a suppression of magnetic excitations) is not clear at this point, it could arise from a freezing out of any interaction between the orphan spins (Cu2+ in the 2b sites) and the triangular bi-layers. The estimated entropy change (see Supplemental Material 24-supplemental ) by integrating the versus data (in zero field) yields 1.2 J/mol K, which is nearly 20% of that expected for a moment. This value will be even smaller when the data at the highest field are considered. The significantly smaller is suggestive of a large residual entropy at low temperatures, further suggesting a QSL ground state in SGCO.
Summary: Using the results obtained from various experimental probes such as xrd, ND, dc/ac , , and , we have explored the properties of SGCO. Our resonant xrd measurements carried out at the K-absorption edge of Cu allow us to infer the site occupancies of Cu and Ga at the 2b sites (Cu:Ga = 0.15:0.85) and the 4f sites (Cu:Ga = 0.43:0.57). We suggest that the magnetic lattice can be viewed as a combination of (i) highly depleted triangular bi-layers (or honeycomb layers with nearest as also next-nearest neighbor interactions) giving rise to correlated behavior and (ii) about 15% Cu spins which are paramagnetic. Our ND data down to 1.5 K do not show any signature of LRO/spin freezing and are consistent with the dc/ac measurements. Further, the data indicate absence of any transition down to 0.35 K. They are also indicative of the presence of low-energy excitations and for high fields yield m 2 below 1 K. Taken together, the apparent lack of LRO or spin freezing and the existence of low-energy (likely gapless) excitations could be indicative of a QSL ground state. Often QSL candidates with site-disorder have been found to display spin freezing. It is therefore unusual to find the combined lack of order and spin-freezing in a system so heavily diluted as the triangular bi-layers are in this compound. This could be a result of the dilution approaching a percolation threshold and one may speculate if the unusual QSL behavior could arise close to such thresholds. There is also recent work 19-Mila which proposes disorder driven spin-orbital liquid in such systems. Another possibility is disorder induced bond randomness which can give rise to a random singlet QSL as has been suggested in herbertsmithite 34-random singlet 2 . Further low- magnetization and local probe investigations such as SR would be useful to explore the properties of SGCO in greater details.
Acknowledgements: We thank Department of Science and Technology, Govt. of India and the Indo-Swiss joint research programme, the Swiss National Science Foundation and its SINERGIA network MPBH for financial support. R. Kumar acknowledges CSIR, India for awarding him a research fellowship and B. Koteswararao thanks DST INSPIRE fellowship to carry out the research work. This work is partly based on experiments performed at the Swiss spallation neutron source SINQ, Paul Scherrer Institute, Villigen, Switzerland.
References
- (1) L. Balents, Nature 464, 199 (2010).
- (2) P. W. Anderson, Mater. Res. Bull. 8, 153 (1973).
- (3) B. Bernu, P. Lecheminant, C. Lhuillier, and L. Pierre, Phys. Rev. B 50 , 10048 (1994).
- (4) R. R. P. Singh and D. A. Huse, Phys. Rev. Lett. 68 , 1766 (1992 ).
- (5) D. J. J. Farnell, R. F. Bishop, and K. A. Gernoth, Phys. Rev. B 63 , 220402 R (2001).
- (6) L. Capriotti, A. E. Trumper, and S. Sorella, Phys. Rev. Lett. 82 , 3899 (1999).
- (7) Y. Shimizu, K. Miyagawa, K. Kanoda, M. Maesato, and G. Saito, Phys. Rev. Lett. 91, 107001 (2003).
- (8) J. S. Helton, K. Matan, M. P. Shores, E. A. Nytko, B. M. Bartlett, Y. Yoshida, Y. Takano, A. Suslov, Y. Qiu, J.-H. Chung, D. G. Nocera, and Y. S. Lee, Phys. Rev. Lett. 98, 107204 (2007).
- (9) P. Mendels, F. Bert, M. A. de Vries, A. Olariu, A. Harrison, F. Duc, J. C. Trombe, J. S. Lord, A. Amato, C. Baines Phys. Rev. Lett. 98 , 077204 (2007).
- (10) T. Imai, E. A. Nytko, B. M. Bartlett, M. P. Shores, and D. G. Nocera, Phys. Rev. Lett. 100, 077203 (2008).
- (11) A. Olariu, P. Mendels, F. Bert, F. Duc, J. C. Trombe, M. A. de Vries, and A. Harrison, Phys. Rev. Lett. 100, 087202 (2008).
- (12) M. A. de Vries, J. R. Stewart, P. P. Deen, J. Piatek, G. N. Nilsen, H. M. Ronnow, and A. Harrison, Phys. Rev. Lett. 103, 237201 (2009).
- (13) Y. Okamoto, M. Nohara, H. Aruga-Katori, and H. Takagi, Phys. Rev. Lett. 99, 137207 (2007).
- (14) Y. Singh, Y. Tokiwa, J. Dong, and P. Gegenwart, Phys. Rev. B 88, 220413(R) (2013).
- (15) J. G. Cheng, G. Li, L. Balicas, J. S. Zhou, J. B. Goodenough, Cenke Xu, and H. D. Zhou, Phys. Rev. Lett. 107, 197204 (2011).
- (16) Tusharkanti Dey, A. V. Mahajan, P. Khuntia, M. Baenitz, B. Koteswararao, and F. C. Chou, Phys. Rev. B 86, 140405(R) (2012).
- (17) Tusharkanti Dey, A. V. Mahajan, R. Kumar, B. Koteswararao, F. C. Chou, A. A. Omrani, and H. M. Ronnow, Phys. Rev. B 88, 134425 (2013).
- (18) T. Furukawa, K. Miyagawa, T. Itou, M. Ito, H. Taniguchi, M. Saito, S. Iguchi, T. Sasaki, and K. Kanoda, Phys. Rev. Lett. 115, 077001 (2015).
- (19) A. Smerald and F. Mila, Phys. Rev. Lett. 115, 147202 (2015).
- (20) X. G Wen, Phys. Rev. B 65, 165113 (2002).
- (21) T. K. Ng and P. A. Lee, Phys. Rev. Lett. 99, 156402 (2007).
- (22) N. Kimizuka, T. Mohri, J. Solid State Chem. 60, 382 (1985).
- (23) N. Kimizuka, A. Takenaka, Y. Sasada, T. Katsura, Solid State Comm. 15, 1199 (1974).
- (24) See supplemental material for sample preparation, x-ray, neutron refinement, magnetic, and specific heat analysis.
- (25) http://www.psi.ch/sls/ms/powder-diffraction
- (26) P. Fischer, G. Frey, M. Koch, M. Könnecke, V. Pomjakushin, J. Schefer, R. Thut, N. Schlumpf, R. Bürge, U. Greuter, S. Bondt, and E. Berruyer, Physica B 146, 276 (2000).
- (27) J. Rodríguez-Carvajal, Physica B. 192, 55 (1993).
- (28) P. Khuntia et al. unpublished.
- (29) T. Taetz, PhD thesis, University of Cologne, Germany, (2008).
- (30) S. Nakatsuji, Y. Nambu, H. Tonomura, O. Sakai, S. Jonas, C. Broholm, H. Tsunetsugu, Y. Qiu, and Y. Maeno , Science 309, 1697 (2005).
- (31) H. D. Zhou, E. S. Choi, G. Li, L. Balicas, C. R. Wiebe, Y. Qiu, J. R. D. Copley, and J. S. Gardner, Phys. Rev. Lett. 106, 147204 (2011).
- (32) Y. Ran, M. Hermele, P. A. Lee, and X.-G. Wen, Phys. Rev. Lett. 98, 117205 (2007).
- (33) K. Watanabe, H. Kawamura, H. Nakano, and T. Sakai, J. Phys. Soc. Japan 83, 034714 (2014).
- (34) T. Shimokawa, K. Watanabe, and H. Kawamura, arXiv:1506.03576v2.
- (35) Y. Tokiwa, J. J. Ishikawa, S. Nakatsuji, and P. Gegenwart, Nature Materials 13, 359 (2014).
…………………………………………………………………
-
Supplemental
material for Sc2Ga2CuO7: A possible Quantum spin liquid near the percolation threshold
.1 Sample preparation
Stoichiometric mixtures of pre-dried CuO (99.995% purity), Ga2O3(99.99% purity), and Sc2O3(99.9% purity) were ground homogeneously in an agate mortar and then pelletized. The pellet was placed in a high density alumina crucible and fired at 950∘C for 24 hours in a Carbolite tubular furnace. The pellet was further reground, pelletized, and then fired two times at 1250∘C for 24 hours each. Several such batches were prepared in this study. The final product was light green in color.
.2 X-ray (synchrotron) diffraction and neutron diffraction analysis
Figure 5 depicts the x-ray diffraction pattern obtained for SGCO using synchrotron data with Å. In the ideal case (no site sharing), the Cu and Ga atoms are expected to form single and double triangular lattices comprising of atoms at 2b (0, 0, 1/4) and 4f (1/3, 2/3, z) sites, respectively. However, because of the similar ionic radii of Cu2+ and Ga3+ ions, a distribution of both might be expected at the 2b (0, 0, 1/4) and the 4f (1/3, 2/3, z) sites. The atomic coordinates refined from the x-ray (synchrotron: SLS) diffraction data measured with = 0.6204 Å at 300 K for SGCO are given in Table 1. Since Cu (Z = 29) and Ga (Z = 31) have nearly the same atomic scattering factors it is difficult to estimate with high confidence, their distribution with the present x-ray (synchrotron: = 0.6204 Å) analysis. If the Ga:Cu ratio were left as a free parameter, the best refinement of the synchrotron (SLS) data was obtained with the site 2b (0, 0, 1/4) mostly occupied by Ga3+ and the 4f (1/3, 2/3, z) site having both Cu2+ and Ga3+ ions, which is quite opposite to the isostructural compound Yb2Fe3O7 where the divalent Fe2+ and the trivalent Fe3+ ions sit at 2b (0, 0, 1/4) and 4f (1/3, 2/3, z) sites, respectively. The refinement quality factors described by , , and are obtained to be , , and , respectively. The local environments of Cu2+ ions at 2b/4f site can be best viewed as single layers of corner-sharing triangular bi-pyramids/double layers of triangular bi-pyramids, as seen in Fig. 6. As far as the magnetic lattice is concerned, the latter amounts to a (heavily depleted) honeycomb lattice with the presence of both nearest and next-nearest neighbor interactions.
We then collected x-ray diffraction data near the K absorption edge of Cu to get a more reliable distribution of Cu and Ga atoms at 2b and 4f sites, as the contrast between the atomic scattering factors of Ga and Cu is higher at this wavelength. From a refinement of our resonant x-ray data with Å (refined positions and occupancies are in Table 2), we obtain that the 2b sites (0, 0, 1/4) are mostly occupied with non-magnetic Ga3+ ions (85% Ga3+ and 15% Cu2+), whereas the 4f sites (1/3, 2/3, z), which form a network of double layers of triangular bi-pyramids (or honeycomb layers as mentioned above), is populated by Ga3+ and Cu2+ ions with 57% Ga3+ and 43% Cu2+, see Fig. 6. The goodness of fit parameters Rp, Rwp, Rexp and are found to be 2.67%, 2.94%, 0.34% and 75, respectively.
| Atom | site | x | y | z | occ |
|---|---|---|---|---|---|
| Sc | 4f | 1/3 | 2/3 | 0.14877(2) | 1 |
| Cu | 2b | 0.0 | 0.0 | 1/4 | 0.252(2) |
| Ga | 2b | 0.0 | 0.0 | 1/4 | 0.744(2) |
| Ga | 4f | 1/3 | 2/3 | 0.54478(1) | 0.312(3) |
| Cu | 4f | 1/3 | 2/3 | 0.54478(1) | 0.69(3) |
| O1 | 4f | 0.0000 | 0.0000 | 0.18007(6) | 1 |
| O2 | 4f | 1/3 | 2/3 | 0.61130(6) | 1 |
| O3 | 4f | 1/3 | 2/3 | 0.03325(7) | 1 |
| O4 | 2c | 1/3 | 2/3 | 1/4 | 1 |
| Atom | site | occupancy | |||
|---|---|---|---|---|---|
| Sc | 4f | 1/3 | 2/3 | 0.14865(2) | 1 |
| Cu1/Ga1 | 2b | 0 | 0 | 1/4 | 0.15(1)/0.85(1) |
| Cu2/Ga2 | 4f | 1/3 | 2/3 | 0.54480(1) | 0.43(1)/0.57(1) |
| O1 | 4f | 0 | 0 | 0.17934(7) | 1 |
| O2 | 4f | 1/3 | 2/3 | 0.61118(7) | 1 |
| O3 | 4f | 1/3 | 2/3 | 0.03371(7) | 1 |
| O4 | 2c | 1/3 | 2/3 | 1/4 | 1 |
| Atom | Wyckoff position | x | y | z | Occupancy |
|---|---|---|---|---|---|
| Sc | 4f | 1/3 | 2/3 | 0.14861(5) | 0.93 |
| Cu | 2b | 0 | 0 | 1/4 | 0.66 |
| Ga | 2b | 0 | 0 | 1/4 | 0.34 |
| Cu | 4f | 1/3 | 2/3 | 0.54447(5) | 0.16 |
| Ga | 4f | 1/3 | 2/3 | 0.54447(5) | 0.84 |
| O1 | 4f | 0 | 0 | 0.18087(7) | 1 |
| O2 | 4f | 1/3 | 2/3 | 0.61201(6) | 1 |
| O3 | 4f | 1/3 | 2/3 | 0.03320(10) | 1 |
| O4 | 2c | 1/3 | 2/3 | 1/4 | 1 |
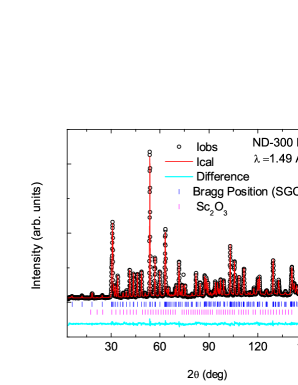
Similarly, the neutron diffraction measurements performed at 300 K, shown in Fig. 7, also could not reliably infer the amount of site sharing between Cu2+and Ga3+ions, because of a poor contrast between their scattering lengths, 7.718 and 7.288 fm, respectively 1-scattering lengths . Consequently, based on our neutron diffraction data alone we could not have made a definitive statement about the site occupancy by Ga and Cu at the 2b and 4f sites. The obtained lattice constants from neutron diffraction data ( = 1.49 Å) are Å and Å, in good agreement with those obtained from x-ray (synchrotron) data. The residual refinement factors , , and for neutron refined powder diffraction pattern for 300K data yield 3.61%, 3.00%, 4.73% and 2.49, respectively. The refined atomic coordinates for SGCO at 300 K are listed in the Table 3. As it is evident from the refinement result that the neutron diffraction suggests a distribution of Cu and Ga quite opposite to what was determined from resonant x-ray data. The neutron diffraction data collected at 1.5 K (Fig. 8) do not show the appearance of any new peak and hence rule out the presence of magnetic ordering.

.3 Magnetization isotherm analysis
As it is evident from Fig. 9, below about 5 K magnetization isotherms start to show a curvature, which becomes prominent at lower temperatures. Measured magnetic isotherms in the temperature range 1.8-4.5 K, where is no longer much smaller than , were analyzed within the framework of the following equation: , where represents the intrinsic susceptibility of the triangular planes and is assumed constant in the 1.8-4.5 K interval, , , , and denote the impurity/disorder concentration, the Lande g-factor, spin, and correlation temperature for impurity spins. The symbols , , , , and refer to the magnetic field, the Avogadro number, the Boltzmann constant, the Bohr magneton, and the Brillouin function, respectively. To start with, there are five-parameters to be varied and a simultaneous fitting of all these end up in nonphysical values. So we first fixed imp and gimp to be 1/2 and 2, respectively and thus reduced our variables from five to three, i.e., , imp and . To increase the reliability of our fitting parameters we simultaneously fitted all magnetic isotherms, measured in the -range 1.8 - 4.5 K. The outcomes of fittings for various assumed values of g are summarized in Table. 4. As is evident from the result, the value of is nearly zero, which in turn suggests the absence of magnetic correlations among impurity spins so one can treat them as purely paramagnetic. The obtained free-spin concentration is consistent with about 12% antisite disorder.
| imp | gimp | (cm3/mol) | (K) | imp(%) |
|---|---|---|---|---|
| 1/2 | 2.0 | 0.0051 | -0.22 | 11.60 |
| 1/2 | 2.1 | 0.0047 | -0.42 | 11.58 |
| 1/2 | 2.2 | 0.0043 | -0.63 | 11.59 |
| 1/2 | 2.3 | 0.0038 | -0.85 | 11.61 |
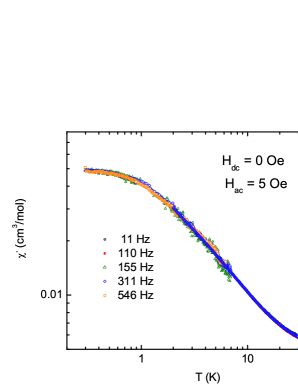
.4 A.C. susceptibility
AC susceptibility data were measured in the temperature range 0.3 -7 K and 2- 30 K on a home-made susceptometer and a Quantum Design SQUID VSM machine, respectively. The data were recorded keeping the dc field zero and the ac pulse of amplitude 5 Oe. With the home-made susceptometer we measured the data for three different frequencies of 545.7 Hz, 311 Hz, and 155 Hz. In the temperature range 2-30 K on Quantum design SQUID VSM machine we measured the data for five different frequencies of 11 Hz, 110 Hz, 155 Hz, 311 Hz, and 546 Hz. The data obtained with the home made susceptometer were multiplied by a scaling factor (after subtracting a background) so as to match the data between 2 K and 7 K obtained using the Quantum Design SQUID VSM. The real part of the susceptibility data is shown in Fig. 10. These data do not show any frequency dependence or any peak in the entire measured temperature range and thus rule out the possibility of any glassy behavior in this material within the precision of our measurements.
.5 Magnetic specific heat analysis
The data, specific heat at constant pressure, data obtained in zero magnetic field in the temperature range 0.35-300 K are shown in Fig. 11. The total specific heat of the system can be written as: = lattice+ Schottky + m. Here, lattice is the lattice specific heat and Schottky originates from isolated paramagnetic spins (Cu2+ spins in this case) forming a two-level system. We ascribe the remaining contribution m to antiferromagnetically interacting Cu2+ spins residing in the 4f planes (bi-planes). We now attempt to estimate lattice and Schottky so that the "intrinsic" contribution m can be inferred.
To estimate the lattice contribution (lattice) in the absence of a suitable non-magnetic analog for SGCO, we used a combination of Debye and Einstein terms, as written in Eqn. (1) given below.
| (1) |
where, and
One formula unit of SGCO has twelve atoms and this in turn offers one acoustic and eleven optical modes of atomic vibrations, in each crystallographic direction. The first term (Debye integral) of the Eqn. (1) takes care of the three acoustic modes of vibration whereas the second term accounts for the contribution of thirty three optical modes of phonons. This amounts to the conditions D= 1 and =11 or D+ = 12 for each direction. The data were found to fit well with weightage factors corresponding to Debye and Einstein modes chosen in the ratio 1:1:4:6. We, however, understand that this is just a simple model to capture the basic characteristics of the complex lattice dynamics. We initially fitted the data to Eqn. (1) in the temperature range 20-90 K and then extrapolated the curve to cover the entire temperature range 0.35-300 K, as shown in the inset (a) of Fig. 11. The fitting yields the Debye temperature to be 159 K and Einstein temperatures to be 231 K, 308 K and 645 K, respectively. Nevertheless, at very low temperatures (: Debye temperature) only the first term (acoustic branch of the phonon spectrum) dominates as 3 and Einstein weightage to the lattice specific heat falls rapidly as exp(-).
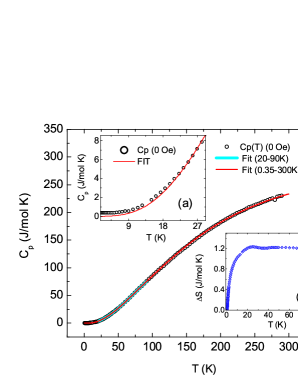
Next, we will estimate the Schottky contribution Schottky as follows. Based on magnetization isotherm analysis, we modeled the Schottky contribution (Schottky) by fixing the amount of free spins to 12%. We used the two-level Schottky formula, described by Eqn. 2 below, with % contribution from non-interacting Cu-spins having a g-value of 2.
| (2) |
Here, is the energy separation under the influence of an external magnetic field , and , , and are the universal gas constant, the Boltzmann constant, and the degeneracies of the two level system, respectively.
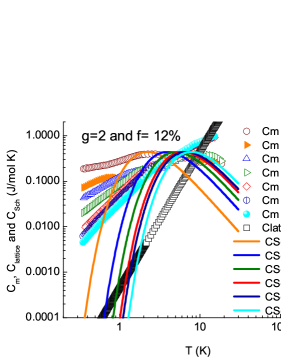
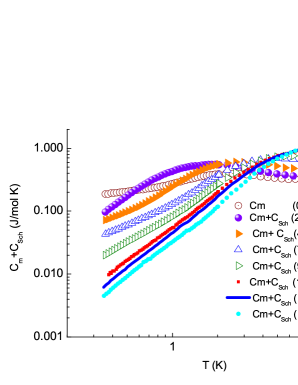
The "intrinsic" magnetic specific heat m is thus obtained by subtracting lattice+ Schottky from . Figure 12 illustrates a plot of individual contributions of Schottky (for = 2 and % free spin contribution), lattice and magnetic specific heats to the total specific heat data. It is worth mentioning that below about 1 K the lattice heat capacity as also the Schottky contribution in fields beyond 90 kOe is utterly negligible in the total specific heat and the determination of the magnetic specific heat (m) below 1 K is free from any uncertainty. Further, analyzing the magnetic heat capacity data assuming a % uncertainty in the Schottky part does not change significantly the values of exponents for fields > 40 kOe, and the exponents are found to be robust for > 40 kOe (see main text and Fig. 4 (c)). Note that Fig. 13 shows the lattice removed data, a sum of both the magnetic and Schottky specific heat, for SGCO at different magnetic fields.
References
- (1) See for neutron scattering lengths: http://www.ncnr.nist.gov/resources/n-lengths/