Sgr B2(N): A bipolar outflow and rotating hot core revealed by ALMA
Abstract
We present the results of SiO () and SO2 () line observations of Sgr B2(N) made with the Atacama Large Millimeter/submillimeter Array (ALMA) at an angular resolution of 2. Our analysis of the SiO and SO2 line emission reveals a bipolar molecular outflow in an east-west direction whose driving source is located at K2. In addition, SO2 line core shows a north-south velocity gradient most probably indicating a hot core of molecular gas rotating around K2. Fractional abundances of SO2 and SiO ((SO2) and (SiO), respectively) in the outflowing molecular gas are derived from comparisons with the C18O emission. Assuming an excitation temperature of K, we calculate (SO2) = 10-8 and (SiO) = 10-9. The outflow from Sgr B2(N) K2 is characterized as a young (5103 yr) and massive (2000 ), but moderately collimated (60∘) outflow. We also report a possible detection of the SiO () maser emission from the position of K2. If confirmed, it would make Sgr B2(N) the 4th star forming region associated with SiO masers.
1 INTRODUCTION
High-mass young stellar objects are usually deeply embedded in their parental dense and massive molecular clumps (size 1 pc, mass 100–1000 , density 104-5 ) (Ridge et al., 2003; Lada & Lada, 2003; Lada, 2010; Higuchi et al., 2009, 2010, 2013), obscuring their early formative stages. Their formation timescales of 105 yr are short, and they form in distant clusters (e.g., Galactic Center) and associations (e.g., Zinnecker & Yorke, 2007). All these factors limit our understanding of their formation processes. High angular resolution observations are indispensable in the efforts to unveil the mystery of high-mass star formation. The Atacama Large Millimeter/submillimeter Array (ALMA) provides the high sensitivity, angular resolution, and dynamic range to improve our understanding of the formation processes of high-mass stars and their parental clumps (Sánchez-Monge et al., 2013, 2014; Belloche et al., 2014; Guzmán et al., 2014; Higuchi et al., 2014, 2015; Zapata et al., 2015; Johnston et al., 2015).
Sagittarius B2 (Sgr B2) is a complex of H ii regions and giant molecular clouds located near the Galactic Center. It is known as one of the most luminous massive star-forming regions in our Galaxy, with a total bolometric luminosity of 107 (Lis & Goldsmith, 1989, 1990, 1991). Tens of compact/ultracompact H ii regions and H2O, OH, and H2CO maser clusters are located at the three centers of star formation aligned in the north-south direction, i.e., Sgr B2 (N), (M), and (S) (Genzel et al., 1976; Benson & Johnston, 1984; Gardner et al., 1986; Gaume & Claussen, 1990). Sgr B2(N) is associated with the H ii region K, which is further resolved into subcomponents K1 – K6 (Gaume & Claussen, 1990; Gaume et al., 1995; de Pree et al., 1996). Of these, K1, K2 and K3 have drawn particular attention because they are very compact (Gaume et al., 1995) and are spatially coincident with the H2O masers (Kobayashi et al., 1989).
A dense core of hot molecular gas was initially found in the K1 – K3 region by interferometric observations of NH3 and HC3N line emission (Vogel et al., 1987; Gaume & Claussen, 1990; Lis et al., 1993). The core is also detected in dust continuum emission at millimeter wavelengths. The dust emission peaks at the position of K2 with the peak H2 column density of 1025 cm-2 (Carlstrom & Vogel, 1989; Lis et al., 1993; Kuan et al., 1996). The inferred mass of the core ranges from , for a region with a diameter of pc. Interferometric and single-dish follow up observations in several molecular lines have revealed that the core is particularly rich in large saturated molecules, indicating hot core chemistry with fresh material evaporating from dust mantles (Goldsmith et al., 1987; Kuan & Snyder, 1994; Kuan et al., 1996; Liu & Snyder, 1999; Belloche et al., 2008; Hollis et al., 2003; Qin et al., 2011; Belloche et al., 2013, 2014).
For the kinematic structure of the molecular gas in this region, two possible interpretations have been presented. Vogel et al. (1987) was the first to note the NW – SE velocity gradient in their NH3 observations. Lis et al. (1993) confirmed the velocity structure in their HC3N () observations at 4 resolution, and suggested that it arises from a very energetic bipolar outflow associated with a source embedded in the dense core. On the other hand, Hollis et al. (2003) argued, based on their 15 resolution observation of the CH3CH2CN () line, that this velocity gradient indicates the rotation of a large edge-on disk that extends in the east-west direction. Our understanding of the kinematics remain unsettled between these two contradicting pictures.
In this paper, we analyze the ALMA archival data taken at 2 resolution and present images of Sgr B2(N) in SiO () [hereafter SiO] and SO2 () [hereafter SO2] line emission. At the adopted distance of 7.8 kpc (Reid et al., 2009), 2 corresponds to 0.076 pc. The SO2 molecule is a good tracer of dense and hot gas typical of hot cores (e.g., Charnley, 1997; van der Tak et al., 2003; Leurini et al., 2007; Jiménez-Serra et al., 2007), while SiO is an excellent tracer of molecular outflows and shocks (e.g., Downes et al., 1982; Bachiller et al., 1991; Zapata et al., 2009a; Leurini et al., 2014). The goal is to establish a clearer kinematic picture of the Sgr B2(N) core, and to enable further explorations of the processes associated with the on-going high-mass stars formation. We also report the possible discovery of the SiO () maser emission from Sgr B2(N).
2 OBSERVATIONS
Sgr B2(N) was observed with ALMA (Hills et al., 2010) during Early Science Cycle 0 (Belloche et al., 2014). The observations were done in 1 execution with 21 12-m antennas and 3 executions with 26 12-m antennas at an angular resolution of 2. The maximum baseline length achieved during the observations was 440 m. The full frequency range between 84 and 111 GHz was covered in the spectral scan mode with four overlapping basebands. The HPBW of the primary beam varies between 74 at 84 GHz and 56 at 111 GHz. The channel spacing was 244 kHz, and smoothed spectra were 488 kHz (1.6 km s-1).
The ALMA calibration includes simultaneous observations of the atmospheric 183 GHz water line with water vapor radiometers. The measured water columns in the antenna beam were later used to reduce the atmospheric phase fluctuations. Amplitude calibration was done using Neptune. The quasars B1730-130 and J1700-261 were used to calibrate the bandpass and the complex gain fluctuations, respectively. Data reduction was performed using the Common Astronomy Software Applications package (CASA; http://casa.nrao.edu). Natural Weighting was used for imaging. The sensitivity obtained ranges from 3 to 7 mJy beam-1 per channel of 1.6 km s-1 (see details in Table 1).
In this paper, we focus on the SO2 and SiO lines. Among several transitions of SO2 detected between 84 and 111 GHz in the ALMA observations, we select 124,8–133,11 transition for the most part of our analysis because; (1) its upper state energy is high ( K), and it traces the hotter and denser region in the immediate vicinity of the young star, and (2) this transition is relatively less contaminated by the other coincident lines so that we can get clearer kinematic picture of the core. SiO is an excellent tracer of shocks and molecular outflows (e.g., Downes et al., 1982; Martín-Pintado et al., 1997; Zapata et al., 2009a). We also investigate the lines of SiO in the =1,2,3 vibrationally excited states. Parameters of the data used are summarized in Table 1.
3 RESULTS and DISCUSSION
3.1 Line profiles
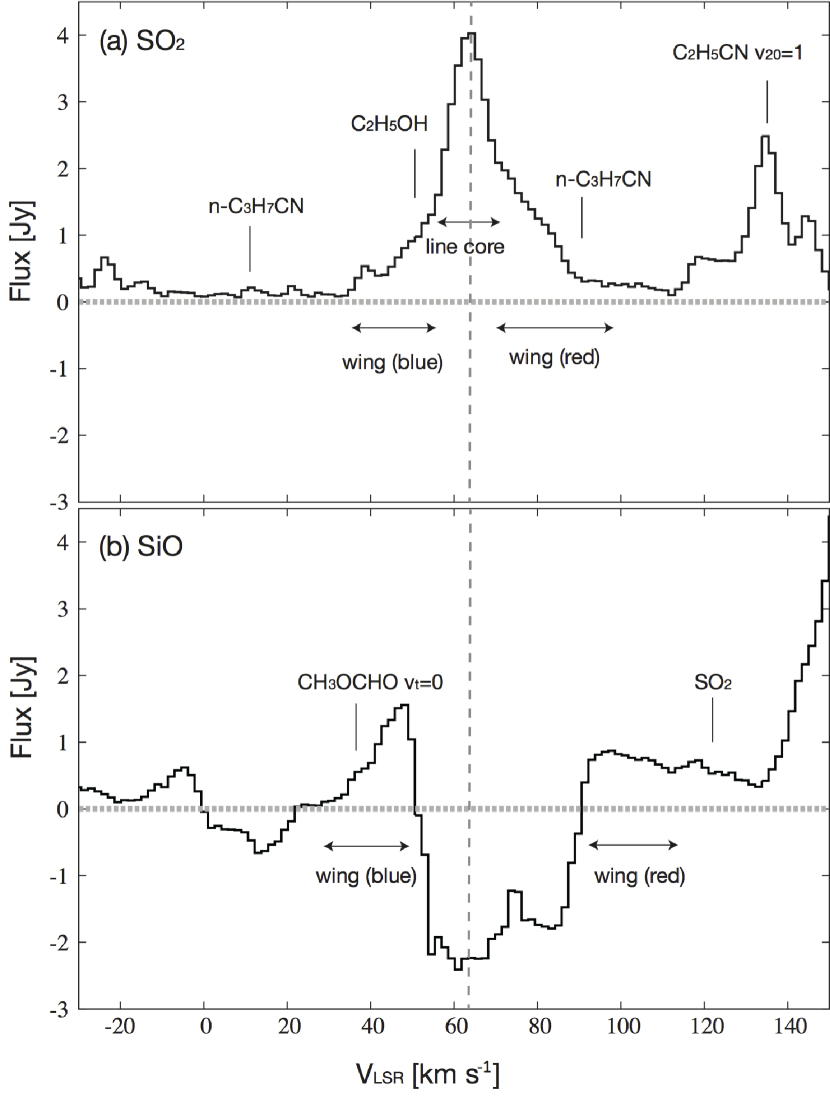
Figure 1 shows the spectra of the SO2 and SiO lines integrated within a 2020 region centered on the K2 position: (, )=[17471988, 28∘22184] (Gaume et al., 1995). Many spectral lines other than SO2 and SiO are detected in the ALMA data toward Sgr B2(N). We also label the molecular lines near the SO2 and SiO lines identified by Belloche et al. (2013) using the IRAM 30 m telescope. Although these molecular lines partially overlap with the SiO and SO2 lines, we can separate them because their spatial distributions are different.
The integrated SO2 spectrum in Figure 1(a) has an emission peak of 4.0 Jy at 63 km s-1, which we adopt for the systemic velocity (SYS) of Sgr B2(N). We define as LSR–SYS (SYS=63 km s-1). By visual inspection of the SO2 spectrum, it is seen a line core from of 56 to 70 km s-1 (= -7 to +7 km s-1), a blueshifted wing from to 56 km s-1 ( to -7 km s-1), and a redshifted wing from to 110 km s-1 ( to +47 km s-1).
The integrated SiO spectrum in Figure 1(b) shows a deep absorption from to 92 km s-1 ( to +29 km s-1). This is consistent with the observations made by Liu et al. (1998) using the Berkeley-Illinois-Maryland Association (BIMA) array. In addition, the present SiO spectrum exhibits wing emission at blueshifted velocities of to 48 km s-1 ( to -15 km s-1) and redshifted velocities of to 110 km s-1 ( to +47 km s-1).
3.2 Kinematic structure of SO2 and SiO emission
3.2.1 SO2 line emission
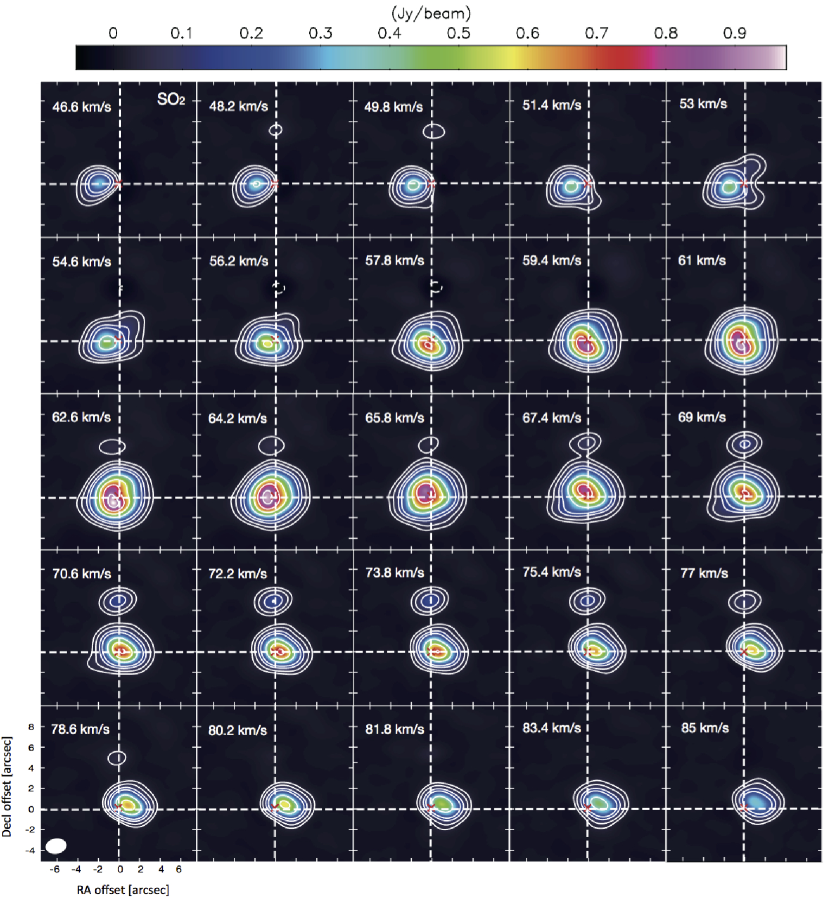
Figure 2 shows the channel maps of SO2 emission in the velocity range of = 47 to 85 km s-1 (= -16 to +22 km s-1). The positions are shown in offsets from the of K2. At the velocities of the blueshifted wing shown in Figure 2 (=47 to 56 km s-1, = -16 to -7 km s-1) the SO2 emission extends to E to SE of K2, while at the velocities of the redshifted wing in Figure 2 (=70 to 85 km s-1, = +7 to +22 km s-1) the emission extends to W to NW of K2. This makes a clear E-W velocity gradient. However, within the “line core” (=56 to 70 km s-1, also see Figure 1), the velocity gradient changes its direction. At = 57.8 to 61 km s-1, the peak of the SO2 emission in located to S-SE of K2, while at = 65.8 to 69 km s-1 the peak is NE-N of K2. This “line core” component may predominantly originate from the central compact core and is likely tracing a different kinematic structure (e.g., Sánchez-Monge et al., 2014; Guzmán et al., 2014). A secondary peak is seen 5 north of K2 at 70 km s-1. This is identified with one of the compact “quasi-thermal cores”, source , observed in CH3OH by Mehringer & Menten (1997).
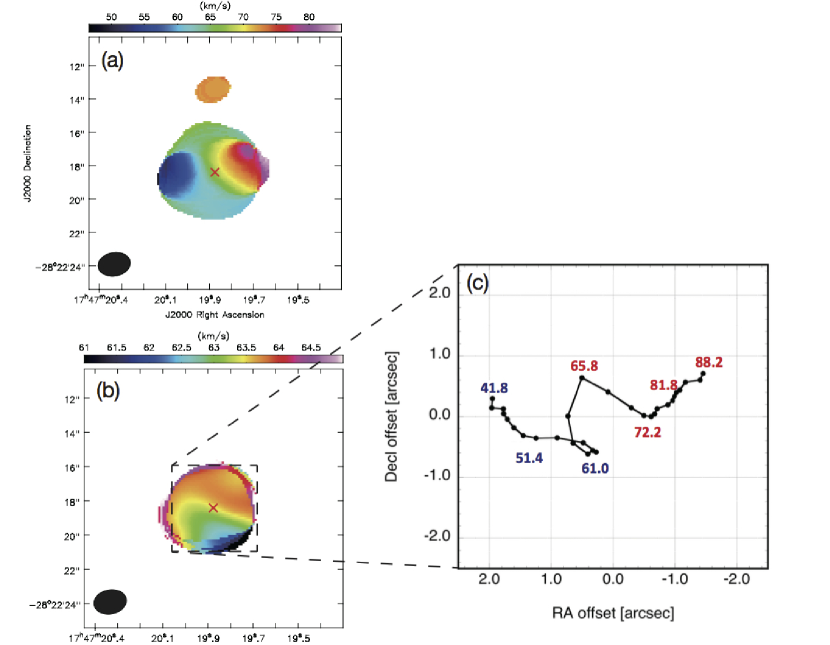
The change of the direction of the velocity gradient described above is clearly shown by the moment maps in Figure 3. The first moment map (intensity-weighted velocity) made from the entire velocity range of = 33 to 109 km s-1 (= -30 to +46 km s-1) shows the E-W velocity gradient (Figure 3(a)). In contrast, the first moment map made from channels near the systemic velocity (=59 to 65 km s-1) shows the S-N velocity gradient (Figure 3(b)).
Figure 3(c) shows the positional shift of the SO2 emission peak with velocity. As we noted in Figure 2, the peak at the wing velocities ( 7 km s-1) trace the E-W velocity gradient, while the peak positions at the “line core” velocities ( 7 km s-1) clearly shows the N-S velocity gradient perpendicular to the former.
3.2.2 SiO line emission
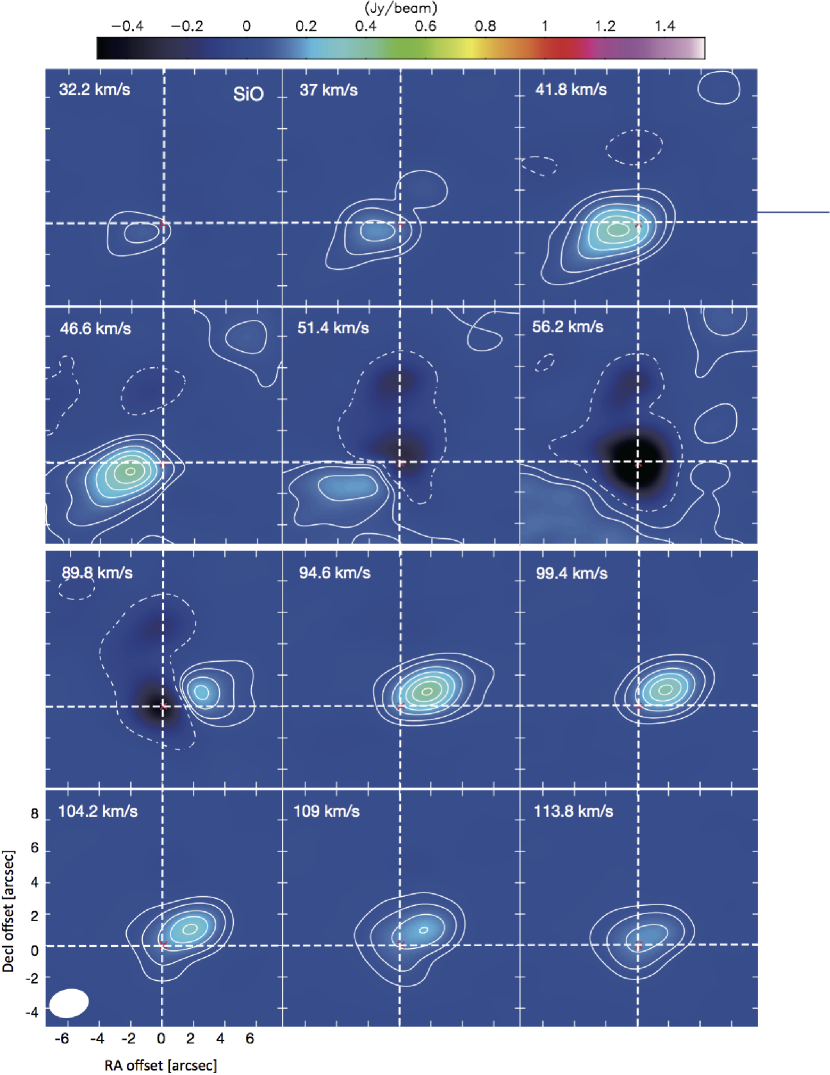
Figure 4 shows the velocity channel maps of the SiO wing at emission seen in Figure 1(b), i.e., blueshifted wing at =32 to 51 km s-1 (=-31 to -12 km s-1) and redshifted wing at =90 to 114 km s-1 (= +27 to +51 km s-1).
The SiO emission at blueshifted wing extends to E to SE of K2, while that at the redshifted wing extends to W to NW of K2. This is similar to what we see for the SO2 emission at the wing velocities, and suggests that SiO and SO2 emission share the same kinematics.
3.3 Bipolar outflow and rotating hot core
As we described in Section 1, the understanding of the kinematic structure of the Sgr B2(N) core is unsettled. Two mutually contradicting interpretations have been put forward so far; a) E-W bipolar jet and a disk rotating in N-S direction (e.g., Lis et al., 1993), and b) a large disk rotating in E-W direction (Hollis et al., 2003). What do the new ALMA observations tell us?
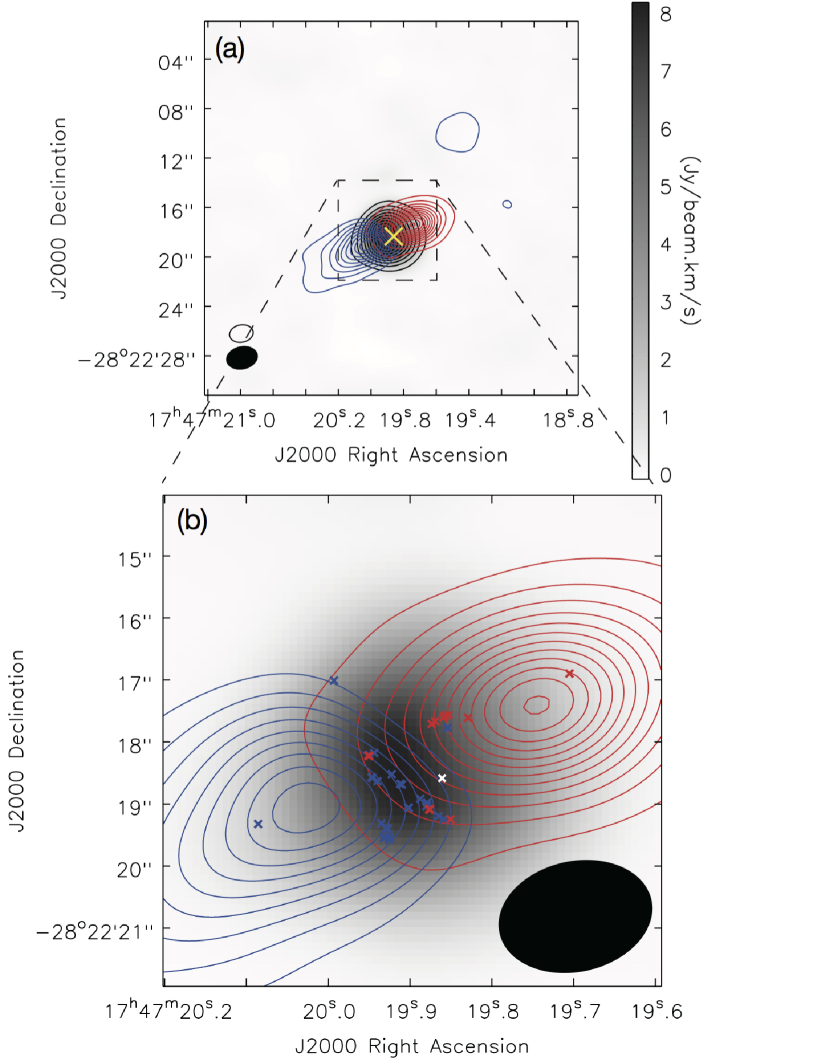
The SO2 and SiO spectra show the wing emission at high velocities, which suggests the presence of an outflow with velocities far exceeding 20 km s-1 ( to +47 km s-1 for SO2 and to +47 km s-1 for SiO). Figure 5(a) shows the spatial distribution of the SiO wing emission that we identify as the bipolar outflow. The velocity ranges were selected to separate distinct feature of outflow lobes. The bipolar outflow lobes are aligned in the E-W direction (P.A.=120∘10∘), and are symmetrically displaced about the peak of the integrated SO2 emission near K2. Figure 5(b) shows the zoom-up of the central region. Blue and red crosses mark the position of the H2O maser spots reported by McGrath et al. (2004) blue- and redshifted with respect to the systemic velocity = 63 km s-1, respectively. The position and velocity of the masers are consistent with the innermost part of the blueshifted and redshifted outflowing gas traced by SO2 and SiO. The white cross marks the position of the possible SiO maser source presented in Section 3.5.
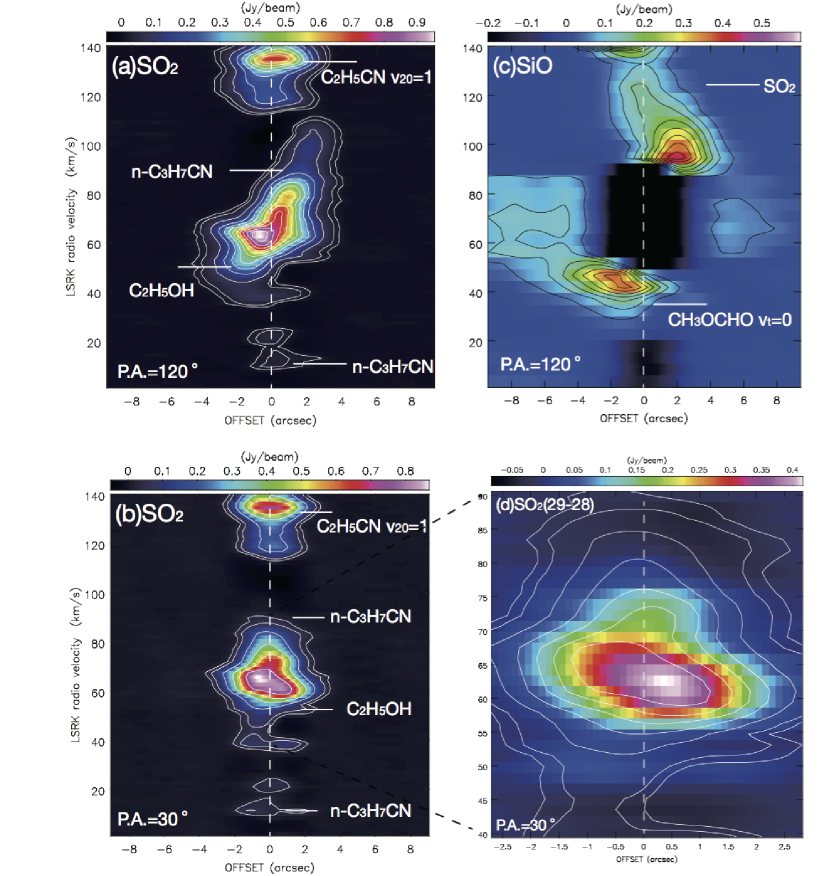
Figure 6(a) shows the observed position-velocity (P-V) diagram of the SO2 emission along the major axis of the bipolar outflow (P.A.=120∘). The P-V diagram along this axis shows blueshifted and redshifted emission extending to to +47 km s-1. Figure 6(b) shows the observed P-V diagrams of the SO2 emission in the direction perpendicular to the axis of the outflow (P.A.=30∘). Between LSR=59 to 65 km s-1, the peak velocity changes almost linearly as a function of the position with a constant velocity gradient. Figure 6(c) shows the P-V diagram of the SiO emission along the major axis of the blueshifted and redshifted components (P.A.=120∘). The blueshifted and redshifted SiO emission is seen extending up to to +47 km s-1. This shows that the SiO and SO2 lines share the same kinematics except for the severe foreground absorption in SiO at low velocities (= -15 to +29 km s-1).
From the results presented above, we summarize the evidences for the existence of the bipolar outflow as follows; (1) presence of high-velocity gas (wing components) in the spectra of shock tracers, (2) the bipolar structure is highly symmetric and well traced by the SiO line, which is a good tracer of outflows, (3) H2O masers are associated with the bipolar structure, and (4) the high velocity motion cannot be gravitationally bound by the central core. In fact, were the high velocity emission a result of a gravitationally bound circular motion, the mass required inside its orbit is estimated by the dynamical mass ;
| (1) |
where is an angular velocity, and is a rotational radius. From the observed angular velocity of 1.610-11 s-1 and a 0.08 pc radius, we derive a dynamical mass of 3104 needed to gravitationally bind the motion, which should be seen as a lower limit because we do not correct for the inclination of the motion. This value is higher than the mass of the core derived from the 1.3 mm and 1.1 mm continuum emission with larger core radius (9103 by Lis et al. 1993; 1104 by Qin et al. 2008; 4–20103 by Liu et al. 1999), and shows that the gas responsible for the high velocity wing emission cannot be gravitationally bound by the central core.
Meanwhile, we consider that the N-S velocity gradient observed in SO2 at P.A. = 30∘, i.e., orthogonal to the bipolar outflow, is a signature of the rotating motion of the core (see Figure 6(b)). It has been reported that SO2 traces rotating cores in other regions of massive star formation (e.g., Beltrán et al., 2014; Guzmán et al., 2014). From Figure 6(b), we determine a velocity gradient of 88 km s-1 pc-1 or an angular velocity 10s-1 at a radius pc (or 5,800 AU). Using Equation (1), we estimate that a dynamical mass of 42 is needed within this radius to gravitationally bind the rotating motion, where is the inclination of the rotation axis with respect to the line of sight.
Our conclusion on the configuration of the bipolar outflow and the rotating core supports the original interpretation by Lis et al. (1993). They noted the N-S linear velocity gradient in the core of 2 km s-1 arcsec-1 (10s-1 at the distance of 7.8 kpc), which is 40 percent smaller than our estimate above. This small discrepancy may be because of their larger synthesized beam (4.5 3.7 FWHM) and the fact that they measured the gradient in the N-S direction while the gradient is steepest at P.A. = 30∘.
The SO2 emission in Figure 6(b) exhibits a constant velocity gradient rather than the pattern of the Keplerian rotation that is characterized by an increase of the rotation velocity at closer distance to the central star. To further examine this point, we analyzed the SO2 294,26–285,23 (99.3925 GHz) and 325,27–316,26 (84.3209 GHz) emission that arise from energy levels at 441 K and 549 K from the ground state, respectively, much higher than 110.6 K for the 124,8–133,11 transition we have discussed so far. Both lines are free from contamination by other molecular lines, and are detected at the peak flux density of 0.44 Jy beam-1 (294,26–285,23) and 0.28 Jy beam-1 (325,27–316,26), with the distribution quite similar to each other. Figure 6(d) shows the P-V diagram of the SO2 294,26–285,23 emission at P.A.=30∘ (color) in comparison with that of the SO2 124,8–133,11 emission (contours). Although the 294,26–285,23 emission arises from much hotter and denser molecular gas, the velocity gradient is similar to that of the 124,8–133,11 emission. This situation is quite different from the case of a disk in Keplerian rotation around a massive star, for which we should see a steeper velocity gradient for lines arising from the hotter and denser region closer to the star. We conclude that the “line core” emission of SO2 in Sgr B2(N), when observed at a 2 (0.076 pc or 15,600 AU) resolution, arises from a rotating ring-like structure with a radius 6000 AU.
3.4 Physical parameters of the bipolar outflow
3.4.1 Fractional abundances of SO2 and SiO
In order to estimate the physical parameters of the outflow, we need to know the fractional abundances of SO2 and SiO, defined as (SO2)=[SO2]/[H2] and (SiO)=[SiO]/[H2], which are known to vary significantly from an object to another (e.g., Martin-Pintado et al., 1992; Charnley, 1997; van der Tak et al., 2003; Sanhueza et al., 2012, 2013). We estimate the SO2 and SiO fractional abundances by a comparison with the Sgr B2(N) outflow detected in C18O, which is one of the molecular probes with stable fractional abundances. Unfortunately, an analysis of the C18O emission included in the present observations (Hasegawa et al., in prep.) shows that overlaps with the emission of HNCO (5=1), CH3CN (4=1), and C2H5OCHO (e.g., Belloche et al., 2013) lines make it difficult to analyze the high velocity C18O wing emission over the full velocity range of the outflow. Instead, we choose a less-contaminated velocity channel at 46.6 km s-1 and compare with SO2 and SiO. Even at this velocity, point-like CH3CN(4=1) emission at K2 contaminates the C18O image. We avoid the K2 position and average C18O, SO2 and SiO emission over a 66 box centered at (, )=[17472022, 28∘22197], which is 4″ away from the position of K2.
For derivation of the SO2 and SiO abundances, we assume that SO2, SiO and C18O lines are optically thin and in a local thermodynamical equilibrium (LTE, i.e., they are excited to a common excitation temperature ). In addition, we assume that their relative abundances are uniform in the position-velocity space defined by the outflow. For , we have adopted a range of possible temperatures (50, 100, and 150 K) to compare the results.
Molecular column densities can be calculated (Liu et al., 1998) from
| (2) |
where are the FWHM major and minor axes of the synthesized beam in units of arcseconds, is the partition function, is the upper energy level in K, is the rest frequency of the transition in GHz, and is the product of the intrinsic line strength and the squared dipole momentum in D2. is the measured intensity in Jy beam-1, and is the excitation temperature in K. is the measured integrated line emission in Jy beam-1 km s-1.
For the SO2 line, we use (150 K) = 2091, (100 K) = 1140, (50 K) = 404 from Pickett et al. (1998), =110.6 K and =8.27 D2 (Belloche et al., 2013). Similarly for the SiO line, we use (150 K) = 144, (100 K) = 96, (50 K) = 48 (Pickett et al., 1998), =6.25 K, =19.2 D2 (Liu et al., 1998; Fernández-López et al., 2013). The calculated column densities of SO2 and SiO per unit velocity width at km s-1 are shown in Table 2 with the assumed excitation temperatures. For the fractional abundances, we derive the H2 column densities per unit velocity width from the C18O column densities per unit velocity width at km s-1 and the adopted (C18O) of for Sgr B2 (Lis & Goldsmith, 1989).
Table 2 shows the SO2 and SiO fractional abundances derived for = 50, 100, and 150 K. We note that the fractional abundances vary only mildly with the assumed LTE temperature, particularly for SiO. For the following discussion of the physical parameters of the outflow, we adopt the values derived for K with an uncertainty range estimated from the cases of = 50 and 150 K, i.e., (SO2) = 10-8 and (SiO) = 10-9.
These values are consistent with the previous estimates for other high-mass hot cores. van der Tak et al. (2003), Esplugues et al. (2013) derived molecular abundance of SO2 in high-mass star-forming regions ranging from (SO2) = 10-6 to 10-8. Gusdorf et al. (2008), Tercero et al. (2011), Sanhueza et al. (2013) and Leurini et al. (2014) found the fractional abundance of SiO in the high-mass protostellar outflows ranging from (SiO) = 10-7 to 10-9. We should keep in mind that there is an uncertainty in our determination of the fractional abundances due to the assumption of uniform excitation and chemistry over space and velocity, which is the best allowed by the present data although it is obviously a bold simplification.
3.4.2 Physical parameters
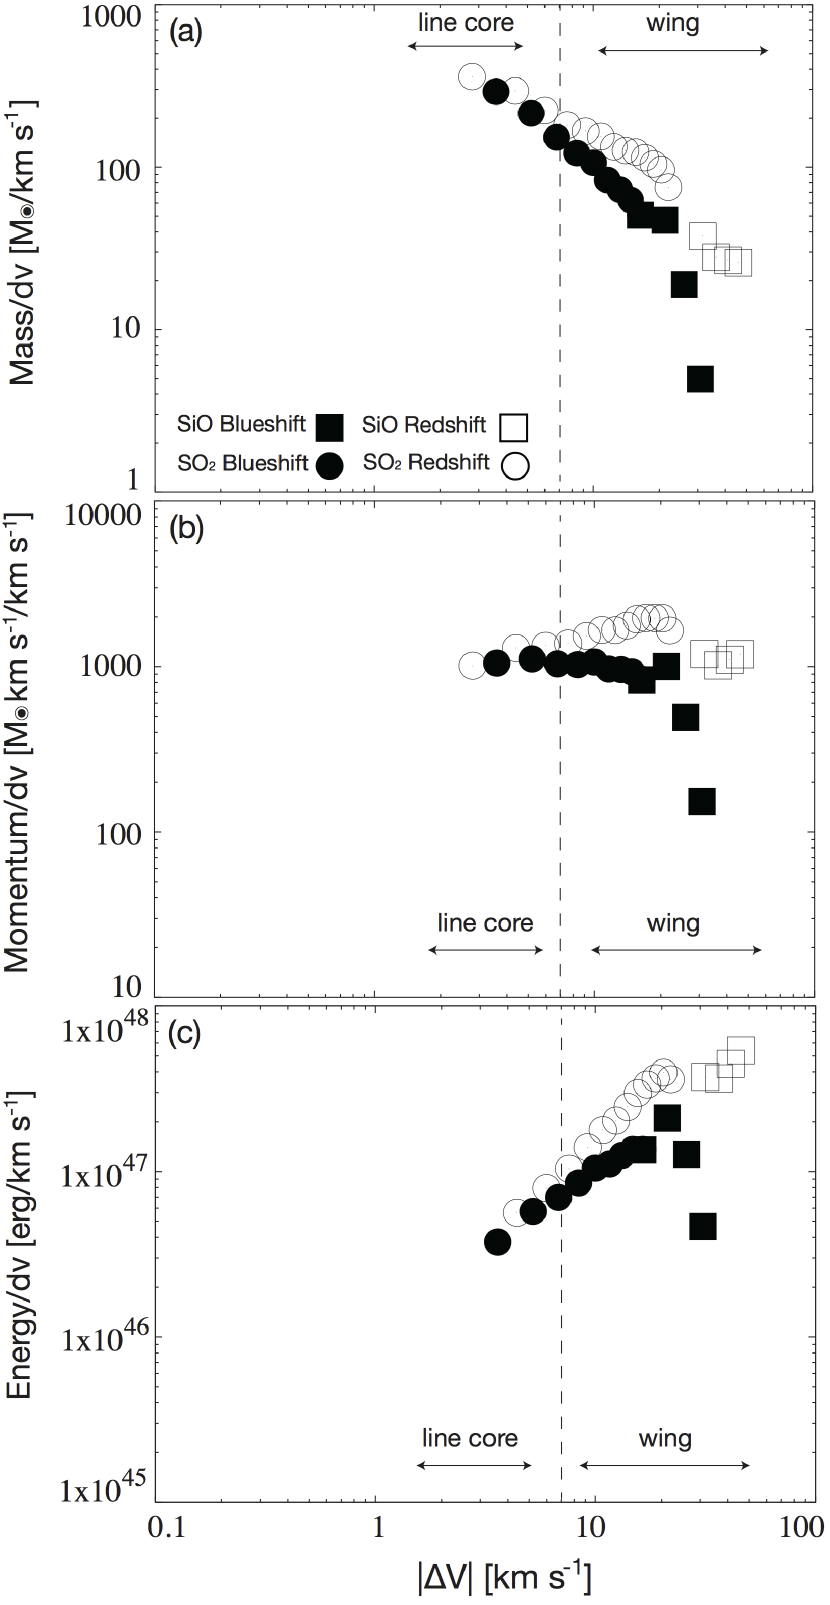
Using the derived fractional abundances, we estimate the mass of the outflow material for individual velocity channels of the the SO2 and SiO images. Figure 7 shows the plots of (a) masses, (b) momenta, and (c) energies in the outflow per unit velocity width as a function of velocity offset from the systemic velocity (=-). The mass plot in Figure 7(a) suggests an approximate power law in a form of /, with a power index -1. This slope is quite shallow compared with cases of outflows from low-mass protostars (, Shepherd et al., 1998)). Richer et al. (2000) and Arce et al. (2007) noted a tendency for the slope to steepen (from to ) with the outflow age. The shallow slope of the Sgr B2(N) outflow is consistent with its youth ( years, see Table 3).
Figures 7(b) and (c) show that the momentum is distributed rather evenly over the velocity range of the outflow, and that the majority of the kinetic energy is carried at larger . It would be quite interesting to see how these plots compare with similar plots for other regions of high-mass star formation seen at high spatial resolution.
Table 3 summarizes the physical properties of the molecular gas in the outflow. The momentum is given by and the energy by (1/2), where is the outflow mass in the velocity channel and is its velocity offset relative to . For the derivation of the outflow parameters, no correction for inclination angle was applied. We integrate only the velocity ranges of 7 km s-1 for deriving the physical parameters of the outflow. The total mass of Sgr B2(N) outflow is derived as a sum of SiO emission (= 32.2 km s-1 to 46.6 km s-1 for blueshifted velocities and = 89.8 km s-1 to 109 km s-1 for redshifted velocities) and SO2 emission (=48.2 km s-1 to 54.6 km s-1 for blueshifted velocities and = 72.2 km s-1 to 85 km s-1 for redshifted velocities). Typical outflow velocity, is derived from the ratio between momentum and mass. Comparing the spatial structure of the outflow with other massive outflows (e.g., W51 North, Zapata et al. 2009), the outflow in Sgr B2(N) has a relatively symmetric structure.
Ridge & Moore (2001) estimated the parameters of molecular outflows from 11 high-mass star-forming regions at a distance of 2 kpc. In comparison with their physical parameters, the Sgr B2(N) outflow has a comparable mass (2000 ), while the flow size and the dynamical timescale of Sgr B2(N) is an order of magnitude smaller with the other high-mass star forming regions. Liu et al. (1998) presented the SiO outflow from Sgr B2(M) whose mass of 100 assuming (SiO) of 10-7. If they adopt (SiO) of 10-8 for Sgr B2(M), their outflow mass will be similar to the Sgr B2(N) result. The dynamical timescales of G331.5–01 (Bronfman et al., 2008; Merello et al., 2013) and W 51 North (Zapata et al., 2009a) outflows are comparable to the Sgr B2(N) outflow. The collimation of the Sgr B2(N) outflow is estimated from measuring FWHM of the peak emission of the outflow, which is 0.1 pc apart from the K2, and result in 60∘. From the comparisons, the Sgr B2(N) outflow can be characterized as a young and massive, but moderately collimated outflow.
In comparison with the outflows listed in Zhang et al. (2001), Beuther et al. (2002), the recompilation of Wu et al. (2004) and Wu et al. (2005), the SgrB2(N) outflows with 2000 sits near the massive end of the spectrum. The Sgr B2(N) outflow can be a single massive outflow expected at the early stages of massive star formation (e.g., Zapata et al., 2010), or alternatively the large mass can be a result of overlap and merge of the multiple outflows as in IRAS 16547–4247 (Higuchi et al., 2015). In order to resolve the outflow completely, observations with higher spatial resolution are needed.
3.5 Possible Detection of SiO Maser Emission
The maser emission of vibrationally excited SiO in regions of star formation is rare. It has been detected from only three regions of massive star formation so far, i.e., Orion-KL (Snyder & Buhl, 1974; Thaddeus et al., 1974), W51 IRS2 and Sgr B2(M) MD5 (Hasegawa et al., 1986; Ukita et al., 1987; Morita et al., 1992), despite intensive searches for similar objects in star forming regions (Genzel et al., 1980; Barvainis & Clemens, 1984; Jewell et al., 1985; Zapata et al., 2009b).
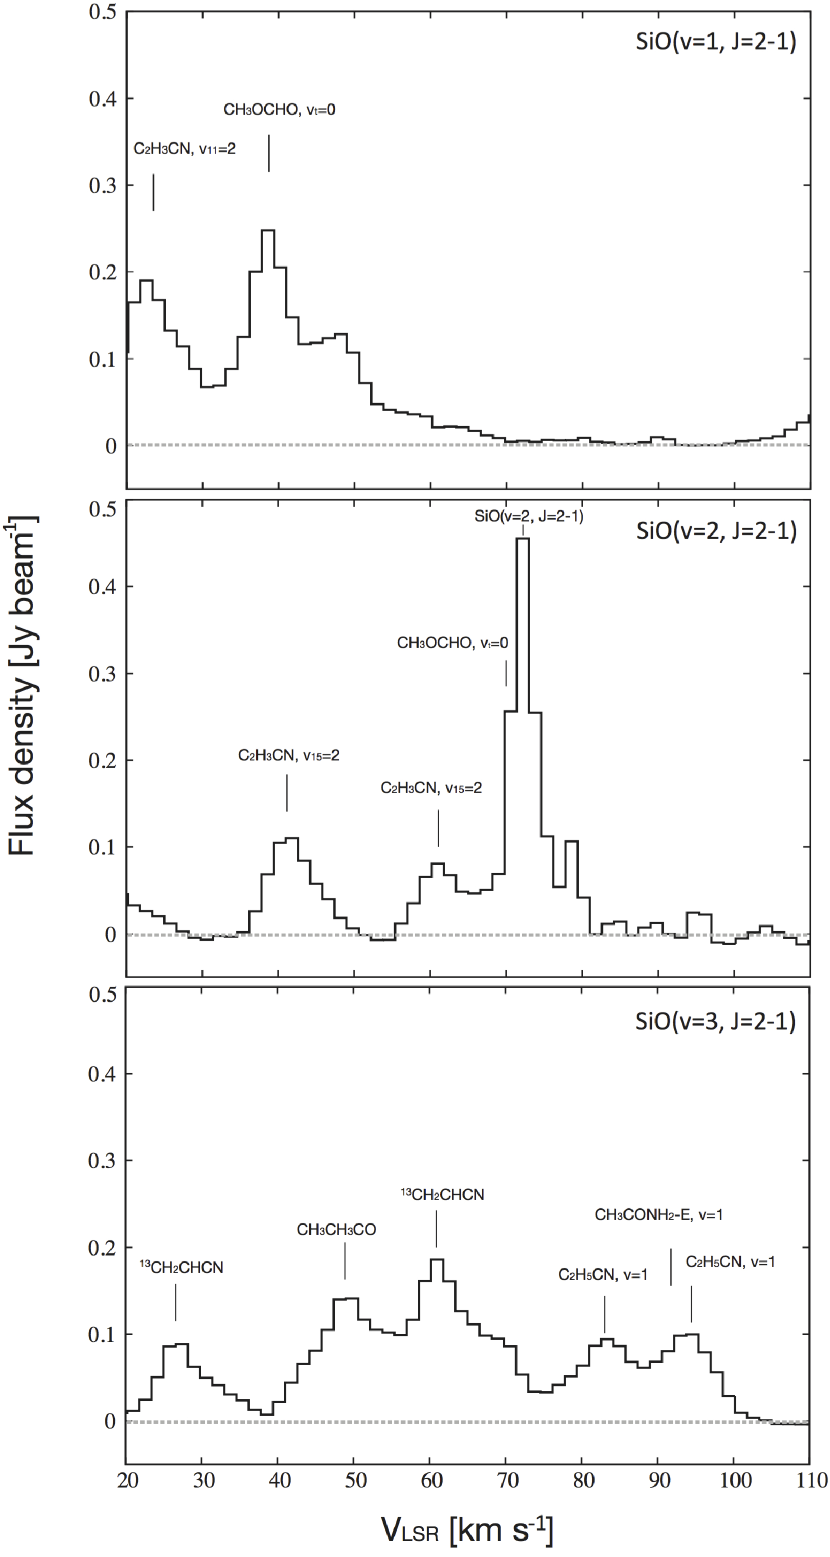
We checked the ALMA data at the frequencies of the SiO () lines in the = 1, 2, and 3 vibrationally excited states, and found an emission line for with a peak flux density of 2 Jy at =72 km s-1 (Figure 8). The emission has a linewidth of FWHM=3.80.3 km s-1, which is much narrower than the typical width of thermal emission lines from this region (FWHM10 km s-1). Its spatial distribution is point-like (source size 15) and its position, (, )=[17471986, 28∘22185], is coincident with the position of K2 within 02. The frequency of the detected emission corresponds to the CH3OCHO () line at = 65 km s-1, but this assignment is unlikely because the emission in other transitions of this molecule have larger linewidth (FWHM5 km s-1) and is spatially extended. The =72 km s-1 of the SiO () line emission is 9 km s-1 redshifted with respect to the systemic velocity of =63 km s-1, but it is within the velocity range of the H2O masers. This kind of velocity offset is seen also in W51 IRS2 and Sgr B2(M) MD5 (Hasegawa et al., 1986; Zapata et al., 2009b). From the total flux of the SiO () line emission, the isotropic photon luminosity is estimated as = 2.8 1044 s-1. This comfortably falls within the range of the SiO masers detected in other star forming regions (Zapata et al., 2009b). No corresponding signal was found for the =1 line exceeding 0.02 Jy(3 ). The spectral range of the =3 line overlaps with the lines from CH2CH13CN, CH3CH3CO, C2H5CN() and CH3C(O)NH2, but there seems to be no SiO (=3, =2–1) line stronger than 0.4 Jy.
Although SiO masers in various transitions in vibrationally excited states up to are detected from many evolved stars such as Mira variables and red supergiants, the emission is anomalously weak, and exhibits some peculiarity when detected (Clark et al., 1981; Olofsson et al., 1981, 1985; Bujarrabal et al., 1996, 2007). Olofsson et al. (1985) has proposed that this behavior could arise from a population transfer due to line overlap between ro-vibrational transitions of SiO and H2O in the masing regions around evolved stars. None of the three previously known SiO masers in star forming regions has been detected in the transition. In the case of the SiO maser in W51 IRS2, only the emission was detected during 1985 - 1989 with the upper limits at to of the intensities (Hasegawa et al., 1986; Fuente et al., 1989). When Zapata et al. (2009b) observed it in 2003, they found that the emission was detectable at 1.0 Jy while the emission had become weaker at 2.5 Jy. As our understanding of the excitation mechanism for the SiO masers in star forming regions is still limited, we cannot rule out the maser assignment from the fact that only the transition is detected.
The characteristics of the emission line described above, i.e., the point-like spatial distribution and extremely narrow linewidth, make it quite probable that the line has a maser nature. It is important to confirm its assignment with the SiO () line by, e.g., observing the matching lines, measuring polarization, or setting a high enough lower limit to the line brightness temperature with a higher spatial resolution. If confirmed, it will be not only the 4th star forming region with SiO maser emission, but also the first such object with the emission. The SiO maser emission will provide crucial information on the structure, kinematics and physical condition of the close vicinity (within AU) of the massive protostar that drives the outflow.
3.6 Insight on the Process of Massive Star Formation
Based on the observations of a sample of hot molecular cores around massive (proto-) stars, Cesaroni et al. (2006) and Beltrán et al. (2011) have proposed that the rotating cores are classified into two classes, i.e., circumstellar disks and circumcluster toroids. In their scenario of massive star formation, a larger scale infalling envelope provides the mass to the toroid, which is a transitional structure that feeds the mass towards the accretion disks with Keplerian rotation around individual forming stars in the central cluster. Recent observations with millimeter and submillimeter interferometers provide increasing evidences of disk-like structures of radii 1000 - 2000 AU with signatures of Keplerian rotation around B or O type (proto) stars (e.g., Cesaroni et al., 2014; Hunter et al., 2014; Beltrán et al., 2014; Johnston et al., 2015). Compared with these cases, the rotating SO2 core we found around K2 in Sgr B2(N) may fall in the class of toroids, because it is a much larger ring-like structure without the signature of the Keplerian rotation.
The structure of Sgr B2(N) presented here shows an intriguing resemblance to that of W51 North. Both objects are embedded in very luminous regions of massive star formation, and have the system of bipolar outflow and a large rotating hot core (e.g., Zapata et al., 2009a, 2010). The bipolar outflow of W51 North is well traced by the SiO (5 - 4) and CO (2 - 1) emission. Its mass is , which is an order of magnitude less than what we find in Sgr B2(N), but is still a massive outflow (see, e.g., Zhang et al., 2001; Beuther et al., 2002; Wu et al., 2004, 2005). Near the driving source is a cluster of luminous H2O masers that span a large velocity range, and a SiO maser (e.g., Morita et al., 1992; Eisner et al., 2002). At the center is a peak of millimeter and submillimeter dust emission and a hot rotating core surrounds it (Zapata et al., 2009a, 2010). The hot core appears as a rotating toroid with a central cavity 3000 AU in radius, when observed in SO2 () and other molecular lines arising from energy levels 20 - 800 K above the ground state. Molecular emission from even higher energy levels are more spatially confined and fills in the cavity with the kinematics reproduced by a model of a Keplerian disk with an infalling motion. Based on these observations, Zapata et al. (2010) proposed a possible evolutionary sequence of massive star formation in four phases, in which W51 North is placed in Phase II, the large and massive pseudo-disk with layers of physical conditions. Sgr B2(N) may be in the same phase or a little later, with a continuum source K2 detected at centimeter wavelengths.
At this point, the structure and kinematics of the molecular gas in Sgr B2(N) inside the SO2 toroid is not known. Is it a single and coherent structure as postulated in the core accretion model of massive star formation, or, alternatively, a cluster of forming stars with accretion disks collectively contributing to the large luminosity and the massive bipolar outflow in the scenario of competitive accretion (e.g., Tan et al., 2014)? The modest spatial resolution (2) of the ALMA data we analyzed here leaves this important question open. Further ALMA observations with higher spatial resolution would answer the question and uncover the processes that link the Sgr B2(N) toroid to the massive star formation inside it.
4 SUMMARY
We have analyzed the archival data of the ALMA observations of Sgr B2(N) in SO2() and SiO () lines at an angular resolution of 2 to investigate the kinematic structure of the region. Our main findings are summarized as follows:
-
1.
Sgr B2(N) has a system of a bipolar outflow and a rotating core, as originally interpreted by Lis et al. (1993). The SiO line shows the bipolar outflow whose driving source is located at K2, and the SO2 line shows both the outflowing gas and the rotating hot core. We note that H2O masers are associated with innermost part of the bipolar outflow.
-
2.
Sgr B2(N) outflow is characterized as a young (5103 yr) and massive (2000 ) outflow. It is moderately collimated (60∘).
-
3.
Fractional abundances of SO2 and SiO in the outflowing gas are estimated by a comparison with the C18O () emission to be (SO2) of 10-8 and (SiO) of 10-9 for the assumed excitation temperature of K. These values are consistent with the estimates in other high-mass star forming regions.
-
4.
The mass spectrum of the outflow suggests an approximate power law in a form of /, with a power index . The shallow slope is consistent with the youth of the Sgr B2(N) outflow. The outflow momentum is distributed rather evenly over the velocity range of the outflow, while a majority of the kinetic energy is carried at larger .
-
5.
We discovered a point source of narrow line emission at the position of K2 in Sgr B2(N) that can possibly be assigned to the SiO () maser emission, although this assignment needs a confirmation. When confirmed, this will make Sgr B2(N) the 4th star forming region with detected SiO masers.
-
6.
The hot rotating core found in the SO2 emission has a ring-like structure with a radius AU without a clear sign of Keplerian rotation, and it falls in the class of toroid classified by Beltrán et al. (2011). Sgr B2(N) exhibits striking resemblance to W51 North, although we do not know the structure inside the toroid of Sgr B2(N). Compared with W51 North, Sgr B2(N) may be in the same or a little later phase in the scenario of massive star formation proposed by Zapata et al. (2010).
Although the overly rich emission lines detected from Sgr B2(N) require careful selection of molecules and transitions for proper analyses, ALMA data are proven to be very useful in understanding the kinematics and physical parameters of this high-mass star formation region. Sgr B2 complex is one of the most important regions as sources for understanding high-mass star formation in ALMA-era.
We thank the anonymous referee for careful reading and constructive comments that helped greatly to improve the manuscript. We also thank the ALMA staff for the observations during the commissioning stage. This letter makes use of the following ALMA data: ADS/JAO.ALMA2011.0.0017.S. ALMA is a partnership of ESO (representing its member states), NSF (USA), and NINS (Japan), together with NRC (Canada), NSC, and ASIAA (Taiwan), in cooperation with the Republic of Chile. The Joint ALMA Observatory is operated by ESO, AUI/NRAO, and NAOJ. Data analysis were carried out on common use data analysis computer system at the Astronomy Data Center, ADC, of the National Astronomical Observatory of Japan. We acknowledge Takashi Tsukaghi and Koichiro Sugiyama for their contributions.
References
- Arce et al. (2007) Arce, H. G., Shepherd, D., Gueth, F., et al. 2007, Protostars and Planets V, 245
- Bachiller et al. (1991) Bachiller, R., Martin-Pintado, J., & Fuente, A. 1991, A&A, 243, L21
- Barvainis & Clemens (1984) Barvainis, R., & Clemens, D. P. 1984, AJ, 89, 1833
- Belloche et al. (2014) Belloche, A., Garrod, R. T., Müller, H. S. P., & Menten, K. M. 2014, Science, 345, 1584
- Belloche et al. (2013) Belloche, A., Müller, H. S. P., Menten, K. M., Schilke, P., & Comito, C. 2013, A&A, 559, AA47
- Belloche et al. (2008) Belloche, A., Menten, K. M., Comito, C., et al. 2008, A&A, 482, 179
- Beltrán et al. (2011) Beltrán, M. T., Cesaroni, R., Neri, R., & Codella, C. 2011, A&A, 525, A151
- Beltrán et al. (2014) Beltrán, M. T., Sánchez-Monge, Á., Cesaroni, R., et al. 2014, A&A, 571, A52
- Benson & Johnston (1984) Benson, J. M., & Johnston, K. J. 1984, ApJ, 277, 181
- Beuther et al. (2002) Beuther, H., Schilke, P., Sridharan, T. K., et al. 2002, A&A, 383, 892
- Bronfman et al. (2008) Bronfman, L., Garay, G., Merello, M., et al. 2008, ApJ, 672, 391
- Bujarrabal et al. (2007) Bujarrabal, V., Alcolea, J., Colomer, F., et al. 2007, IAU Symposium, 242, 271
- Bujarrabal et al. (1996) Bujarrabal, V., Alcolea, J., Sanchez Contreras, C., & Colomer, F. 1996, A&A, 314, 883
- Carlstrom & Vogel (1989) Carlstrom, J. E., & Vogel, S. N. 1989, ApJ, 337, 408
- Cesaroni et al. (2006) Cesaroni, R., Galli, D., Lodato, G., Walmsley, M., & Zhang, Q. 2006, Nature, 444, 703
- Cesaroni et al. (2014) Cesaroni, R., Galli, D., Neri, R., & Walmsley, C. M. 2014, A&A, 566, A73
- Charnley (1997) Charnley, S. B. 1997, ApJ, 481, 396
- Clark et al. (1981) Clark, F. O., Troland, T. H., Lovas, F. J., & Schwartz, P. R. 1981, ApJ, 244, L99
- de Pree et al. (1996) de Pree, C. G., Gaume, R. A., Goss, W. M., & Claussen, M. J. 1996, ApJ, 464, 788
- Downes et al. (1982) Downes, D., Genzel, R., Hjalmarson, A., Nyman, L. A., & Ronnang, B. 1982, ApJ, 252, L29
- Eisner et al. (2002) Eisner, J. A., Greenhill, L. J., Herrnstein, J. R., Moran, J. M., & Menten, K. M. 2002, ApJ, 569, 334
- Esplugues et al. (2013) Esplugues, G. B., Tercero, B., Cernicharo, J., et al. 2013, A&A, 556, AA143
- Fernández-López et al. (2013) Fernández-López, M., Girart, J. M., Curiel, S., et al. 2013, ApJ, 778, 72
- Fuente et al. (1989) Fuente, A., Martin-Pintado, J., Alcolea, J., & Barcia, A. 1989, A&A, 223, 321
- Gardner et al. (1986) Gardner, F. F., Whiteoak, J. B., Forster, J. R., & Pankonin, V. 1986, MNRAS, 218, 385
- Gaume et al. (1995) Gaume, R. A., Claussen, M. J., de Pree, C. G., Goss, W. M., & Mehringer, D. M. 1995, ApJ, 449, 663
- Gaume & Claussen (1990) Gaume, R. A., & Claussen, M. J. 1990, ApJ, 351, 538
- Genzel et al. (1976) Genzel, R., Downes, D., Bieging, J. 1976, MNRAS, 177, 101
- Genzel et al. (1980) Genzel, R., Downes, D., Pankonin, V., et al. 1980, ApJ, 239, 519
- Goldsmith et al. (1987) Goldsmith, P. F., Snell, R. L., Hasegawa, T., Ukita, N. 1987, ApJ, 314, 525
- Gusdorf et al. (2008) Gusdorf, A., Cabrit, S., Flower, D. R., & Pineau Des Forêts, G. 2008, A&A, 482, 809
- Guzmán et al. (2014) Guzmán, A. E., Garay, G., Rodríguez, L. F., et al. 2014, ApJ, 796, 117
- Hasegawa et al. (1986) Hasegawa, T., Morita, K., Okumura, S., et al. 1986, Masers, Molecules, and Mass Outflows in Star Formation Regions, 275
- Hills et al. (2010) Hills, R. E., Kurz, R. J., & Peck, A. B. 2010, Proc. SPIE, 7733,
- Higuchi et al. (2015) Higuchi, A. E., Saigo, K., Chibueze, J. O., et al. 2015, ApJ, 798, LL33
- Higuchi et al. (2014) Higuchi, A. E., Chibueze, J. O., Habe, A., Takahira, K., & Takano, S. 2014, AJ, 147, 141
- Higuchi et al. (2013) Higuchi, A. E., Kurono, Y., Naoi, T., et al. 2013, ApJ, 765, 101
- Higuchi et al. (2010) Higuchi, A. E., Kurono, Y., Saito, M., & Kawabe, R. 2010, ApJ, 719, 1813
- Higuchi et al. (2009) Higuchi, A. E., Kurono, Y., Saito, M., & Kawabe, R. 2009, ApJ, 705, 468
- Hollis et al. (2003) Hollis, J. M., Pedelty, J. A., Boboltz, D. A., et al. 2003, ApJ, 596, L235
- Hunter et al. (2014) Hunter, T. R., Brogan, C. L., Cyganowski, C. J., & Young, K. H. 2014, ApJ, 788, 187
- Jewell et al. (1985) Jewell, P. R., Walmsley, C. M., Wilson, T. L., & Snyder, L. E. 1985, ApJ, 298, L55
- Jiménez-Serra et al. (2007) Jiménez-Serra, I., Martín-Pintado, J., Rodríguez-Franco, A., et al. 2007, ApJ, 661, L187
- Johnston et al. (2015) Johnston, K. G., Robitaille, T. P., Beuther, H., et al. 2015, arXiv:1509.08469
- Kobayashi et al. (1989) Kobayashi, H., Ishiguro, M., Chikada, Y., Ukita, N., Morita, K.-I., Okumura, S., Kasuga, T., Kawabe, R. 1989, PASJ, 41, 141
- Kuan et al. (1996) Kuan, Y.-J., Mehringer, D. M., Snyder, L. E. 1996, ApJ, 459, 619
- Kuan & Snyder (1994) Kuan, Y.-J., & Snyder, L. E. 1994, ApJS, 94, 651
- Lada (2010) Lada, C. J. 2010, Royal Society of London Philosophical Transactions Series A, 368, 713
- Lada & Lada (2003) Lada, C. J., & Lada, E. A. 2003, ARA&A, 41, 57
- Leurini et al. (2014) Leurini, S., Codella, C., López-Sepulcre, A., et al. 2014, A&A, 570, A49
- Leurini et al. (2007) Leurini, S., Beuther, H., Schilke, P., et al. 2007, A&A, 475, 925
- Lis et al. (1993) Lis, D. C., Goldsmith, P. F., Carlstrom, J. E., & Scoville, N. Z. 1993, ApJ, 402, 238
- Lis & Goldsmith (1991) Lis, D. C., & Goldsmith, P. F. 1991, ApJ, 369, 157
- Lis & Goldsmith (1990) Lis, D. C., & Goldsmith, P. F. 1990, ApJ, 356, 195
- Lis & Goldsmith (1989) Lis, D. C., & Goldsmith, P. F. 1989, ApJ, 337, 704
- Liu & Snyder (1999) Liu, S.-Y., & Snyder, L. E. 1999, ApJ, 523, 683
- Liu et al. (1998) Liu, S.-Y., Mehringer, D. M., Miao, Y., & Snyder, L. E. 1998, ApJ, 501, 680
- Martín-Pintado et al. (1997) Martín-Pintado, J., de Vicente, P., Fuente, A., & Planesas, P. 1997, ApJ, 482, L45
- Martin-Pintado et al. (1992) Martin-Pintado, J., Bachiller, R., & Fuente, A. 1992, A&A, 254, 315
- McGrath et al. (2004) McGrath, E. J., Goss, W. M., & De Pree, C. G. 2004, ApJS, 155, 577
- Mehringer & Menten (1997) Mehringer, D. M., & Menten, K. M. 1997, ApJ, 474, 346
- Merello et al. (2013) Merello, M., Bronfman, L., Garay, G., et al. 2013, ApJ, 774, 38
- Morita et al. (1992) Morita, K.-I., Hasegawa, T., Ukita, N., Okumura, S. K., & Ishiguro, M. 1992, PASJ, 44, 373
- Olofsson et al. (1981) Olofsson, H., Rydbeck, O. E. H., Lane, A. P., & Predmore, C. R. 1981, ApJ, 247, L81
- Olofsson et al. (1985) Olofsson, H., Rydbeck, O. E. H., & Nyman, L.-A. 1985, A&A, 150, 169
- Pickett et al. (1998) Pickett, H. M., Poynter, R. L., Cohen, E. A., et al. 1998, J.Quant. Spec. Rad. Transfer, 60, 883
- Qin et al. (2011) Qin, S.-L., Schilke, P., Rolffs, R., et al. 2011, A&A, 530, LL9
- Ridge et al. (2003) Ridge, N. A., Wilson, T. L., Megeath, S. T., Allen, L. E., & Myers, P. C. 2003, AJ, 126, 286
- Ridge & Moore (2001) Ridge, N. A., & Moore, T. J. T. 2001, A&A, 378, 495
- Richer et al. (2000) Richer, J. S., Shepherd, D. S., Cabrit, S., Bachiller, R., & Churchwell, E. 2000, Protostars and Planets IV, 867
- Reid et al. (2009) Reid, M. J., Menten, K. M., Zheng, X. W., Brunthaler, A., & Xu, Y. 2009, ApJ, 705, 1548
- Sánchez-Monge et al. (2013) Sánchez-Monge, Á., Cesaroni, R., Beltrán, M. T., et al. 2013, A&A, 552, L10
- Sánchez-Monge et al. (2014) Sánchez-Monge, Á., Beltrán, M. T., Cesaroni, R., et al. 2014, A&A, 569, AA11
- Sanhueza et al. (2013) Sanhueza, P., Jackson, J. M., Foster, J. B., et al. 2013, ApJ, 773, 123
- Sanhueza et al. (2012) Sanhueza, P., Jackson, J. M., Foster, J. B., et al. 2012, ApJ, 756, 60
- Shepherd et al. (1998) Shepherd, D. S., Watson, A. M., Sargent, A. I., & Churchwell, E. 1998, ApJ, 507, 861
- Snyder & Buhl (1974) Snyder, L. E., & Buhl, D. 1974, ApJ, 189, L31
- Tan et al. (2014) Tan, J. C., Beltrán, M. T., Caselli, P., et al. 2014, Protostars and Planets VI, 149
- Tercero et al. (2011) Tercero, B., Vincent, L., Cernicharo, J., Viti, S., & Marcelino, N. 2011, A&A, 528, A26
- Thaddeus et al. (1974) Thaddeus, P., Mather, J., Davis, J. H., & Blair, G. N. 1974, ApJ, 192, L33
- Ukita et al. (1987) Ukita, N., Hasegawa, T., Kaifu, N., et al. 1987, Star Forming Regions, 115, 178
- van der Tak et al. (2003) van der Tak, F. F. S., Boonman, A. M. S., Braakman, R., & van Dishoeck, E. F. 2003, A&A, 412, 133
- Vogel et al. (1987) Vogel, S.-N., Genzel, R., Palmer, P. 1987, ApJ, 316, 243
- Wu et al. (2004) Wu, Y., Wei, Y., Zhao, M., et al. 2004, A&A, 426, 503
- Wu et al. (2005) Wu, Y., Zhang, Q., Chen, H., et al. 2005, AJ, 129, 330
- Zapata et al. (2015) Zapata, L. A., Palau, A., Galván-Madrid, R., et al. 2015, MNRAS, 447, 1826
- Zapata et al. (2009a) Zapata, L. A., Ho, P. T. P., Schilke, P., et al. 2009, ApJ, 698, 1422
- Zapata et al. (2009b) Zapata, L. A., Menten, K., Reid, M., & Beuther, H. 2009, ApJ, 691, 332
- Zapata et al. (2010) Zapata, L. A., Tang, Y.-W., Leurini, S. 2010, ApJ, 725, 1091
- Zhang et al. (2001) Zhang, Q., Hunter, T. R., Brand, J., et al. 2001, ApJ, 552, L167
- Zinnecker & Yorke (2007) Zinnecker, H., & Yorke, H. W. 2007, ARA&A, 45, 481
| Molecule | Transition | Synthesized Beam | Velocity resolution | rms noise level | |
|---|---|---|---|---|---|
| [GHz] | [km s-1] | [mJy beam-1] | |||
| SO2 | 124,8–133,11 | 107.843 | 1914 | 1.6 | 6 |
| SO2 | 294,26–285,23 | 99.393 | 1914 | 1.6 | 6 |
| SO2 | 325,27–316,26 | 84.321 | 2216 | 1.6 | 7 |
| SiO | =0, =2–1 | 86.847 | 2518 | 1.6 (spectrum) and 4.8 (channel maps) | 7 (channel maps) |
| SiO | =1, =2–1 | 86.243 | 2518 | 1.6 | 3 |
| SiO | =2, =2–1 | 85.640 | 2518 | 1.6 | 3 |
| SiO | =3, =2–1 | 85.038 | 2518 | 1.6 | 3 |
Note. — The rms noise level is derived in the emission-free area defined by inspecting the channel maps.
| =50 K | =100 K | =150 K | |
|---|---|---|---|
| [cm-2/km s-1]b | 8.41014 | 7.81014 | 9.91014 |
| [cm-2/km s-1]b | 2.21013 | 4.21013 | 6.21013 |
| [cm-2/km s-1]c | 1.71015 | 3.51015 | 5.21015 |
| [cm-2/km s-1]d | 1.71022 | 3.51022 | 5.21022 |
| (SO2) | 4.910-8 | 2.310-8 | 1.910-8 |
| (SiO) | 1.310-9 | 1.210-9 | 1.210-9 |
Note. — aMeasured at km s-1 by averaging over a 66 box centered at (, )=[17472022, 28∘22197]. bPresent work. cHasegawa et al., in preparation. dFrom and (C18O) = (Lis & Goldsmith, 1989).
| Parameter | |
|---|---|
| Distance from K2 to SiO peak positionaa is measured as the SiO peak from K2 position from Figure 5.: [pc] | |
| Blue lobe | 0.08 |
| Red lobe | 0.06 |
| Distance from K2 to SiO outer contourbb is measured as the farthest 5 contour from K2 position from Figure 5.: [pc] | |
| Blue lobe | 0.3 |
| Red lobe | 0.2 |
| Outflow mass () | |
| Blue lobeccMass, momentum, and kinetic energy of blueshifted components are derived from integration in the velocity range of 7 km s-1 (= 32.2 km s-1 to 46.6 km s-1 for SiO and =48.2 km s-1 to 54.6 km s-1 for SO2). | 5.7102 |
| Red lobeddMass, momentum, and kinetic energy of redshifted components are derived from integration in the velocity range of 7 km s-1 (= 72.2 km s-1 to 85 km s-1 for SO2 and = 89.8 km s-1 to 109 km s-1 for SiO). | 1.4103 |
| Total | 2.0103 |
| Momentum ( km s-1) | |
| Blue lobe | 7.4103 |
| Red lobe | 2.2104 |
| Total | 3.0104 |
| Kinetic energy (erg) | |
| Blue lobe | 1.11048 |
| Red lobe | 4.41048 |
| Total | 5.51048 |
| Typical outflow velocityee is derived from the ratio between momentum and mass. : ( km s-1) | |
| Blue lobe | 13 |
| Red lobe | 16 |
| Total | 15 |
| Dynamical timeff is calculated from the ratio between and for the blueshifted and redshifted components. : (yr) | |
| Blue lobe | 5.6103 |
| Red lobe | 3.7103 |
| Average | 4.7103 |
Note. — This table shows the physical parameters of the bipolar outflow traced by SiO and SO2; size, mass, momentum, kinetic energy, outflow velocity, and dynamical time.