The Azimuthal dependence of outflows and accretion detected using Ovi absorption
Abstract
We report a bimodality in the azimuthal angle () distribution of gas around galaxies traced by Ovi absorption. We present the mean probability distribution function of 29 HST-imaged Ovi absorbing (EW¿0.1 Å) and 24 non-absorbing (EW¡0.1 Å) isolated galaxies (0.080.67) within kpc of background quasars. We show that EW is anti-correlated with impact parameter and Ovi covering fraction decreases from 80% within 50 kpc to 33% at 200 kpc. The presence of Ovi absorption is azimuthally dependent and occurs between 10–20∘ of the galaxy projected major axis and within 30∘ of the projected minor axis. We find higher EWs along the projected minor axis with weaker EWs along the project major axis. Highly inclined galaxies have the lowest covering fractions due to minimized outflow/inflow cross-section geometry. Absorbing galaxies also have bluer colors while non-absorbers have redder colors, suggesting that star-formation is a key driver in the Ovi detection rate. Ovi surrounding blue galaxies exists primarily along the projected minor axis with wide opening angles while Ovi surrounding red galaxies exists primarily along the projected major axis with smaller opening angles, which may explain why absorption around red galaxies is less frequently detected. Our results are consistent with CGM originating from major axis-fed inflows/recycled gas and from minor axis-driven outflows. Non-detected Ovi occurs between =20–60∘, suggesting that Ovi is not mixed throughout the CGM and remains confined within the outflows and the disk-plane. We find low Ovi covering fractions within ∘ of the projected major axis, suggesting that cool dense gas resides in a narrow planer geometry surrounded by diffuse Ovi gas.
Subject headings:
galaxies: halos — quasars: absorption lines1. Introduction
The circumgalactic medium (CGM) supplies the gas reservoirs required for galaxy star formation and is replenished via accretion/recycling and outflowing gas. With the likelihood that the CGM can make up about 50% of the baryonic mass bound to galaxies (Tumlinson et al., 2011) and could consist of about 50% of the baryons unaccounted for around galaxies (Werk et al., 2014), the CGM’s importance in dictating galaxy evolution cannot be overstated. Determining how the CGM interacts with galaxies is critical to understanding how galaxies evolve.
Gas accretion from the intergalactic medium, along with previously ejected recycled gas, and large-scale galactic outflows are principal components of theoretical galaxy formation and evolution models (Springel & Hernquist, 2003; Kereš et al., 2005; Dekel et al., 2009; Oppenheimer et al., 2010; Davé et al., 2011a, b; Stewart et al., 2011; Davé et al., 2012; Ford et al., 2014). Many studies have shown evidence for the existence of both multi-phase cold accretion/recycling (e.g., Steidel et al., 2002; Zonak et al., 2004; Chen et al., 2005; Tripp et al., 2005; Cooksey et al., 2008; Chen et al., 2010a; Chen et al., 2010b; Kacprzak et al., 2010, 2011b; Ribaudo et al., 2011; Thom et al., 2011; Kacprzak et al., 2012; Martin et al., 2012; Noterdaeme et al., 2012; Rubin et al., 2012; Bouché et al., 2013; Crighton et al., 2013; Krogager et al., 2013; Péroux et al., 2013) and large-scale galactic outflows (e.g., Bouché et al., 2006; Tremonti et al., 2007; Zibetti et al., 2007; Martin & Bouché, 2009; Weiner et al., 2009; Chelouche & Bowen, 2010; Nestor et al., 2011; Noterdaeme et al., 2010; Bordoloi et al., 2011; Coil et al., 2011; Rubin et al., 2010; Ménard & Fukugita, 2012; Martin et al., 2012; Noterdaeme et al., 2012; Krogager et al., 2013; Péroux et al., 2013; Kacprzak et al., 2014; Lan et al., 2014; Rubin et al., 2014; Crighton et al., 2015; Muzahid et al., 2015).
Both models and observations indicated that gas accretion should occur along filaments co-planar to the galaxy disk, whereas outflows are expected to extend along the galaxy projected minor axis. Evidence for the geometric preference of inflowing and outflowing gas has already been observed for cool gas traced by Mgii absorption (Kacprzak et al., 2011b; Bouché et al., 2012; Bordoloi et al., 2011; Kacprzak et al., 2012; Lan et al., 2014; Bordoloi et al., 2014). It was originally reported that the Mgii equivalent width is dependent on galaxy inclination (Kacprzak et al., 2011b) with the absorption kinematics consistent with being coupled to the galaxy angular momentum suggesting co-planar geometry (Steidel et al., 2002; Kacprzak et al., 2010; Diamond-Stanic et al., 2015). Kacprzak et al. (2012) reported a bimodality in the azimuthal angle distribution of gas around galaxies, where cool (104 K) dense CGM gas prefers to exist along the projected galaxy major and minor axes (also see Bouché et al., 2012; Bordoloi et al., 2011; Lan et al., 2014) with the gas covering fraction being enhanced by as much as 20%–30% along these axes. They found that blue star-forming galaxies drive the bimodality while red passive galaxies contain gas along their projected major axis. Outflows likely contain more metal enriched gas and higher velocity width absorption profiles since higher equivalent width absorption tends to reside along the projected minor axes of galaxies (Bordoloi et al., 2011; Kacprzak et al., 2012; Lan et al., 2014). Nielsen et al. (2015) has shown that Mgii absorption profiles with the largest velocity dispersion are associated with blue, face-on galaxies probed along the projected minor axis while the cloud column densities are largest for edge-on galaxies and blue galaxies. Bouché et al. (2012) have also shown that absorption detected along the projected minor axes is kinematically consistent with bi-conical outflows. These combined results are consistent with galaxy evolution scenarios where star-forming galaxies accrete new cool/warm co-planer gas within an half-opening angle of about 20∘, forming new stars and producing metal-enriched galactic scale outflows with half opening angles of 50∘, while red galaxies exist passively due to reduced gas reservoirs (Kacprzak et al., 2012). The conclusions are drawn from observations conducted using Mgii absorption, however both outflowing and infalling gas are expected to be mulit-phased and should be explored using other gas-phase tracers such as Civ, Ovi, etc.
Another standard tracer of the diffuse CGM gas is the Ovi doublet. We know that there is a significant fraction of Ovi contained in the CGM (Stocke et al., 2006; Tumlinson et al., 2011; Stocke et al., 2013; Peeples et al., 2014; Werk et al., 2014) that is typically gravitationally bound within the host galaxy’s gravitational potential (Tumlinson et al., 2011; Stocke et al., 2013; Mathes et al., 2014). Compared to Mgii, the Ovi doublet can be more difficult to interpret since it can be commonly detected as photo-ionized or collisionally ionized gas. This implies that Ovi can trace warm/hot coronal regions surrounding galaxies, which may dictate the formation and destruction of the cool/warm CGM (Mo & Miralda-Escude, 1996; Maller & Bullock, 2004; Dekel & Birnboim, 2006) or trace other multi-phase gas structures. Although Ovi absorption has been extensively studied in and around galaxies (Savage et al., 2003; Sembach et al., 2004; Stocke et al., 2006; Danforth & Shull, 2008; Tripp et al., 2008; Wakker & Savage, 2009; Prochaska et al., 2011; Tumlinson et al., 2011; Johnson et al., 2013; Stocke et al., 2013; Mathes et al., 2014; Johnson et al., 2015), the geometrical distribution of Ovi absorption around galaxies, which can yield improved understanding of the origins of such gas, has not been thoroughly observationally studied.
Mathes et al. (2014) attempted to address the azimuthal dependence of Ovi using 14 galaxies and found a mostly spatially uniform distribution of absorbing gas out to 300 kpc. There was small hint of a bimodality but was based on only five galaxies that were probed within one viral radius.
We aim to further explore the multi-phase inflow and outflow azimuthal distribution using Ovi absorption for a large sample of spectroscopically confirmed galaxies. In Section 2 we present our sample and data reduction. In Section 3 we present the equivalent width (EW) and covering fraction dependence on impact paramater, D, and we compute the mean azimuthal angle probability distribution function for absorbing (EW¿0.1 Å) and non-absorbing (EW¡0.1 Å) galaxies along with the azimuthal angle covering fraction. We further compare the colors for absorbing and non-absorbing galaxies and show the azimuthal angle probability distribution function depends on galaxy color. In Section 4, we discuss what can be inferred from the results and concluding remarks are offered in Section 5. Throughout we adopt an H km s-1Mpc-1, , cosmology.
2. GALAXY SAMPLE AND DATA ANALYSIS
We have constructed a sample of 53 candidate Ovi absorbing galaxies with spectroscopically confirmed redshifts ranging between 0.080.67 () within kpc (21203 kpc) of bright background quasars. These galaxies are selected to be isolated such that there are no neighbors within 100 kpc and have velocity separations less than 500 km s-1. All these galaxy–absorber pairs were identified as part of our “Multiphase Galaxy Halos” Survey (from PID 13398 plus from the literature). The quasars and quasar fields are selected to have HST imaging and medium resolution HST ultraviolet spectra. We discuss the data and analysis below.
2.1. Quasar Spectroscopy
We have compiled 32 quasars from our survey that have medium resolution (20,000) spectra that cover the Ovi doublet for the targeted galaxies. Details of the HST/COS and STIS observations are contained in Table 1.
The data were reduced using the CALCOS pipeline software. The pipeline reduced data (‘x1d’ files) were flux calibrated. In order to increase the spectral signal-to-noise ratio (), individual grating integrations were aligned and co-added using the IDL code ‘coadd_x1d’ developed by Danforth et al. (2010)111http://casa.colorado.edu/danforth/science/cos/costools.html. Since the archival spectra come from different observing programs, our sample shows a range in from 5–25 per resolution element. As the COS FUV spectra are significantly over-sampled, i.e., six raw pixels per resolution element, we binned the data by three pixels. Binning of data improves per pixel by a factor of . All the measurements and analysis were performed on the binned spectra. Continuum normalizations were done by fitting the line-free regions with smooth low-order polynomials.
The line spread function (LSF) of the COS spectrograph is not a Gaussian. For our Voigt profile analysis, we adopt the non-Gaussian LSF given by Kriss (2011). The LSF was obtained by interpolating the LSF tables at the observed central wavelength for each absorption line and was convolved with the model Voigt profile while fitting absorption lines using VPFIT222http://www.ast.cam.ac.uk/ rfc/vpfit.html software. Whenever possible, for each identified system, both the members of Ovi doublet were fitted simultaneously in order to get best fitting component column densities. In cases for which one of the doublets is affected by a blend, we used the unblended transition to constrain the fit parameters. We then generate synthetic profile(s) for the blended component(s) for a consistency check. In all cases, we have used the minimum number of components required to get a satisfactory fit with reduced . The model profiles of 1031 were used to compute the Ovi equivalent width (EW). Errors and 3 limits on the EWs were computed using the error spectrum. The EWs and column densities are listed in Table 2.
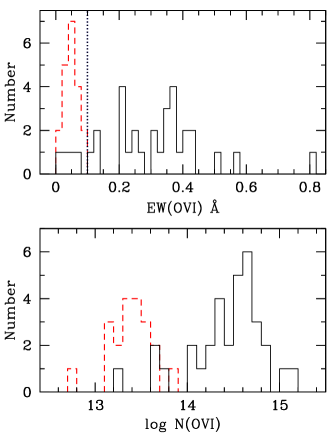
In Figure 1, we show the distribution of Ovi1031 rest-frame equivalent widths and 3 equivalent width upper-limits along with the column density distribution. There is a clear transition between absorbing and non-absorbing galaxies at 0.1 Å with only four absorbers detected below this threshold. In order to treat our data/sample with uniform sensitivity limits, we consider only stronger systems with EW¿0.1 Å as absorbers and all galaxies below this threshold as non-absorbers. The 0.1 Å bifurcation translates to a column density cut of log (Ovi)14. Our final sample consists of 29 absorbing and 24 non-absorbing galaxies.
| QSO | RAQSO | DECQSO | UV | UV | PID | Imaging | Filter | Exposure | PID | |
|---|---|---|---|---|---|---|---|---|---|---|
| (J2000) | (J2000) | Camera | Grating | Camera | (sec) | |||||
| J012528.84000555.9 | 1.075 | 01:25:28.84 | 00:05:55.93 | COS | G160M | 13398 | WFPC2 | F702W | 700 | 6619 |
| J022815.17405714.3 | 0.493 | 02:28:15.17 | 40:57:14.29 | COS | G130M, G160M | 11541 | ACS | F814W | 1200 | 13024 |
| J035128.54142908.7 | 0.616 | 03:51:28.54 | 14:29:08.71 | COS | G130M, G160M | 13398 | WFPC2 | F702W | 800 | 5949 |
| J040748.44121136.8 | 0.573 | 04:07:48.43 | 12:11:36.66 | COS | G130M, G160M | 11541 | WFPC2 | F702W | 800 | 5949 |
| J045608.92215909.4 | 0.534 | 04:56:08.92 | 21:59:09.40 | COS | G160M | 12466,12252 | WFPC2 | F702W | 600 | 5098 |
| J072153.44712036.3 | 0.300 | 07:21:53.45 | 71:20:36.36 | COS | G130M, G160M | 12025 | ACS | F814W | 1200 | 13024 |
| J085334.25434902.3 | 0.515 | 08:53:34.25 | 43:49:02.33 | COS | G130M, G160M | 13398 | WFPC2 | F702W | 800 | 5949 |
| J091440.39282330.6 | 0.735 | 09:14:40.39 | 28:23:30.62 | COS | G130M, G160M | 11598 | ACS | F814W | 1200 | 13024 |
| J094331.61053131.4 | 0.564 | 09:43:31.62 | 05:31:31.49 | COS | G130M, G160M | 11598 | ACS | F814W | 1200 | 13024 |
| J095000.73483129.3 | 0.590 | 09:50:00.74 | 48:31:29.38 | COS | G130M, G160M | 11598 | ACS | F814W | 1200 | 13024 |
| J100402.61285535.4 | 0.327 | 10:04:02.61 | 28:55:35.39 | COS | G130M, G160M | 12038 | WFPC2 | F702W | 800 | 5949 |
| J100902.07071343.9 | 0.457 | 10:09:02.07 | 07:13:43.87 | COS | G130M, G160M | 11598 | WFC3 | F625W | 2256 | 11598 |
| J104116.16061016.9 | 1.270 | 10:41:17.16 | 06:10:16.92 | COS | G160M | 12252 | WFPC2 | F702W | 1300 | 5984 |
| J111908.67211918.0 | 0.177 | 11:19:08.68 | 21:19:18.01 | COS | G130M, G160M | 12038 | WFPC2 | F606W | 2200 | 5849 |
| J113327.78032719.1 | 0.525 | 11:33:27.79 | 03:27:19.17 | COS | G130M, G160M | 11598 | ACS | F814W | 1200 | 13024 |
| J113910.79135043.6 | 0.557 | 11:39:10.70 | 13:50:43.64 | COS | G130M | 12275 | ACS | F814W | 520 | 9682 |
| J121920.93063838.5 | 0.331 | 12:19:20.93 | 06:38:38.52 | COS | G130M, G160M | 12025 | WFPC2 | F702W | 600 | 5143 |
| J123304.05003134.1 | 0.471 | 12:33:04.05 | 00:31:34.20 | COS | G130M, G160M | 11598 | ACS | F814W | 1200 | 13024 |
| J124154.02572107.3 | 0.584 | 12:41:54.02 | 57:21:07.38 | COS | G130M, G160M | 11598 | ACS | F814W | 1200 | 13024 |
| J124410.82172104.5 | 1.273 | 12:44:10.82 | 17:21:04.52 | COS | G160M | 12466 | WFPC2 | F702W | 1300 | 6557 |
| J130112.93590206.7 | 0.478 | 13:01:12.93 | 59:02:06.75 | COS | G130M, G160M | 11541 | WFPC2 | F702W | 700 | 6619 |
| J131956.23272808.2 | 1.015 | 13:19:56.23 | 27:28:08.22 | COS | G160M | 11667 | WFPC2 | F702W | 1300 | 5984 |
| J132222.46464546.1 | 0.375 | 13:22:22.68 | 46:45:35.22 | COS | G130M, G160M | 11598 | ACS | F814W | 1200 | 13024 |
| J134251.60005345.3 | 0.327 | 13:42:51.61 | 00:53:45.31 | COS | G130M, G160M | 11598 | ACS | F814W | 1200 | 13024 |
| J135704.43191907.3 | 0.720 | 13:57:04.43 | 19:19:07.37 | COS | G160M | 13398 | WFPC2 | F702W | 800 | 5949 |
| J154743.53205216.6 | 0.264 | 15:47:43.53 | 20:52:16.61 | COS | G130M, G160M | 13398 | WFPC2 | F702W | 1100 | 5099 |
| J155504.39362847.9 | 0.714 | 15:55:04.40 | 36:28:48.04 | COS | G130M, G160M | 11598 | ACS | F814W | 1200 | 13024 |
| J170100.60641209.3 | 2.741 | 17:01:00.62 | 64:12:09.12 | COS | G130M | 13491 | ACS | F814W | 12520 | 10581 |
| J170441.37604430.5 | 0.372 | 17:04:41.38 | 60:44:30.50 | STIS | E140M | 8015 | WFPC2 | F702W | 600 | 5949 |
| J213135.26120704.8 | 0.501 | 21:31:35.26 | 12:07:04.79 | COS | G160M | 13398 | WFPC2 | F702W | 600 | 5143 |
| J213811.60141838.0 | 1.900 | 21:38:11.60 | 14:18:38.0 | COS | G130M, G160M | 13398 | WFPC2 | F702W | 1400 | 5343 |
| J225357.74160853.6 | 0.859 | 22:53:57.74 | 16:08:53.56 | COS | G130M, G160M | 13398 | WFPC2 | F702W | 700 | 6619 |
2.2. HST Imaging of Quasar Fields
We further required that all 32 quasar fields were imaged with high-resolution spaced-based cameras such that we were able to adequately model the morphological parameters and orientations of all 53 galaxies. Details of the HST imaging observations using ACS, WFC3, and WFPC2 for a range of filters are listed in Table 1.
The WFPC–2/HST images were reduced using the WFPC–2 Associations Science Products Pipeline (WASPP) (see Kacprzak et al., 2011b). The ACS and WFC3 data reduction was carried out using the DrizzlePac software (Gonzaga et al., 2012). If enough frames were present, cosmic rays were removed during the multidrizzle process otherwise we used lacosmic (van Dokkum, 2001).
Galaxy photometry was performed using the Source Extractor package (SExtractor; Bertin & Arnouts, 1996) with a detection criterion of 1.5 above background. The magnitudes in each filter were measured using the WFPC–2 Vega zeropoints (Whitmore, 1995), which were then converted to AB magnitudes (see Nielsen et al., 2013a), while the ACS, and WFC3 zero points are based upon the AB system. The , and its corresponding filter, for each galaxy is listed in Table 2.
2.3. GIM2D Galaxy Models
Galaxy morphological parameters and orientations were quantified by fitting a two-component (bulge+disk) model using GIM2D (Galaxy IMage 2D; Simard et al., 2002). We fit the surface brightness of the disk component with an exponential profile and we fit the bulge component with a Sérsic profile (Sérsic, 1968) where the Sérsic index may vary between . This technique has been successfully applied in previous works (Kacprzak et al., 2007, 2011b; Kacprzak et al., 2012). The GIM2D outputs were manually inspected to see if models were realistic representations of the observed galaxies.
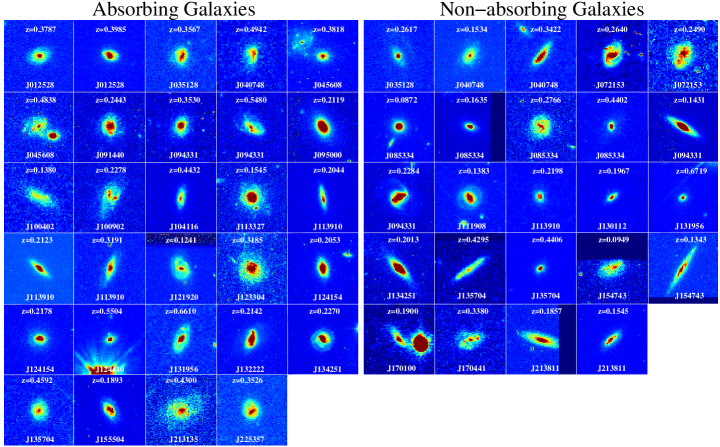
To model the galaxies, GIM2D extracts “portrait size” images from parent HST images with an area 10 times larger than the galaxy isophotal area such that an accurate background can be computed. Figure 2 shows the portraits of the absorbing and non-absorbing galaxies. All galaxies appear to have similar sizes since they are shown for an area 10 times larger than the galaxy isophotal area. The orientations of the images are that of the parent HST and are arbitrary. Note there is a wide range of galaxy morphological types with the dominant population being disk galaxies.
During the GIM2D process, the models are convolved with the point spread function (PSF). For WFPC-2, we modeled the PSF at the appropriate locations on the WFPC-2 chip using Tiny Tim (Krist & Hook, 2004) as performed by Kacprzak et al. (2011b). The PSFs for WFC3 and ACS depend both on time and position on the chip and, in addition, the images also contain significant geometrical distortions. So for WFC3 and ACS, we used Tiny Tim to create the PSFs and place them into blank frames every 500 pixels, with the same size and header parameters as those of the real flat-fielded individual exposures which were then reduced following the same procedure as for the data. The PSF that was closest to the galaxy of interest was used for the GIM2D modeling.
The galaxy properties are listed in Table 2. We adopt the convention of the azimuthal angle to be along the galaxy major axis and to be along the galaxy minor axis. We have included in our analysis the full range of galaxy inclinations present in our sample. The sample contains only three galaxies with degrees. We find that the inclusion or exclusion of these three galaxies does not change our main results. We also note that, in the case of Mgii absorption, the geometric distribution of the low-ionization CGM is only weakly dependent upon galaxy inclination (Bordoloi et al., 2014; Kacprzak et al., 2011b), but is strongly dependent upon azimuthal angle (Bouché et al., 2012; Bordoloi et al., 2011; Kacprzak et al., 2012; Lan et al., 2014). The combined distribution of absorbers and non-absorbers is shown to be consistent with a uniform random distribution using a KS test with P(KS)=0.635
The impact parameters, , are computed using the galaxy and quasar isophotal centroids determined by SExtractor. The uncertainty in is computed from the pixel offset of the galaxy SExtractor isophotal center and the center of the GIM2D galaxy model, which is typically pixels. An additional 0.05 pixel uncertainty is included for centroiding error of the quasar, which is based upon centroiding errors of unresolved sources in the our images.
3. Results
| QS0 | RAgal | DECgal | HST | ()† | EW | log (Ovi) | ||||||
|---|---|---|---|---|---|---|---|---|---|---|---|---|
| field | (J2000) | (J2000) | ref a afootnotemark: | Filter | (AB) | ()♠ | (kpc) | (degree) | (degree) | (Å) | ||
| Non-Absorbing Galaxies with EW(Ovi)¡0.1 Å | ||||||||||||
| J035128 | 03:51:28.933 | 14:29:54.31 | 0.2617 | 1 | F702W | 21.0 | 2.3† | |||||
| J040748 | 04:07:48.481 | 12:12:11.13 | 0.3422 | 2 | F702W | 21.5 | ||||||
| J040748 | 04:07:43.930 | 12:12:08.49 | 0.1534 | 2 | F702W | 18.5 | ||||||
| J072153 | 07:21:51.403 | 71:20:10.80 | 0.2640 | 3 | F814W | 19.0 | ||||||
| J072153 | 07:21:54.962 | 71:20:11.20 | 0.2490 | 3 | F814W | 22.1 | ||||||
| J085334 | 08:53:35.160 | 43:48:59.81 | 0.4402 | 1 | F702W | 20.6 | 1.8† | |||||
| J085334 | 08:53:33.384 | 43:49:03.97 | 0.1635 | 1 | F702W | 18.8 | 1.8† | |||||
| J085334 | 08:53:36.881 | 43:49:33.32 | 0.2766 | 1 | F702W | 20.9 | ||||||
| J085334 | 08:53:34.481 | 43:49:37.51 | 0.0872 | 1 | F702W | 17.5 | 2.1† | |||||
| J094331 | 09:43:29.210 | 05:30:41.75 | 0.1431 | 4 | F814W | 17.5 | 2.82♠ | |||||
| J094331 | 09:43:33.789 | 05:31:22.26 | 0.2284 | 4 | F814W | 18.6 | 2.24♠ | |||||
| J111908 | 11:19:06.675 | 21:18:29.56 | 0.1383 | 5 | F606W | 17.7 | ||||||
| J113910 | 11:39:08.330 | 13:50:45.64 | 0.2198 | 1 | F702W | 22.4 | 2.1† | |||||
| J130112 | 13:01:20.123 | 59:01:35.72 | 0.1967 | 1 | F702W | 20.9 | 1.6† | |||||
| J131956 | 13:19:55.729 | 27:28:12.88 | 0.6719 | 6 | F702W | 21.3 | 1.5† | |||||
| J134251 | 13:42:52.235 | 00:53:43.10 | 0.2013 | 4 | F814W | 19.7 | 2.45♠ | |||||
| J135704 | 13:57:03.290 | 19:18:44.41 | 0.4295 | 1 | F702W | 21.9 | ||||||
| J135704 | 13:57:02.914 | 19:18:55.51 | 0.4406 | 1 | F702W | 21.3 | 1.8† | |||||
| J154743 | 15:47:45.561 | 20:51:41.37 | 0.0949 | 1 | F702W | 21.4 | 1.21♠ | |||||
| J154743 | 15:47:41.642 | 20:52:39.39 | 0.1343 | 1 | F702W | 19.7 | 3.04♠ | |||||
| J170100 | 17:01:03.261 | 64:11:59.89 | 0.1900 | 7 | F814W | 22.4 | ||||||
| J170441 | 17:04:37.106 | 60:44:20.35 | 0.3380 | 1 | F702W | 21.6 | 2.0† | |||||
| J213811 | 21:37:48.702 | 14:33:16.51 | 0.1857 | 1 | F702W | 19.5 | ||||||
| J213811 | 21:37:45.083 | 14:32:06.27 | 0.0752 | 1 | F702W | 18.5 | ||||||
| Absorbing Galaxies with EW(Ovi)¿0.1 Å | ||||||||||||
| J012528 | 01:25:28.257 | 00:06:08.20 | 0.3787 | 8 | F702W | 20.7 | 1.3† | |||||
| J012528 | 01:25:27.671 | 00:05:31.39 | 0.3985 | 8 | F702W | 19.7 | 1.8† | |||||
| J035128 | 03:51:27.892 | 14:28:57.88 | 0.3567 | 1 | F702W | 20.7 | 0.28† | |||||
| J040748 | 04:07:49.020 | 12:11:20.76 | 0.4942 | 2 | F702W | 22.6 | ||||||
| J045608 | 04:56:08.913 | 21:59:29.00 | 0.4838 | 9 | F702W | 20.4 | 1.78† | |||||
| J045608 | 04:56:08.820 | 21:59:27.40 | 0.3818 | 1 | F702W | 20.7 | 1.66† | |||||
| J091440 | 09:14:41.759 | 28:23:51.18 | 0.2443 | 4 | F814W | 19.6 | 1.24♠ | |||||
| J094331 | 09:43:30.671 | 05:31:18.08 | 0.3530 | 4 | F814W | 21.2 | 1.17♠ | |||||
| J094331 | 09:43:32.376 | 05:31:52.15 | 0.5480 | 4 | F814W | 21.0 | 0.96♠ | |||||
| J095000 | 09:50:00.863 | 48:31:02.59 | 0.2119 | 4 | F814W | 18.0 | 2.74♠ | |||||
| J100402 | 10:04:02.353 | 28:55:12.50 | 0.1380 | 1 | F702W | 21.9 | ||||||
| J100902 | 10:09:01.579 | 07:13:28.00 | 0.2278 | 4 | F625W | 20.1 | 1.39† | |||||
| J104116 | 10:41:17.801 | 06:10:18.97 | 0.4432 | 10 | F702W | 20.9 | 2.81† | |||||
| J113327 | 11:33:28.218 | 03:26:59.00 | 0.1545 | 4 | F814W | 19.2 | 1.29♠ | |||||
| J113910 | 11:39:11.520 | 13:51:08.69 | 0.2044 | 1 | F702W | 20.0 | 2.30† | |||||
| J113910 | 11:39:09.801 | 13:50:53.08 | 0.3191 | 1 | F702W | 20.6 | 1.60† | |||||
| J113910 | 11:39:09.533 | 13:51:31.46 | 0.2123 | 1 | F702W | 20.0 | 2.10† | |||||
| J121920 | 12:19:23.469 | 06:38:19.84 | 0.1241 | 5 | F702W | 18.2 | 1.20† | |||||
| J123304 | 12:33:04.084 | 00:31:40.20 | 0.3185 | 4 | F814W | 20.2 | 1.38♠ | |||||
| J124154 | 12:41:53.731 | 57:21:00.94 | 0.2053 | 4 | F814W | 19.9 | 1.42♠ | |||||
| J124154 | 12:41:52.410 | 57:20:43.28 | 0.2178 | 4 | F814W | 20.1 | 1.53♠ | |||||
| J124410 | 12:44:11.045 | 17:21:05.05 | 0.5504 | 1 | F702W | 21.7 | 1.34† | |||||
| J131956 | 13:19:55.773 | 27:27:54.84 | 0.6610 | 11 | F702W | 21.6 | 1.45† | |||||
| J132222 | 13:22:22.470 | 46:45:45.98 | 0.2142 | 4 | F814W | 18.6 | 2.02♠ | |||||
| J134251 | 13:42:51.866 | 00:53:54.07 | 0.2270 | 4 | F814W | 18.2 | 1.59♠ | |||||
| J135704 | 13:57:04.539 | 19:19:15.15 | 0.4592 | 1 | F702W | 21.4 | 1.40† | |||||
| J155504 | 15:55:05.295 | 36:28:48.46 | 0.1893 | 4 | F814W | 18.5 | 1.43♠ | |||||
| J213135 | 21:31:35.635 | 12:06:58.56 | 0.4300 | 12 | F702W | 20.7 | 2.06† | |||||
| J225357 | 22:54:00.417 | 16:09:06.82 | 0.3526 | 1 | F702W | 20.6 | 1.30† | |||||
3.1. Equivalent Width as a Function of Impact Parameter
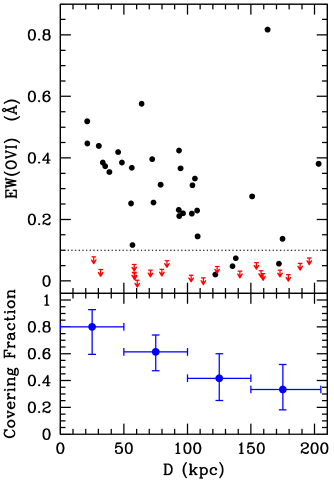
In Figure 3 we show the EW distribution as a function of for our sample. Note that the dashed horizontal line at 0.1 Å is our bifurcation between absorbing and non-absorbing galaxies, although we have shown four detections that reside below this threshold for completeness only. There is an anti-correlation with EW and , which is consistent with previous studies that typically show this anti-correlation between (Ovi) and (Wakker & Savage, 2009; Prochaska et al., 2011; Tumlinson et al., 2011; Mathes et al., 2014; Johnson et al., 2015). A Kendall- rank correlation test shows that the EW and are anti-correlated at the 2.7 level for absorbers with EW¿0.1 Å. If limits are included, then the rank correlation test shows no correlation (0.9). The lack of a statistically significant correlation for the full sample suggests that non-absorbers exist at all impact parameters and that gaseous halos have a non-unity covering fraction, even at low . Also shown in Figure 3 is the covering fraction as a function of . The covering fraction is defined as the ratio of the number of absorbers to the sum of absorbers and non-absorbers in each impact paramater bin. The covering fraction 1 errors are derived from binomial statistics (Gehrels, 1986). The covering fraction starts high at 80% within kpc and decreasing to 33% at 200 kpc, which is consistent with previous Ovi studies (e.g., Wakker & Savage, 2009; Johnson et al., 2013).
3.2. Equivalent Width as a Function of Galaxy Orientation
We follow the method of Kacprzak et al. (2012) to study the relationship between Ovi absorption and azimuthal angle (). They discuss that direct binning of the azimuthal angles, an approach taken by some authors, applies only when the measured uncertainties are smaller than the bin size and each galaxy can be quantized in single bin, which is not always the case. Additional complications occur when the uncertainties are asymmetric, as they are for GIM2D model output parameters. We model the measured azimuthal angles and their uncertainties as asymmetric univariate Gaussian probability distribution functions (see Kato, Omachi, & Aso, 2002), thus creating an azimuthal angle probability distribution function (PDF) for each galaxy. From the continuous azimuthal PDFs, we then compute the mean PDF combining all galaxies as function of . The mean PDF represents the probability of detecting Ovi absorption at a given . This technique provides higher weight per azimuthal angle bin for galaxies with well determined . However, even the less robustly modeled galaxies provide useful information; the method is similar to stacking low signal-to-noise spectra or images to search for a coherent signal.
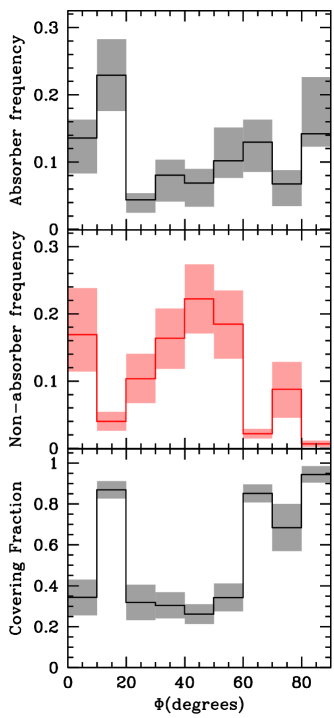
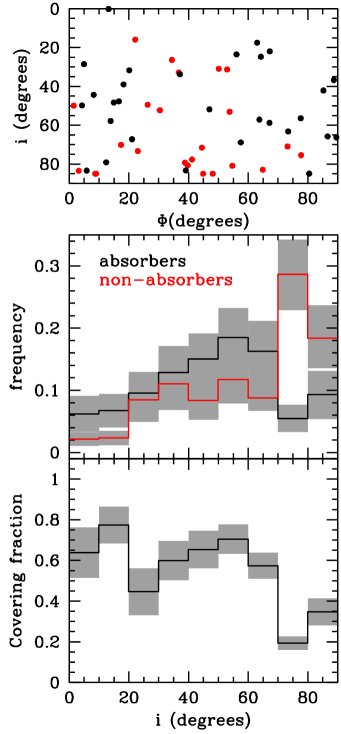
In Figure 4, we present the binned mean azimuthal angle PDF for the 29 absorbing (EW Å) and 24 non-absorbing (EW Å) galaxies. The binned PDFs are normalized such that the total area is equal to unity: this provides an observed frequency for each azimuthal bin. The shaded regions about each bin are the deviations computed from a bootstrap analysis produced by resampling the galaxies in the distribution with replacement 10,000 times.
The top panel of Figure 4 shows that the PDF for absorbing galaxies is highest along the projected major axis (∘) within 20∘, drops dramatically, and then slowly rises towards another maximum along projected minor axis (∘). The middle panel of Figure 4 shows that the non-absorbers almost have the opposite trend as the absorbers. The frequency of non-absorbers occur in a narrow window along the projected major axes within 10∘ and then drops dramatically. They have the highest representation at intermediate between 20–60∘ where absorbers actually are at a minimum and have little-to-no representation along the projected minor axis.
Following the methods of Nielsen et al. (2015), we used the chi-squared statistic on the binned distributions to test the null hypothesis that the distribution of azimuthal angles for non-absorbers and absorbers were drawn from the same population. The null-hypothesis was ruled out at the 3.7 significance level. To examine sensitivity to binning, we also tested bin sizes of , , and . The significance levels were all greater than 3.1.
The data show that the presence or absence of gas is highly driven by galaxy orientation; absorption is more common along the major and minor axes while the lack of absorption is common at intermediate . We discuss how these results are consistent with inflow and outflow models and how they compare to the Mgii azimuthal dependence seen by Kacprzak et al. (2012) in the next section (also see Bordoloi et al., 2011; Bouché et al., 2012; Bordoloi et al., 2014).
We assume that the width of the peaks of the PDF provides constraints to the geometry of outflowing and inflowing Ovi gas. The peak at suggests that accreting gas is found within of the projected galaxy major axis plane. One may also interpret that the deficit of absorption and the surplus of non-absorbers within 10∘ of the major axis as physical and could highlight that may be much colder gas may reside in this area (no such deficiency of absorbers and surplus of non-absorbers was observed for the cool/dense Mgii gas) while more diffuse gas surrounds the cool dense as indicated by the peak at 20∘. The slow rise of the absorber PDF and the sharp decline of the non-absorber PDF along the minor axis may suggest that Ovi outflowing gas could occur within a half-opening angle as small as 30∘ (from 60–90∘) or even larger to 50∘ since the covering fraction in outflows likely decreases with increasing .
In the bottom of Figure 4, we further show the Ovi gas covering fraction as a function of azimuthal bin. As defined in the literature, we define the covering fraction to be , where is the number of absorbers and is the number of non-absorbers. We compute the covering fractions and their 1 errors by bootstrapping the aforementioned ratio for each azimuthal bin 10,000 times. This first presentation of the Ovi covering fraction as a function of azimuthal angle shows, as previously mentioned, a deficit of absorption with a covering fraction of 35% within 10∘ of the projected major axis. The covering fraction then peaks at 85% at 20∘ before dropping back to 35%. The covering fraction of Ovi is again at a maximum above 80% within 30∘ of the projected minor axis. With our current sample, the covering fraction is highly dependent on and is the highest along the projected major and minor axes. The azimuthal angle averaged covering fraction of our sample is 52%.
We explore how the incidence of absorbers and non-absorbers depend on galaxy inclination and how the PDFs depend on inclination. In Figure 5, we show the distribution of absorbers (black) and non-absorbers (red) as a function of and . This Figure shows that regardless of galaxy inclination, the absorbers have a preference for existing along the projected major and minor axes. The same is true for the non-absorbers; they continue to have a preference to exist at intermediate . We do note that the distribution of non-absorbers has a larger range at high galaxy inclination angles. To further explore this, we show the PDFs for absorbers and non-absorbers in Figure 5. The galaxy inclination PDFs for absorbers and non-absorbers have very similar/consistent distributions except for the most edge-on systems where a non-absorbers are more frequent that absorbers. A chi-squared statistic on the binned distributions shows the null-hypothesis was ruled out at the 3.0 significance level. However, the chi-squared statistic on the PDFs below shows that the null-hypothesis was ruled out at the 1.0 significance level. Therefore, the largest statistical difference is observed at high galaxy inclination. This is further reflected in the covering fractions as a function of galaxy inclination shown in Figure 5. The only significant change in covering fraction as a function of is shown as a drastic decrease at high inclinations.
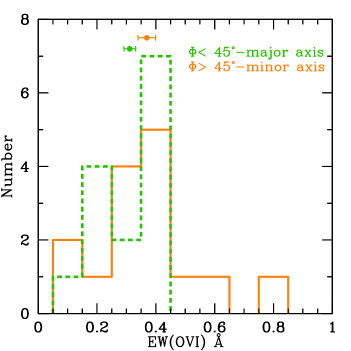
We further explore how the strength of the absorption is dependent on the projected location around the galaxy. In Figure 6, we show the distribution of EW separated into projected major and minor axis bins bifurcated at 45∘. The EW distributions for the projected major axis (for 14 galaxies) and minor axis (for 15 galaxies) differ slightly with stronger equivalent width systems found along the projected minor axis. The mean equivalent widths, with the standard error in the mean, along the major and minor axes are Å (standard deviation of 0.1 Å) and Å (standard deviation of 0.17 Å), respectively. Our results suggest that high equivalent width systems (recall equivalent width is a measure of both kinematic spread and column density) tend to originate along the projected minor axis from outflows. This is consistent with previous results found along the minor axis for Mgii absorption (Bordoloi et al., 2011; Kacprzak et al., 2012). The same is true for the column densities, with the logarithmic mean Ovi column densities along the major and minor axes being and , respectively.
We also explore how the strength of the absorption is dependent on galaxy inclination. The mean equivalent widths, with the standard error in the mean, for low inclination () and high inclination () galaxies are 0.350.01 (standard deviation of 0.1 Å) and 0.360.01 (standard deviation of 0.16 Å), respectively. Thus, unlike for high and low , we find no significant difference in the mean equivalent widths as a function of galaxy inclination.
3.3. Galaxy Colors
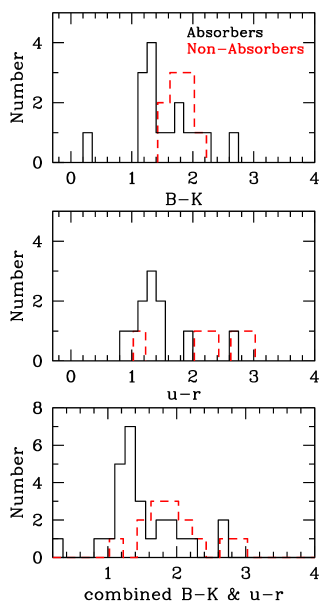
Here we assess whether absorbing and non-absorbing galaxies have different colors. Tumlinson et al. (2011) has shown that the majority of Ovi absorbers are produced by star-forming galaxies while non-absorbers are mostly associated with quiescent galaxies. We do not have star-formation rates for the majority of our sample, however we do have or colors for 27/29 absorbers and 14/24 non-absorbers. The colors were either obtained from Chen et al. (2001) or from MAGIICAT (Nielsen et al., 2013a) while the colors were obtained from Werk et al. (2012). In Figure 7 we show the and color distributions for absorbing and non-absorbing galaxies. Consistent with Tumlinson et al. (2011), we also find the absorbers tend to have bluer colors on average than non-absorbing galaxies. We combine the and colors in the bottom panel of Figure 7. We validate doing this since the bifurcation value between red and blue sequences inferred by color magnitude diagrams in and are both at (e.g., Gil de Paz et al., 2007; Werk et al., 2012), thus making for an equal comparison. The difference in colors between absorbers and non-absorbers is more accentuated in this combined figure. A KS test shows that absorbers and non-absorbers differ in their color distribution by 2.5 (CL=0.98793). This is consistent with the idea that star-forming galaxies make up a significant fraction of absorbers and a smaller fraction of non-absorbing galaxies, which are dominated by red galaxies. This may suggest that blue star-forming galaxies have an overall higher covering fraction since they may be both accreting and outflowing gas, while quiescent galaxies have much less CGM activity.
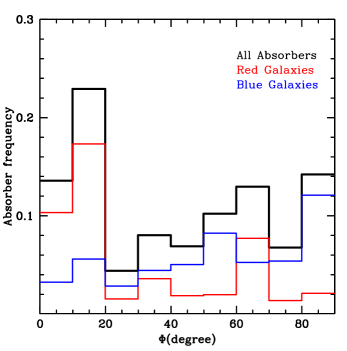
To test our previous statement, we further explore how the different colors of absorbing galaxies contribute to the distribution of . We divide 27 absorbers with measured colors into red and blue galaxies using a color cut at 1.5, which is where the population of absorbers and non-absorbers split as seen the bottom panel of Figure 7. This color-cut separates blue star-forming galaxies from redder dusty star-formers, green valley, and red sequence galaxies. In Figure 8, we show the relative contribution of absorbers for blue (15 galaxies) and red (12 galaxies) galaxies. Blue galaxies show a low contribution along the projected major axis with a gradual increase to peak in frequency along the minor axis. The red galaxies show the strongest contribution along the projected major axis with little-to-no contribution along the minor axis. These results suggest that in fact blue galaxies are dominated by outflowing gas with wide opening angles while redder galaxies appear to have Ovi along the projected major axis, which has a much smaller opening angle. This difference in orientation and opening angle between blue and red galaxies may explain why red galaxies are less frequently detected due to their low gas sky cross-section while blue galaxies have a much higher gas cross-section.
4. Discussion
The abundance of Ovi contained in the halos of galaxies is significant (Stocke et al., 2006; Tumlinson et al., 2011; Stocke et al., 2013; Peeples et al., 2014; Werk et al., 2014) and mostly bound to the galaxy’s gravitational potential (Tumlinson et al., 2011; Stocke et al., 2013; Mathes et al., 2014). We are just beginning to understand how this diffuse Ovi gas is associated with its host galaxies and what role it plays in galaxy evolution. We and others have shown that the covering fraction and equivalent width are dependent on the distance away from the galaxy (Wakker & Savage, 2009; Prochaska et al., 2011; Tumlinson et al., 2011; Mathes et al., 2014; Johnson et al., 2013, 2015). Tumlinson et al. (2011) has shown that the majority of absorbers are produced by star-forming galaxies while non-absorbers are mostly associated with quiescent galaxies. This suggests that either the quantity of Ovi absorbing gas and/or the geometric distribution of this gas is different between star-forming and quiescent galaxies.
For the first time, we have demonstrated that the distribution of Ovi absorption within 200 kpc of isolated galaxies exhibits an azimuthal angle bimodality. Mathes et al. (2014) presented the first hint of a possible bimodality with only five galaxies detected within one viral radius with the remaining sample probing larger impact parameters. Our significant increase in sample size to 29 absorbers and 24 non-absorbers was key to our findings. Here we have shown that the highest frequency of absorption is found within 10–20∘ of the projected major axis and within 30∘ of the projected minor axis. The non-absorbing galaxies occur at the highest frequencies at intermediate between 20-60∘. This is further reflected in the azimuthal covering fraction distribution, which is typically around 35% except along the projected major axis between 10-20∘ and near the projected minor axis between 60-90∘. These results are consistent with the idea that gas inflows along the major axis and outflows along the minor axis of galaxies. This bimodality is also consistent with bimodality found for Mgii absorption (Bouché et al., 2012; Kacprzak et al., 2012), suggesting the infalling and outflowing gas is multi-phased. We constrain the half opening angle of inflowing gas to be around 20∘, which is a factor of two larger than found for Mgii (Kacprzak et al., 2012), while the half opening angle of outflowing gas is at least 30∘, which is consistent with previous results determined using different tracers for gas (e.g., Walter et al., 2002; Kacprzak et al., 2012; Martin et al., 2012; Bordoloi et al., 2014).
Unlike Mgii, the covering fraction of Ovi within 10∘ of the projected major axis is very low while the covering fraction of Mgii is above 80% within 10∘. If this result remains with a larger sample size, then it may suggest a detection of cool gas accretion surrounded by an envelope of a diffuse gas phase traced by Ovi. This could have interesting implications for how gas is fed into galaxies.
Bordoloi et al. (2011) and Kacprzak et al. (2012) reported that projected minor axis absorption originated from outflows, traced by Mgii absorption, and has higher equivalent widths on average than absorption found along projected major axis. Here we find the same result: higher Ovi equivalent width systems occur along the projected minor axis. The mean equivalent widths, with the standard error in the mean, along the major and minor axes are Å and Å, respectively. These results suggest that either the column density, metallicity, and/or kinetic spread of outflowing gas is higher along the minor axis. Nielsen et al. (2015) has shown that Mgii absorption profiles with the largest velocity dispersion are associated with blue, face-on galaxies probed along the projected minor axis while the column densities are largest for edge-on galaxies and blue galaxies. These results are consistent with bi-conical outflows along the minor axis for star-forming galaxies causing an increase in kinematic spread and column density. There should also be an increase in metallicity as well due to enriched supernovae-driven winds but this has yet to be confirmed observationally. The equivalent width distribution along the projected major axis still contains moderately high equivalent width systems. This may suggest that we are not observing purely pristine accretion onto galaxies and it is likely associated with the recycling of previously ejected gas (e.g., Oppenheimer & Davé, 2009; Oppenheimer et al., 2010).
We have shown that the dependence on galaxy inclination is much weaker than the galaxy position angle and this is consistent with previous results shown for Mgii absorption (Bordoloi et al., 2011; Kacprzak et al., 2011b; Bordoloi et al., 2014). We do show that there appears to be a broader distribution of non-absorbers for edge-on galaxies with , which translates to a lower Ovi covering fraction for . These results are consistent with the picture that gas inflows along the major axis and outflows along the minor axis of galaxies. Both the cross-section of the co-planer flows and the cross-section of conical outflows will be minimized for edge-on galaxies, thus leading to a higher frequency of non-absorbers.
Consistent with Tumlinson et al. (2011), we find bluer galaxies are preferentially selected to be absorbers while redder galaxies tend to be non-absorbers. This suggests that star-formation is a key driver in the distribution and covering fraction of Ovi around galaxies. However our results shown in Figure 8 also suggest that blue galaxies have Ovi detected preferentially along their minor axes while red galaxies have Ovi absorption preferentially detected along their major axes. This result could arise from our selected color bifurcation between blue and red galaxies at 1.5 in and , where the “red” galaxies could also contain red star-forming galaxies. However, even if we changed our color cut to 2 (selecting almost only quiescent galaxies), then out of seven red galaxies six still have ∘. Thus, the Ovi cross-section of red galaxies could be dominated by small opening angle accretion of recycled material, while blue galaxies have a Ovi cross-section dominated by large-opening angle outflows. It is possible then, that the feedback mechanisms of the CGM also drive the predictions of gas cross-section and not just the presence of star-formation alone.
5. Conclusions
We have constructed a sample of 29 Ovi absorbing (EW¿0.1 Å) and 24 non-absorbing (EW¡0.1 Å) galaxies with spectroscopically confirmed redshifts ranging between 0.080.67 within kpc of bright background quasars. These galaxies are selected to be isolated such that there are no neighbors within 100 kpc and have velocity separations less than 500 km s-1. All these galaxy-absorber pairs were identified as part of our “Multiphase Galaxy Halos” Survey and from the literature. The background quasars all have medium resolution HST/COS and STIS ultraviolet spectra covering the Ovi doublet. The quasar fields have high resolution HST WFPC-2, ACS, and WFC3 imaging. We used GIM2D to model the galaxy morphological properties and the azimuthal angle relative to the galaxy project major (∘) and projected minor (∘) axes and the quasar sight-line. We have analyzed the dependence of absorption on , azimuthal angle, and and color. Our results are summarized as follows:
-
1.
We have shown that, for EW Å, the OVI rest-frame equivalent width is anti-correlated with impact parameter, (2.7). Non-absorbers (EW Å) are found at all impact parameters, such that the covering fraction is 80% within 50 kpc and decreases monotonically to 33% at 200 kpc.
-
2.
The presence of Ovi absorption (EW¿0.1 Å) is azimuthally dependent and primarily occurs along the projected major axis within a half opening angle of 20∘ and along the project minor axis within a half opening angle of at least 30∘. These results are consistent with what is expected for major axis-fed inflows and minor axis-driven outflows as traced by Ovi and consistent with previous results found for Mgii absorption.
-
3.
The frequency of non-detected Ovi absorption (EW¡0.1 Å) as a function of azimuthal angle is greatest in the range 30–60∘. Thus, there is a paucity of detectable OVI absorbing gas at intermediate azimuthal angles. This suggests that Ovi absorbing gas is not mixed throughout the CGM, but remains confined primarily within the outflowing winds and near to the planar disk region. Non-absorbers also exist within 10∘ of the projected major axis.
-
4.
We show that the covering fraction of Ovi is 35% within 0-10∘, then peaks at 85% within 10-20∘, drops back to 35% again between 20-60∘ and peaks up at 80% from 60-90∘. The lack of Ovi absorption within 10∘, increased presence of OVI absorption at 20–30∘, and then sudden decrease beyond 30∘ may suggest that cool gas resides in a narrow planar geometry surrounded by warm/hot gas. This could indicate accreting gas in which the cool material is narrowly confined to the disk plane and is surrounded by an also accreting warm/hot envelope, or indicate an extended disk with a pressure supported Ovi corona, or some combination of both scenarios. The covering fraction within 60-90∘ suggests that outflows have very high covering fractions.
-
5.
The dependence of absorption on galaxy inclination is much weaker than the galaxy position angle and this is consistent with previous results shown for Mgii absorption. The covering fraction is constant at 60% at all except it drops by a factor of two at . This is interpreted as geometric minimization in the cross-section of co-planer flows and conical outflows occurring for edge-on systems.
-
6.
We determine that the equivalent width distributions for projected major axis gas for ∘ and projected minor axis gas for ∘ have mean equivalent widths, with the standard error in the mean, of Å and Å, respectively. Therefore, higher equivalent width systems, including the highest EW systems, are found along the projected minor axis, which is consistent with an outflow scenario.
-
7.
Consistent with previous results, we show that absorbers tend to have bluer colors while non-absorbers tend to have redder colors on average. This suggests that star-formation is a key driver in the detection rate of Ovi absorption.
-
8.
We show the relative dependence of blue (15 galaxies) and red (12 galaxies) absorbing galaxies on the distribution of for a color cut of 1.5 in and . Blue galaxies show a low detection rate along the projected major axis with a gradual increase to its peak along the minor axis. The red galaxies show the strongest detection rate of absorption along the projected major axis with little-to-no detections along the minor axis. These results suggest that Ovi in the halos of blue galaxies are dominated by outflowing gas with wide opening angles while red galaxies appear to have gas along the projected major axis, which have smaller opening angles. This difference in orientation and opening angle between blue and red galaxies may explain why red galaxies less frequently produce absorption due to their low gas sky cross-section while blue galaxies have a much higher gas cross-section.
Our results are consistent with current models of gaseous multi-phase outflows and accretion/recycling. It is clear that high opening angle outflows are ubiquitous at all redshifts for star-forming galaxies, however, it is unclear whether we are still observing small opening angle cold accretion filaments at redshifts or, the more likely scenario, we are detecting recycling of previously ejected gas, which can be seen for most red and a few blue galaxies. Placing constraints of the metallicity of these absorption systems hold the key in constraining the exact feedback processes that are occurring in and around galaxies.
References
- Bertin & Arnouts (1996) Bertin, E., & Arnouts, S. 1996, A&AS, 117, 393
- Bordoloi et al. (2014) Bordoloi, R., Lilly, S. J., Kacprzak, G. G., & Churchill, C. W. 2014, ApJ, 784, 108
- Bordoloi et al. (2011) Bordoloi, R., Lilly, S. J., Knobel, C., et al. 2011, ApJ, 743, 10
- Bouché et al. (2012) Bouché, N., Hohensee, W., Vargas, R., Kacprzak, G. G., et al. 2012, MNRAS, 426, 801
- Bouché et al. (2013) Bouché, N., Murphy, M. T., Kacprzak, G. G., et al. 2013, Science, 341, 50
- Bouché et al. (2006) Bouché, N., Murphy, M. T., Péroux, C., Csabai, I. & Wild. V. 2006 MNRAS, 371, 495
- Bychkova et al. (2006) Bychkova, V. S., Kardashev, N. S., Boldycheva, A. V., Gnedin, Y. N., & Maslennikov, K. L. 2006, Astronomy Reports, 50, 802
- Chelouche & Bowen (2010) Chelouche, D., & Bowen, D. V. 2010, ApJ, 722, 1821
- Chen et al. (2010a) Chen, H.-W., Helsby, J. E., Gauthier, J.-R., Shectman, S. A., Thompson, I. B., & Tinker, J. L. 2010a, ApJ, 714, 1521
- Chen et al. (2005) Chen, H.-W., Kennicutt, R. C., Jr., & Rauch, M. 2005, ApJ, 620, 703
- Chen et al. (2010b) Chen, H.-W., Wild, V., Tinker, J. L., et al. 2010b, ApJ, 724, L176
- Chen et al. (2001) Chen, H.-W., Lanzetta, K. M., Webb, J. K., & Barcons, X. 2001, ApJ, 559, 654
- Churchill et al. (2012) Churchill, C. W., Kacprzak, G. G., Steidel, C. C., et al. 2012, ApJ, 760, 68
- Coil et al. (2011) Coil, A. L., Weiner, B. J., Holz, D. E., et al. 2011, ApJ, 743, 46
- Cooksey et al. (2008) Cooksey, K. L., Prochaska, J. X., Chen, H.-W., Mulchaey, J. S., & Weiner, B. J. 2008, ApJ, 676, 262
- Crighton et al. (2015) Crighton, N. H. M., Hennawi, J. F., Simcoe, R. A., et al. 2015, MNRAS, 446, 18
- Crighton et al. (2013) Crighton, N. H. M., Hennawi, J. F., & Prochaska, J. X. 2013, ApJ, 776, L18
- Danforth & Shull (2008) Danforth, C. W., & Shull, J. M. 2008, ApJ, 679, 194
- Danforth et al. (2010) Danforth, C. W., Stocke, J. T., & Shull, J. M. 2010, ApJ, 710, 613
- Davé et al. (2011b) Davé, R., Finlator, K., & Oppenheimer, B. D. 2011, MNRAS, 416, 1354
- Davé et al. (2011a) Davé, R., Oppenheimer, B. D., & Finlator, K. 2011, MNRAS, 415, 11
- Davé et al. (2012) Davé, R., Finlator, K., & Oppenheimer, B. D. 2012, MNRAS, 421, 98
- Dekel & Birnboim (2006) Dekel, A., & Birnboim, Y. 2006, MNRAS, 368, 2
- Dekel et al. (2009) Dekel, A., Birnboim, Y., Engel, G., et al. 2009, Nature, 457, 451
- Diamond-Stanic et al. (2015) Diamond-Stanic, A. M., Coil, A. L., Moustakas, J., et al. 2015, arXiv:1507.01945
- Ford et al. (2014) Ford, A. B., Davé, R., Oppenheimer, B. D., et al. 2014, MNRAS, 444, 1260
- Gehrels (1986) Gehrels, N. 1986, ApJ, 303, 336
- Gil de Paz et al. (2007) Gil de Paz, A., Boissier, S., Madore, B. F., et al. 2007, ApJS, 173, 185
- Gonzaga et al. (2012) Gonzaga, S., Hack, W., Fruchter, A., Mack, J., eds. 2012, The DrizzlePac Handbook. (Baltimore, STScI)
- Guillemin & Bergeron (1997) Guillemin p., & Bergeron, J. 1997, A&A, 328, 499
- Johnson et al. (2015) Johnson, S. D., Chen, H.-W., & Mulchaey, J. S. 2015, MNRAS, 449, 3263
- Johnson et al. (2013) Johnson, S. D., Chen, H.-W., & Mulchaey, J. S. 2013, MNRAS, 434, 1765
- Kacprzak et al. (2010) Kacprzak, G. G., Churchill, C. W., Ceverino, D., Steidel, C. C., Klypin, A., & Murphy, M. T. 2010, ApJ, 711, 533
- Kacprzak et al. (2011b) Kacprzak, G. G., Churchill, C. W., Evans, J. L., Murphy, M. T., & Steidel, C. C. 2011b, MNRAS, 416, 3118
- Kacprzak et al. (2007) Kacprzak, G. G., Churchill, C. W., Steidel, C. C., Murphy, M. T., & Evans, J. L 2007, ApJ, 662, 909
- Kacprzak et al. (2012) Kacprzak, G. G., Churchill, C. W., & Nielsen, N. M. 2012, ApJ, 760, L7
- Kacprzak et al. (2012) Kacprzak, G. G., Churchill, C. W., Steidel, C. C., Spitler, L. R., & Holtzman, J. A. 2012, MNRAS, 427, 3029
- Kacprzak et al. (2014) Kacprzak, G. G., Martin, C. L., Bouché, N., et al. 2014, ApJ, 792, L12
- Kato, Omachi, & Aso (2002) Kato, T., Omachi, S., & Aso, H. 2002, Lect. Notes Comput. Sci. 2396, 405
- Kereš et al. (2005) Kereš, D., Katz, N., Weinberg, D. H., & Davé, R. 2005, MNRAS, 363, 2
- Kriss (2011) Kriss, G. A. 2011, COS Instrument Science Report 2011-01(v1), 17 pages, 1
- Krist & Hook (2004) Krist, J. & Hook, R. 2004, The Tiny Tim User Manual v6.3 (Baltimore:STScI)
- Krogager et al. (2013) Krogager, J.-K., Fynbo, J. P. U., Ledoux, C., et al. 2013, MNRAS, 433, 3091
- Lan et al. (2014) Lan, T.-W., Ménard, B., & Zhu, G. 2014, ApJ, 795, 31
- Maller & Bullock (2004) Maller, A. H., & Bullock, J. S. 2004, MNRAS, 355, 694
- Mathes et al. (2014) Mathes, N. L., Churchill, C. W., Kacprzak, G. G., et al. 2014, ApJ, 792, 128
- Martin & Bouché (2009) Martin, C. L., & Bouché, N. 2009, ApJ, 703, 1394
- Martin et al. (2012) Martin, C. L., Shapley, A. E., Coil, A. L., et al. 2012, ApJ, 760, 127
- Ménard & Fukugita (2012) Ménard, B., & Fukugita, M. 2012, ApJ, 754, 116
- Mo & Miralda-Escude (1996) Mo, H. J., & Miralda-Escude, J. 1996, ApJ, 469, 589
- Muzahid et al. (2015) Muzahid, S., Kacprzak, G. G., Churchil, C. W., et al. 2015,arXiv:1506.01028
- Nielsen et al. (2013a) Nielsen, N. M., Churchill, C. W., & Kacprzak, G. G. 2013, ApJ, 776, 115
- Nielsen et al. (2015) Nielsen, N. M., Churchill, C. W., Kacprzak, G. G., Murphy, M. T., & Evans, J. L. 2015, arXiv:1505.07167
- Nestor et al. (2011) Nestor, D. B., Johnson, B. D., Wild, V., et al. 2011, MNRAS, 412, 1559
- Noterdaeme et al. (2012) Noterdaeme, P., Laursen, P., Petitjean, P., et al. 2012, A&A, 540, A63
- Noterdaeme et al. (2010) Noterdaeme, P., Srianand, R., & Mohan, V. 2010, MNRAS, 403, 906
- Oppenheimer & Davé (2009) Oppenheimer, B. D., & Davé, R. 2009, MNRAS, 395, 1875
- Oppenheimer et al. (2010) Oppenheimer, B. D., Davé, R., Kereš, D., et al. 2010, MNRAS, 406, 2325
- Peeples et al. (2014) Peeples, M. S., Werk, J. K., Tumlinson, J., et al. 2014, ApJ, 786, 54
- Péroux et al. (2013) Péroux, C., Bouché, N., Kulkarni, V. P., & York, D. G. 2013, MNRAS, 436, 2650
- Prochaska et al. (2011) Prochaska, J. X., Weiner, B., Chen, H.-W., Mulchaey, J., & Cooksey, K. 2011, ApJ, 740, 91
- Reimers et al. (1989) Reimers, D., Clavel, J., Groote, D., et al. 1989, A&A, 218, 71
- Ribaudo et al. (2011) Ribaudo, J., Lehner, N., Howk, J. C., et al. 2011, ApJ, 743, 207
- Rubin et al. (2014) Rubin, K. H. R., Prochaska, J. X., Koo, D. C., et al. 2014, ApJ, 794, 156
- Rubin et al. (2012) Rubin, K. H. R., Prochaska, J. X., Koo, D. C., & Phillips, A. C. 2012, ApJ, 747, L26
- Rubin et al. (2010) Rubin, K. H. R., Prochaska, J. X., Koo, D. C., Phillips, A. C., & Weiner, B. J. 2010, ApJ, 712, 574
- Savage et al. (2003) Savage, B. D., Sembach, K. R., Wakker, B. P., et al. 2003, ApJS, 146, 125
- Sembach et al. (2004) Sembach, K. R., Tripp, T. M., Savage, B. D., & Richter, P. 2004, ApJS, 155, 351
- Sérsic (1968) Sérsic, J. L. 1968, Cordoba, Argentina: Observatorio Astronomico
- Simard et al. (2002) Simard, L., Willmer, C. N. A., Vogt, N. P., Sarajedini, V. L., Philips, A. C., Weiner, B. J., Koo, D. C., Im, M., Illingworth, G. D., & Faber, S. M. 2002, ApJS, 142, 1
- Springel & Hernquist (2003) Springel, V., & Hernquist, L. 2003, MNRAS, 339, 289
- Steidel et al. (2002) Steidel, C. C., Kollmeier, J. A., Shapely, A. E., Churchill, C. W., Dickinson, M., & Pettini, M. 2002, ApJ, 570, 526
- Stewart et al. (2011) Stewart, K. R., Kaufmann, T., Bullock, J. S., et al. 2011, ApJ, 738, 39
- Stocke et al. (2013) Stocke, J. T., Keeney, B. A., Danforth, C. W., et al. 2013, ApJ, 763, 148
- Stocke et al. (2006) Stocke, J. T., Penton, S. V., Danforth, C. W., et al. 2006, ApJ, 641, 217
- Thom et al. (2011) Thom, C., Werk, J. K., Tumlinson, J., et al. 2011, ApJ, 736, 1
- Tremonti et al. (2007) Tremonti, C. A., Moustakas, J., & Diamond-Stanic, A. M. 2007, ApJl, 663, L77
- Tripp et al. (2005) Tripp, T. M., Jenkins, E. B., Bowen, D. V., et al. 2005, ApJ, 619, 714
- Tripp et al. (2008) Tripp, T. M., Sembach, K. R., Bowen, D. V., et al. 2008, ApJS, 177, 39
- Tumlinson et al. (2011) Tumlinson, J., Thom, C., Werk, J. K., et al. 2011, Science, 334, 948
- van Dokkum (2001) van Dokkum, P. G. 2001, PASP, 113, 1420
- Wakker & Savage (2009) Wakker, B. P., & Savage, B. D. 2009, ApJS, 182, 378
- Walter et al. (2002) Walter, F., Weiss, A., & Scoville, N. 2002, ApJ, 580, L21
- Weiner et al. (2009) Weiner, B. J., et al. 2009, ApJ, 692, 187
- Werk et al. (2012) Werk, J. K., Prochaska, J. X., Thom, C., et al. 2012, ApJS, 198, 3
- Werk et al. (2014) Werk, J. K., Prochaska, J. X., Tumlinson, J., et al. 2014, ApJ, 792, 8
- Whitmore (1995) Whitmore B., 1995, Photometry with the WFPC2. In: Koratkar A., Leitherer C. (eds.) Calibrating Hubble Space Telescope: Post servicing mission, STScI, Baltimore
- Zonak et al. (2004) Zonak, S. G., Charlton, J. C., Ding, J., & Churchill, C. W. 2004, ApJ, 606, 196
- Zibetti et al. (2007) Zibetti, S., Ménard, B., Nestor, D. B., Quider, A. M., Rao, S. M., & Turnshek, D. A. 2007, ApJ, 658, 161