11email: jakob.pinggera—stefan.zugal—barbara.weber@uibk.ac.at 22institutetext: Department of Psychology, University of Innsbruck, Austria
22email: marco.furtner—markus.martini—pierre.sachse@uibk.ac.at, katharina.reiter@student.uibk.ac.at
Investigating the Process of Process Modeling with Eye Movement
Analysis††thanks: The final publication is available at Springer via
http://dx.doi.org/10.1007/978-3-642-36285-9_46
Full
Paper
Abstract
Research on quality issues of business process models has recently begun to explore the process of creating process models by analyzing the modeler’s interactions with the modeling environment. In this paper we aim to complement previous insights on the modeler’s modeling behavior with data gathered by tracking the modeler’s eye movements when engaged in the act of modeling. We present preliminary results and outline directions for future research to triangulate toward a more comprehensive understanding of the process of process modeling. We believe that combining different views on the process of process modeling constitutes another building block in understanding this process that will ultimately enable us to support modelers in creating better process models.
Keywords:
business process modeling, process of process modeling, modeling phase diagrams, eye movement analysis, empirical research1 Introduction
Considering the heavy usage of business process modeling in all types of business contexts, it is important to acknowledge both the relevance of process models and their associated quality issues. On the one hand, it has been shown that a good understanding of a process model has a positive impact on the success of a modeling initiative [1]. On the other hand, actual process models display a wide range of problems that impede their understandability [2]. Clearly, an in-depth understanding of factors influencing process model quality is in demand.
Most research in this area puts a strong emphasis on the product of the process modeling act, i.e., the process model, (e.g., [3]). Other works—instead of dealing with the quality of individual models—focus on the characteristics of modeling languages (e.g., [4]). Recently, research has begun to explore another dimension presumably affecting the quality of business process models by looking into the process of creating a process model (e.g., [5, 6, 7, 8]). Thereby, the focus has been put on the formalization phase, in which a process modeler is facing the challenge of constructing a syntactically correct model reflecting a given domain description [9]. Our research can be attributed to the latter stream of research.
This paper contributes to our understanding of the process of process modeling (PPM) by combining modeling phase diagrams [6] with data collected by analysing the modeler’s eye movements. We demonstrate the feasibility of using eye movement analysis to complement existing analysis techniques for the PPM by presenting preliminary results and outline directions for future work. We postulate that by analysing the PPM from different viewpoints, a more comprehensive understanding of the process underlying the creation of process models can be obtained, facilitating the creation of modeling environments that support modelers in creating high quality models. Similarly, improved knowledge about the PPM can be exploited for teaching students in the craft of modeling.
The paper is structured as follows. Section 2 presents backgrounds on the PPM. Section 3 introduces eye movement analysis. Section 4 describes the conducted modeling sessions, whereas Section 5 presents preliminary results. The paper is concluded with related work in Section 6 and a summary in Section 7.
2 Background
This section describes backgrounds of the PPM and illustrates how the PPM can be visualized using modeling phase diagrams.
2.1 The Process of Process Modeling
During the formalization phase process modelers are creating a formal process model reflecting a given textual domain description by interacting with the process modeling environment [9]. At an operational level, the modeler’s interactions with the tool would typically consist of a cycle of the three successive phases of (1) comprehension (i.e., the modeler forms a mental model of domain behavior), (2) modeling (i.e., the modeler maps the mental model to modeling constructs), and (3) reconciliation (i.e., the modeler reorganizes the process model) [5, 6].
Comprehension. According to [10], when facing a task, the problem solver first formulates a mental representation of the problem, and then uses it for reasoning about the solution and which methods to apply for solving the problem. In process modeling, the task is to create a model which represents the behavior of a domain. The process of forming mental models and applying methods for achieving the task is not done in one step applied to the entire problem. Rather, due to the limited capacity of working memory, the problem is broken down to pieces that are addressed sequentially, chunk by chunk [5, 6].
Modeling. The modeler uses the problem and solution developed in working memory during the previous comprehension phase to materialize the solution in a process model (by creating or changing it) [5, 6]. The modeler’s utilization of working memory influences the number of modeling steps executed during the modeling phase before forcing the modeler to revisit the textual description for acquiring more information [6].
Reconciliation. After modeling, modelers typically reorganize the process model (e.g., renaming of activities) and utilize the process model’s secondary notation (e.g., notation of layout, typographic cues) to enhance the process model’s understandability [11]. However, the number of reconciliation phases in the PPM is influenced by a modeler’s ability of placing elements correctly when creating them, alleviating the need for additional layouting [6].
2.1.1 Modeling Phase Diagrams (MPD).
In order to facilitate the systematic investigation of the PPM, Cheetah Experimental Platform (CEP) has been developed [12]. In particular, a basic process modeling editor is instrumented to record each user’s interactions in an event log, describing the creation of the process model step by step. When modeling in a process modeling environment, process modeling consists of adding nodes and edges to the process model, naming or renaming activities, and adding conditions to edges. In addition to these interactions, a modeler can influence the process model’s secondary notation, e.g., by laying out the process model using move operations for nodes or by utilizing bendpoints to influence the routing of edges, see [6] for details. By capturing all of the described interactions with the modeling tool, we are able to replay a recorded modeling process at any point in time111A replay demo is available at http://cheetahplatform.org [6].
In [6] a technique for visualizing the PPM is proposed by mapping the modeler’s interactions with the modeling environment to the phases described above. Fig. 1a shows several states of a typical modeling process as it can be observed during replay. Fig. 1c shows the states of a different modeling process that nonetheless results in the same model.
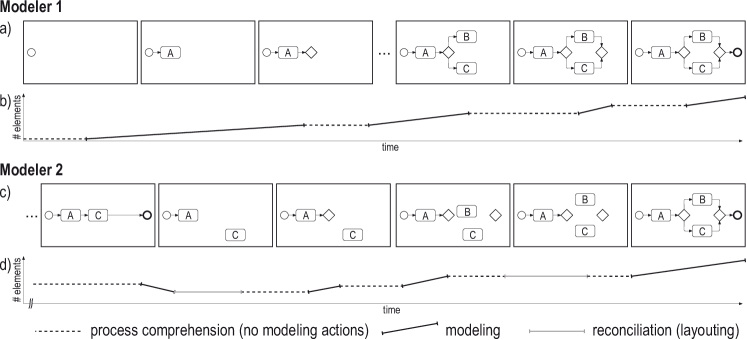
To obtain a better understanding of the modeling process and its phases, we supplement model replay with a modeling phase diagram, quantitatively highlighting the three phases of modeling, comprehension, and reconciliation. It depicts how the size of the model (vertical axis) evolves over time (horizontal axis), as can be seen in Fig. 1b and Fig. 1d for the modeling processes in Fig. 1a and Fig. 1c, respectively. A modeling phase consists of a sequence of interactions to create or delete model elements such as activities or edges. A modeler usually does not create a model in a continuous sequence of interactions, but rather pauses after several interactions to inspect the intermediate result and to plan the next steps. Syntactically, this manifests in reduced modeling activity or even inactivity, i.e, a comprehension phase. Besides, modelers need to reorganize the model. Reconciliation interactions manifest in moving or renaming model elements to prepare the next modeling interactions or to support their comprehension of the model. A sequence of such interactions is a reconciliation phase.
3 Eye Movement Analysis
Even though MPDs provide valuable insights into the PPM, the modeler’s cognitive processes are left in the realm of speculation. More specifically, in a MPD the various phases are detected by classifying the modeler’s interactions with the modeling environment and aggregating them to the various phases of the PPM [6]. Comprehension phases in a MPD are assessed by measuring the duration not interacting with the modeling tool [6]. Thresholds are utilized for differentiating between an actual comprehension phase and the usual inactivity between creating model elements, i.e., the time it takes the modeler to select a different tool and create the next model element [6]. This draws a rather coarse grained picture of the PPM, i.e., shorter comprehension phases are not detected. Similarly, the authors in [6] claim that there are diverse reasons for comprehension phases. On the one hand, the modeler might create an internal representation of the modeling task presented as an informal description. On the other hand, the modeler might be understanding the process model or inspecting it for potential errors. In order to develop a more fine grained understanding of the PPM, we propose the combination of different views on the PPM. Subsequently, we introduce eye movement analysis, which is combined with the corresponding MPD to triangulate toward a more comprehensive understanding of the PPM.
3.0.1 Eye Movements.
When creating a formal process model from an informal specification, a modeler relies on his visual perception for reading the task description and creating the process model using the modeling environment. In this context, high-resolution visual information input is of special interest, which is necessary for reading a word or seeing an element of the process model. High-resolution visual information input can only occur during so-called fixations, i.e., the modeler fixates the area of interest on the screen with the fovea, the central point of highest visual acuity [13]. Fixations can be detected when the velocity of eye movements is below a certain threshold for a pre-defined duration [14]. Using eye fixations, we can identify areas on the screen the modeler is focusing attention on [15], e.g., the task description, features of the modeling environment or modeling constructs.
In order to perform a detailed analysis, the modeler’s eye movements need to be quantified. For this purpose, several different parameters exist [16]. In this study we focus on two of the most widely used eye movement parameters [14].
Number of Fixations. The number of fixations is calculated by counting the number of fixations in a pre-specified timeframe on a certain area on the screen. This allows researchers to compare the number of fixations on certain areas on the computer screen, e.g., the task description versus the process model.
Mean Fixation Duration. The mean duration of fixations is calculated by measuring the durations of fixations on a certain area on the screen in a predefined timeframe and calculating the average duration. Longer durations could be interpreted toward deeper processing of information [16], but might indicate inactivity of the participant if fixation durations become too long compared to the participants usual fixation durations [17].
4 Data Collection
In order to test the feasibility of combining eye movement analysis with existing research on the PPM, i.e., MPD, we designed modeling sessions with students of computer science and information systems. Participants were recorded using an eye tracker when translating an informal description into formal process model.
4.1 Definition and Planning
This section describes the definition and planning of the modeling sessions.
Subjects. The targeted subjects should be familiar with business process management and imperative process modeling notations. More specifically, they should have prior experience in creating process models using BPMN. We are not targeting modelers who are not familiar with BPMN at all to avoid measuring their learning instead of the modeling behavior.
Objects. The modeling session was designed to collect PPM instances of students creating a formal process model in BPMN from an informal description. The informal description was formulated in German since all participants were native German speakers, avoiding potential translation problems. The object that was to be modeled is a process describing the handling of mortgage request by a bank222Material download: http://pinggera.info/experiment/EyeMovementAnalysis. The process model consists of 19 activities and contains the basic control flow pattern: sequence, parallel split, synchronization, exclusive choice, simple merge and structured loop [18].
Response Variables. As already mentioned in the previous section, we recorded the number of fixations and the duration of fixations. The PPM instances were cut into several parts as detailed in Section 5 and subsequently analysed. CEP recorded the PPM instances on an operational level permitting the generation of a MPD for each PPM instance.
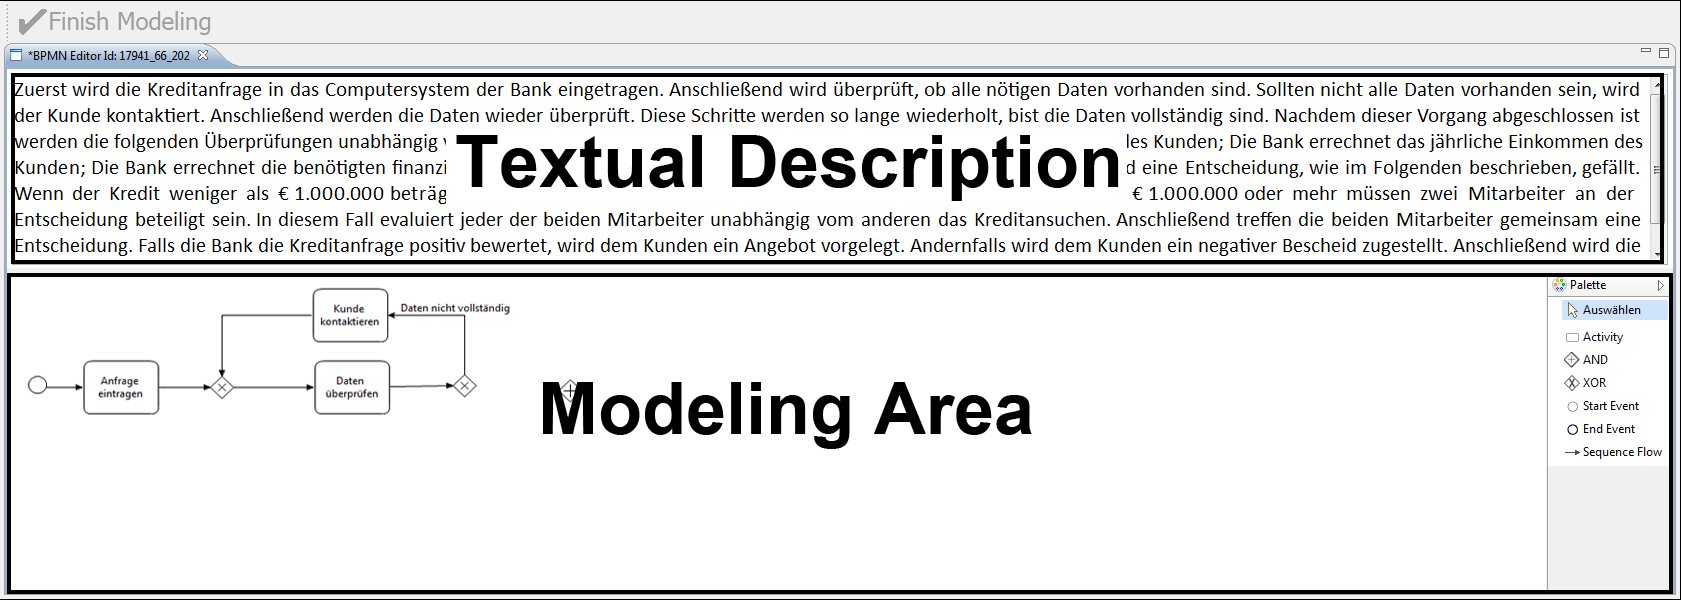
Instrumentation and Data Collection. CEP was utilized for recording the participants’ PPM instances. To mitigate the risk that PPM instances were impacted by complicated tools or notations [19], we decided to use a subset of BPMN. In order to investigate the modeler’s eye movements in the process model, but also in the textual description we juxtapose the task description with the modeling area (cf. Figure 2). Several pre-tests were conducted to ensure the usability of the tool and the understandability of the task description.
For performing the eye movement analysis we utilized a table mounted eye tracker, i.e., Eyegaze Analysis System333http://www.eyegaze.com, recording eye movements using two binocular cameras positioned beneath a 17” computer display with a frequency of 60 Hz each. Data recording is carried out with the pupil center corneal reflection method [20]. Data collection and analysis is performed using NYAN 2.0444http://www.interactive-minds.com. The eye tracker is calibrated for each participant individually; calibrations are accepted if the fixation accuracy shows an average drifting error of at most 0.25 inches. Two observation monitors allow watching both eyes separately while in the process of eye-tracking to correct the sitting posture of participants to recalibrate during recording if necessary.
4.2 Performing the Modeling Session
This section describes the modeling sessions’ execution.
Experimental Execution. Since we have only access to a single eye tracker, each modeler has to be recorded individually. 25 students of computer science or information systems participated in the study. Each participant has taken classes on business process management including the creation of business process models in BPMN. Modeling sessions were conducted between February 2012 and May 2012 at the University of Innsbruck. The experiment was guided by CEP’s experimental workflow engine [12], leading students through the modeling task, a concluding questionnaire and a feedback questionnaire. Participation was voluntary; data collection was performed anonymously.
Data Validation. Similar to [21] we screened the subjects for familiarity with BPMN by asking them whether they would consider them to be very familiar with BPMN, using a Likert scale with values ranging from Strongly disagree (1) over Neutral (4) to Strongly agree (7). The computed mean for familiarity with BPMN is 4.84 (slightly below Somewhat Agree). For confidence in understanding BPMN models, a mean value of 5.76 was reached (slightly below Agree). Finally, for perceived competence in creating BPMN models, a mean value of 5.4 (between Somewhat Agree and Agree) could be computed. Since all values range above average, we conclude that the participating subjects fit the targeted profile.
5 Combining MPD and Eye Movement Analysis
In this section we demonstrate the feasibility of combining eye movement analysis with existing research on the PPM. Based on the data analysis procedure described in Section 5.1 two PPM instances are presented and briefly discussed in Section 5.2. Preliminary results from combining eye movement analysis with the corresponding MPD are discussed in Section 5.3.
5.1 Data Analysis
In this preliminary study, our focus was put on evaluating the feasibility of combining eye movement analysis with existing research on the PPM, e.g., [6, 7, 8], and to investigate potential benefits of such a combined analysis. For this purpose, we select two PPM instances for further analysis. Similar to [6], we use CEP to generate the MPD for each modeler. In combination with CEP’s replay feature we are able to gain an inital understanding of the modeler’s behavior. In order to validate and extend our insights, we perform the eye movement analysis of the PPM. Since there are several interesting timeframes exhibiting different characteristics in the PPM, we manually separate the PPM into several, so-called, timeframes of interest (TOI). TOIs are identified based on changes in the modeling behavior of the participant, e.g., the modeler switches from adding model elements to resolving problems. Please note that TOIs are identified for each modeler individually and cannot be compared to TOIs of other modelers.
For each TOI in the PPM we distinguish between fixations on the textual description and fixations on the modeling area (cf. Figure 2). The relationship between fixations on the textual description and fixations on the process model is expressed by calculating the percentage of fixations on the textual description out of the total number of fixation (textual description and process model). Additionally, we calculate the mean fixation duration for fixations on the textual description and the mean fixation duration for fixations on the process model.
5.2 PPM Examples
In this section we present the MPDs selected for further analysis.
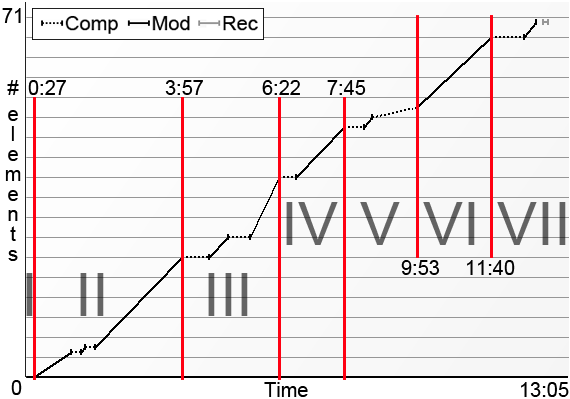
Modeler M1. Figure 3 illustrates the PPM of M1. In general, M1 produces the process model in a straight forward manner, presumably with a clear conception of the resulting process model in mind. The MPD shows several iterations of comprehension phases followed by long modeling phases. TOI V constitutes an exception in the rather straight forward modeling approach since an error is introduced, i.e., the modeler forgets about an activity. The modeler immediately detects the problem and resolves it. The MPD shows two comprehension phases which are only briefly interrupted by a modeling phase555The number of elements in the process model can also change during a comprehension phase in a MPD since several comprehension phases can be merged when interrupted by brief modeling actions [6].. The PPM is concluded by a brief reconciliation phase (the only one in this PPM).
| Textual Description | Process Model | Fix. on Text[%] | |||
|---|---|---|---|---|---|
| TOI | Nr. of Fix. | Mean Dur.[ms] | Nr. of Fix. | Mean Dur.[ms] | |
| I | 12 | 154 | 15 | 387 | 44.4% |
| II | 174 | 164 | 442 | 199 | 28.2% |
| III | 306 | 179 | 386 | 205 | 44.2% |
| IV | 147 | 169 | 154 | 220 | 48.8% |
| V | 228 | 204 | 215 | 237 | 51.5% |
| VI | 19 | 156 | 415 | 192 | 4.4% |
| VII | 31 | 188 | 194 | 249 | 13.8% |
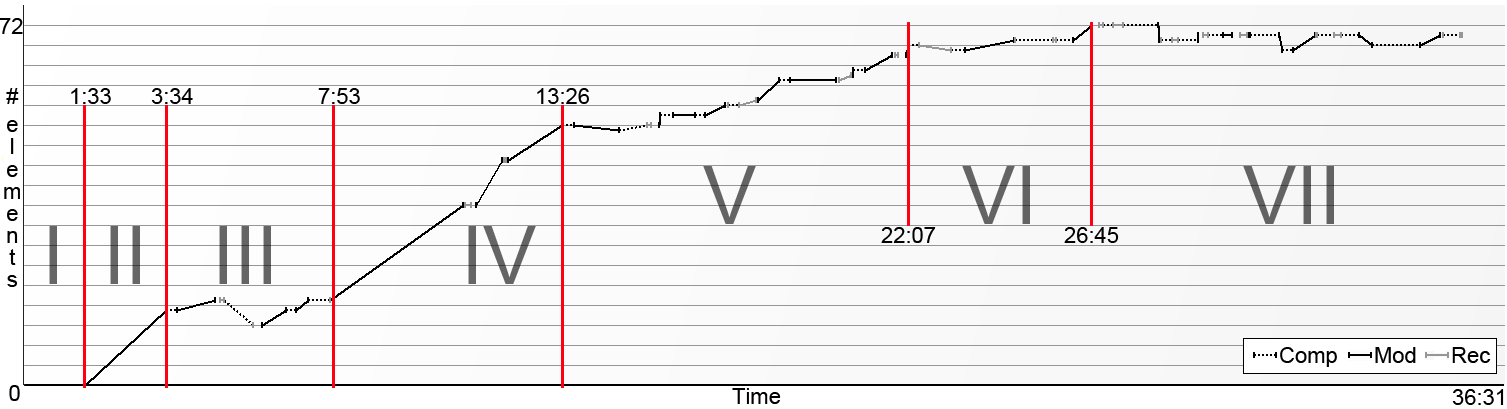
Modeler M2. In contrast to M1, the MPD of M2 shows a very long PPM (cf. Figure 4). After a fast start, M2 experiences first difficulties in TOI III, where M2 seems to struggle with introducing a loop in the process model. After resolving this issues, the modeler returns to a fast modeling style before experiencing problems toward the end of the PPM. In TOI V, M2 adds parts of the process model just to remove them immediately on a trial and error basis. This behavior changes in TOI VI when several long comprehension phases and less delete operations can be observed. After achieving a complete model at the end of TOI VI M2 checks the model for inconsistencies in TOI VII to make occasional improvements.
| Textual Description | Process Model | Fix. on Text[%] | |||
|---|---|---|---|---|---|
| TOI | Nr. of Fix. | Mean Dur.[ms] | Nr. of Fix. | Mean Dur.[ms] | |
| I | 297 | 203 | 54 | 223 | 84.6% |
| II | 88 | 165 | 368 | 204 | 19.3% |
| III | 79 | 162 | 882 | 221 | 8.2% |
| IV | 430 | 158 | 947 | 205 | 31.2% |
| V | 491 | 173 | 1,710 | 209 | 22.3% |
| VI | 95 | 177 | 921 | 233 | 9.4% |
| VII | 319 | 149 | 1,760 | 211 | 15.3% |
5.3 Preliminary Results
Table 1 and Table 2 show the various eye movement parameters for each TOI of M1 and M2 respectively. Subsequently, we present preliminary results deduced from combining eye movement analysis with the corresponding MPD.
Shorter Fixations when Reading. When comparing mean fixation durations it can be observed that mean durations are lower for fixations on the task description compared to fixations on the process model. This finding is consistent with results reported in literature indicating shorter fixations when reading [22].
Fast and Focused Modeling. In our previous research we observed phases in the PPM when modelers created large chunks of their process models in relatively short periods of time. We had the impression that modelers had a clear picture of the PPM in mind, often alleviating them from subsequent reconciliation phases since they placed model elements at strategic places right from the beginning [6]. In a MPD, those periods are mostly indicated by long and steep modeling phases. Also M1 and M2 exhibit such phases. M1 starts with long modeling phases in TOI II and has another long modeling phase in TOI VI. M2 has similar phases in TOI II and TOI IV. All TOIs have low mean fixation durations, indicating a lower perceived complexity of the situation at hand compared to other TOIs [23]. The lower perceived complexity, in turn, allows modelers to consider additional model characteristics like the process model’s secondary notation right from the beginning. This finding corroborates our impression of phases in the PPM where modelers have a good understanding of the current task.
Challenging Situations. During the creation of process models, the two modelers were facing situations they perceived to be more challenging. This is underpinned by the recorded mean fixation durations. When only considering the fixations on the process model, TOI V and TOI VII are the most challenging for M1, since the mean fixation duration is increased, pointing toward higher attention and a deeper processing of information [16]. This seems reasonable when considering the MPD and CEP’s replay. M1 detects an error in the process model in TOI V. In TOI VII, the mean duration of fixations on the process model is increased by more than 50ms, i.e., an increase of 29.7% compared to TOI VI. In fact, M1 is working on arguably the most challenging part of the process model, i.e., a long back edge to an earlier part of the process model [24]. For M2, a similar increase in fixation durations in TOI III can be observed. The modeler interrupts their modeling endeavour for additional comprehension and removes some elements from the process model. In TOI VI of M2, the mean fixation duration is also increased. Notably, M2 is also working on the challenging part of the process model. Long mean durations of fixations, however, observed on their own do not necessarily imply challenging situations. For example, when considering TOI I of M1, the combination of very long mean duration of fixations on the process model and the absence of interactions with the modeling environment point toward inactivity [17].
Causes for Comprehension. Modelers interrupt their modeling endeavor for comprehension phases. In a MPD the reason for such a comprehension phases so far remains in the realm of speculation. On the one hand, modeler might create the internal representation of the task description [6]. On the other hand, they might have a perfect understanding of the task, but struggle to convert it into the formal process model [6]. We claim that inspecting the ratio of fixations on the task description can provide valuable insights. For instance, M2 has several comprehension phases in TOI III, but the ratio of fixation on the task description is only 8.2%. Therefore, we conclude that M2 was rather struggling with the modeling notation. On the contrary, M1 detects an error in his process model in TOI V. Similar to M2, several comprehension phases can be identified in the MPD, but the ratio of fixations on the task description points toward a different problem. 51.5% of the fixations are on the task description, the highest percentage of all TOIs. Therefore, we conclude that M1 had a problem with the task description instead of the modeling notation.
5.4 Outlook
Insights presented in the previous section raise the question whether there are certain situations in the PPM that are perceived to be more challenging by the majority of process modelers (with a certain level of experience). This might be an interesting aspect for future work, since a better understanding of factors influencing the PPM could be helpful for teaching students in the craft of modeling. Additionally, we should aim for supporting modelers in challenging phases of the PPM by providing them specialized tool support rather than supporting them in phases of fast and focused modeling.
In the near future, we are planning a more detailed eye movement analysis. On the one hand, we work on separating each PPM instance into phases based on the part of the process model that is currently edited. This allows us to compare eye movements of several modelers for a specific part of the process model. Additionally, a more detailed analysis than comparing fixations on the textual description and fixations on the process model is in demand. One interesting aspect might be how often modelers look back to previously created parts of the process model. Reasons for this might be the validation of previously created parts, but they could also be looking for similarities to the current problem to facilitate their problem solving.
6 Related Work
Our work is essentially related to model quality frameworks, research on the PPM and usage of eye movement analysis in conceptual modeling.
Regarding model quality frameworks, there are different frameworks and guidelines available that define quality for process models. Among others, the SEQUAL framework uses semiotic theory for identifying various aspects of process model quality [25], the Guidelines of Process Modeling describe quality considerations for process models [26], and the Seven Process Modeling Guidelines define desirable characteristics of a process model [27]. While each of these frameworks has been validated empirically, they rather take a static view by focusing on the resulting process model, but not on the act of modeling itself. Our research takes another approach by investigating the process followed to create the process model.
Research on the process of modeling typically focuses on interactions between different parties. In a classical setting, a system analyst directs a domain expert through a structured discussion subdivided into the stages elicitation, modeling, verification, and validation [9]. The procedure of developing process models in a team is analyzed in [28]. Interpretation tasks and classification tasks are identified on the semantic level of modeling. These works build on observation of modeling practice and distill normative procedures for steering the process of modeling toward a good completion. Our work, in turn, focuses on the formalization of process models, i.e., the modeler’s interactions with the modeling environment when creating the formal process model.
In the context of conceptual modeling several experiments have been conducted investigating the comprehension of UML models, e.g., [29] and the interpretation of data models, e.g., [30] using eye movement analysis. In business process management a research agenda has been proposed in [31] for investigating user satisfaction. Our research, focuses on the process of translating an informal textual description into a formal conceptual model instead of investigating the comprehension of existing models.
7 Summary
This paper demonstrates the feasibility of combining eye movement analysis with existing research on the PPM to triangulate toward a more comprehensive understanding of the PPM. Modeling sessions were conducted to collect PPM instances from students while tracking their eye movements. Based on their MPDs we selected two examples to illustrate the combination of existing analysis techniques with eye movement analysis. This combination helps to shed light on parts of this hardly understood process. Preliminary results revealed insights into the PPM that could not be obtained by using one analysis technique on its own. For future work we plan more detailed evaluations with a higher number of participants to perform quantitative analysis on their PPM instances. We believe that a better understanding regarding the PPM will be beneficial for future process modeling environments and will support teachers in mentoring their students on their way to professional process modelers.
Acknowledgements. This research was funded by the Austrian Science Fund (FWF): P23699-N23.
References
- [1] Kock, N., Verville, J., Danesh-Pajou, A., DeLuca, D.: Communication flow orientation in business process modeling and its effect on redesign success: results from a field study. DSS 46 (2009) 562–575
- [2] Mendling, J.: Metrics for Process Models: Empirical Foundations of Verification, Error Prediction, and Guidelines for Correctness. Springer (2008)
- [3] Van der Aalst, W., Ter Hofstede, A.: Verification of workflow task structures: A petri-net-baset approach. IS 25 (2000) 43–69
- [4] Moody, D.L.: The ”Physics” of Notations: Toward a Scientific Basis for Constructing Visual Notations in Software Engineering. IEEE Trans. Software Eng. 35 (2009) 756–779
- [5] Soffer, P., Kaner, M., Wand, Y.: Towards Understanding the Process of Process Modeling: Theoretical and Empirical Considerations. In: Proc. ER-BPM ’11. (2011) 357–369
- [6] Pinggera, J., Zugal, S., Weidlich, M., Fahland, D., Weber, B., Mendling, J., Reijers, H.A.: Tracing the process of process modeling with modeling phase diagrams. In: Proc. ER-BPM ’11. (2012) 370–382
- [7] Pinggera, J., Soffer, P., Zugal, S., Weber, B., Weidlich, M., Fahland, D., Reijers, H., Mendling, J.: Modeling Styles in Business Process Modeling. In: Proc. BPMDS ’12. (2012) 151–166
- [8] Claes, J., Vanderfeesten, I., Reijers, H.A., Pinggera, J., Weidlich, M., Zugal, S., Weber, B., Mendling, J., Poels, G., Fahland, D.: Tying Process Model Quality to the Modeling Process: The Impact of Structuring, Movement, and Speed. In: Proc. BPM ’12. (accepted)
- [9] Hoppenbrouwers, S., Proper, H., Weide, T.: A fundamental view on the process of conceptual modeling. In: Proc. ER ’05. (2005) 128–143
- [10] Newell, A., Simon, H.: Human problem Solving. Prentice Hall (1972)
- [11] Petre, M.: Why Looking Isn’t Always Seeing: Readership Skills and Graphical Programming. Commun. ACM (1995) 33–44
- [12] Pinggera, J., Zugal, S., Weber, B.: Investigating the process of process modeling with cheetah experimental platform. In: Proc. ER-POIS’10. (2010) 13–18
- [13] Posner, M.I.: Attention in cognitive neuroscience. In: The cognitive neurosciences. MIT Press (1995) 615–624
- [14] Jacob, R.J.K., Karn, K.S.: Eye Tracking in Human-Computer Interaction and Usability Research: Ready to Deliver the Promises. In: The mind’s eye. Cognitive and applied aspects of eye movement research. Elsevier (2003) 573–603
- [15] Furtner, M., Sachse, P.: The psychology of eye-hand coordination in human computer interaction. In: Proc. HCI ’08. (2008) 144–149
- [16] Rauthmann, J.F., Seubert, C.T., Sachse, P., Furtner, M.: Eyes as windows to the soul: Gazing behavior is related to personality. Journal of Research in Personality 46 (2012) 147–156
- [17] Wolfseher, T., Furtner, M., Sachse, P.: Die Auswirkung auditiver Ablenkung auf die visuelle Informationsverarbeitung. In: Reflexionen und Visionen der Mensch-Maschine-Interaktion - Aus der Vergangenheit lernen, Zukunft gestalten. VDI Verlag (2011) 393–396
- [18] van der Aalst, W., ter Hofstede, A., Kiepuszewski, B., Barros, A.: Workflow patterns. Distributed and Parallel Databases 14 (2003) 5–51
- [19] Crapo, A.W., Waisel, L.B., Wallace, W.A., Willemain, T.R.: Visualization and the process of modeling: a cognitive-theoretic view. In: Proc. KDD ’00. (2000) 218–226
- [20] Ohno, T., Mukawa, N., Yoshikawa, A.: Freegaze: A gaze tracking system for everyday gaze interaction. In: Proc. ETRA ’02. (2002) 125–132
- [21] Mendling, J., Reijers, H.A., Cardoso, J.: What Makes Process Models Understandable? In: Proc. BPM ’07. (2007) 48–63
- [22] Furtner, M., Rauthmann, J.F., Sachse, P.: Investigating word class effects in first and second languages. Perceptual and Motor Skills 113 (2011) 87–97
- [23] Unema, P., Rötting, M.: Differences in eye movements and mental workload between experienced and inexperienced drivers. In: Visual Search. Taylor & Francis (1990) 193–202
- [24] Reijers, H.A., Mendling, J.: A Study into the Factors that Influence the Understandability of Business Process Models. SMCA Part A 41 (2011) 449–462
- [25] Krogstie, J., Sindre, G., Jørgensen, H.: Process models representing knowledge for action: a revised quality framework. EJIS 15 (2006) 91–102
- [26] Becker, J., Rosemann, M., von Uthmann, C.: Guidelines of business process modeling. In: BPM. Volume 1806 of LNCS. Springer (2000) 241–262
- [27] Mendling, J., Reijers, H.A., van der Aalst, W.M.P.: Seven process modeling guidelines (7pmg). Information & Software Technology 52 (2010) 127–136
- [28] Rittgen, P.: Negotiating Models. In: Proc. CAiSE ’07. (2007) 561–573
- [29] Cepeda Porras, G., Guéhéneuc, Y.G.: An empirical study on the efficiency of different design pattern representations in uml class diagrams. Empirical Software Engineering 15 (2010) 493–522
- [30] Nordbotten, J.C., Crosby, M.E.: The effect of graphic style on data model interpretation. Information Systems Journal 9 (1999) 139–155
- [31] Hogrebe, F., Gehrke, N., Nüttgens, M.: Eye Tracking Experiments in Business Process Modeling: Agenda Setting and Proof of Concept. In: Proc. EMISA ’11. (2011) 183–188