Modeling Disordered Materials with a High Throughput ab-initio Approach
Abstract
Predicting material properties of disordered systems remains a long-standing and formidable challenge in rational materials design. To address this issue, we introduce an automated software framework capable of modeling partial occupation within disordered materials using a high-throughput (HT) first principles approach. At the heart of the approach is the construction of supercells containing a virtually equivalent stoichiometry to the disordered material. All unique supercell permutations are enumerated and material properties of each are determined via HT electronic structure calculations. In accordance with a canonical ensemble of supercell states, the framework evaluates ensemble average properties of the system as a function of temperature. As proof of concept, we examine the framework’s final calculated properties of a zinc chalcogenide (ZnS1-xSex), a wide-gap oxide semiconductor (MgxZn1-xO), and an iron alloy (Fe1-xCux) at various stoichiometries.
I Introduction
Crystals are characterized by their regular, repeating structures. Such a description allows us to reduce our focus from the macroscopic material to a microscopic subset of unique atoms and positions. A full depiction of material properties, including mechanical, electronic, and magnetic features, follows from an analysis of this primitive lattice. First principles quantum mechanical calculations have been largely successful in reproducing ground state properties of perfectly ordered crystals DFT ; Hohenberg_PR_1964 . However, such perfection does not exist in nature. Instead, crystals display a degree of randomness, or disorder, in their lattices. There are several types of disorder; including topological, spin, substitutional, and vibrational Elliott_PoAM_1990 . This work focuses on substitutional disorder, in which crystallographically equivalent sites of a crystal are not uniquely or fully occupied. Rather, each site is characterized by a statistical, or partial, occupation. Such disorder is intrinsic in many technologically significant systems, including those used in fuel cells Xie_ACB_2015 , solar cells Kurian_JPCC_2013 , high-temperature superconductors Bednorz_ZPBCM_1986 ; Maeno_Nature_1994 , low thermal conductivity thermoelectrics Winter_JACerS_2007 , imaging and communications devices Patra_JAP_2012 , as well as promising rare-earth free materials for use in free sensors, actuators, energy-harvesters, and spintronic devices Wang_SR_2013 . Hence, a comprehensive computational study of substitutionally disordered materials at the atomic scale is of paramount importance for optimizing key physical properties of materials in technological applications.
Unfortunately, structural parameters with partial occupancy cannot be used directly in first principles calculations—a significant hindrance for computational studies of disordered systems. Therefore, additional efforts must be made to model this disorder. One method relies on the reformulation of the disordered system into an average effective virtual compound, i.e., virtual crystal approximation (VCA) Nord_1931_AP_VCA ; Vanderbilt_2000_PRB_VCA . In the VCA approach, each disordered site is treated as a virtual atom possessing attributes that are the compositional-weighted average of the actual occupants. An advantage of the VCA approach is that the computational cost of a disordered material is comparable to that of an ordered material. However, this approach neglects local distortional effects around the partially occupied sites—obscuring fine features of the overall structure.
An alternative method is the mean-field-type coherent potential approximation (CPA) Soven_PhysRev_1967 , often implemented within the Korringa-Kohn-Rostoker (KKR) Korringa1947392 ; Kohn_1954_PhysRev ; Stocks_PRL_1978 multiple scattering formalism for enhanced model accuracy Faulkner_PM_2006 . This approach simulates interactions between electrons and the potential via propagators (Green’s functions) and approximates the varying potentials of random alloys by introducing an effective medium potential from a perfectly ordered lattice Faulkner_PMS_1982 . Like any mean-field approximation, the CPA description is a single-site approximation and thus unable to resolve short range order effects, such as fine resonance structure in the electronic density of states (DOS).
These approaches, among others Zunger_PRL_1990 ; Shan_PRL_1999 ; Popescu_PRL_2010 , grapple with the legitimacy of attributing electronic band structure properties to random alloys, which exhibit no translational long range order. This work takes a different approach, reformulating the issue into one of a statistical nature. While not all material properties may be garnered through this reformulation, those that are accessible are of significant practical importance, including the DOS, band gap energy Egap, and magnetic moment M.
A rigorous statistical treatment of substitutional disorder at the atomic scale requires utility of large ordered supercells containing a composition consistent with the compound’s stoichiometry Habgood_PCCP_2011 ; Haverkort_ArXiv_2011 . However, the computational cost of such large supercell calculations has traditionally inhibited their use. Fortunately, the emergence of high-throughput (HT) computational techniques nmatHT coupled with the exponential growth of computational power is now allowing the study of disordered systems from first principles MGI_OSTP .
Herein, we present an approach to perform such a treatment working within the HT computational framework AFLOW AFLOW_STANDARD ; aflowPAPER . We highlight three novel and attractive features central to this method: complete implementation into an automatic high throughput framework (optimizing speed without mitigating accuracy), utility of a novel occupancy optimization algorithm, and use of the Universal Force Field method Rappe_1992_JCAS_UFF to reduce the number of DFT calculations needed per system.
II Methodology
This section details the technicalities of representing a partially occupied disordered system as a series of unique supercells. Here is an outline of the approach:
(1) For a given disordered material, optimize its partial occupancy values and determine the size of the derivative superlattices.
(2) (a) Use the superlattice size n to generate a set of unique derivative superlattices and corresponding sets of unique supercells with the required stoichiometry. (b) Import these non-equivalent supercells into the automatic computational framework AFLOW for HT first principles electronic structure calculations.
(3) Obtain and use the relative enthalpy of formation to calculate the equilibrium probability of each supercell as a function of temperature T according to the Boltzmann distribution.
(4) Determine the disordered system’s material properties through ensemble averages of the properties calculated for each supercell. Specifically, we will be calculating the system’s density of states (DOS), band gap energy Egap, and magnetic moment M.
In the following sections, we will refer to a model disordered system, Ag8.733Cd3.8Zr3.267, to illustrate the technical procedures mentioned above. This disordered system has two partially occupied sites: one shared between silver and zirconium, and another shared between cadmium and a vacancy. Working within the AFLOW framework Setyawan_2010_CMS.299 , we have designed a simple structure file for partially occupied systems. Adapted from VASP’s POSCAR VASP_PRB , the PARTCAR contains within it a description of lattice parameters and a list of site coordinates and occupants, along with a concentration tolerance (explained in the next section), and (partial) occupancy values for each site. To see more details about this structure or its PARTCAR, please see the Supplementary Materials.
II.1 Determine superlattice size
In order to fully account for the partial occupancy of the disordered system, we would need to generate a set of superlattices of a size corresponding to the lowest common denominator of the fractional partial occupancy values. With partial occupancy values of 0.733 (733/1000) and 0.267 (267/1000) in the disordered system Ag8.733Cd3.8Zr3.267, we would need to construct superlattices of size 1000. Not only would we be working with correspondingly large supercells (16,000 atoms per supercell in our example), but the number of unique supercells in the set would be substantial. This would extend well beyond the capability of first principles calculations, and thus, is not practical. It is therefore necessary to optimize the partial occupancy values to produce an appropriate superlattice size.
| n´ | Occup. 1 (Ag) | Occup. 2 (Zr) | Occup. 3 (Cd) | n | ||||
| f1 | e1 | f2 | e2 | f3 | e3 | |||
| 1 | 1/1 | 0.267 | 0/1 | 0.267 | 1/1 | 0.2 | 0.267 | 1 |
| 2 | 1/2 | 0.233 | 1/2 | 0.233 | 2/2 | 0.2 | 0.233 | 2 |
| 3 | 2/3 | 0.067 | 1/3 | 0.067 | 2/3 | 0.133 | 0.133 | 3 |
| 4 | 3/4 | 0.017 | 1/4 | 0.017 | 3/4 | 0.05 | 0.05 | 4 |
| 5 | 4/5 | 0.067 | 1/5 | 0.067 | 4/5 | 0 | 0.067 | 5 |
| 6 | 4/6 | 0.067 | 2/6 | 0.067 | 5/6 | 0.033 | 0.067 | 6 |
| 7 | 5/7 | 0.019 | 2/7 | 0.019 | 6/7 | 0.057 | 0.057 | 7 |
| 8 | 6/8 | 0.017 | 2/8 | 0.017 | 6/8 | 0.05 | 0.05 | 4 |
| 9 | 7/9 | 0.044 | 2/9 | 0.044 | 7/9 | 0.022 | 0.044 | 9 |
| 10 | 7/10 | 0.033 | 3/10 | 0.033 | 8/10 | 0 | 0.033 | 10 |
| 11 | 8/11 | 0.006 | 3/11 | 0.006 | 9/11 | 0.018 | 0.018 | 11 |
| 12 | 9/12 | 0.017 | 3/12 | 0.017 | 10/12 | 0.033 | 0.033 | 12 |
| 13 | 10/13 | 0.036 | 3/13 | 0.036 | 10/13 | 0.031 | 0.036 | 13 |
| 14 | 10/14 | 0.019 | 4/14 | 0.019 | 11/14 | 0.014 | 0.019 | 14 |
| 15 | 11/15 | 0.00003 | 4/15 | 0.00003 | 12/15 | 0 | 0.00003 | 15 |
We demonstrate utility of an efficient algorithm to calculate the optimized partial occupancy values and corresponding superlattice size with our example disordered system Ag8.733Cd3.8Zr3.267 in Table I. For convenience, we refer to the algorithm’s iteration step as n´, the superlattice index, and n as the superlattice size. Quite simply, the algorithm iterates, increasing the superlattice index from 1 to n´ until the optimized partial occupancy values reach the required accuracy. At each iteration, we generate a fraction for each partially occupied site, all of which have the common denominator n´. The numerator is determined to be the integer that reduces the overall fraction’s error relative to the actual site’s fractional partial occupancy value. The superlattice size corresponds to the lowest common denominator of the irreducible fractions (e.g. see iteration step 8). The maximum error among all of the sites is chosen to be the accuracy metric for the system.
For the disordered system Ag8.733Cd3.8Zr3.267, given a tolerance of 0.01, the calculated superlattice size is 15 (240 atoms per supercell). By choosing a superlattice with a nearly equivalent stoichiometry as the disordered system, we have reduced our supercell size by over a factor of 60 and entered the realm of feasibility with this calculation.
Quite expectedly, we see that the errors in partial occupancy values calculated for silver and zirconium are the same, as they share the same site. The same holds true for cadmium and its vacant counterpart (not shown). Therefore, the algorithm only needs to determine one choice fraction per site, instead of per occupant (as shown). Such an approach reduces computational costs by guaranteeing that only the smallest supercells (both in number and size) with the lowest tolerable error in composition are funneled into our HT first principles calculation framework.
II.2 Unique supercells generation
With the optimal superlattice size n, the unique derivative superlattices of the disordered system can be generated using Hermite Normal Form (HNF) matrices Gus_2008_PRB_ENUM . Each HNF matrix generates a superlattice of a size corresponding to its determinant, . There exists many HNF matrices with the same determinant, each creating a variant superlattice. For each unique superlattice, we generate a complete set of possible supercells with the required stoichiometry by exploring all possible occupations of partially occupied sites. However, not all of these combinations are unique—nominally warranting an involved structure comparison analysis that becomes extremely time consuming for large supercells Gus_2008_PRB_ENUM . Instead, we identify duplicates by estimating the total energy of each supercell in a HT manner based on the Universal Force Field (UFF) method Rappe_1992_JCAS_UFF . This classical molecular mechanics force field approximates the energy of a structure by considering its composition, connectivity, and geometry, for which parameters have been tabulated. Only supercells with the same total energy are structurally compared and potentially treated as duplicate structures to be discarded, if necessary. The count of duplicate structures determines the degeneracy of the structure. Only non-equivalent supercells are imported into the automatic computational framework AFLOW for HT quantum mechanics.
II.3 Supercell equilibrium probability calculation
The unique supercells representing a partially occupied disordered material are labeled as , , , …, . Their formation enthalpies (per atom) are labeled as , , , …, , respectively. The formation enthalpy of each supercell is automatically calculated from HT first principles calculations using the AFLOW framework AFLOW_STANDARD ; aflowPAPER . We take the supercell with the lowest formation enthalpy as a reference (ground state structure), and denote its formation enthalpy as . The relative formation enthalpy of the ith supercell is calculated as and characterizes its disorder relative to the ground state. The probability of the ith supercell is determined by the Boltzmann factor:
where is the degeneracy of the ith supercell, is the relative formation enthalpy of the ith supercell, is the Boltzmann constant, and T is a virtual “roughness” temperature. T is not a true temperature per se, but instead a parameter describing how much disorder has been statistically explored during synthesis. To elaborate further, we consider two extremes in the ensemble average (ignoring structural degeneracy): 1) neglecting highly disordered structures as , and 2) representing the annealed limit () in which all structures are considered equiprobable. The probability describes the weight of the ith supercell among the thermodynamically equivalent states of the disordered material at equilibrium.
II.4 Ensemble average density of states, band gap energy, and magnetic moment
With the calculated material properties of each supercell and its equilibrium probability in hand, the overall system properties can be determined as ensemble averages of the properties calculated for each supercell. This work focuses on the calculation of the ensemble average density of states (DOS), band gap energy Egap, and magnetic moment M. The DOS of the ith supercell is labeled as (E) and indicates the number of electronic states per energy interval. The ensemble average DOS of the system is then determined by the following formula:
Additionally, a band gap can be extracted from the DOS of each supercell. In this fashion, an ensemble average band gap Egap can be calculated for the system. It is important to note that standard density functional theory (DFT) calculations are limited to a description of the ground state DFT ; Hohenberg_PR_1964 . Subsequently, calculated excited state properties may contain substantial errors. In particular, DFT tends to underestimate the band gap Perdew_IJQC_1985 . Despite these known hindrances in the theory, we demonstrate in the next section that our framework is capable of predicting significant trends specific to the disordered systems. As a bonus, the calculation of these results are performed in a high-throughput fashion. It is expected that a more accurate, fine-grained description of the electronic structure in such systems will be obtained through a combination of our software framework and more advanced first principles approaches GW ; Hedin_GW_1965 ; Heyd2003 ; Liechtenstein1995 ; curtarolo:art86 ; curtarolo:art93 ; curtarolo:art103 .
In the same spirit as the N and Egap, we consider the calculation of the ensemble average magnetic moment M of the system. The magnetic moment of the ith supercell is labeled as . If the ground state of the ith structure is non-spin-polarized, then its magnetic moment is set to zero, i.e., . Taking into account the impact of signed spins on the ensemble average, this approach is limited only to ferromagnetic solutions. Additionally, as an initialization for the self-consistent run, we assume the same ferromagnetic alignment among all of the spins in the system (an AFLOW calculation standard) AFLOW_STANDARD . Finally, the ensemble average magnetic moment of the system is calculated with the following formula:
III Example applications
To illustrate the effectiveness of our approach, we analyze disordered systems of technological importance: zinc chalcogenides, wide-gap oxide semiconductors, and iron alloys. Unless otherwise stated, the supercells used in our calculations were generated with the lowest superlattice size needed to represent the composition exactly.
III.1 Zinc chalcogenides
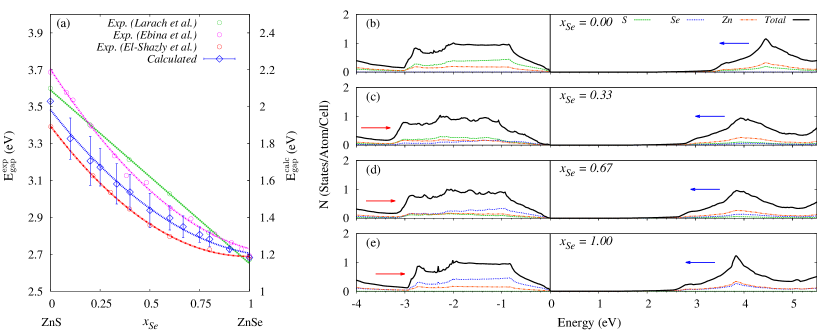
Over the years, zinc chalcogenides have garnered interest for a dynamic range of applications—beginning with the creation of the first blue-light emitting laser diodes Haase_APL_1991 , and recently have been studied as inorganic graphene analogues (IGAs) with potential applications in flexible and transparent nanodevices Sun_NComm_2012 . These wide-gap II-VI semiconductors have demonstrated a smoothly tunable band gap energy Egap with respect to composition Larach_PR_1957 ; Ebina_PRB_1974 ; El-Shazly_APA_1985 . Both linear and quadratic dependencies have been observed, with the latter phenomenon referred to as optical bowing Bernard_PRB_1986 . Specifically, given the pseudo-ternary system AxB1-xC,
with characterizing the bowing. While Larach et al. reported a linear dependence () Larach_PR_1957 , Ebina et al. Ebina_PRB_1974 and El-Shazly et al. El-Shazly_APA_1985 reported similar bowing parameters of eV and eV, respectively, averaged over the two observed direct transitions.
As a proof of concept, we utilized our developed disordered system framework to calculate the compositional dependence of the Egap and DOS for ZnS1-xSex at room temperature (annealed limit). Overall, this system shows relatively low disorder ( eV), exhibiting negligible variations in the ensemble average properties at higher temperatures. These results, illustrated in Fig. 1, are directly compared against experimental measurements Larach_PR_1957 ; Ebina_PRB_1974 ; El-Shazly_APA_1985 . Common among all three trends (Fig. 1(a)) is the Egap shrinkage with increasing , as well as a near tunable Egap range. Our calculated trend demonstrates a non-zero bowing similar to that observed by both Ebina et al. Ebina_PRB_1974 and El-Shazly et al. El-Shazly_APA_1985 . A fit shows a bowing parameter of eV, lying in the range between the two experimental bowing parameters.
We also plot the ensemble average DOS plots at room temperature for (), (), (), and () in Figs. 1(b)-1(e). The plots echo the negatively correlated band gap relationship illustrated in Fig. 1(a), highlighting that the replacement of sulfur with selenium atoms reduces the band gap. Specifically, we observe two phenomena as we increase the concentration of selenium: (red arrows) the reduction of the valence band width (with the exception of (ZnS) concentration), and (blue arrows) a shift of the conduction band peak back towards the Fermi energy. The valence band of ZnS more closely resembles that of its extreme concentration counterpart at (ZnSe) than the others. The extreme concentration conduction peaks appear more defined than their intermediate concentration counterparts, which is likely an artifact of the ensemble averaging calculation.
Finally, we consider a partial-DOS analysis in both species and orbitals (not shown). In the valence band, sulfur and selenium account for the majority of the states, in agreement with their relative concentrations. Meanwhile, zinc accounts for the majority of the states in the conduction band at all concentrations. Correspondingly, at all concentrations, the -orbitals make up the majority of the valence band, whereas the conduction band consists primarily of - and -orbitals. These observations are consistent with conclusions drawn from previous optical reflectivity measurements that optical transitions are possible from sulfur or selenium valence bands to zinc conduction bands Kirschfeld_PRL_1972 .
Overall, our concentration-evolving Egap trend and DOS plots support a continuing line of work Larach_PR_1957 ; Ebina_PRB_1974 ; El-Shazly_APA_1985 corroborating that this system is of the amalgamation type Onodera_JPSJ_1968 and not of the persistence type Kirschfeld_PRL_1972 . Notably, however, reflectivity spectra shows that the peak position in the Egap for ZnS rich alloys may remain stationary Ebina_PRB_1974 , which may have manifested itself in the aforementioned anomaly observed in this structure’s valence band width.
III.2 Wide-gap oxide semiconductor alloys
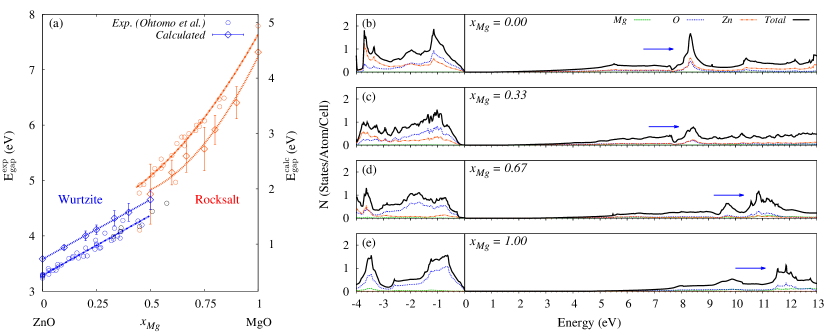
Zinc oxide (ZnO) has proven to be a pervasive material, with far reaching applications such as paints, catalysts, pharmaceuticals (sun creams), and optoelectronics Takeuchi_MgZnO_Patent . It has long been investigated for its electronic properties, and falls into the class of transparent conducting oxides Ellmer_ZnO_2007 . Just as our previous zinc chalcogenide example, ZnO is a wide-gap II-VI semiconductor that has demonstrated a smoothly tunable band gap energy Egap with composition. In particular, ZnO has been engineered to have an Egap range as large as 5 eV by synthesizing it with magnesium. This pairing has been intensively studied because of the likeness in ionic radius between zinc and magnesium which results in mitigated misfit strain in the heterostructure Yoo_TSF_2015 . While the solubility of MgO and ZnO is small, synthesis has been made possible throughout the full compositional spectrum Ohtomo_SST_2005 ; Takeuchi_JAP_2003 ; Chen_JAPCM_2003 ; Takagi_JJAP_2003 ; Choopun_APL_2002 ; Minemoto_TSF_2000 ; Sharma_APL_1999 ; Ohtomo_APL_1998 .
As another proof of concept, we model the compositional dependence of the Egap and DOS for MgxZn1-xO at room temperature (annealed limit). In particular, we chose this disordered system to illustrate the breath of materials which this framework can model. Similar to ZnS1-xSex, this system shows relatively low disorder ( eV), exhibiting negligible variations in the ensemble average properties at higher temperatures. We compare our results to that observed empirically Ohtomo_SST_2005 ; Takeuchi_JAP_2003 ; Chen_JAPCM_2003 ; Takagi_JJAP_2003 ; Choopun_APL_2002 ; Minemoto_TSF_2000 ; Sharma_APL_1999 ; Ohtomo_APL_1998 in Fig. 2. As illustrated in Fig. 2(a), Ohtomo et al. observed a composition dependent phase transition from a wurtzite to a rocksalt structure with increasing ; the transition occurring around the mid concentrations. We mimic this transition in our calculations. Empirically, the overall trend in the wurtzite phase shows a negligible bowing in the Egap trend, contrasting the significant bowing observed in the rocksalt phase. We note that the wurtzite phase Egap trend shows a slope of eV, while the rocksalt phase shows a bowing parameter of eV. Calculated trends are shown in Fig. 2(a). Qualitatively, we also observe linear and non-linear Egap trends in the wurtzite and rocksalt phases, respectively. The fits were as follows: we observe a slope of eV in the wurtzite phase and a bowing parameter of eV in the rocksalt phase. These trends match experiment well within the margins of error. We observe a larger margin of error in the rocksalt phase, particular in the phase separated region (). This may be indicative of the significant shear strain and complex nucleation behavior characterizing the region Takeuchi_JAP_2003 .
We also plot the ensemble average DOS at room temperature for (), (), (), and () in Figs. 2(b)-2(e). The plots not only echo the positively correlated band gap relationship illustrated in Fig. 2(a), but exhibit the aforementioned change from a linear to non-linear trend. This is most easily seen by observing the shift in the conduction band toward the Fermi energy, highlighted by the blue arrows. Contrasting ZnS1-xSex, we do not observe a significant change in width of the valence band as we vary the stoichiometry.
Finally, we consider a partial-DOS analysis in both species and orbitals (not shown). Overall, the constant oxygen backbone plays a major role in defining the shape of both the valence and conduction bands, particularly as increases. This resonates with the strong -orbital presence in both bands throughout all concentrations. Zinc and its -orbitals play a particularly dominant role in the valence band in magnesium-poor structures.
III.3 Iron alloys
Despite its ubiquity, iron remains at the focus of critical materials research. Even as new phenomena are discovered with an ever-growing effort to explore extreme conditions Bonetti_PRL_1999 ; Shimizu_Nature_2001 ; Bose_PRB_2003 , there exist long-standing, interesting aspects that are not fully resolved. This includes the magnetic character of the (fcc) -Fe phase at low temperatures Gorria_PRB_2004 ; Abrahams_PR_1962 ; Sandratskii_AP_1998 , among other complexities in its magnetic phase diagram Pepperhoff_Fe_2013 . One popular approach to studying the -Fe phase is through the Fe1-xCux disordered alloy Gorria_PRB_2004 ; Gorria_PRB_2005 ; Orecchini_JAC_2006 . Nominally, unary copper and iron metals with fcc structures are nonmagnetic, but together exhibit ferromagnetic ordering with very high magnetic moments. This observation has led to identification of Invar and anti-Invar behaviors, which may pave the way to enhanced thermomechanical actuators Gorria_PRB_2004 ; Gorria_PRB_2005 . Fe1-xCux is an interesting structure in its own right, as it has extremely low miscibility Liu_PRB_2005 . Overcoming the hurdle of developing metastable structures throughout the full compositional range has been the focus of much research Ma_PMS_2005 . Such metastable structures have demonstrated novel properties like high thermal and electrical conductivity Korn_ZPBCM_1976 , magnetoresistance, and coercivity Hihara_JJap_1997 .
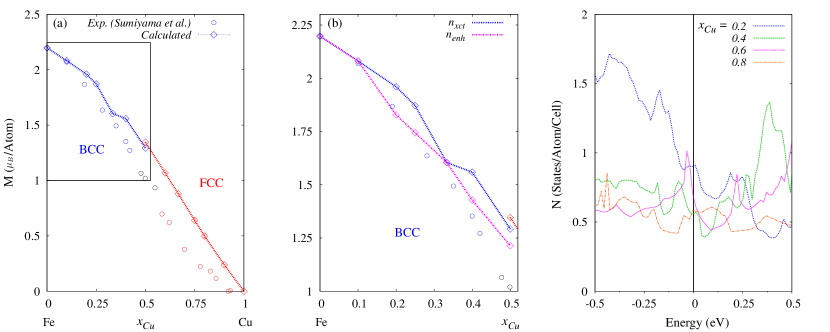
As a final proof of concept, we model the compositional dependence of the magnetic moment M for Fe1-xCux at K for direct comparison against experimental results Sumiyama_JPSJ_1984 . Considering both the sensitivity of magnetic properties to temperature as well as the significant disorder exhibited in this system ( eV), we limit our analysis to the low temperature limit. This is also where we expect our framework to perform optimally, which considers structures relaxed at zero temperature and pressure AFLOW_STANDARD . The results are illustrated in Fig. 3. Sumiyama et al. shows that the disordered system’s phase is concentration dependent, with a phase transition from bcc to fcc in the mid concentrations as increases. Just as with MgxZn1-xO, we mimic these observations in our calculation. The overall decreasing trend in M with reduced in Fig. 3(a) matches our expectations well.
With such a simple system, we also explored whether an augmented superlattice size enhances our results. While the concentration remains constant for above that which is needed for the desired concentration , more structures are introduced into the ensemble average. The structures themselves also increase in size by a factor of relative to their parent structure. For , we simply doubled (), while we tripled for (). With only two two-atom structures needed to describe at , we were able to increase by a factor of five () without compromising the feasibility of the calculation. A comparison of results calculated at is shown in Fig. 3(b). At most concentrations, we observed substantial improvements as our calculated trend more closely follows that which was observed empirically.
Finally, we consider this system’s ensemble average DOS in Fig. 3(c). In general, the DOS near the Fermi energy decreases with increasing , with some instability near the mixed phase regions. This can be understood using the Stoner criterion model for transitional metals Xie_CMS_2011 ; James_PRB_1999 . Namely, ferromagnetism appears when the gain in exchange energy is larger than the loss in kinetic energy. A larger DOS at the Fermi energy induces a higher exchange energy and favors a split into the ferromagnetic state. The competition between ferromagnetic and paramagnetic phases can be inferred from the decreasing M trend as depicted in Fig. 3(a).
IV Additional Materials
The automated approach to model disordered systems discussed here is implemented with the AFLOW framework AFLOW_STANDARD ; aflowPAPER and can be downloaded from http://aflowlib.org.
V Conclusion
In this work, we have introduced a software framework capable of modeling substitutionally disordered materials. Specifically, the framework delivers high value properties of disordered systems, including the density of states (DOS), band gap energy Egap, and magnetic moment M. Though a number of technologically significant examples, we have illustrated the prowess of this highly efficient and convenient framework. Such materials that exhibit highly tunable properties are of critical importance toward the goal of rational materials design. Without loss of feasibility or accuracy, the framework exploits highly successful high-throughput first principles approaches in more complex, real-world systems.
Acknowledgements.
We thank C. Toher, M. Buongiorno Nardelli, and M. Fornari for various technical discussions that have contributed to the results reported in this article. This work was supported by ONR-MURI under Contract N00014-13-1-0635, DOD ONR (N00014-14-1-0526), and the Duke University Center for Materials Genomics. K. Yang acknowledges the support by start-up funds from the University of California San Diego. C. Oses acknowledges support from the National Science Foundation Graduate Research Fellowship under Grant No. DGF1106401. We also acknowledge the CRAY corporation for computational support.References
- (1) W. Kohn and L. J. Sham, Self-consistent equations including exchange and correlation effects, Phys. Rev. 140, A1133 (1965).
- (2) P. Hohenberg and W. Kohn, Inhomogeneous Electron Gas, Phys. Rev. 136, B864–B871 (1964).
- (3) S. R. Elliott, Physics of Amorphous Materials (Longman Scientific & Technical, 1990).
- (4) L. Xie, P. Brault, C. Coutanceau, J. Bauchire, A. Caillard, S. Baranton, J. Berndt, and E. C. Neyts, Efficient amorphous platinum catalyst cluster growth on porous carbon: A combined molecular dynamics and experimental study, Appl. Catal. B: Environ. 162, 21–26 (2015).
- (5) S. Kurian, H. Seo, and H. Jeon, Significant Enhancement in Visible Light Absorption of TiO2 Nanotube Arrays by Surface Band Gap Tuning, J. Phys. Chem. C 117, 16811–16819 (2013).
- (6) J. G. Bednorz and K. A. Müller, Possible high Tc superconductivity in the BaLaCuO system, Z. Phys. B Con. Mat. 64, 189–193 (1986).
- (7) Y. Maeno, H. Hashimoto, K. Yoshida, S. Nishizaki, T. Fujita, J. G. Bednorz, and F. Lichtenberg, Superconductivity in a layered perovskite without copper, Nature 372, 532–534 (1994).
- (8) M. R. Winter and D. R. Clarke, Oxide Materials with Low Thermal Conductivity, J. Am. Ceram Soc. 90, 533–540 (2007).
- (9) N. C. Patra, S. Bharatan, J. Li, M. Tilton, and S. Iyer, Molecular beam epitaxial growth and characterization of InSb1−-xNx on GaAs for long wavelength infrared applications, J. Appl. Phys. 111 (2012).
- (10) H. Wang, Y. N. Zhang, R. Q. Wu, L. Z. Sun, D. S. Xu, and Z. D. Zhang, Understanding strong magnetostriction in Fe100−-xGax alloys, Sci. Rep. 3 (2013).
- (11) L. Nordheim, Zur Elektronentheorie der Metalle I, Ann. Phys. (Leipzig) 9, 607–640 (1931).
- (12) L. Bellaiche and D. Vanderbilt, Virtual crystal approximation revisited: Application to dielectric and piezoelectric properties of perovskites, Phys. Rev. B 61, 7877–7882 (2000).
- (13) P. Soven, Coherent-Potential Model of Substitutional Disordered Alloys, Phys. Rev. 156, 809–813 (1967).
- (14) J. Korringa, On the calculation of the energy of a Bloch wave in a metal, Physica 13, 392–400 (1947).
- (15) W. Kohn and N. Rostoker, Solution of the Schrödinger Equation in Periodic Lattices with an Application to Metallic Lithium, Phys. Rev. 94, 1111–1120 (1954).
- (16) G. M. Stocks, W. M. Temmerman, and B. L. Gyorffy, Complete Solution of the Korringa-Kohn-Rostoker Coherent-Potential-Approximation Equations: Cu-Ni Alloys, Phys. Rev. Lett. 41, 339–343 (1978).
- (17) J. S. Faulkner, S. Pella, A. Rusanu, Y. Puzyrev, T. Leventouri, G. M. Stocks, and B. Ujfalussy, Mean-field approximations for the electronic states in disordered alloys, Philos. Mag. 86, 2661–2671 (2006).
- (18) J. S. Faulkner, The modern theory of alloys, Prog. Mater. Sci. 27, 1–187 (1982).
- (19) A. Zunger, S.-H. Wei, L. G. Ferreira, and J. E. Bernard, Special quasirandom structures, Phys. Rev. Lett. 65, 353–356 (1990).
- (20) W. Shan, W. Walukiewicz, J. W. Ager, E. E. Haller, J. F. Geisz, D. J. Friedman, J. M. Olson, and S. R. Kurtz, Band Anticrossing in GaInNAs Alloys, Phys. Rev. Lett. 82, 1221–1224 (1999).
- (21) V. Popescu and A. Zunger, Effective Band Structure of Random Alloys, Phys. Rev. Lett. 104, 236403 (2010).
- (22) M. Habgood, R. Grau-Crespo, and S. L. Price, Substitutional and orientational disorder in organic crystals: a symmetry-adapted ensemble model, Phys. Chem. Chem. Phys. 13, 9590–9600 (2011).
- (23) M. W. Haverkort, I. S. Elfimov, and G. A. Sawatzky, Electronic structure and self energies of randomly substituted solids using density functional theory and model calculations, arXiv:1109.4036v1 [cond-mat.mtrl-sci] (2011).
- (24) S. Curtarolo, G. L. W. Hart, M. Buongiorno Nardelli, N. Mingo, S. Sanvito, and O. Levy, The high-throughput highway to computational materials design, Nat. Mater. 12, 191–201 (2013).
-
(25)
Office of Science and Technology Policy, White House, Materials Genome
Initiative for Global Competitiveness,
http://www.whitehouse.gov/mgi (2011). - (26) C. E. Calderon, J. J. Plata, C. Toher, C. Oses, O. Levy, M. Fornari, A. Natan, M. J. Mehl, G. Hart, M. Buongiorno Nardelli, and S. Curtarolo, The AFLOW standard for high-throughput materials science calculations, Comp. Mat. Sci. 108, Part A, 233–238 (2015).
- (27) S. Curtarolo, W. Setyawan, G. L. W. Hart, M. Jahnatek, R. V. Chepulskii, R. H. Taylor, S. Wang, J. Xue, K. Yang, O. Levy, M. Mehl, H. T. Stokes, D. O. Demchenko, , and D. Morgan, AFLOW: an automatic framework for high-throughput materials discovery, Comp. Mat. Sci. 58, 218–226 (2012).
- (28) A. K. Rappe, C. J. Casewit, K. S. Colwell, W. A. Goddard, and W. M. Skiff, UFF, a full periodic table force field for molecular mechanics and molecular dynamics simulations, J. Am. Chem. Soc. 114, 10024–10035 (1992).
- (29) W. Setyawan and S. Curtarolo, High-throughput electronic band structure calculations: Challenges and tools, Comp. Mat. Sci. 49, 299–312 (2010).
- (30) G. Kresse and J. Furthmüller, Efficient iterative schemes for ab initio total-energy calculations using a plane-wave basis set, Phys. Rev. B 54, 11169–11186 (1996).
- (31) G. L. W. Hart and R. W. Forcade, Algorithm for generating derivative structures, Phys. Rev. B 77, 224115 (2008).
- (32) J. P. Perdew, Density functional theory and the band gap problem, Int. J. Quantum. Chem. 28, 497–523 (1985).
- (33) F. Aryasetiawan and O. Gunnarsson, The GW Method, Rep. Prog. Phys. 61, 237 (1998).
- (34) L. Hedin, New Method for Calculating the One-Particle Green’s Function with Application to the Electron-Gas Problem, Phys. Rev. 139, A796–A823 (1965).
- (35) J. Heyd, G. E. Scuseria, and M. Ernzerhof, Hybrid functionals based on a screened Coulomb potential, J. Chem. Phys. 118, 8207–8215 (2003).
- (36) A. I. Liechtenstein, V. I. Anisimov, and J. Zaanen, Density-functional theory and strong interactions: Orbital ordering in Mott-Hubbard insulators, Phys. Rev. B 52, R5467–R5470 (1995).
- (37) L. A. Agapito, A. Ferretti, A. Calzolari, S. Curtarolo, and M. Buongiorno Nardelli, Effective and accurate representation of extended Bloch states on finite Hilbert spaces, Phys. Rev. B 88, 165127 (2013).
- (38) L. A. Agapito, S. Curtarolo, and M. B. Nardelli, Reformulation of DFT+ as a pseudo-hybrid Hubbard density functional, Phys. Rev. X 5, 011006 (2015).
- (39) P. Gopal, M. Fornari, S. Curtarolo, L. A. Agapito, L. Liyanage, and M. Buongiorno Nardelli, Improved predictions of the physical properties of Zn- and Cd-based wide band-gap semiconductors: a validation of the ACBN0 functional, Phys. Rev. B 91, 245202 (2015).
- (40) S. Larach, R. E. Shrader, and C. F. Stocker, Anomalous Variation of Band Gap with Composition in Zinc Sulfo- and Seleno-Tellurides, Phys. Rev. 108, 587–589 (1957).
- (41) A. Ebina, E. Fukunaga, and T. Takahashi, Variation with composition of the and gaps in alloys, Phys. Rev. B 10, 2495–2500 (1974).
- (42) A. A. El-Shazly, M. M. H. El-Naby, M. A. Kenawy, M. M. El-Nahass, H. T. El-Shair, and A. M. Ebrahim, Optical properties of ternary ZnSxSe1-−x polycrystalline thin films, Appl. Phys. A Mater. Sci. Process. 36, 51–53 (1985).
- (43) M. A. Haase, J. Qiu, J. M. DePuydt, and H. Cheng, Blue-green laser diodes, Appl. Phys. Lett. 59, 1272–1274 (1991).
- (44) Y. Sun, Z. Sun, S. Gao, H. Cheng, Q. Liu, J. Piao, T. Yao, C. Wu, S. Hu, S. Wei, and Y. Xie, Fabrication of flexible and freestanding zinc chalcogenide single layers, Nat. Commun. 3, 1057 (2012).
- (45) J. E. Bernard and A. Zunger, Optical bowing in zinc chalcogenide semiconductor alloys, Phys. Rev. B 34, 5992–5995 (1986).
- (46) K. E. Kirschfeld, N. Nelkowski, and T. S. Wagner, Optical Reflectivity and Band Structure of Mixed Crystals, Phys. Rev. Lett. 29, 66–68 (1972).
- (47) Y. Onodera and Y. Toyozawa, Persistence and Amalgamation Types in the Electronic Structure of Mixed Crystals, J. Phys. Soc. Jpn. 24, 341–355 (1968).
- (48) A. Ohtomo and A. Tsukazaki, Pulsed laser deposition of thin films and superlattices based on ZnO, Semicond. Sci. Tech. 20, S1 (2005).
- (49) I. Takeuchi, W. Yang, K.-S. Chang, M. A. Aronova, T. Venkatesan, R. D. Vispute, and L. A. Bendersky, Monolithic multichannel ultraviolet detector arrays and continuous phase evolution in MgxZn1-−xO composition spreads, Journal of Applied Physics 94, 7336–7340 (2003).
- (50) J. Chen, W. Z. Shen, N. B. Chen, D. J. Qiu, and H. Z. Wu, The study of composition non-uniformity in ternary MgxZn1-−xO thin films, J. Phys.: Conden. Matt. 15, L475 (2003).
- (51) T. Takagi, H. Tanaka, S. Fujita, and S. Fujita, Molecular Beam Epitaxy of High Magnesium Content Single-Phase Wurzite MgxZn1-−xO Alloys () and Their Application to Solar-Blind Region Photodetectors, Jpn. J. Appl. Phys 42, L401 (2003).
- (52) S. Choopun, R. D. Vispute, W. Yang, R. P. Sharma, T. Venkatesan, and H. Shen, Realization of band gap above 5.0 eV in metastable cubic-phase MgxZn1-−xO alloy films, Appl. Phys. Lett. 80, 1529–1531 (2002).
- (53) T. Minemoto, T. Negami, S. Nishiwaki, H. Takakura, and Y. Hamakawa, Preparation of Zn1-−xMgxO films by radio frequency magnetron sputtering, Thin Solid Films 372, 173–176 (2000).
- (54) A. K. Sharma, J. Narayan, J. F. Muth, C. W. Teng, C. Jin, A. Kvit, R. M. Kolbas, and O. W. Holland, Optical and structural properties of epitaxial MgxZn1-−xO alloys, Appl. Phys. Lett. 75, 3327–3329 (1999).
- (55) A. Ohtomo, M. Kawasaki, T. Koida, K. Masubuchi, H. Koinuma, Y. Sakurai, Y. Yoshida, T. Yasuda, and Y. Segawa, MgxZn1-−xO as a II-VI widegap semiconductor alloy, Appl. Phys. Lett. 72, 2466–2468 (1998).
- (56) I. Takeuchi, W. Yang, K. S. Chang, R. D. Vispute, and T. V. Venkatesan, System and method of fabrication and application of thin-films with continuously graded or discrete physical property parameters to functionally broadband monolithic microelectronic optoelectronic/sensor/actuator device arrays (2007). US Patent 7,309,644.
- (57) K. Ellmer, A. Klein, and B. Rech, Transparent Conductive Zinc Oxide: Basics and Applications in Thin Film Solar Cells, Springer Series in Materials Science (Springer Berlin Heidelberg, 2007).
- (58) S. J. Yoo, J.-H. Lee, C.-Y. Kim, C. H. Kim, J. W. Shin, H. S. Kim, and J.-G. Kim, Direct observation of the crystal structure changes in the MgxZn1-−xO alloy system, Thin Solid Films 588, 50–55 (2015).
- (59) K. Sumiyama, T. Yoshitake, and Y. Nakamura, Magnetic Properties of Metastable bcc and fcc Fe-Cu Alloys Produced by Vapor Quenching, J. Phys. Soc. Jpn. 53, 3160–3165 (1984).
- (60) E. Bonetti, L. D. Bianco, D. Fiorani, D. Rinaldi, R. Caciuffo, and A. Hernando, Disordered Magnetism at the Grain Boundary of Pure Nanocrystalline Iron, Phys. Rev. Lett. 83, 2829–2832 (1999).
- (61) K. Shimizu, T. Kimura, S. Furomoto, K. Takeda, K. Kontani, Y. Onuki, and K. Amaya, Superconductivity in the non-magnetic state of iron under pressure, Nature 412, 316–318 (2001).
- (62) S. K. Bose, O. V. Dolgov, J. Kortus, O. Jepsen, and O. K. Andersen, Pressure dependence of electron-phonon coupling and superconductivity in hcp Fe: A linear response study, Phys. Rev. B 67, 214518 (2003).
- (63) P. Gorria, D. Martínez-Blanco, J. A. Blanco, A. Hernando, J. S. Garitaonandia, L. F. Barquín, J. Campo, and R. I. Smith, Invar effect in fcc-FeCu solid solutions, Phys. Rev. B 69, 214421 (2004).
- (64) S. C. Abrahams, L. Guttman, and J. S. Kasper, Neutron Diffraction Determination of Antiferromagnetism in Face-Centered Cubic () Iron, Phys. Rev. 127, 2052–2055 (1962).
- (65) L. M. Sandratskii, Noncollinear magnetism in itinerant-electron systems: Theory and applications, Adv. Phys. 47, 91–160 (1998).
- (66) W. Pepperhoff and M. Acet, Constitution and Magnetism of Iron and its Alloys, Engineering Materials (Springer Berlin Heidelberg, 2001).
- (67) P. Gorria, D. Martínez-Blanco, J. A. Blanco, M. J. Pérez, A. Hernando, L. F. Barquín, and R. I. Smith, High-temperature induced ferromagnetism on precipitates in FeCu solid solutions, Phys. Rev. B 72, 014401 (2005).
- (68) A. Orecchini, F. Sacchetti, C. Petrillo, P. Postorino, A. Congeduti, C. Giorgetti, F. Baudelet, and G. Mazzone, Magnetic states of iron in metastable fcc Fe-Cu alloys, J. Alloys Compound. 424, 27–32 (2006).
- (69) J. Z. Liu, A. van de Walle, G. Ghosh, and M. Asta, Structure, energetics, and mechanical stability of Fe-Cu bcc alloys from first-principles calculations, Phys. Rev. B 72, 144109 (2005).
- (70) E. Ma, Alloys created between immiscible elements, Prog. Mater. Sci. 50, 413–509 (2005).
- (71) D. Korn, H. Pfeifle, and J. Niebuhr, Electrical resistivity of metastable copper-iron solid solutions, Z. Phys. B Con. Mat. 23, 23–26 (1976).
- (72) T. Hihara, Y. Xu, T. J. Konno, K. Sumiyama, H. Onodera, K. Wakoh, and K. Suzuki, Microstructure and Giant Magnetoresistance in Fe-Cu Thin Films Prepared by Cluster-Beam Deposition, Jpn. J. Appl. Phys 36, 3485 (1997).
- (73) Y.-P. Xie and S.-J. Zhao, The energetic and structural properties of bcc NiCu, FeCu alloys: A first-principles study, Comp. Mat. Sci. 50, 2586–2591 (2011).
- (74) P. James, O. Eriksson, B. Johansson, and I. A. Abrikosov, Calculated magnetic properties of binary alloys between Fe, Co, Ni, and Cu, Phys. Rev. B 59, 419–430 (1999).