Backward Propagating Acoustic Waves in Single Gold Nanobeams
Abstract
Femtosecond pump-probe spectroscopy has been carried out on suspended gold nanostructures with a rectangular cross section lithographed on a silicon substrate. With a thickness fixed to and a width ranging from to , size dependent measurements are used to distinguish which confined acoustic modes are detected. Furthermore, in order to avoid any ambiguity due to the measurement uncertainties on both the frequency and size, pump and probe beams are also spatially shifted to detect guided acoustic phonons. This leads us to the observation of backward propagating acoustic phonons in the gigahertz range () in such nanostructures. While backward wave propagation in elastic waveguides has been predicted and already observed at the macroscale, very few studies have been done at the nanoscale. Here, we show that these backward waves can be used as the unique signature of the width dilatational acoustic mode.
Probing the elasticity at the nanoscale is a challenge that led a wide community to study confined acoustic modes of nano-objects in the - range using time-resolved pump-probe experimentsCrut et al. (2015). In such an approach, acoustic modes are excited by the absorption of a femtosecond laser pulse and detected in transmissionJuvé et al. (2010); van Dijk et al. (2005) or reflectivity geometry in nearSiry et al. (2003); Vertikov et al. (1996) or farGuillet et al. (2009); Bienville et al. (2006) field by the induced change in the material optical properties. As ensemble studies result in inhomogeneous broadening of the acoustic featuresKelf et al. (2011); Del Fatti et al. (1999), single particle spectroscopy has been considered to circumvent this drawback and to clarify the acoustic responseStaleva and Hartland (2008); Zijlstra et al. (2008); van Dijk et al. (2005). However, the strong damping at these extremely high frequencies has led several groups to isolate the nanoresonators from their substrate to avoid energy leaking through the nano-object-substrate contactMajor et al. (2013); Belliard et al. (2013); Ristow et al. (2013). These breakthroughs have made possible the observation of an other source of acoustic energy leaks. Indeed, it has been proven that acoustic phonons are also guided along the nano-objectsJean et al. (2014); Mante et al. (2013). Other major developments illustrate the possibility to use nano-objects as nanoscale acoustic transducers for hypersonic wave imagingAmziane et al. (2011). Non destructive imaging with nanometric resolution in both depth and lateral direction is now one step ahead.
Furthermore, there is a recent and growing interest in both the electromagnetic and acoustic wave communities for materials and waveguides that exhibit backward propagating wavesVeselago and Narimanov (2006). In backward waves, the phase velocity describing the propagation of individual wave fronts in a wave packet and the energy flux of the wave, characterized by the Poynting vector are anti-parallel. This anti-parallel propagation constitutes the definition of a negative index material and opens the way to a large variety of intriguing physical phenomenaVeselago (1968). There now exist multiple experimental evidences of this effect, and applications of negative index materials for electromagnetic waves have already been conceivedParazzoli et al. (2004). The possibility of such backward wave motion in elastic waveguides has been revealed by the early work of LambLamb (1904). Many different elastic waveguides such as cylindersMeitzler (1965) or surface acoustic wavesMaznev and Every (2009) can also exhibit backward wave motion. Recently, negative refraction and focusing of elastic Lamb waves have been investigated but are still confined to the low-MHz rangePhilippe et al. (2015); Bramhavar et al. (2011). In this letter we provide evidence of backward wave propagation in one-dimensional elastic waveguide in the gigahertz range. We use time-resolved pump-probe spectroscopy with spatially shifted pump and probe beams to excite and detect the backward wave motion. As a first application, unambiguous mode identification using backward wave propagation is investigated.
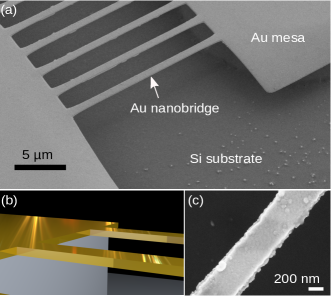
In order to study guided modes in one dimensional elastic waveguides, gold nanostructures with a rectangular cross section are conceived (Fig.1). Their thickness, , is fixed to and their width, , ranges from to . As shown in Fig.1(a), the gold stripes are connected to large mesas at both ends. To reduce the influence of the silicon substrate on the elastic confinement, the gold nanostructures are suspended several micrometers above the substrate as illustrated in Fig.1(b). This geometry results in what we call “gold nanobeams”. All boundaries are thus mechanically free. As their length is greater than , they are considered as infinitely long and the fixed boundary conditions at the extremities can be neglected. The samples are fabricated by electronic lithography coupled with anisotropic wet etching on silicon substrates. To prepare these structures, single face polished Si(001) substrates are used. First, an electronic resist (PMMA-950K-A6) is spin coated on the Si wafer surface. The exposition is made at 20kV using a Zeiss Supra scanning electron microscope equipped with a Raith Elphy Quantum module. After being developed, rinsed with water and blown dry, the sample is coated with of chromium to improve the adhesion, followed by a thick gold layer. Then, a lift-off process in aceton with careful ultrasonic agitation is performed to delimit the future gold nanobeams. Finally, the sample is dipped in a hot KOH solution to partially etch the Si substrate and free the desired gold nanobeams. This quick anisotropic Si etching process leads to the formation of suspended gold nanobeams between two big gold pads. The key point of this proces is that the main axis of the beams has been rotated with respect to the direction of Si substrates to allow this underetching.

Our experimental setup working in reflection geometry was described in detail elsewhereBienville et al. (2006). Ultrafast pump-probe spectroscopy experiments are performed using a mode-locked Ti:sapphire (MAI-TAI Spectra) laser source operating at with a pulse duration below at the laser output and a repetition rate of . Synchronous detection on the sample reflectivity is performed by modulating the pump beam at . Both pump and probe beams are focused by means of a microscope objective with a and are normally incident on the sample. The laser spots can be focused around diameter at . A telescope is fixed on a XY piezoelectric stage such that the probe beam is laterally positioned with respect to the fixed pump beam. A two-color experiment is performed by doubling the pump frequency () with a nonlinear cystal (BBO) to avoid scattered light coming from the pump beam. A dichroic filter located in front of the diode system suppresses the light of the pump beam, its power is reduced around and the power of the probe beam does not exceed .
Such experimental conditions place us in the thermoelastic regime and the acoustic signal and optical reflectivity remain stable during all the average processing. The reflectivity from the sample is measured by an avalanche photodiode and analyzed with a lock-in amplifier. A maximum pump-probe time delay equal to is achieved using a mobile reflector system mounted on a translation stage.
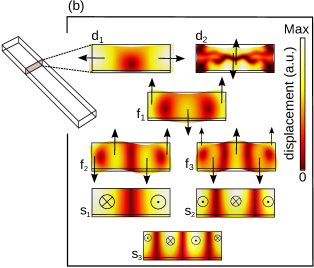
First, let us consider the case where the pump and probe beams are spatially superimposed. Fig.2 shows the time domain reflectivity change measurements obtained on a wide (determined by SEM measurement) and thick gold nanobeam in a usual reflectometry set-up. After a sharp and sudden rise, a slowly decreasing non-oscillatory background in is observed. This is the signature of the rapid heating of the electron gas induced by the pump pulse absorption, followed by the slow cooling down process. This thermal stress launches the acoustic vibrations of the nanobeamThomsen et al. (1984). The time-resolved signature also shows a superposition of high (inset Fig.2(a)) and low frequency oscillations. By performing a numerical fast Fourier transform (Fig.2(b)) or by fitting the time oscillation with a damped sinus function, one can extract a and a acoustic signatures. In the following we consider that the Young modulus, the Poisson’s ratio and the density of gold are respectively , and Meyers and Chawla (2009). The longitudinal and transverse sound velocities are then and respectively. Thus, the higher frequency appears to be the thickness vibration of the beam owing to the fact that . The displacement field of this eigenmode is plotted in Fig.3(b). At this point, we verify that this thickness resonance signature is also observed when the pump-probe experiment is undertaken on the gold mesa using an interferometric scheme in this case as photoelastic signals are negligible in gold layersPerrin et al. (1999). Consequently, the reflectometry measurement undertaken on the gold nanobeam is probably partly an interferometric like detection with the light reflected by the silicon substrate underneath acting as a reference mirror.
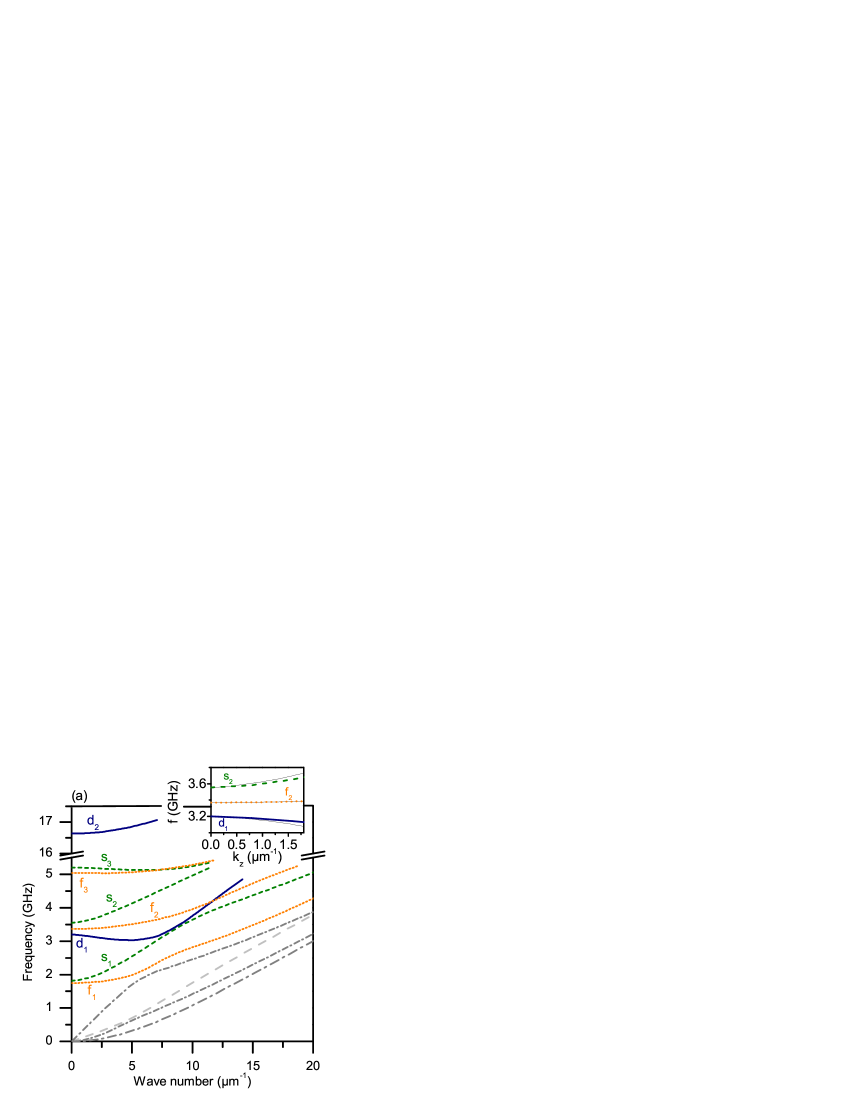
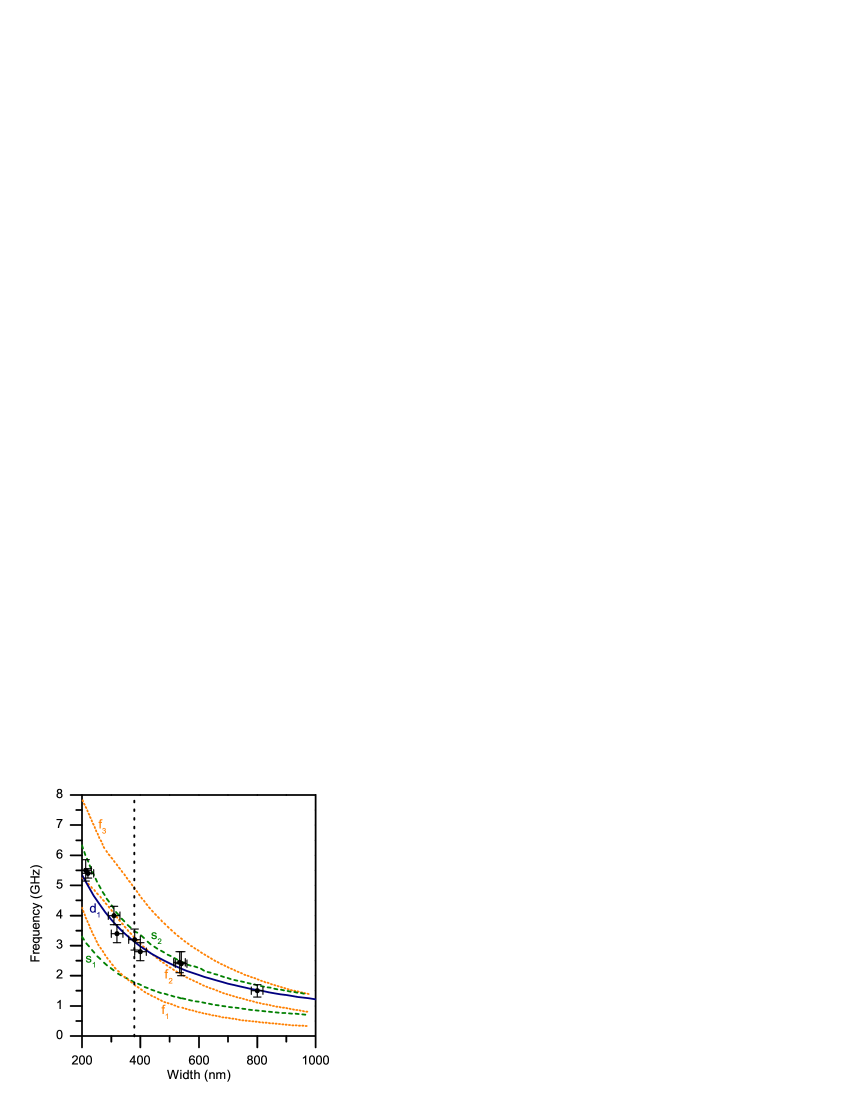
The case of the lower frequency is dealt with by performing an eigenmode analysis by finite elements method. The dispersion relation of a wide nanobeam is plotted in Fig.3. Several acoustic modes with non-zero cut-off frequencies are revealed. Three distinct families emerge : the flexural modes , and , the dilatational modes and and the shear modes , and (see Fig.3(b)). The frequency evolution of , , , , and with the nanobeam width is plotted in Fig.4. The measured frequencies on different gold nanobeams are also reported. Owing to the measurement uncertainties, the experimental frequencies ranging from to may be consistent with the frequencies of the modes , and which exhibit close cut-off frequencies. Consequently, additional evidence on the detected mode is needed. Given that the excitation process imposes the relative amplitudes of the excited modes, one can use the initial displacement field projection on the orthogonal basis formed by the nano-object eigenmodes to identify which mode will be efficiently excitedHu et al. (2003); Crut et al. (2011). Here we propose to discriminate unambiguously between the different acoustic modes by probing their propagation. Very different behaviors are expected owing to the very different slopes of the dispersion relationship.
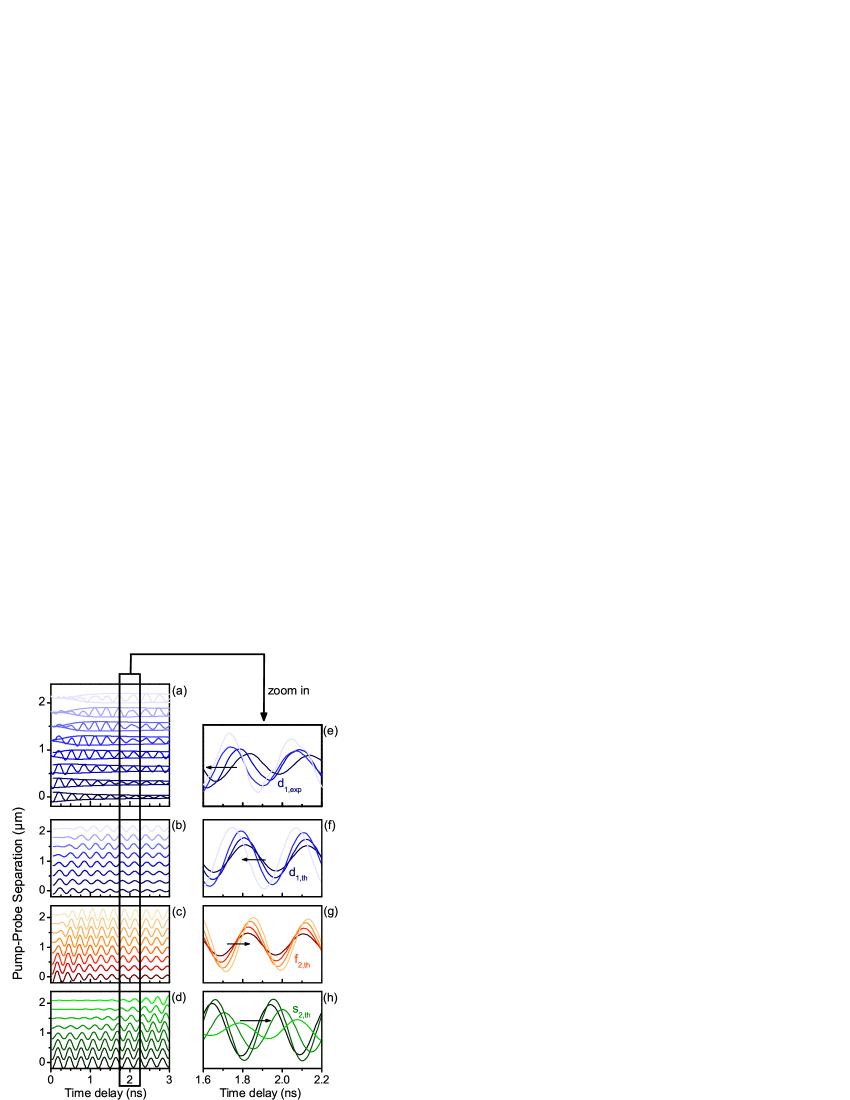
In order to be sensitive to the propagation phenomenon, the pump and probe beams have to be separatedKelf et al. (2011). The transient reflectivity measured on a width gold nanobeam, with pump-probe separation ranging from to , is presented in Fig.5(a). The vertical scale corresponds to the pump-probe spatial separation. The exponential thermal background has been removed. As physical insight on the attenuation process is beyond the scope of this study, each transient reflectivity signal is normalized by its maximum : the eighth experimental signal with spatial separation is one order of magnitude less intense than the first one when pump and probe beams are spatially superimposed. The signal is mainly composed by a oscillation. As the pump-probe separation increases, this wave-packet shifts to a longer time delays as expected for a propagation guided along the nanobeam. This is analogous to what has already been observed in copper nanowiresJean et al. (2014). However, let us have a closer look at the individual wave fronts (Fig.5(e)). It appears that as the wave-packet propagates (from darker to lighter curve), the individual wave fronts move to smaller time-delay. To investigate this propagation quantitatively, we use the previously developed expression of the reflectivity for a propagating gaussian wave-packet with the parabolic dispersion relation Jean et al. (2014)
| (1) |
where is the spatial pump-probe separation and is the root of the sum of squares of the pump and probe beam diameters at . A polynomial fit at small wavenumber for , and (see inset Fig.3(a)) is used. We then evaluate the theoretical reflectivity signal for these three modes (Fig.5(b)), (Fig.5(c)) and (Fig.5(d)) at different pump and probe separations. The progressive shift of the wave-packet is very slow for the mode (Fig.5(c)), due to the very flat dispersion relation. Both the and modes show parallel propagation of the individual wave fronts and the wave packet (Fig.5(g),(h)), whereas the mode exhibits the expected backward propagation behavior (Fig.5(f)). According to our simplified analytical expression, the parallel (forward) or anti-parallel (backward) behavior is strongly dependent on the sign of the curvature parameter . The first dilatational mode is the only one to exhibit a negative curvature at low wave numbers which are the only wave numbers excited owing to the laser spot diameters of around . To confront the experiment, the envelope of the theoretical signal is also plotted on the experimental oscillation and shows a good agreement (Fig.5(a)). Finally, it could be argued that the experimental signal is a superposition of two or more acoustic modes. However, if a contribution of beyond of or is added in the simulated signal , the resulting simulated propagative wave no longer exhibits the backward wave behavior. The backward wave observation in our 1D elastic waveguide is thus the unique fingerprint of the first width dilatational mode .
In conclusion, two dilatational acoustic modes are investigated on e-beam lithographed gold nanobeams by pump-probe time-resolved spectroscopy leading to the observation of backward wave propagation in the gigahertz range. As a first application, we show unambiguous acoustic mode discrimination using this unique property in the dispersion relations. Furthermore, as already observed in 2D Lamb waveguides, one can imagine to tune the width and thickness of our nanobeam, thus opening the way to negative refraction physics in acoustics at the nanoscale.
Acknowledgements.
The authors would like to thank Michael Rosticher at the ENS for the EBL steps during the maintenance in our facilities, Mélanie Escudier for the gold deposition process and Frances Edwards for her careful proofreading of the manuscript’s English.References
- Crut et al. (2015) A. Crut, P. Maioli, N. Del Fatti, and F. Vallée, Phys. Rep. 549, 1 (2015).
- Juvé et al. (2010) V. Juvé, A. Crut, P. Maioli, M. Pellarin, M. Broyer, N. Del Fatti, and F. Vallée, Nano Lett. 10, 1853 (2010).
- van Dijk et al. (2005) M. van Dijk, M. Lippitz, and M. Orrit, Phys. Rev. Lett. 95, 267406 (2005).
- Siry et al. (2003) P. Siry, L. Belliard, and B. Perrin, Acta Acust. United Ac. 89, 925 (2003).
- Vertikov et al. (1996) A. Vertikov, M. Kuball, A. V. Nurmikko, and H. J. Maris, Appl. Phys. Lett. 69, 2465 (1996).
- Guillet et al. (2009) Y. Guillet, C. Rossignol, B. Audoin, G. Calbris, and S. Ravaine, Appl. Phys. Lett. 95, 061909 (2009).
- Bienville et al. (2006) T. Bienville, J. F. Robillard, L. Belliard, I. Roch-Jeune, A. Devos, and B. Perrin, Ultrasonics 44 Suppl 1, e1289 (2006).
- Kelf et al. (2011) T. A. Kelf, Y. Tanaka, O. Matsuda, E. M. Larsson, D. S. Sutherland, and O. B. Wright, Nano letters 11, 3893 (2011).
- Del Fatti et al. (1999) N. Del Fatti, C. Voisin, F. Chevy, F. Vallée, and C. Flytzanis, J. Chem. Phys. 110, 11484 (1999).
- Staleva and Hartland (2008) H. Staleva and G. V. Hartland, Adv. Funct. Mater. 18, 3809 (2008).
- Zijlstra et al. (2008) P. Zijlstra, A. L. Tchebotareva, J. W. M. Chon, M. Gu, and M. Orrit, Nano lett. 8, 3493 (2008).
- Major et al. (2013) T. A. Major, A. Crut, B. Gao, S. S. Lo, N. Del Fatti, F. Vallée, and G. V. Hartland, Phys. Chem. Chem. Phys. 15, 4169 (2013).
- Belliard et al. (2013) L. Belliard, T. W. Cornelius, B. Perrin, N. Kacemi, L. Becerra, O. Thomas, M. Eugenia Toimil-Molares, and M. Cassinelli, J. Appl. Phys. 114, 193509 (2013).
- Ristow et al. (2013) O. Ristow, M. Merklein, M. Grossmann, M. Hettich, M. Schubert, A. Bruchhausen, J. Grebing, A. Erbe, D. Mounier, V. Gusev, E. Scheer, T. Dekorsy, and E. C. S. Barretto, Appl. Phys. Lett. 103, 233114 (2013).
- Jean et al. (2014) C. Jean, L. Belliard, T. W. Cornelius, O. Thomas, M. E. Toimil-Molares, M. Cassinelli, L. Becerra, and B. Perrin, J. Phys. Chem. Lett. 5, 4100 (2014).
- Mante et al. (2013) P.-A. Mante, Y.-C. Wu, Y.-T. Lin, C.-Y. Ho, L.-W. Tu, and C.-K. Sun, Nano lett. 13, 1139 (2013).
- Amziane et al. (2011) A. Amziane, L. Belliard, F. Decremps, and B. Perrin, Phys. Rev. B 83, 14102 (2011).
- Veselago and Narimanov (2006) V. Veselago and E. Narimanov, Nature Mater. 5, 759 (2006).
- Veselago (1968) V. G. Veselago, Sov. Phys. Usp. 10, 509 (1968).
- Parazzoli et al. (2004) C. G. Parazzoli, R. B. Greegor, J. A. Nielsen, M. A. Thompson, K. Li, A. M. Vetter, M. H. Tanielian, and D. C. Vier, Appl. Phys. Lett. 84, 3232 (2004).
- Lamb (1904) H. Lamb, P. Lond. Math. Soc. 2, 473 (1904).
- Meitzler (1965) A. H. Meitzler, J. Acoust. Soc. Am. 38, 835 (1965).
- Maznev and Every (2009) A. A. Maznev and A. G. Every, Appl. Phys. Lett. 95, 011903 (2009).
- Philippe et al. (2015) F. D. Philippe, T. W. Murray, and C. Prada, Sci. Rep. 5, 11112 (2015).
- Bramhavar et al. (2011) S. Bramhavar, C. Prada, A. A. Maznev, A. G. Every, T. B. Norris, and T. W. Murray, Phys. Rev. B 83, 014106 (2011).
- Thomsen et al. (1984) C. Thomsen, J. Strait, Z. Vardeny, H. J. Maris, J. Tauc, and J. Hauser, Phys. Rev. Lett. 53, 989 (1984).
- Meyers and Chawla (2009) M. A. Meyers and K. K. Chawla, Mechanical Behavior of Materials, Vol. 2 (Cambridge University Press Cambridge, 2009).
- Perrin et al. (1999) B. Perrin, C. Rossignol, B. Bonello, and J. C. Jeannet, Physica B 263-264, 571 (1999).
- Hu et al. (2003) M. Hu, X. Wang, G. V. Hartland, P. Mulvaney, J. P. Juste, and J. E. Sader, J. Am. Chem. Soc. 125, 14925 (2003).
- Crut et al. (2011) A. Crut, V. Juvé, D. Mongin, P. Maioli, N. Del Fatti, and F. Vallée, Phys. Rev. B 83, 205430 (2011).