WATCHDOG: A Comprehensive All-Sky Database of Galactic Black Hole X-ray Binaries
Abstract
With the advent of more sensitive all-sky instruments, the transient Universe is being probed in greater depth than ever before. Taking advantage of available resources, we have established a comprehensive database of black hole (and black hole candidate) X-ray binary (BHXB) activity between 1996 and 2015 as revealed by all-sky instruments, scanning surveys, and select narrow-field X-ray instruments aboard the INTErnational Gamma-Ray Astrophysics Laboratory (INTEGRAL), Monitor of All-Sky X-ray Image (MAXI), Rossi X-ray Timing Explorer (RXTE), and Swift telescopes; the Whole-sky Alberta Time-resolved Comprehensive black-Hole Database Of the Galaxy or WATCHDOG. Over the past two decades, we have detected 132 transient outbursts, tracked and classified behavior occurring in 47 transient and 10 persistently accreting BHs, and performed a statistical study on a number of outburst properties across the Galactic population. We find that outbursts undergone by BHXBs that do not reach the thermally dominant accretion state make up a substantial fraction ( 40%) of the Galactic transient BHXB outburst sample over the past years. Our findings suggest that this “hard-only” behavior, observed in transient and persistently accreting BHXBs, is neither a rare nor recent phenomenon and may be indicative of an underlying physical process, relatively common among binary BHs, involving the mass-transfer rate onto the BH remaining at a low level rather than increasing as the outburst evolves. We discuss how the larger number of these “hard-only” outbursts and detected outbursts in general have significant implications for both the luminosity function and mass-transfer history of the Galactic BHXB population.
Subject headings:
accretion disks — black hole physics — catalogs — stars: black holes — X-rays: binariesI. Introduction
Black Hole X-ray Binaries (BHXBs) are interacting binary systems where X-rays are produced by material accreting from a secondary companion star onto a black hole (BH) primary. Due to angular momentum in the system, accreted material does not flow directly onto the compact object, rather it forms a differentially rotating disk around the BH known as an accretion disk (Pringle & Rees, 1972; Shakura & Sunyaev, 1973). While some material accretes onto the BH, a portion of this inward falling material may also be removed from the system via an outflow in the form of a relativistic plasma jet or an accretion disk wind (Hjellming & Wade, 1971a; Blandford & Konigl, 1979; Phinney, 1982; White & Holt, 1982; Begelman & Mckee, 1983). For major reviews of BHXBs see Tanaka & Lewin (1995); Tanaka & Shibazaki (1996); Chen et al. (1997); McClintock & Remillard (2006); Remillard & McClintock (2006) and Done et al. (2007).
The degree of BHXB variability separates them into transient and persistent sources. Most transient BHXBs are Low Mass X-ray Binary (LMXB) systems where mass transfer occurs via Roche lobe overflow of a secondary companion with a mass and spectral type A or later (White et al., 1995). A few transient BHXBs have high-mass donors (e.g., SAX J1819.22525; Orosz et al. 2001).
Transient X-ray binaries (XRBs) cycle between periods of quiescence and outburst. The transient behavior is dependent upon the mass transfer rate onto the BH (Tanaka & Lewin, 1995). Transient XRBs generally spend most of their time in a quiescent state, characterized by long periods of time, lasting anywhere from a few months to decades. In quiescence, the system is exceptionally faint () and very little material is transferred from the accretion disk onto the compact object (McClintock & Remillard, 2006). The transition to outburst occurs as a consequence of instabilities, both thermal and viscous in nature, developing in the accretion disk that cause more rapid mass transfer onto the BH and lead to bright X-ray emission (Meyer & Meyer-Hofmeister, 1981; Cannizzo et al., 1995; King & Ritter, 1998; Lasota, 2001). As transients spend most of their time in a quiescent state at low luminosities their long-term mass transfer rates are usually low, on the order of (King, 1995).
In contrast, there are two types of sources that persistently accrete for years. Typically, long-term persistent sources are High Mass X-ray Binaries (HMXBs) that spend most of their time in an X-ray bright (“outburst”) state. Here material is accreted from a massive companion, with and a spectral type O or B, via a stellar wind. This massive companion drives a strong stellar wind resulting in long-term mass transfer rates as high as (King, 1995). As these fast winds have small circularization radii, the outer radius of the disk is always ionized, allowing these systems to remain in a bright outburst state for long periods of time. On the other hand, some transient LMXBs can maintain bright outbursts for decades (e.g., GRS 1915+105; Castro-Tirado et al. 1994; Deegan et al. 2009), and thus may be classified as persistent, at least over the timescales that we observe them.
The model used to explain the outburst mechanism in XRBs is referred to as the disk-instability model (DIM; Osaki 1974; Meyer & Meyer-Hofmeister 1981; Cannizzo et al. 1985; Cannizzo 1993; Lin & Taam 1984; Huang & Wheeler 1989; Mineshige & Wheeler 1989). While this model was originally developed to explain the mechanism behind dwarf novae outbursts in Cataclysmic Variables (Osaki, 1974), the disc instability model, which we describe below, also seems to describe XRB outbursts reasonably well when the additional term of irradiation from the inner accretion disk in outburst is included.
In quiescence, the accretion disk is in a cool, neutral state. The quiescent disk is built up due to steady mass transfer from the counterpart star, either as a result of Roche lobe overflow in LMXBs or winds in the case of HMXBs, and the temperature of the disk begins to rise. Given the steep temperature dependence of the opacity, eventually the disk temperature in the outer annuli will rise high enough to allow for ionization of hydrogen to occur, and the disk will undergo a thermal limit cycle.
The cycle begins with the increase in temperature causing an increase in mass accretion rate through a particular annulus. The reason that this can occur is directly tied to hydrogen ionization causing a viscous instability within the disk. When the hydrogen is (at least partly) ionized, the magnetic field is locked into the disk. As the disk rotates differentially, magnetic field lines that have radial extent are stretched, tending to slow down particles that are closer to the BH (thus making them fall inwards faster), and speed up those that are farther (making them move outwards). Thus, the viscosity of the disk (i.e., the ability of the disk to move angular momentum around) increases dramatically; in the hot ionized state, material moves inward rapidly. The mechanism for the viscous instability described here is known as the magneto-rotational instability (MRI; Balbus & Hawley 1991). See Balbus & Hawley (1998) for a thorough review of this mechanism.
This process ultimately results in a heating wave that propagates inwards and/or outwards through the disc, causing a rapid infall of matter onto the compact object and in-turn an X-ray outburst. Eventually, as the disk is eaten away, the temperature and mass accretion rate through the disc are pulled down to a point where hydrogen is allowed to recombine, triggering the thermal instability once again, only in reverse, and the disk is allowed to return to a cool, neutral state once again.
To first order, the predictions of the disc instability model can explain many observable phenomena (Maccarone, 2014). First, systems that have high enough mass transfer rates to keep disks fully ionized tend to be persistent and systems that have mass transfer rates below this threshold tend to be transient (see Coriat et al. 2012 and this work). Second, the positive correlation found between peak outburst luminosity and orbital period in transient XRBs (see Shahbaz et al. 1998; Portegies Zwart et al. 2004; Wu et al. 2010; and this work) agrees roughly with the prediction that outburst peak luminosities should scale with the radius of the accretion disk (King & Ritter, 1998). Third, observed outburst durations match relatively well with the viscous timescales of accretion disks in many BH systems (see Chen et al. 1997 and this work). Lastly, we note that with the addition of tidal effects to the disk-instability (i.e., the tidal instability;Osaki 1996; Truss et al. 2002), sources that show outbursts of varying amplitudes (e.g., “super outbursts” like Swift J1753.50127;Zurita et al. 2008; Maccarone & Patruno 2013) can also possibly be explained by this model. See for example Maccarone (2014) for a detailed discussion of XRB phenomenon associated with tidal interactions.
However, there are a few observed phenomena that provide strong arguments for a mass-transfer instability occurring (i.e., variable mass-transfer from the counterpart star;Osaki 1985; Hameury et al. 1986, 1987, 1988, 1990) and thus XRB outbursts cannot be accurately described by the disk-instabilty alone. First, systems have been observed to undergo rapid flux variability on timescales of hours, too quickly to be described by the global disk instability and too strong to be the result of “normal” variability seen in XRBs (e.g., XTE J1819254; Hjellming et al. 2000; Orosz et al. 2001). Second, quiescent ultraviolet and optical flux are variable, presumably the result of variable mass transfer onto the accretion disk impact spot (e.g., 1A 062000; Cantrell et al. 2010; Froning et al. 2011). Therefore, given the observational evidence, it seems likely that some combination of disk, mass-transfer, and tidal instabilities is applicable to BHXBs at least some of the time (Maccarone, 2014).
During the outburst state, BHXB light curves exhibit a range of morphological types that vary on both a source-by-source basis and between individual outbursts of the same source. While the most prominently observed type is the fast rise exponential decay (FRED) outburst, numerous other features including linear decays, plateaus, multiple peaks, and complex variability have been observed (Chen et al., 1997).
Notable variations in spectral and timing properties are also observed during an outburst, allowing a number of different accretion states to be defined. While X-ray accretion states have been known to exist since the early 1970’s when Tananbaum et al. (1972) first observed a global spectral change in Cygnus X1, it was largely the multitude of population studies performed throughout the late 1990s and early 2000s (e.g., Tanaka & Lewin 1995; Chen et al. 1997; McClintock & Remillard 2006; Remillard & McClintock 2006) that propelled us beyond the largely phenomenological description of X-ray accretion states and into descriptions more firmly based on physical models (e.g., accretion disk, corona, and jet).
The launches of X-ray satellites with unparalleled capabilities like RXTE (1995), XMM-Newton (1999), Chandra (1999), and Swift (2004), have challenged, and continue to challenge, the prevailing views of X-ray accretion states in BHXBs. Access to large amounts of X-ray observations have made it possible to place observational constraints on accretion flows in strong gravity and has allowed for further theoretical understanding of these systems. A variety of different models of the changing nature and geometry of accretion flows created over the last few decades have been developed to understand the wide variety and variability of emission observed from these systems. From these models we now have an emerging picture that explains much of the behavior seen from BHXBs (e.g., Remillard & McClintock 2006, Done et al. 2007).
Currently, there are two theoretical stable accretion flow models that are generally thought to explain the majority of observed spectra. The thermal disk black body spectral model, typically observed at low energies, is attributed to direct soft photons from a geometrically thin, optically thick disk (Shakura & Sunyaev, 1973; Mitsuda et al., 1984; Makishima et al., 1986). While the hard Comptonized spectral model, typically observed at higher energies, is thought to come from a hot, geometrically thick, optically thin inner coronal flow existing above and around the inner disk. The electrons within this flow are thought to (repeatedly) up-scatter a fraction of the lower energy disk photons, producing the observed smooth Comptonized spectrum extending to high energies (Thorne & Price, 1975; Sunyaev & Truemper, 1979a). The structure of this flow is now most commonly associated with Advection Dominated Accretion Flows (ADAFs; Ichimaru 1977; Narayan & Yi 1994). However, because the flow is thought to be more complex, other physical processes such as convection (CDAFs; Abramowicz & Igumenshchev 2001), magnetic fields (MDAFs; Meier 2005), winds (ADIOS; Blandford & Begelman 1999), and jets (JDAFs; Falcke et al. 2004) are necessary for a more realistic treatment. We note that while a number of plausible alternatives for the origin of the Comptonized spectrum exist (e.g., see Malzac & Belmont 2009; Plotkin et al. 2015), we will focus only on the interpretation discussed above.
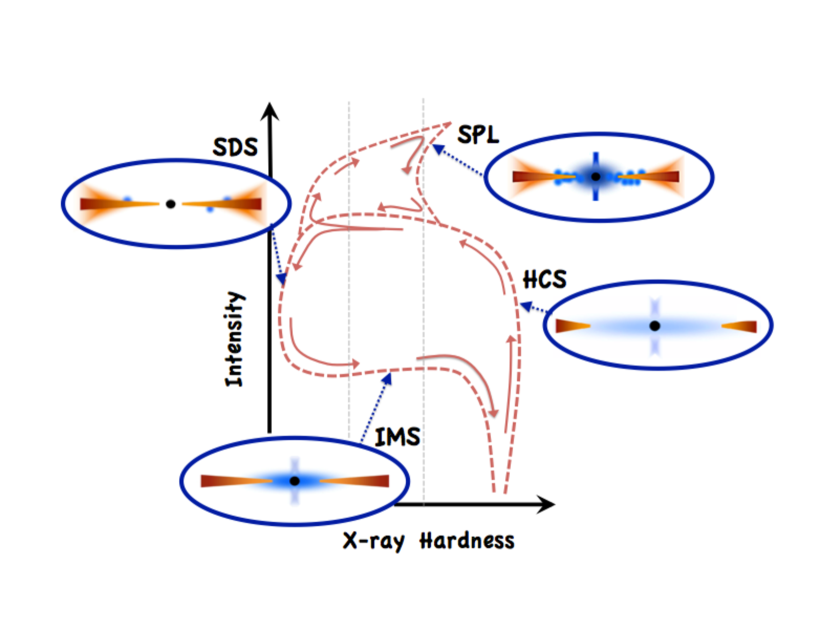
The behavioural pattern often observed during outburst (Maccarone & Coppi, 2003; Vadawale et al., 2003) involves the system cycling through a pattern of hard (dominated by Comptonized emission) and soft (dominated by thermal emission) states, where the rise in luminosity at the start of outbursts occurs in the hard state. The peak of the outburst and the initial decline occurs in the soft state, while the final stages of the decline occur in the hard state. This pattern, commonly referred to as the “turtlehead” or “q-track”, can be clearly observed in a hardness-intensity diagram (HID; see Figure 1).
The Hard (Comptonized) State (HCS) is characterized by spectra dominated by a power-law (Comptonized) component with a hard photon index of and a high energy cutoff at 100 keV, which may or may not be supplemented by a weak thermal component (Done, 2010). Observationally, the hard state is associated with radio detections of a flat to slightly inverted radio spectrum, thought to be the result of the presence of a compact, steady jet (Hjellming & Wade, 1971a; Tananbaum et al., 1972; Fender et al., 2004; Fender, 2010; Russell et al., 2012), involves low mass transfer rates, and is typically associated with lower Eddington-scaled luminosities (Done, 2010).
In contrast, the Soft (Disc-Dominated) State (SDS) is characterized by spectra with a dominant disk component peaking at keV accompanied by a weak power-law tail with that often extends past keV and carries only a small portion of the power (Done et al., 2007). Observationally, the soft state is associated with high mass transfer rates, is typically associated with higher Eddington-scaled luminosities, and lacks any persistent optically thick radio emission. The latter is thought to be a result of the quenching of the radio jet (Fender et al., 2004).
The SDS is associated with two different types of outflows. The first, is optically thin jet ejecta that propagate out from the BH, which are typically detected at radio frequencies early in the SDS (Fender et al., 2004). Note that, even though the actual ejection event appears to occur before the SDS is fully reached (Miller-Jones et al., 2012), it is still included as an observational property of the SDS. The second, is an accretion disk wind. While these winds have been seen recently in high resolution spectra (e.g., Lee et al. 2002; Miller et al. 2004, 2006c, 2006b, 2008; King et al. 2012b; Neilsen & Homan 2012; Diaz Trigo et al. 2014), evidence for their presence was identified well before high resolution X-ray spectroscopy had ever been done (e.g., V404 Cyg; Oosterbroek et al. 1997). Originating from the outer disk, accretion disk winds have the ability to carry away large amounts of mass, sometimes on the order of, or larger than, the accretion rate onto the BH, . As such, these winds could be the mechanism behind the quenching of the radio jet in the soft state regimes (Neilsen & Lee, 2009; Ponti et al., 2012).
While it has been suggested that the two outflow regimes of the hard and soft states are most likely not connected by a simple rebalancing of the same outflow power, with the wind carrying more mass but less kinetic power then that of the jet, detailed calculations of quantities such as kinetic energy, mass, and momentum flux in these two types of outflows have not yet been carried out (Fender & Gallo, 2014). As a result the physical interaction between the winds, accretion flows, and jets in these systems are not fully understood. However, given the observationally suggested mass flux and power of these winds and their ubiquitous appearance only in the soft state, it stands to reason that both jets and winds are perhaps a fundamental component of the accretion phenomenon (Ponti et al., 2012).
The situation becomes far more complex during transitions between the hard and soft states. This transitional stage, often collectively referred to as the Intermediate State (IMS), involves an increase in X-ray luminosity and a softer spectrum. The softening of the spectrum is due to two effects that happen simultaneously; the appearance of a significant thermal disk component and the steepening of the hard power-law component to a photon index of . Observationally, the IMS is associated with high mass accretion rates. The spectral behavior associated with this state can be observed at both low and high fractions of Eddington.
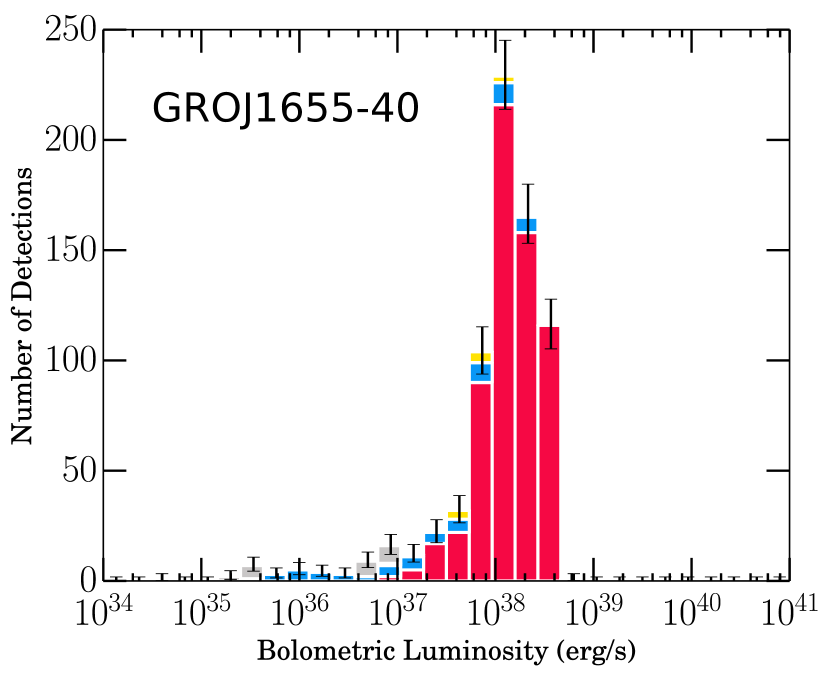
While the majority of sources show the absence of a clear luminosity change during hard-soft and soft-hard spectral transitions (Maccarone, 2005), clear variations on this fundamental behavior have been observed. The most noteworthy being the appearance of a steep power-law (SPL) state, in which rapid variations in luminosity accompany the softening and/or hardening of the source, resulting in the addition of a “dragon horn” like feature to the classic “turtlehead” pattern (see McClintock & Remillard 2006 and Done et al. 2007 for a more detailed discussion and Figure 1 for a schematic representation). In fact, evidence for SPL behavior is not just limited to a few cases, but can be seen in the brightest phases of many BHXBs, including GX 3394 (Miyamoto et al., 1991; McClintock & Remillard, 2006; Motta et al., 2009), GRS 1915+105 (Done et al., 2004; Reig et al., 2003), GRO J165540 (Kubota et al., 2001; McClintock & Remillard, 2006; Brocksopp et al., 2006; Dunn et al., 2010), 4U 1630472 (Abe et al., 2005), and XTE J1550564 (Miller et al., 2001b; Rodriguez et al., 2003; McClintock & Remillard, 2006).
While collectively the intermediate states are known to take place on relatively short time scales (hours to days), much of the physics occurring during this transitional stage is largely unknown (Remillard & McClintock, 2006). The prevalent model (see Esin et al. 1997; Meyer et al. 2007), stipulates that to transition between the HCS and SDS, the mass transfer rate must increase, causing the disk to move inwards. Fewer seed photons are intercepted by the hot inner flow when the disk is truncated far from the BH, leading to a hard spectral component. As the disk moves inwards further underneath the hot flow, the spectrum softens due to the disk component becoming significantly brighter (and more dominant) and a larger fraction of disk seed photons being intercepted, effectively cooling the corona via up-scattering.
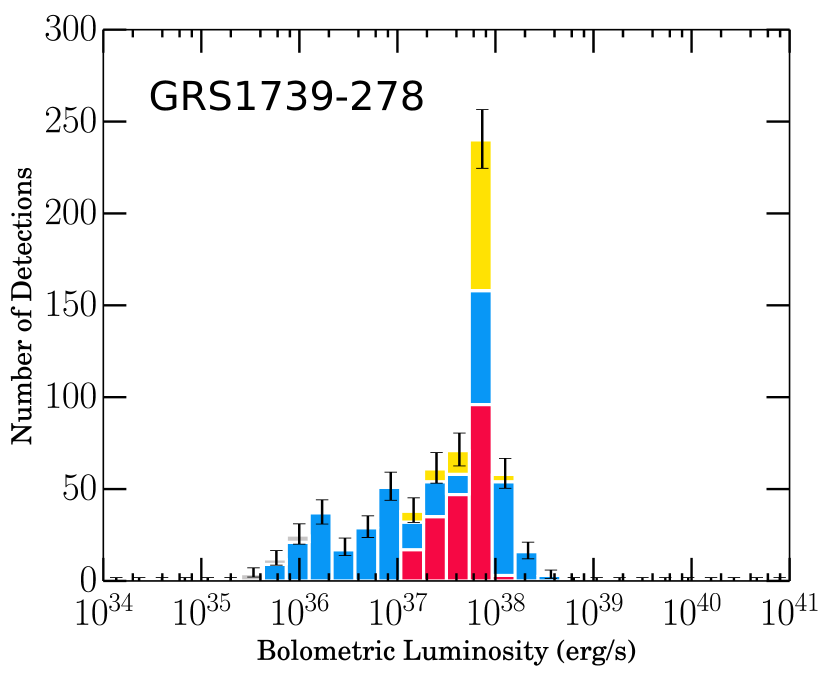
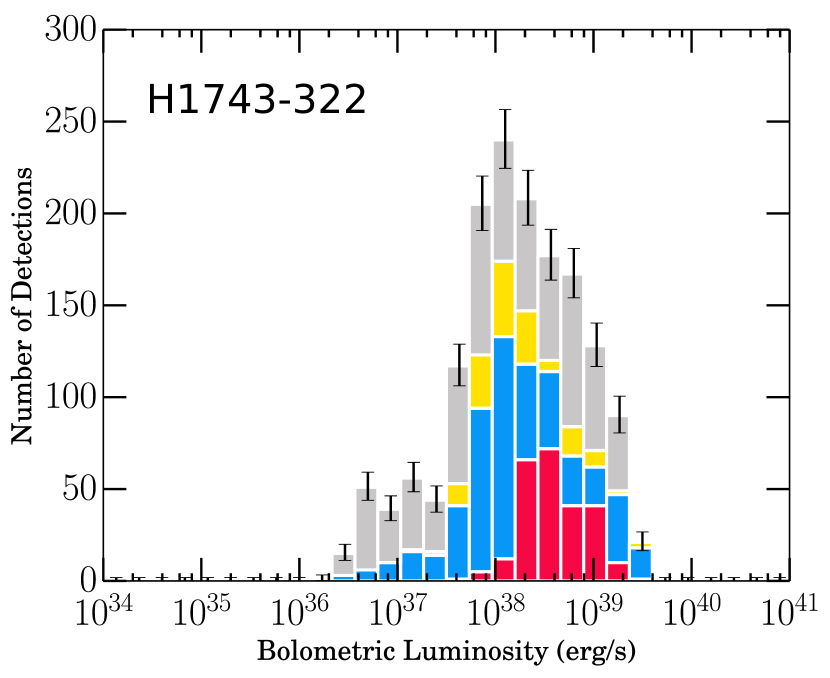
The basic “turtlehead” pattern presented above has been modelled after numerous outbursts of GX 3394 (Zdziarski et al., 2004; Fender et al., 2004; Belloni et al., 2005; Homan & Belloni, 2005; Del Santo et al., 2008; Belloni, 2010; Motta et al., 2009; Corbel et al., 2013; Debnath et al., 2013b) and can be observed in a multitude of other sources (McClintock & Remillard, 2006) including, but not limited to H 1743322 (Zhou et al., 2013; Chen et al., 2010), GRO 165540 (Tomsick et al., 1999; Brocksopp et al., 2006), 4U 1543475 (Park et al., 2004), MAXI J1659152 (Kuulkers et al., 2013), and GRS 1739278 (Borozdin & Trudolyubov, 2000).
That being said, not all BHXB systems follow the basic “turtlehead” pattern during outburst. A number of transient systems have been observed to undergo outbursts that do not involve any complete state transitions (i.e., “hard-only” outbursts). In this case the source either remains in the HCS (Harmon et al., 1994b; Hynes et al., 2000b; Belloni et al., 2002; Brocksopp et al., 2001, 2004; Aref’ev et al., 2004; Sturner & Shrader, 2005; Brocksopp et al., 2010b; Sidoli et al., 2011; Curran & Chaty, 2013) or only transitions as far as the IMS (Wijnands & Miller, 2002; in’t Zand et al., 2002c; Capitanio et al., 2009a; Ferrigno et al., 2011; Reis et al., 2012; Soleri et al., 2012; Zhou et al., 2013; Curran et al., 2014) during outburst, never fully reaching the softer thermally dominant states. This behavior is not just limited to transient systems but has also been exhibited by a fair number of persistently accreting systems as well. In their case, either spending long continuous periods of time in the HCS (Churazov et al., 1993; Main et al., 1999; del Santo et al., 2004; Pottschmidt et al., 2006; Soleri et al., 2012; Shaw et al., 2013; Froning et al., 2014) or periodically undergoing “incomplete” state transitions (Pottschmidt et al., 2003; Soleri et al., 2012).
Despite the numerous advances made in the field over the past 45 years, we still do not have a theoretical framework to explain all the observational behavior exhibited by BHXBs. Moreover, the physical parameter(s) that drives the critical instability that precipitates state transitions in BHXBs also remain largely unknown. As such, being able to enumerate the frequency of outbursts occurring in BHXBs and quantitatively classify the wide range of behaviors exhibited during their outbursts is critical to furthering our understanding of the physical mechanisms driving mass accretion in BHXBs and in turn is a key step toward filling in the many gaps in our knowledge of how BHXBs form, accrete, and evolve.
To date, there exist numerous catalogues of XRBs (see Bradt & McClintock 1983; van Paradijs & McClintock 1995; Liu et al. 2000, 2001, 2006, 2007). However, with the advent of more sensitive all sky and scanning survey X-ray instruments allowing the transient X-ray Universe to be probed in greater depth, we are detecting a larger number of sources than ever before, culminating in the currently published catalogues111Note that we learned of the BlackCAT catalogue (Corral-Santana et al., 2015) after submission of this manuscript. quickly becoming dated.
In addition to these catalogues, there also exists a copious amount of comprehensive reviews on BHXBs and X-Ray Novae (XRN; another name for BHXB outbursts) in the literature. For large scale reviews see Tanaka & Lewin (1995); Tanaka & Shibazaki (1996); McClintock & Remillard (2006), for a comprehensive study of X-ray properties of BHXBs in the pre-RXTE era see Chen et al. (1997) and for more recent global X-ray studies see Gierlinski & Newton (2006); Remillard & McClintock (2006); Dunn et al. (2010); Fender (2010); Belloni (2010); Gilfanov (2010); Yan & Yu (2015). However, the majority of these studies only focus on the “bright” outburst events, and offer only a sampling of the sources exhibiting the well defined “turtlehead” behavior as observed by one telescope. As such we have set out to build an update to the current picture in the form of a fully functioning modern BHXB database, accumulating the history of Galactic BH and BHC sources over the past 19 years (1996–2015).
In Section 2 we outline the criteria for source inclusion in our sample, providing a detailed overview of the current state of the Galactic population on a source-by-source basis. Section 3 provides information on the data selection process and the inner workings of our custom pipeline, using a comprehensive algorithm built to discover, track, and quantitatively classify behavior, from which our database has been assembled. Section 4 presents the numerical and statistical results, and data products produced by the algorithm. Section 5 discusses the implications that both the larger number of “hard-only” outbursts and detected outbursts in general have on the long-term mass transfer rates and luminosity function of the Galactic population. Section 6 summarizes our findings for this all-sky study.
I.1. Observational Techniques
In this subsection we provide a brief overview of the observational techniques that are used (and the current limitations of these techniques) for determining distance and compact object mass in XRB systems.
I.1.1 Distance
Here we outline four different methods (discussed in detail in Jonker & Nelemans 2004) to estimate distance to a XRB system. First, a direct, model-independent distance can be obtained using trigonometric parallax. While this method may provide the most accurate estimates of distance, for many sources this method is not feasible. XRBs may be (i) located several kpc away, and therefore require sub-milliarcsecond astrometry to measure their parallaxes222Very long baseline interferometry (VLBI) at radio wavelengths is currently the only technique available to do high-precision astrometric measurements (Miller-Jones et al., 2009)., (ii) too faint to be detected at radio wavelengths, or (iii) located in the Galactic plane, where high-precision astrometry is next to impossible due to scatter broadening along the line of sight (Miller-Jones et al., 2009). Currently, there are only three trigonometric parallax distances to BH systems (Miller-Jones et al., 2009; Reid et al., 2011, 2014).
Second, distance can be estimated by comparing the absolute magnitude to the (dereddened) apparent magnitude of the counterpart star, taking into account a possible contribution from residual accretion (Jonker & Nelemans, 2004). In this case, the absolute magnitude can be determined by either: (i) determining the spectral type by fitting the data (e.g., Marsh et al. 1994), and assuming the absolute magnitude is that of a main-sequence star of this spectral type; or (ii) determining radius, spectral type and luminosity class from the data, and then using the surface brightness of the determined spectral type (e.g. from Barnes & Evans 1976; Popper 1980), or a combination of the determined radius and effective temperature along with an appropriate bolometric correction, to estimate absolute magnitude. See for example, GS 2000+251 (Barret et al., 1996a) or 1A 062000 (Gelino et al., 2001b).
Third, limits can be placed on the distance to a source using the observed proper motions of approaching and receding jet ejections. See Mirabel & Rodriguez (1999) for a detailed description of this method and Hjellming & Rupen (1995) for an example of this method being employed for GRO J165540.
Lastly, the interstellar absorption properties of a source may also be used to determine distance. In this case, distance can be estimated by either: (i) using the correlation between the observed equivalent widths of interstellar absorption lines and diffuse interstellar bands and color excess (Herbig, 1995) and then converting the color excess to distance (e.g., see Beals & Oke 1953); or (ii) tracing the movement of individual gas clouds in velocity space through high resolution spectroscopic observations of interstellar absorption lines and associating them with distance by assuming the velocity is due to Galactic rotation. See for example GX 3394 (Hynes et al., 2004).
I.1.2 Mass
During quiescence, optical/infrared (OIR) observations of BHXBs permit detailed studies of the binary counterpart, allowing for the determination of key orbital parameters involved in the mass measurement of the compact object. Once the counterpart has been identified, the orbital period () can be measured from periodicity in either photometry (X-ray or optical/infrared), or radial velocity variations. Once the orbital period is known, radial velocity measurements of the secondary star can give the mass function,
| (1) |
where , the semi-amplitude of the radial velocity curve. The mass function gives a minimum mass of the compact object (). A mass function greater then 3 (Rhoades & Ruffini, 1974; Kalogera & Baym, 1996) proves that the compact object is a BH. Next, either measuring (the radial velocity of the compact object, by tracing the motion of the accretion disk), or independently measuring the mass of the counterpart star (for instance, by spectral typing and assuming it is a main-sequence star), allows for calculation of the mass ratio (). Lastly, analysis of ellipsoidal variability in the photometric light curve provides a method to determine the inclination . The ellipsoidal variability occurs as a result of gravitational distortion of the counterpart star, causing the projected area and average temperature seen by the observer to vary differently with orbital phase depending on the inclination. See for example Charles & Coe (2006) for a detailed discussion of the entire process.
Recently, however, the accuracy of some existing mass measurements for individual BHXBs has been brought into question (Cantrell et al., 2010; Kreidberg et al., 2012). It has been suggested that the most commonly used model to analyze ellipsoidal variability (i.e., the “star-only” model), which works under the assumption that sources of light not due to the star are negligible, may result in mass estimates that are inaccurate by substantial amounts (Kreidberg et al., 2012). This argument stems from the numerous observations of a non-stellar flux component contributing a significant fraction of the total flux of the system at both optical (Cantrell et al., 2010; Zurita et al., 2002; Orosz et al., 2004) and IR (Hynes et al., 2005; Gelino et al., 2010) wavelengths, implying that OIR spectra of quiescent BHs are likely shaped by a number of competing emission mechanisms.
Both direct thermal emission from the outer disc (Cantrell et al., 2010; Gelino et al., 2010) and synchrotron emission from a relativistic jet (Gallo et al., 2007; Russell et al., 2006) have been suggested as culprits for this flux contamination. This non-stellar contribution is not modulated (as the counterpart star is) leading to flattening of the light curve (reducing the size of the modulation). This flattening tends to bias the inferred inclinations towards lower values, and can lead to differences of up to a factor of 2 in the derived mass of a compact object (Gelino et al., 2001b). As such, orbital inclination is by far the largest source of systematic error involved in estimating the mass of the BH. In addition, as an accurate measurement of inclination relies on the ability to quantify the ratio of non-stellar flux to total flux, distinguish between the non-stellar emission mechanisms and characterize the degree to which these individual sources of emission contribute to the OIR light, it is also the most difficult orbital parameter to measure.
Fortunately, Kreidberg et al. (2012) recently published a study in which they characterize the systematic error caused by the effects discussed above. In particular, they build on the study of 1A 062000 quiescent light curves by Cantrell et al. (2008), who define two separate states existent in the quiescent optical light curves, (i) passive: displaying minimum aperiodic variability, resulting in a stable light curve shape over short timescales; and (ii) active: brighter, bluer, and more variable than the passive state, possibly as a result of increased accretion activity. Doing so has allowed them to use inclination estimates and light curves in the literature to assess the most probable value of inclination for 16 BHXB systems. We have made extensive use of this study in determining the orbital parameters used in our analysis.
I.2. Black Hole Spectral and Temporal Signatures
In this subsection we provide a list of BH spectral and temporal signatures that are often used to argue for the presence of a BH when the compact object mass (or mass function) is not known. This section will (i) define terms that will be used extensively throughout Section 2, and (ii) provide suggested references for further reading on the topics discussed.
As discussed in Section 1, the X-ray spectral shape associated with BHs is characterized by a soft, multi-color disc blackbody component and a hard power-law tail, in varying proportions. As the blackbody component, originating from the optically thick accretion disk, has a significantly lower characteristic temperature than the blackbody component originating from the surface in neutron star (NS) spectra (Mitsuda et al., 1984; Done & Gierlinski, 2003), the soft blackbody characteristic of BHs is often referred to as “ultra-soft”. For this reason, the observation of an ultra-soft+power-law spectrum is considered to be the X-ray spectral signature of a BH. For detailed discussion and examples see Tanaka & Lewin (1995) and McClintock & Remillard (2006).
In addition, as most BH systems also exhibit rapid temporal variability (e.g., see van der Klis 2006), the observation of low-frequency quasi-periodic oscillations (LFQPOs) can also be used in tandem with spectral characteristics to argue for the presence of a BH (McClintock & Remillard, 2006). There are three main types of low-frequency QPOs (LFQPOs), ranging in frequency from mHz to Hz, commonly observed in BHXBs (Wijnands et al., 1999; Casella et al., 2005). The presence of each type (A, B, or C) is closely correlated with different spectral states (Belloni et al., 2011). For a detailed description of the behaviour of each type of LFQPO, see Casella et al. (2005).
Moreover, several BHXBs have also been shown to exhibit a strong correlation between X-ray and radio emission in the hard spectral state (Hannikainen et al., 1998; Corbel et al., 2000, 2003). The now established “universal” correlation, which takes the form of a non-linear power law, suggests a strong link between the compact radio jets and the accretion flows in these systems (Gallo et al., 2003). BHXBs have been shown to (i) follow two distinct branches in the radio/X-ray () diagram, corresponding to the efficiency of the accretion flow in the hard spectral state (Gallo et al., 2012), and (ii) be more radio bright (i.e., have much higher radio luminosities at a given X-ray luminosity) than NSs (e.g., see Coriat et al. 2011). As such, the position of a source in the plane can be used as evidence to argue for the presence of a BH in a binary system. See Coriat et al. (2011) and Corbel et al. (2013) and references therein for a more detailed discussion.
Lastly, the absence of observed type I X-ray bursts (i.e., the firm NS signature; Tanaka & Lewin 1995) can be used, in combination with BH spectral/timing signatures, to provide further evidence for the presence of a BH in the binary system.
We note that in the past, an observed soft-hard spectral state transition was considered as a possible BH spectral signature (Tanaka & Lewin, 1995). However, as this behavior is exhibited in NS systems as well (e.g., see White et al. 1995; Tanaka & Lewin 1995; Gladstone et al. 2007; Muñoz-Darias et al. 2014), the observation of this state transition alone is not enough to confirm the nature of the compact object.
II. Sample Selection
II.1. Source Selection Criteria
We have compiled a sample of 77 XRB BHs and BHCs in the Milky Way and Magellanic Clouds. This sample has been built from (i) the McClintock & Remillard reviews (McClintock & Remillard, 2006; Remillard & McClintock, 2006), (ii) the most recent versions of the Low-Mass (LMXBCAT; Liu et al. 2007) and High-Mass (HMXBCAT; Liu et al. 2006) X-ray Binary Catalogues, (iii) the Swift/BAT Transient Monitor333http://swift.gsfc.nasa.gov/results/transients/ BH source list, and (iv) sources listed in the Astronomers Telegram444http://www.astronomerstelegram.org/ (ATel) with a BH keyword that have not been shown to be a pulsar or Active Galactic Nuclei (AGN). We note that some faint transients detected by Chandra, Swift, and XMM-Newton in the past 20 year period may not be included in our sample, even though they could very well be BHXB sources (e.g., Degenaar & Wijnands 2009).
Of the 77 sources included in our sample, 66 are classified as transient, 8 are known to be persistent, and the remaining 3, which are observed to be transient on long timescales (i.e., continuously bright for periods of years in length), are treated as persistent.
Our sample contains 21 dynamically confirmed BH sources, 18 LMXBs and 3 HMXBs. In these cases, either the value of the mass function far exceeds , the widely agreed upon limit for the maximum stable mass of a neutron star (NS) in General Relativity (Rhoades & Ruffini, 1974; Kalogera & Baym, 1996), or dynamical studies have allowed for the measurement of a complete set of orbital parameters, namely , , and , and therefore a definitive estimate of BH mass, . The remaining 56 sources are BHCs, including 37 LMXBs, 6 HMXBs, and 14 undetermined systems. These sources either lack radial velocity data, have no known optical/infrared (IR) counterpart, or, in some cases, have not been well studied at any wavelength. Nevertheless, we can still hypothesize the nature of the primary in these systems based on X-ray spectral and timing behavior in tandem with radio characteristics (McClintock & Remillard, 2006).
At this point we must caution the reader. We have taken a very liberal approach in determining source membership in the BHC class, contrary to many previous compilations. As such, there are sources that are far more likely to contain a BH primary than others. Nevertheless, we believe the few discrepancies we may have are justified in the interest of providing a complete sample of the BH and BHC systems in the Galaxy.
Given our liberal identification of BHCs, we have divided our sample into three classes. Class A contains 21 dynamically confirmed BHs. Class B contains BHC sources with BH-like spectra (e.g., an ultra-soft spectrum, absence of X-ray bursts) and QPO/timing properties characteristic of BHs, and/or correlated radio/X-ray behavior typical of BHs (i.e., micro-quasar/relativistic jet behavior). Class C are most likely Galactic XRBs, but only have weak evidence for a BH primary.
We note that the McClintock & Remillard reviews (McClintock & Remillard, 2006; Remillard & McClintock, 2006) also use quantitative letter grade labels to classify how likely it is that the system in question contains a BH. To avoid confusion, we remind the reader that their letter grade definitions, which take into account both the amount of observations available as well as X-ray/radio characteristics displayed by the source, differ from our own definitions. In their classification scheme, Class A through C correspond to most-likely to least likely BHCs, synonymous to our Class B and C.
We do not include IGR J06074+2205, IGR J175862129, or IGR J173543255 in our sample. All of these sources meet requirements ii and iv above. However, (i) the only known information on IGR J06074+2205 is the spectral type of the optical counterpart, a B0.5Ve star (Halpern & Tyagi, 2005; Tomsick et al., 2006), (ii) based on its spectrum and probable optical counterpart, IGR J175862129 is most likely an obscured HMXB (Krimm et al., 2009a; Sanchez-Fernandez et al., 2009), and (iii) IGR J173543255 is likely a Super Giant Fast X-ray Transient (SFXT; Sguera et al. 2011).
II.2. A Census of Galactic Black Holes & Black Hole Candidates
In the following Section, in ascending order of right ascension (RA), we provide: (i) a brief summary of the X-ray discovery; (ii) an outline of optical/IR, radio, and X-ray detections; (iii) an overview of the outburst history/long-term behavior; (iv) a summary of spectral and timing characteristics exhibited during outburst; (v) a discussion of the past estimates and currently accepted orbital parameters found through dynamical studies of the system; (vi) a justification of BH or BHC status, and (vii) an indication of our assigned BH certainty class, within parentheses in the subsection headers.
For a summary of primary source information, orbital parameters, and binary system information see Tables LABEL:table:primaryBH and LABEL:table:binaryBH.
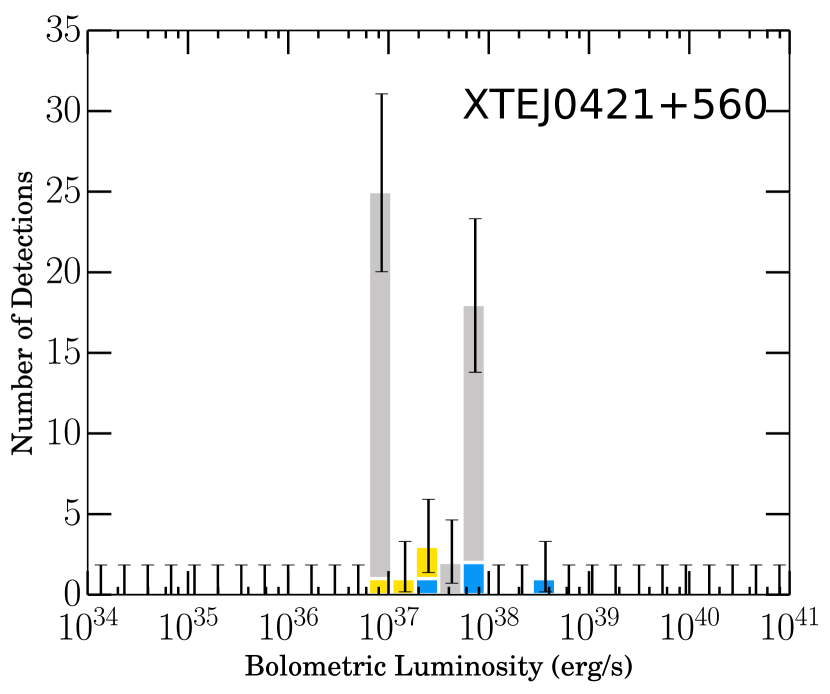
II.2.1 XTE J0421+560 (C)
XTE J0421+560 was discovered by the All-Sky Monitor (ASM) aboard RXTE, when it underwent its first and only outburst in 1998 (Smith et al., 1998a). The outburst peaked first in X-rays followed by optical and radio wavelengths, a behavior commonly associated with XRN. Several soft X-ray flares were observed after the initial flare (Frontera et al., 1998). The optical counterpart, CI Cam, is a B0-2 supergiant Be star (assuming a BH or NS accretor; Robinson et al. 2002), so the system is a HMXB.
The distance is quite uncertain, with distance estimates ranging from 1 kpc (Barsukova et al., 2006) to kpc (Robinson et al., 2002), and thus the X-ray luminosity is poorly constrained. This large uncertainty in luminosity has impacted accurate determination of the nature of both the mass donor and the accretor (Bartlett et al., 2013). If the distance is 2 kpc, the resulting X-ray luminosity would indicate the presence of a NS or BH (Belloni et al., 1999b), while a closer distance would suggest a white dwarf accretor (Orlandini et al., 2000; Ishida et al., 2004) and a B counterpart (Barsukova et al., 2006). Despite the uncertainty in its nature, we include this system in our BHC sample because its X-ray properties are similar to known BHXBs.
II.2.2 GRO J0422+32 (A)
GROJ0422+32 is an LMXB discovered in 1992 by BATSE on the Compton Gamma-ray Observatory (CGRO) when it underwent a FRED type outburst (Paciesas et al., 1992). The spectrum was well described by a hard power-law (Sunyaev et al., 1994) and timing analysis revealed properties commonly associated with the HCS (van der Hooft et al., 1999a), indicating that this was a “hard-only” outburst. The X-ray and optical light curves of this outburst were similar to 1A 062000, except that they showed two unusual optical mini-outbursts following the main burst in 1993, which were not detected in hard X-rays (Shrader et al., 1997; Callanan et al., 1995). A series of mini-outbursts, with a recurrence period of 120 days, were also detected in 1997 (Iyudin & Haberl, 1997).
Rigorous determination of binary parameters showed this system to contain a BH primary (Filippenko et al., 1995; Casares et al., 1995b) and an M1–4V optical counterpart (Harlaftis et al., 1999; Webb et al., 2000). The detection of a radio counterpart and evolution of its spectrum is discussed by Shrader et al. (1994). We adopt the distance derived by Gelino & Harrison (2003) of kpc.
There have been numerous discussions of the inclination of GRO J0422+32. Orosz & Bailyn (1995); Gelino & Harrison (2003); Reynolds et al. (2007); Filippenko et al. (1995) all estimate . However, (i) the light curve of Orosz & Bailyn (1995) exhibits shape changes between two different nights and a difference in mean magnitude of 0.05 suggesting it is probably in the active state (i.e., variable and poorly-defined light curve shape as a result of contributions from the accretion disk and/or jet; see Cantrell et al. 2010), (ii) Gelino & Harrison (2003) and Reynolds et al. (2007) find similar mean magnitudes in the and light curves, but because there is evidence for IR disk contamination in the former and no detection of ellipsoidal variability in the light curves of the latter, the conflicting results suggest that both authors’ light curves are in the active state, and, (iii) while Filippenko et al. (1995) find an , which is consistent with the above three results, they assume a normal mass M2V secondary.
As discussed in Kreidberg et al. (2012), only lower limits on the inclination may be derived if the light curves are in the active state, or if the secondary star is assumed to have a mass equal to or less than that of a main sequence star with the same radius. The latter limitation stems from the fact that the relationship between mass, radius, and surface temperature for a star which fills its Roche-lobe may be very different from that of a spherical star. Thus, if is known, assuming a standard mass for the secondary star’s spectral type (i.e., an upper limit) will result in overestimated , and therefore an overestimated . If is overestimated, then will be underestimated (for a fixed and ).
Several authors measure , including Casares et al. (1995a); Callanan et al. (1996); Beekman et al. (1997). However, all three make use of binned light curves. The act of binning light curves may flatten their shape, therefore implying a lower inclination. We therefore adopt the value of calculated by Kreidberg et al. (2012) by adjusting the value assuming the source is active. We adopt a from this corrected inclination.
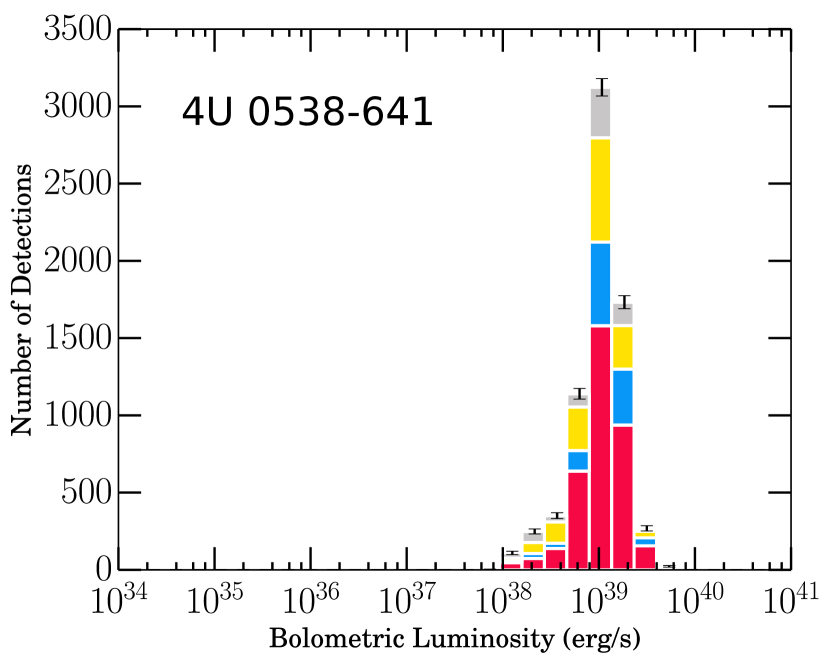
II.2.3 4U 0538641 (A) — LMC X-3
Commonly known as LMC X-3, it was discovered by the UHURU satellite in 1971 (Leong et al., 1971). LMC X-3 is one of three known persistently accreting, dynamically confirmed BHs in the Milky Way and Magellanic Clouds (McClintock & Remillard, 2006). From the large mass function, the absence of X-ray eclipses, and an estimated mass of the B3V optical counterpart, Cowley et al. (1983) calculated a lower limit on the mass, confirming the presence of a BH (Kuiper et al., 1988; Orosz et al., 2014).
LMC X-3 almost continuously maintains itself in a bright state like persistent HMXB wind-fed systems, but the BH is actually fed by Roche lobe overflow, similar to transient systems (Steiner et al., 2014). The X-ray spectrum is nearly constantly thermal and disk-dominated, spending most of its time in the SDS (Treves et al., 1988; Ebisawa et al., 1993; Nowak et al., 2001) with occasional transitions to the HCS (Wilms et al., 2001; Smale & Boyd, 2012). Due to its location in the Large Magellanic Cloud (LMC), the distance is well constrained (Cowley et al., 1983).
Recently, Orosz et al. (2014) established a new dynamical model for the system. More high quality radial velocity data (yielding an improved determination of -velocity) and an accurate measurement of the projected rotational velocity for the companion star, along with a much larger array of ellipsoidal light curves, have yielded a more precise and than previous studies.
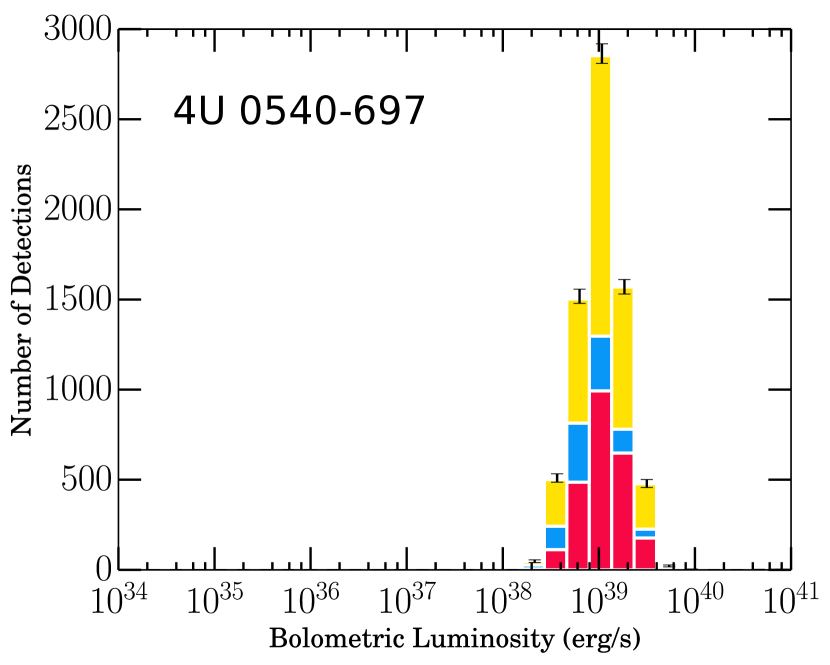
II.2.4 4U 0540697 (A) — LMC X-1
Commonly known as LMC X-1, it is among the three known persistently accreting, dynamically confirmed BHs in the Milky Way and Magellanic Clouds (McClintock & Remillard, 2006). Spectroscopic studies of the optical counterpart (Hutchings et al., 1983, 1987) established it as a firm BHC. However, the presence of a BH in this system was not confirmed until an accurate measurement of the mass function was made (Haardt et al., 2001).
Similar to LMC X-3, LMC X-1 has been observed to spend most of its time in the SDS (Ebisawa et al., 1993; Nowak et al., 2001). Given its location in the LMC (Cowley et al., 1983), the distance to the system is well determined (Freedman et al., 2001).
Orosz et al. (2009) have improved the dynamical model of Hutchings et al. (1987). High and medium resolution spectra have reduced the uncertainty in radial velocity amplitude by a factor of 6 and produced a secure value of the rotational line broadening. Additionally, they present the first optical light curves and infrared magnitudes and colors of LMC X-1, allowing strong constraints on the inclination of the system, as well as the temperature and radius of the companion star.
II.2.5 1A 062000 (A)
The X-ray transient 1A 062000 was discovered by the Ariel V Satellite during an outburst in 1975 (Elvis et al., 1975). A radio counterpart was detected almost two weeks into the outburst, remaining visible for approximately one week (Owen et al., 1976). Kuulkers et al. (1999) collected data from the 1975 outburst and found multiple (jet) ejections with expansion velocities in excess of , a behavior associated with BHXB systems (McClintock & Remillard, 2006). A previous outburst, occurring in 1917, was discovered retrospectively on photographic plates at the Harvard College Observatory (Eachus et al., 1976).
Oke (1977) identified the optical counterpart as a K5 dwarf. A radial velocity study of the bright, low-mass counterpart led to the measurement of the mass function, solidifying 1A 062000 as a strong BHC (McClintock & Remillard, 1986).
Many attempts have been made to measure inclination of the system: Haswell et al. (1993) found ; Shahbaz et al. (1994a) found ; Marsh et al. (1994) found ; Gelino et al. (2001c) found ; and Froning & Robinson (2001) found a wide range of inclinations () corresponding to different epochs of data. Overall inclination estimates remained inconsistent at best. The inconsistency stems from the highly asymmetric ellipsoidal variations in the light curve (Leibowitz et al., 1998) and contamination of the K-star flux by light from the accretion disk (Neilsen et al., 2008).
Cantrell et al. (2010) rectify these issues, making use of an extensive data set spanning a decade. They restrict their sample to light curves that are in the passive state (i.e., minimal aperiodic variability from accretion disk contributions) and those where the non-stellar luminosity (NSL) fraction and magnitude calibration are well constrained. They also require each light curve to maintain the same shape over its duration. As a result of fitting an 11 parameter model to the 8 remaining light curves, they estimate a weighted average of . We assume this value to be unbiased by systematic error (Kreidberg et al., 2012), and use this inclination along with inferred from it in our calculations. We also adopt the distance estimated by Cantrell et al. (2010), using their dynamical model, in our analysis.
II.2.6 GRS 100945 (A)
GRS 100945 was discovered by the GRANAT/WATCH ASM (Lapshov et al., 1993) and by BATSE aboard CGRO (Harmon et al., 1993a). It was shown to have an ultra-soft spectrum typical of BHXB systems (Kaniovsky et al., 1993). della Valle & Benetti (1993) discovered a blue optical counterpart that showed a spectral type of G5–K7 (della Valle et al., 1997; Filippenko et al., 1999). Further optical photometry revealed a secondary outburst 6 months later, followed by a series of “mini-outbursts”, reminiscent of BH XRN systems like GRO J0422+32 (Bailyn & Orosz, 1995).
While Filippenko et al. (1999) were able to obtain a mass function and mass ratio, their estimate of inclination assumed that the secondary is a K7–K8 star that is not under massive. Shahbaz et al. (1996b) performed an ellipsoidal variability analysis; however, because the light curve shows clear evidence of a significant non-stellar contribution and the star-only model fit yields a large , the light curve is likely active.
The inclination found by Shahbaz et al. (1996b) conflicts with the estimate by Filippenko et al. (1999), and the spectral type of the secondary is not clear. Assuming it is a G5V star, as suggested by della Valle et al. (1998), Kreidberg et al. (2012) find a lower limit on inclination of , consistent with their corrected estimate. We therefore adopt this inclination in our calculation of . Hynes (2005) discusses their preference for the distance estimate of kpc by Gelino (2002), which we also adopt.
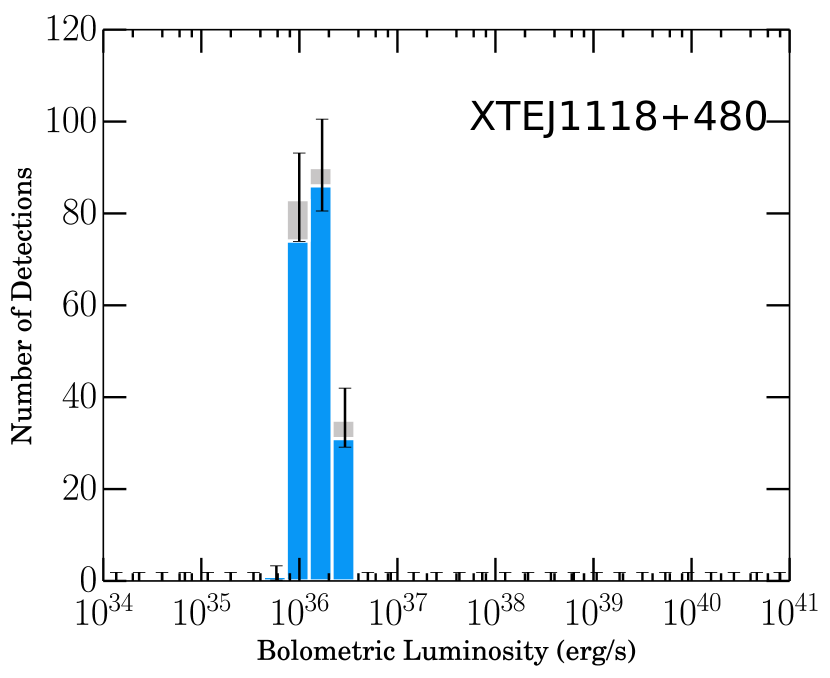
II.2.7 XTE J1118+480 (A)
XTE J1118+480 was discovered by RXTE/ASM in 2000 as a weak, slowly rising X-ray source (Remillard et al., 2000). Both optical (Uemura et al., 2000a, b) and radio (Pooley & Waldram, 2000) counterparts were quickly found. Strong low-frequency variability and a spectrum dominated by a hard power-law component extending past 100 keV (Revnivtsev et al., 2000b), accompanied by a persistently inverted radio spectrum (Hynes et al., 2000b), suggested it was a BHC in the HCS (Fender et al., 2001).
This outburst lasted 7 months and exhibited some complex behavior. After the first peak in January of 2000 (Remillard et al., 2000; Wren & McKay, 2000), the source decayed only to re-brighten to a plateau state (of similar brightness to the first peak; Uemura et al. 2000b) for 5 months (Brocksopp et al., 2010b). XTE J1118+480 remained in the HCS for the duration of the outburst, making it a “hard-only” outburst source (Brocksopp et al., 2004; Zurita et al., 2006).
Its second outburst was discovered in the optical (Zurita et al., 2005) and confirmed by X-ray and radio observations (Remillard et al., 2005; Pooley, 2005) in 2005. RXTE would confirm that the source again remained in the HCS for the duration of the outburst (Swank & Markwardt, 2005; Zurita et al., 2006). However, the 2005 event exhibited behavior more typical of a soft X-ray transient, with short lived jet ejections, a more dominant disk component to the spectrum, and a FRED type light curve (Brocksopp et al., 2010b).
Dynamical measurements establishing a very large mass function () confirmed a BH primary in this system (McClintock et al., 2001a; Wagner et al., 2001). Observations in quiescence have allowed refinement of the system parameters (Gelino et al., 2006; Gonzalez Hernandez et al., 2008); however, estimates of inclination have proven more challenging. While the consensus is that XTE J1118+480 has a high inclination, accurate measurements are challenging due to strong superhump modulation (for a discussion of superhumps in LMXBs, see Haswell et al. 2001) in addition to ellipsoidal variability (Zurita et al., 2002), and a large and variable NSL fraction (Wagner et al., 2001). The inclination measurements by Wagner et al. (2001), McClintock et al. (2001b), Zurita et al. (2002) and Gelino et al. (2006) all lie in the range . While these estimates are all consistent with each other, none are free of significant systematic errors (Kreidberg et al., 2012). Therefore, we adopt the full range of inclinations in our calculation of . We adopt the distance derived by Gelino et al. (2006) using their established dynamical model.
II.2.8 GS 1124684 (A)
The X-ray nova GS 1124684 was discovered by the GINGA ASM (Makino & the Ginga Team, 1991) and by the GRANAT/WATCH ASM (Lundt & Brandt, 1991) in 1991. It was observed extensively from radio to hard X-rays (Kitamoto et al., 1992). Its X-ray spectra and decay timescales similar to 1A 062000 (della Valle et al., 1991; Kitamoto et al., 1992), a known BH (McClintock & Remillard, 1986), established it as a firm BHC. The orbital period and radial velocity curve of the secondary by Remillard et al. (1992) established it as a dynamically confirmed BH. Orosz et al. (1996) refined the determination of the mass function, spectral type of the secondary, and inclination.
This estimate of inclination is both higher and less precise than the estimate in Gelino et al. (2001a). However, as there is clear evidence for non-stellar flux in the IR (Gelino et al., 2010) when the source was active, the difference may be due to the non-stellar contributions. Even though the source may have been passive during the Gelino et al. (2001a) observations, this does not guarantee a negligible NSL fraction. The Orosz et al. (1996) estimate is also higher than that of Shahbaz et al. (1994a). However, the Shahbaz et al. (1994a) best-fit inclination has a large , suggested to be the result of incorrect sky subtraction. Following Kreidberg et al. (2012), we adopt the inclination range given in Orosz et al. (1996) of in our calculation of .
II.2.9 IGR J113215311 (C)
The transient hard X-ray source IGR J113215311 was discovered by ISGRI aboard INTEGRAL in 2005 during a short flare lasting hours (Krivonos et al., 2005). During this time the source exhibited a very hard spectrum (), with no evidence for a break up to 300 keV leading Sguera et al. (2007) to suggest that it was probably a magnetar. However, Krivonos et al. (2005) suggest that the spectrum is reminiscent of a BHXB. Therefore, we include this source in our sample as a possible BHC.
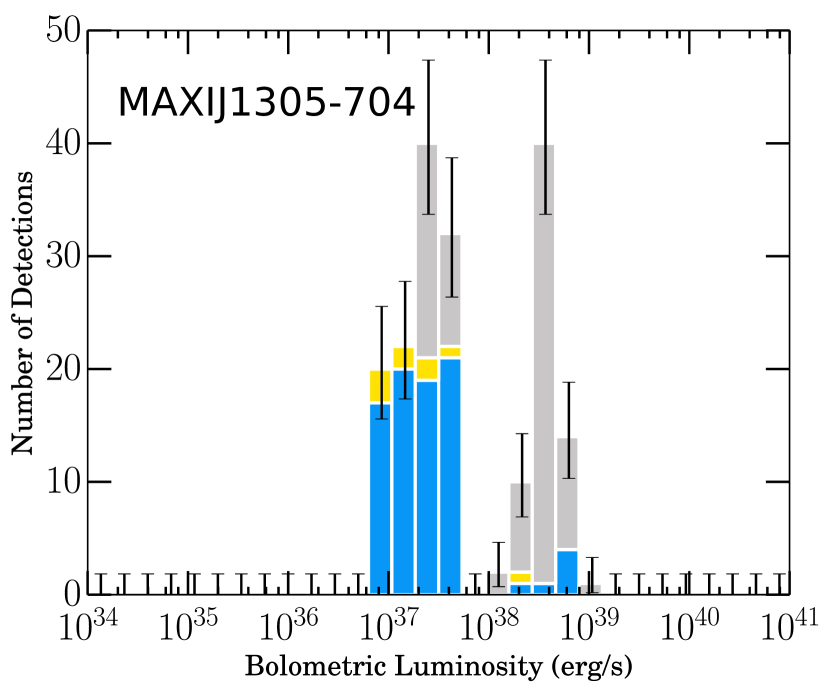
II.2.10 MAXI J1305704 (B)
The X-ray transient MAXI J1305704 was discovered by the Gas Split Camera (GSC) aboard MAXI in 2012 (Sato et al., 2012). This source was proposed to be a BHXB based on X-ray and optical spectra as well as light curve and hardness variations over time (Greiner et al., 2012; Kennea et al., 2012b; Suwa et al., 2012; Morihana et al., 2013). Kennea et al. (2012a, c) observed dip like features and Miller et al. (2012a, b) observed possible absorption line features. These dips and absorption profiles provide a strong indication that this source has a large inclination (Shidatsu et al., 2013).
Shidatsu et al. (2013) identified a 9.74 hr orbital period from the recurrence interval between absorption dips and inferred an inclination between , most likely as the source shows dips but no eclipses. A precise value of inclination has not yet been determined.
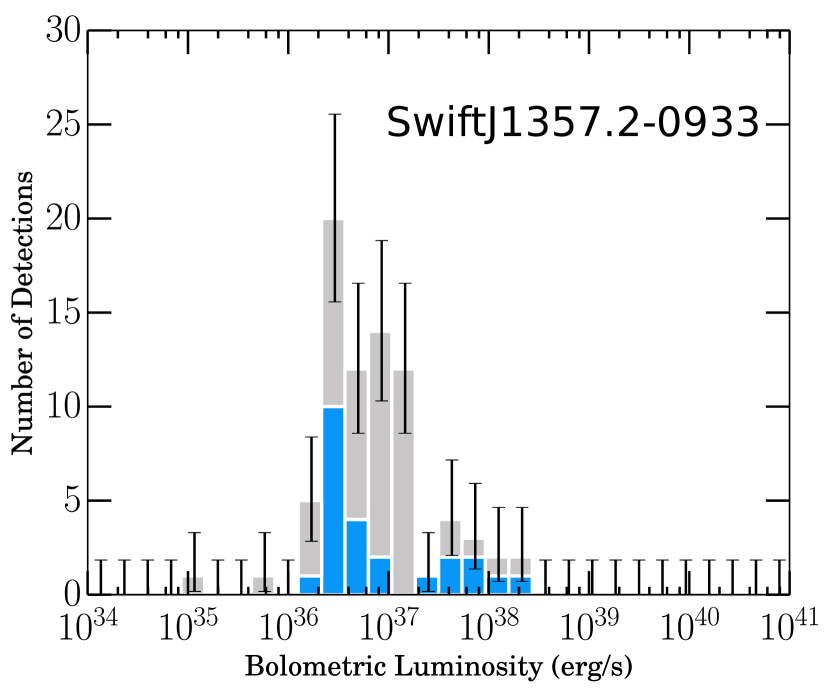
II.2.11 Swift J1357.20933 (A)
Swift J1357.20933, a new Galactic BHC (Casares et al., 2011), was discovered by the Swift/BAT in January of 2011 when it went into outburst (Krimm et al., 2011c). The source remained in the HCS for the duration of the outburst, classifying it as a “hard-only” outburst source (Armas Padilla et al., 2013a). Both the X-ray spectrum (Krimm et al., 2011a) and the magnitude difference (between quiescence and outburst) of the detected optical counterpart (Rau et al., 2011b) pointed to an LMXB nature.
Photometry from the Sloan Digital Sky Survey (SDSS) suggested an M4 counterpart (Rau et al., 2011b; Shahbaz et al., 2013). The distance is debated; Corral-Santana et al. (2013) suggest 1.5 kpc, but Shahbaz et al. (2013) compare the estimated magnitude of the companion (not detected) with the expected magnitude of an M4.5V star to infer a possible distance range from 0.5–6 kpc. Given this information, we choose to use 1.5 kpc as a lower limit and 6 kpc as an upper limit on the distance to this system.
Armas Padilla et al. (2013a) calculate the peak luminosity for the outburst (for a distance of 1.5 kpc) to be , making it the only confirmed BH Very Faint X-ray Transient555VFXTs are classified as systems with a peak (210 keV) (Wijnands et al., 2006). (VFXT; Armas Padilla et al. 2013a; Corral-Santana et al. 2013).
Corral-Santana et al. (2013) established , dynamically confirming this as a BH. Corral-Santana et al. (2013) also find an orbital period of 2.8 hours and presented an observation of intense dips in the optical light curve, which they explained as toroidal structure in the inner region of the disk, seen at high inclinations (), moving outward as the outburst progressed. This implies we may be observing the system close to edge on. In addition, Shahbaz et al. (2013) find evidence for quiescent optically thin synchrotron emission, which they discuss could possibly arise from a jet in the system.
II.2.12 GS 135464 (A)
In 1987 the GINGA ASM discovered GS 135464 in outburst (Makino, 1987). The X-ray spectrum was well fit with soft disk black body and hard power-law components (Kitamoto et al., 1990b) typical of X-ray transient outbursts, and suggestive of a BH nature (Brocksopp et al., 2001). The position of GS 135464 is consistent with two transient sources, Cen X-2 (Francey, 1971) and MX 135364 (Markert et al., 1979), which were observed in outburst in 1967 and 1972, respectively. Both sources show different X-ray spectral properties than the 1987 outburst of GS 135464. If all three were in fact the same source, then GS 135464 must show at least four different spectral states (Kitamoto et al., 1990b). Brocksopp et al. (2001) argue that this is not unfeasible as sources such as GX 3394 routinely show multiple state behaviors during outburst (McClintock & Remillard, 2006). We therefore assume all three are in fact the same source.
GS 135464 was again observed in outburst in 1997 (Revnivtsev et al., 2000a; Brocksopp et al., 2001). During this time, optical (Castro-Tirado et al., 1997), IR (Soria et al., 1997), and radio (Fender et al., 1997c) counterparts were detected. The radio source was too faint to detect extended structure. However, analysis of the radio spectrum showed a weak flat synchrotron spectrum, which suggested possible mass ejections in the form of a jet (Brocksopp et al., 2001). This source has recently (2015 June) gone into outburst for the fifth time, where it has been detected across X-ray (Miller et al., 2015a, b), optical (Russell & Lewis, 2015), and radio (Coriat et al., 2015) wavelengths.
While the first and third outbursts of GS 135464 show very soft X-ray spectra (Brocksopp et al., 2001, 2004), the second and fourth events display spectra dominated by a hard power-law, typical of XRBs in the hard state, indicating the source did not reach the softer states in these cases (i.e., “hard-only” outbursts; Revnivtsev et al. 2000a; Brocksopp et al. 2001).
Casares et al. (2004) obtained the first radial velocity curve of the optical counterpart, BW Cir, identified its spectral type, mass ratio, period, and in turn a mass function of , confirming a BH primary. Casares et al. (2009) infer a lower limit on the distance of 25 kpc (from the companion’s luminosity) and estimate an upper limit of 61 kpc (assuming a BH) from calculations by Kitamoto et al. (1990b). We take the distance to be characterized by a uniform distribution between 25 and 61 kpc for the purpose of our analysis.
While Casares et al. (2009) have multi-wavelength photometry and spectroscopy between 1995 and 2003 of the source, the data is characterized by strong aperiodic variability without discernible ellipsoidal modulation. Therefore, no lower limit on inclination can be found. From the spectral type and eclipse limits Kreidberg et al. (2012) find We take as the upper limit on the inclination of GS 135464 to calculate a lower limit on the mass of the system.
II.2.13 1A 152462 (B)
The X-ray transient 1A 152462 was discovered by Ariel V (Pounds, 1974) and has been observed in outburst twice. It is considered to be a BHC due to its ultra-soft spectrum, bi-modal spectral behavior, and absence of type I X-ray bursts.
The 1990 outburst was observed in both the hard (Barret et al., 1992) and soft (ROSAT All-Sky Survey; RASS) X-rays. The soft X-ray spectrum could be fit equally well by a cool black body or a power-law. The presence of an ultra-soft component to the spectrum could not be ruled out (Barret et al., 1995). However, the outburst was insufficient to trigger the soft X-ray ASMs (WATCH and Ginga) and Ginga provided an upper limit consistent with the ROSAT detection (Barret et al., 1995; Brocksopp et al., 2004). For these reasons we include this outburst as a possible “hard-only” outburst (Brocksopp et al., 2004).
Murdin et al. (1977) identify a possible optical counterpart. From similarities with 1A 062000, Murdin et al. (1977) estimate a distance of 3 kpc, while van Paradijs & Verbunt (1984) propose 4.4 kpc assuming and E(BV)=0.7. We adopt 3 kpc as a lower limit, set the upper limit to 8 kpc and take 4.4 kpc as the most likely value.
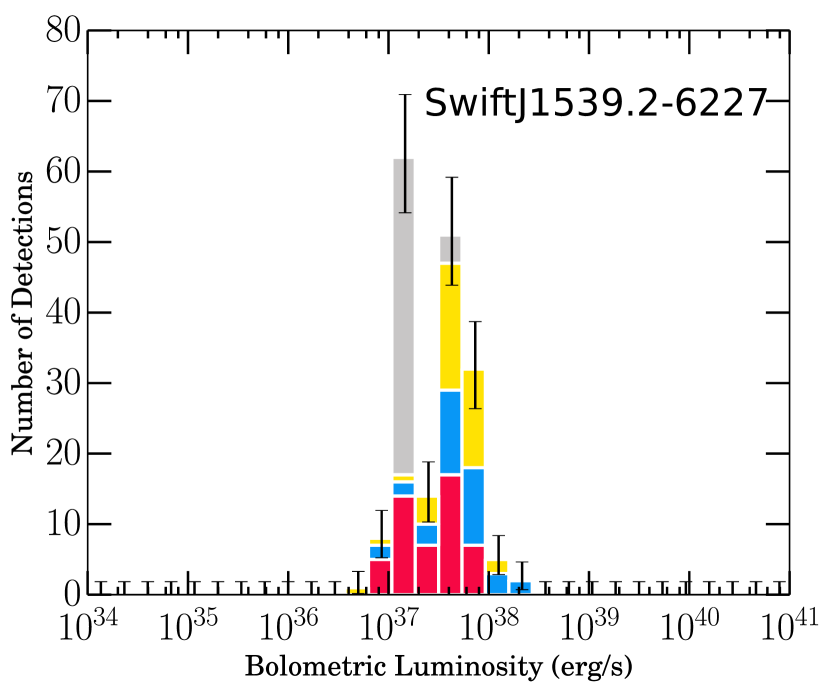
II.2.14 Swift J1539.26227 (B)
Swift J1539.26227 was discovered by Swift/BAT in 2008 (Krimm et al., 2008c). Krimm et al. (2011b) present the complete evolution of spectral and timing properties during the outburst, including the rise of the disk component in the SDS and power density spectra signatures of transitions between the HCS and SDS. These features, coupled with a lack of observed pulsations, establish the source as a possible BHC (Krimm et al., 2013b).
Torres et al. (2009a) performed optical spectroscopy and found a possible optical counterpart with a blue continuum. No Balmer lines, He II 4686Å or Bowen blend emission were detected. Krimm et al. (2011b) suggest that the lack of emission features in the outburst spectrum paired with the faintness of the source in quiescence points to a low mass main sequence or degenerate donor star companion to the compact accretor.
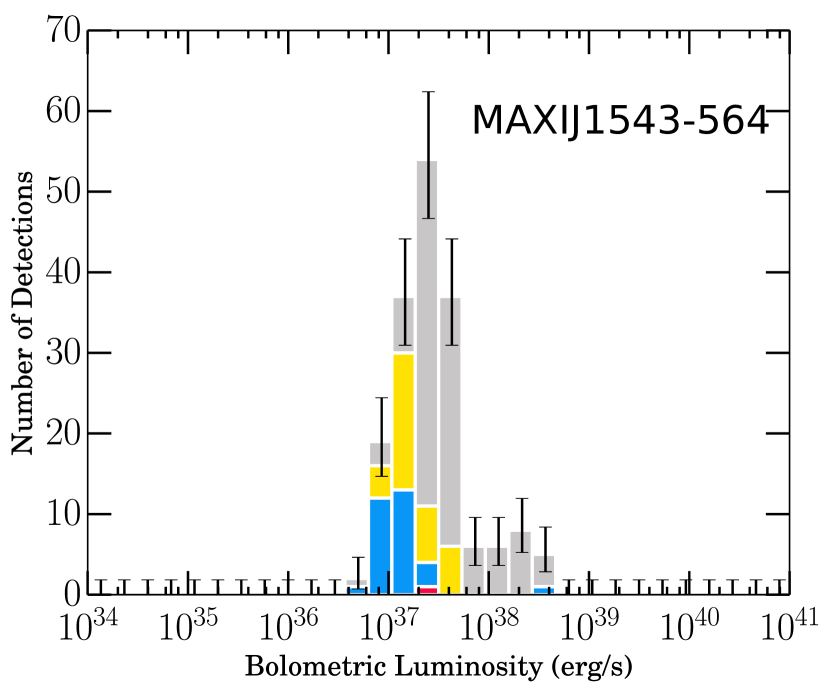
II.2.15 MAXI J1543564 (B)
MAXI J1543564 was discovered by the GSC aboard MAXI in 2011 (Negoro et al., 2011a). Type-C QPOs, and an observed decrease in fractional rms and hardness ratios and steepening of the photon index during the outburst led Munoz-Darias et al. (2011) to classify the source as a BHC. Stiele et al. (2012) present a full spectral and timing analysis. Miller-Jones et al. (2011a) detect a radio counterpart with an optically thin spectrum.
Three possible optical/IR counterparts have positions consistent with the XRT, ATCA, and Chandra error circles (Russell et al., 2011a; Rau et al., 2011a; Rojas et al., 2011; Chakrabarty et al., 2011). None of these three candidates show any variability (Russell et al., 2011a; Rau et al., 2011a; Rojas et al., 2011), leaving the optical counterpart unknown.
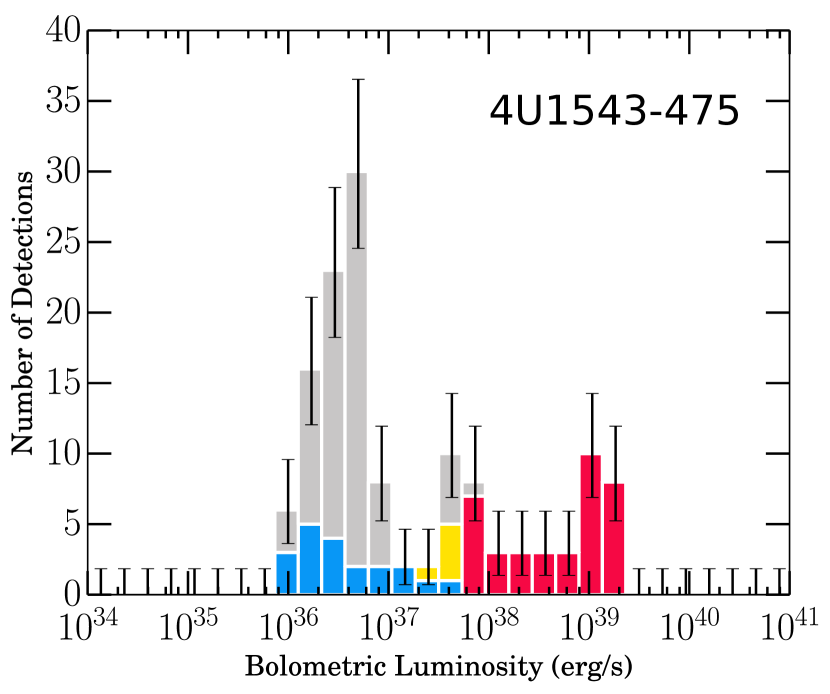
II.2.16 4U 1543475 (A)
4U 1543475 is a recurrent X-ray transient discovered in 1971 (Matilsky et al., 1972), and also observed in outburst in 1983 (Kitamoto et al., 1984), 1992 (Harmon et al., 1992), and 2002 (Park et al., 2004; Kalemci et al., 2005). 4U 1543475 displayed classical Soft X-ray Transient (SXT) behavior during the first, second, and fourth outbursts (Matilsky et al., 1972; Kitamoto et al., 1984; Park et al., 2004). However, hard X-ray observations during the third event reveal a power-law spectrum (Harmon et al., 1992). Unfortunately, there are no soft X-ray observations of this source during the 1992 outburst. Following Brocksopp et al. (2004) we include this outburst as a possible “hard-only” outburst. Overall, the observation of a wide array of spectral features make 4U 1543475 a strong BHC (Orosz et al., 1998b).
4U 1543475 is one of the few sources that has near-simultaneous photometry and spectroscopy (Kreidberg et al., 2012). The optical counterpart, IL Lupi, was discovered by Pederson (1983) and classified as spectral type A2V (Chevalier & Ilovaisky, 1992). A radio counterpart was detected by Hunstead & Webb (2002).
4U 1543475 has been subject to many detailed dynamical studies (Orosz et al., 1998b, 2002; Orosz, 2003), confirming its BH primary. However, when estimating inclination, Orosz et al. (1998b) include the mass ratio as a free parameter, which results in a large source of error (Kreidberg et al., 2012).
A more precise inclination measurement is in a conference proceeding (Orosz et al., 2002), however, there is no formal published record of the light curve. We therefore follow Kreidberg et al. (2012) in taking the inclination estimates from Orosz et al. (1998b) as the boundaries for a uniform distribution. A precise measurement of distance is found in Ozel et al. (2010).
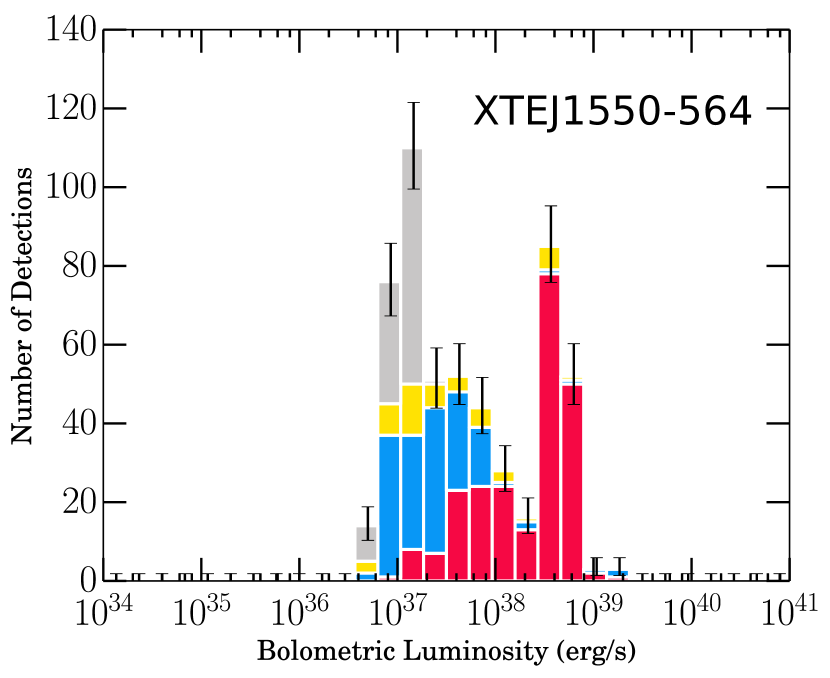
II.2.17 XTE J1550564 (A)
The Galactic microquasar666A microquasar is an XRB system that is known to reach near Eddington luminosity and launch discrete jet ejecta, similar to the behavior of AGN. XTE J1550564 was discovered by the RXTE ASM (Smith, 1998). Shortly after discovery, optical (Orosz et al., 1998a), and radio (Campbell-Wilson et al., 1998) counterparts were detected along with a superluminal ejection observed in the radio (Hannikainen et al., 2001). Observations of rapid X-ray variability, hard spectrum, and the absence of X-ray bursts or pulsations suggested a BHC (Cui et al., 1999).
Later, Orosz et al. (2002) confirmed the BH nature of the primary. It has been seen in outburst five times: 1998/1999 (Sobczak et al., 2000; Remillard et al., 2002; Kubota & Makishima, 2004), 2000 (Rodriguez et al., 2004; Kalemci et al., 2001; Miller et al., 2001b; Tomsick et al., 2001a), 2001 (Tomsick et al., 2001b), 2001/2002 (Belloni et al., 2002) and 2003 (Sturner & Shrader, 2005; Aref’ev et al., 2004). Radio observations during the 2001/2002 outburst by Corbel et al. (2002) confirmed the presence of a hard state jet spectrum.
The first two outbursts showed the typical “turtlehead” pattern through BH states. Complete spectral and timing analysis for the 1998/1999 and 2000 outbursts can be found in Sobczak et al. (2000); Homan et al. (2001); Cui et al. (1999); Remillard et al. (1999a) and Tomsick et al. (2001a); Miller et al. (2001b); Kalemci et al. (2001); Belloni et al. (2002), respectively. The last three have been shown to be under-luminous “hard-only” outbursts (Tomsick et al., 2001b; Swank et al., 2002; Belloni et al., 2002; Corbel et al., 2002; Sturner & Shrader, 2005).
Orosz et al. (2011b) provide an improved dynamical model including , , , and . They have determined an inclination using photometry and spectroscopy over 7 years of data. However, they use NSL fractions determined at a different time than the photometry measurements, which can produce unreliable inclination measurements (Kreidberg et al., 2012). Orosz et al. (2011b) acknowledge the uncertainty and fit a model, which includes a disk and four free parameters, using eight different combinations of light curves and NSL fractions. They find a reasonably narrow possible range in inclination of . Following Kreidberg et al. (2012), we adopt an isotropic distribution over this range for our inclination, a mass ratio uniformly distributed over the range given in Orosz et al. (2011b), and use these values to calculate a .
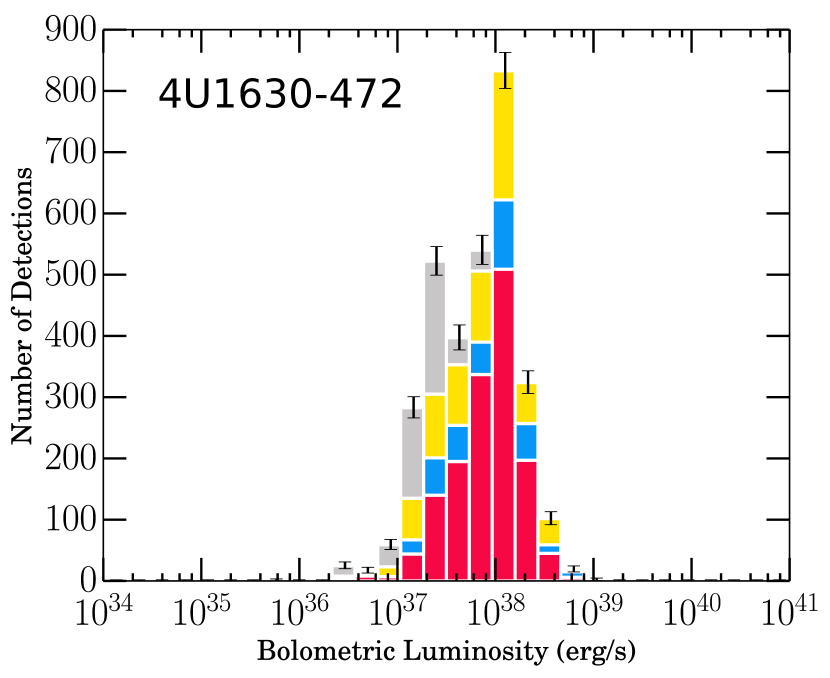
II.2.18 4U 1630472 (B)
The recurrent X-ray transient 4U 1630472 was discovered by the VELA 5B and UHURU satellites (Priedhorsky, 1986; Jones et al., 1976). Over the last 46 years, 4U 1630472 has undergone 23 outbursts occurring quasi-regularly ( 600–700 days; Kuulkers et al. 1997a) and exhibiting a wide range of complex outburst behavior (see Table LABEL:table:outhistBH for a complete list of references for each outburst).
Highly polarized radio emission was observed in 1998, confirming the presence of jets (Hjellming et al., 1999c). The most recent studies of the radio jets in 4U 1630472 discuss possible baryonic matter content within the jets (Díaz Trigo et al., 2013; Neilsen et al., 2014). An additional outflow, in the form of an accretion disk wind, has also been detected in this source (Ponti et al., 2012; Diaz Trigo et al., 2014).
No optical counterpart is known, most likely due to its high reddening and crowded field (Parmar et al., 1986) resulting in difficulty performing optical and infrared studies. While no compact object mass is known, McClintock & Remillard (2006) classify it as a very likely class “A” BHC. It is considered likely to contain a BH based on spectral properties (Parmar et al., 1986) and fast timing behavior (Kuulkers et al., 1997b).
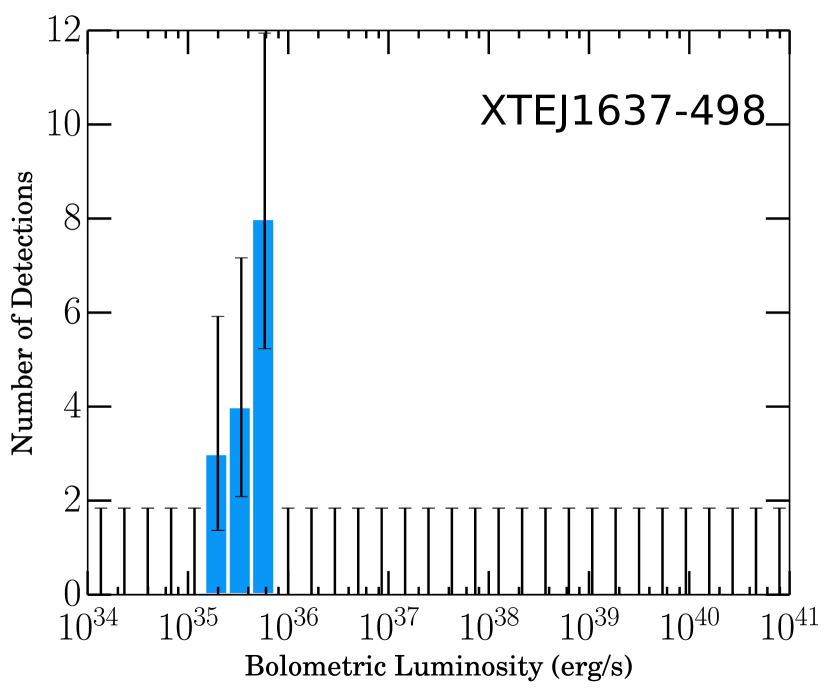
II.2.19 XTE J1637498 (C)
The X-ray transient XTE J1637498 was discovered by PCA aboard RXTE during a regular scan of the Galactic bulge and ridge regions in 2008 (Markwardt et al., 2008c). During this time, the source was also detected as a weak source with Swift/BAT (Private Communication with H. Krimm). Wijnands et al. (2008) obtained an X-ray spectrum described by an absorbed power-law with a photon index of 1.5, which is consistent with the source being a LMXB, but due to the large errors on the spectral parameters they stress that other types of systems cannot be excluded. Curran et al. (2011a) identify a possible optical/IR counterpart. Given the uncertain nature of this object, we include XTE J1637498 in our sample as a possible BHC.
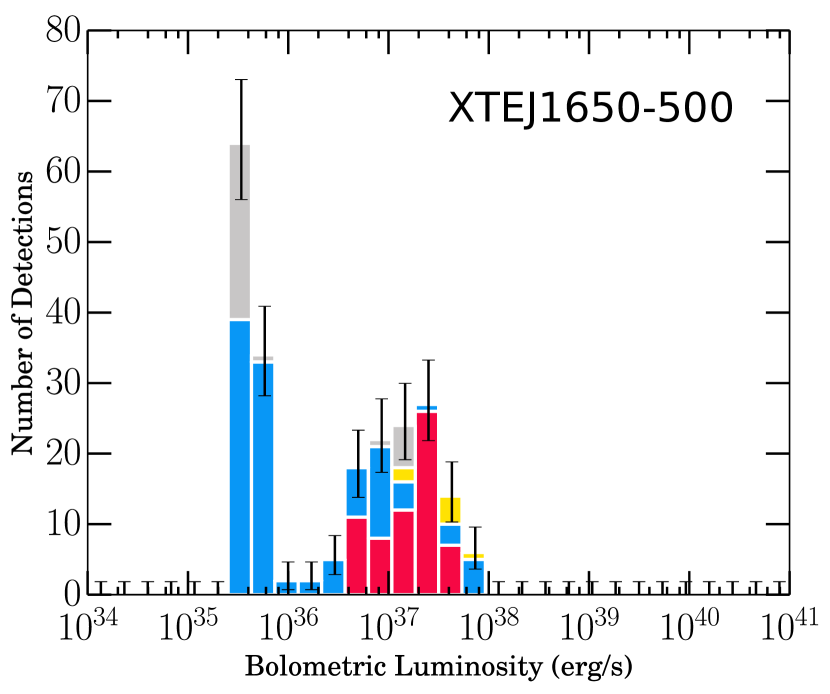
II.2.20 XTE J1650500 (A)
XTE J1650500 is a soft X-ray transient that was discovered by the ASM aboard RXTE in 2001 (Remillard, 2001). The X-ray spectrum (Markwardt et al., 2001), power density spectra (Revnivtsev & Sunyaev, 2001; Wijnands et al., 2001), evolution through the “turtlehead” pattern of accretion states (Rossi et al., 2004; Tomsick et al., 2004), and observation of QPOs (Homan & Wijnands, 2003; Kalemci et al., 2003) during the outburst confirmed the source to be a BHC.
The optical counterpart was discovered by Castro-Tirado et al. (2001), confirmed by Groot et al. (2001); Augusteijn et al. (2001), and later classified as a star of spectral type G5–K4III (Orosz et al., 2004). The radio counterpart was discovered by Groot et al. (2001), and Corbel et al. (2004) observed the source at radio frequencies for the duration of the outburst, finding evidence for the existence of a steady compact jet. An additional outflow, in the form of an accretion disk wind, has also been detected in this source (Miller et al., 2004; Ponti et al., 2012).
Further optical observations of the source revealed the , , and for the system (Orosz et al., 2004). While Orosz et al. (2004) are able to determine a lower limit on the inclination of , by fitting a star only model with photometry obtained between May and August of 2003, Kreidberg et al. (2012) suggests that the source was active during this time, as there was more scatter in the light curve than one would expect from photometric errors alone. Therefore they use this lower limit to calculate their own corrected inclination. We adopt their estimate of .
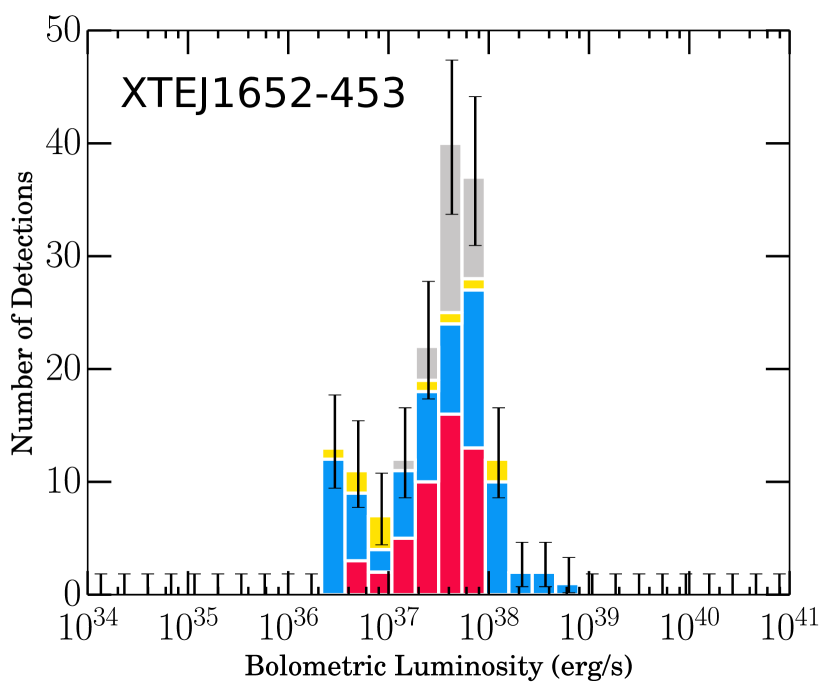
II.2.21 XTE J1652453 (B)
The transient source XTE J1652453 was discovered in 2009 during PCA monitoring of the Galactic region (Markwardt et al., 2009b). Further observations showed a quickly rising flux and an X-ray spectrum that evolved from a soft disk blackbody (Markwardt & Swank, 2009; Markwardt & Beardmore, 2009) to a hard power-law (Coriat & Rodriguez, 2009), which suggested a BHC (Han et al., 1999). For complete spectral and timing analysis of the outburst, see Han et al. (1999) and Hiemstra et al. (2011).
Near-IR observations show at least two possible counterparts (1.8 ″from each other) within the XRT and ATCA error circles (Calvelo et al., 2009; Markwardt & Beardmore, 2009; Reynolds et al., 2009). While the ATCA observation favors the fainter of the two as the probable counterpart, further near IR observations have detected no significant variability in this source, suggesting that it may be an unrelated interloper star (Torres et al., 2009c). No conclusive argument has been made regarding the true counterpart.
A radio counterpart was detected by Calvelo et al. (2009), whose observations indicated emission from the decay of an optically thin synchrotron event associated with the activation of XTE J1652453.
II.2.22 GRO J165540 (A)
GRO J165540 was discovered in 1994 by BATSE aboard CGRO (Harmon et al., 1995). Radio jets travelling with apparent superluminal motion were discovered (Tingay et al., 1995; Hjellming & Rupen, 1995), allowing for a precise measurement of distance to the source777Note that the jets of GRO J1655-40 only give a geometric distance because they are seen to precess. Otherwise, two-sided jets can only give upper limits on distances. See Section I.1 and Mirabel & Rodriguez (1999). (Hjellming & Rupen, 1995).
GRO J165540 underwent additional outbursts in 1996/1997, exhibiting complex multi-peak behavior (Zhang et al., 1997; Sobczak et al., 1999; Remillard et al., 1999b), and 2005 (Saito et al., 2006; Shaposhnikov et al., 2007; Brocksopp et al., 2006; Cabellero Garcia et al., 2007; Joinet et al., 2008; Migliari et al., 2007; Diaz Trigo et al., 2007), in which variable radio emission was detected again (Rupen et al., 2005a, c, b; Brocksopp et al., 2006).
An additional outflow, in the form of an accretion disk wind, has also been detected in this source (Miller et al., 2006b, 2008). The magnetically driven wind in GRO J165540 (Kallman et al., 2009) has the largest known mass loss rate of all BH sources in which such winds have been detected (Ponti et al., 2012).
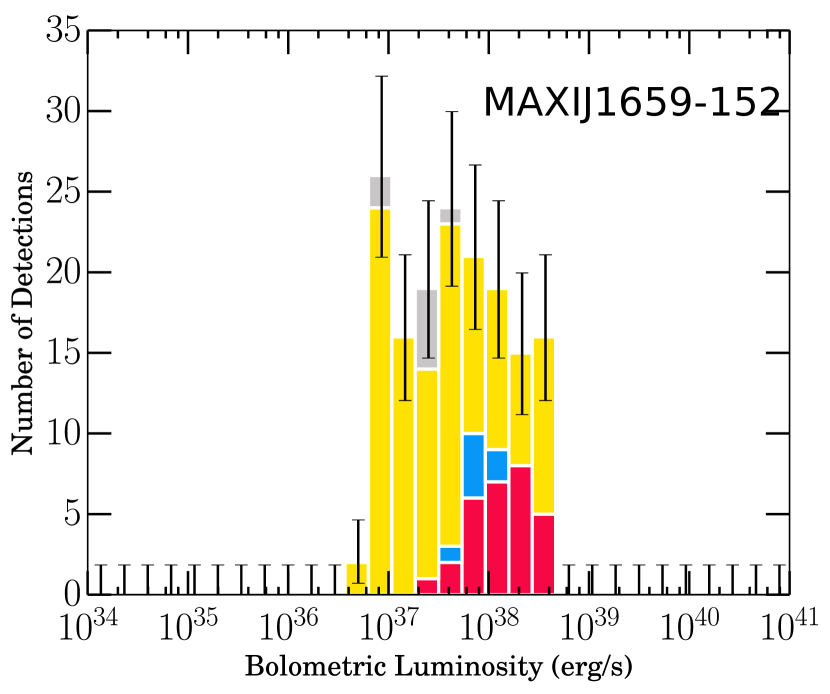
II.2.23 MAXI J1659152 (B)
MAXI J1659152 was detected by Swift/BAT (Mangano et al., 2010b) and MAXI (Negoro et al., 2010) in 2010. Optical spectroscopy proved the Galactic origin of the source and its X-ray binary classification (de Ugarte Postigo et al., 2010; Kaur et al., 2012). It was established as a BHC by observations of fast timing behavior, similar to other BH transients (Kalamkar et al., 2011; Kennea et al., 2011a; Muñoz-Darias et al., 2011; Yamaoka et al., 2012). Its orbital period of 2.4 hours (Kuulkers et al., 2010; Kennea et al., 2011a; Kuulkers et al., 2013) makes MAXI J1659152 the shortest period BHXB source known (Kennea et al., 2010).
Kuulkers et al. (2013) constrain its inclination between , from the obscuration of 90% of the total emission on cyclical timescales, as well as the absence of eclipses. Mass estimates range from 2.2– (Kennea et al., 2011a; Yamaoka et al., 2012; Shaposhnikov et al., 2012b).
Distance estimates range from 1.6–4.2 kpc (Miller-Jones et al., 2011b) and 8.6 kpc (Yamaoka et al., 2012). We take a range from 1.6 to 8 kpc in our analysis. A possible optical counterpart (Kong et al., 2010a; Kong, 2012) has a spectral type between M2 and M5 (Miller-Jones et al., 2011b; Kong, 2012; Kuulkers et al., 2013).
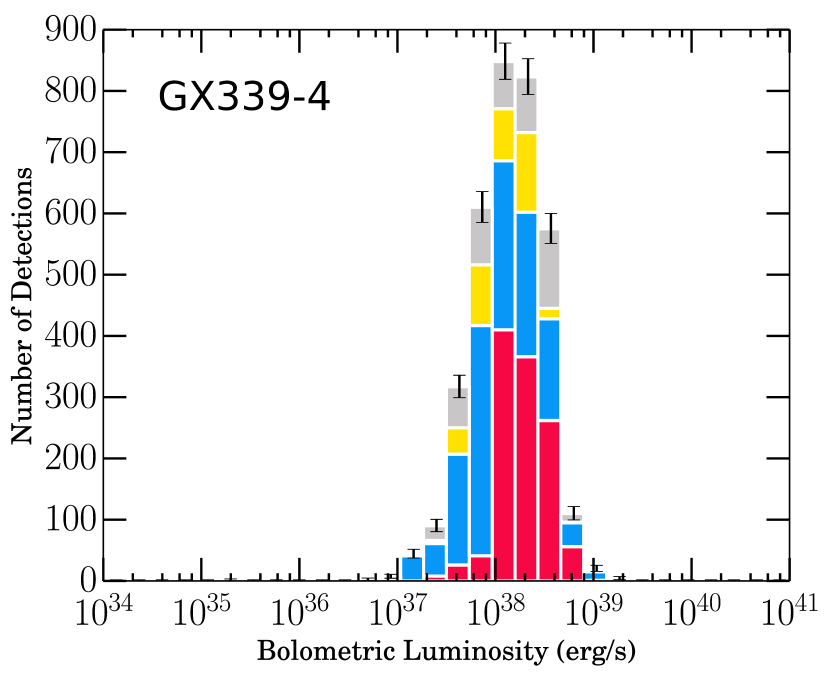
II.2.24 GX 3394 (A)
The Galactic X-ray binary GX 3394, discovered in 1972 by the MIT X-ray detector aboard the Orbiting Solar Observatory (OSO) 7 satellite (Markert et al., 1973), is the most extensively studied transient Galactic BHXB system (Zdziarski et al., 2004). Over 43 years, GX 3394 has undergone 20 outbursts in which the entire array of spectral accretion states have been observed (Belloni et al., 1999a). GX 3394 has undergone numerous hard state outbursts, making it a “hard-only” outburst source (Rubin et al., 1998; Kong et al., 2002; Buxton et al., 2012; Belloni et al., 2013). For a complete list of references for each outburst see Table LABEL:table:outhistBH.
The secondary star is not clearly detected during quiescence, with most of the observed optical emission originating from the accretion disk. Its LMXB nature has been inferred from the upper limits on the luminosity of this companion star (Shahbaz et al., 2001). The system was classified as a BHC (Zdziarski et al., 1998; Sunyaev & Revnivtsev, 2000) from its spectral and temporal characteristics. Fluorescence spectroscopy of NIII and He II emission lines during outburst, formed on the donor star surface due to X-ray irradiation, allowed Hynes et al. (2003) to measure and put an upper limit on and a lower limit on the mass function of .
The radio source associated with GX 3394 was discovered by Sood & Cambell-Wilson (1994) in 1994. Wilms et al. (1999) argued that the radio emission could come from a compact self-absorbed jet. The picture of the radio jet existing only in the hard states, and being quenched in the soft states (Fender et al., 1999a, 2004), and disk-jet coupling implied from observed X-ray-Radio correlations (Hannikainen et al., 1998; Corbel et al., 2000, 2003; Markoff et al., 2003; Homan et al., 2005; Corbel et al., 2013), arose from numerous observations of GX 3394.
An additional outflow, in the form of an accretion disk wind, has also been detected in this source (Miller et al., 2004; Ponti et al., 2012).
Hynes et al. (2004) (based on optical spectra) argue that GX 3394 is located beyond the Galactic tangent point (implying a lower limit of kpc) and favor kpc. However, Zdziarski et al. (2004) prefer GX 3394 to be in the Galactic bulge, and use optical/IR data to estimate a favored distance of 8 kpc, a result still consistent with the lower limit given by Hynes et al. (2004). We adopt the Zdziarski et al. (2004) estimate.
II.2.25 H 1705250 (A)
H 1705250 was discovered by the ASMs aboard the Ariel V (Griffiths et al., 1978) and HEAO 1 satellites (Kaluzienski & Holt, 1977). The optical counterpart, discovered on plates taken at the Anglo-Australian Telescope and UK Schmidt Telescope (Longmore et al., 1977; Griffiths et al., 1978), is a star of spectral type K3–7V (Harlaftis et al., 1997).
The light curve behavior and observed soft (Griffiths et al., 1978) and hard (Wilson & Rothschild, 1983) components to the spectrum resembled that of other SXTs (Martin et al., 1995). This evidence, along with a dynamical mass function measurement of (Filippenko et al., 1997) led to the confirmation of a BH primary.
Martin et al. (1995) made the first inclination measurement of H 1705250 to be . Remillard et al. (1996) obtained a conflicting result of . However, the former only show folded light curves and the latter analyzed a light curve which exhibits uneven maxima. Due to the uncertainty as to whether the source was active or passive during these observations, we agree with Kreidberg et al. (2012) and adopt the Martin et al. (1995) as a lower limit on the inclination, yielding an upper limit on . As the source does not eclipse, is not a dipper or an accretion disk corona source, we estimate a lower limit on by taking . The distance to the source is quoted in Barret et al. (1996a).
II.2.26 IGR J170913624 (B)
IGR J170913624 was discovered by INTEGRAL in 2003 (Kuulkers et al., 2003). Spectral analysis of the outburst revealed typical state transition behavior (i.e., “turtlehead”), where the X-ray emission softened as the outburst progressed (Lutovinov & Revnivtsev, 2003; Capitanio et al., 2006). IGR J170913624 has been classified as a probable BHC (Lutovinov & Revnivtsev, 2003).
An archival search of TTM-KVANT and BeppoSAX Wide Field Camera (WFC) data revealed previous outbursts in 1994, 1996, and 2001 (Revnivtsev et al., 2003; in’t Zand et al., 2003; Capitanio et al., 2006). The radio counterpart showed a flux increase over two weeks and an inverted spectrum, characteristic of a compact jet (Capitanio et al., 2009b). An accretion disk wind has also been detected (King et al., 2012b).
Two more outbursts have been reported, in 2007, showing spectral behavior typical of a BHC (Capitanio et al., 2009b), and 2011–2013 (Capitanio et al., 2012). The most recent outburst has been well studied across the X-ray regime (Krimm & Kennea, 2011; Rodriguez et al., 2011b; Del Santo et al., 2011; Capitanio et al., 2011, 2012). Radio observations again revealed evidence for a self-absorbed compact jet (Torres et al., 2011; Corbel et al., 2011; Rodriguez et al., 2011a) as well as discrete jet ejections (Rodriguez et al., 2011a). This outburst, unlike the others, showed peculiar pseudo periodic flare-like events (“heartbeats”) (Altamirano et al., 2011a) closely resembling those observed in GRS 1915+105 (Altamirano et al., 2011b, c; Belloni et al., 2000).
II.2.27 IGR J170983628 (B)
The transient IGR J170983628 was discovered by INTEGRAL in 2005 (Grebenev et al., 2005b), and remained detectable until 2007. The source was also briefly detected in 2009 (Prat et al., 2009). Its evolution in brightness and spectral shape (Grebenev et al., 2005a; Capitanio et al., 2009b) formed the basis for its BHC classification (Grebenev et al., 2007). Probable radio (Rupen et al., 2005e) and optical (Steeghs et al., 2005a) counterparts have been detected for this source.
II.2.28 SAX J1711.63808 (C)
The transient SAX J1711.63808 was discovered by the WFC aboard BeppoSAX in 2001 (in ’t Zand et al., 2001). The Galactic latitude, flux, spectral, and timing properties confirmed the XRB nature of SAX J1711.63808, while the lack of observation of type I X-ray bursts and lack of coherent oscillations along with the appearance of a broad Fe-K emission feature suggested that the primary could be a BH (in’t Zand et al., 2002c; Wijnands & Miller, 2002). McClintock & Remillard (2006) classify the system with a grade “B” likelihood of harbouring a BH.
The spectrum, which was dominated by a Comptonized continuum, and timing properties of SAX J1711.63808 indicate that it never left the HCS during outburst, making it one of the “hard-only” outburst sources (in’t Zand et al., 2002c).
The search for an optical counterpart has proven difficult due to large extinction (in’t Zand et al., 2002c).
II.2.29 Swift J1713.44219 (C)
The transient Swift J1713.44219 was discovered by Swift/BAT in 2009 (Krimm et al., 2009b). Unfortunately, due to Sun constraints the source could not be observed by Swift/XRT or UVOT, and was only visible with PCA for 3 days. The PCA spectrum was well fit with a power-law of photon index , and timing analysis revealed strong, aperiodic variability in the power spectrum, both of which point to a possible BH transient in the HCS (Krimm et al., 2013b). For this reason, we include Swift J1713.44219 in our sample as a possible BHC.
II.2.30 XMMSL1 J171900.4353217 (C)
The hard X-ray transient XMMSL1 J171900.4-353217 was discovered in an XMM-Newton slew (Read et al., 2010a). Markwardt et al. (2010) argued for its association with XTE J1719356, a faint transient seen by PCA aboard RXTE in the same month (Markwardt et al., 2010). Decreases in flux (Armas Padilla et al., 2010a) and re-brightening events (Armas Padilla et al., 2010b) were observed in the source over the course of a few months, further indicating its transient nature. As no definitive arguments have been made regarding the nature of the compact object, we include XMMSL1 J171900.4353217 in our sample as a possible BHC.
II.2.31 XTE J1719291 (C)
XTE J1719291 was discovered by the RXTE/PCA bulge scans in 2008 (Markwardt & Swank, 2008). Over 46 days, it showed both flux decreases and rebrightening events (Markwardt & Swank, 2008; Degenaar et al., 2008a, b). Later, Degenaar & Wijnands (2008) (with Swift/XRT observations) observed large X-ray variability during an outburst that lasted almost two months.
Greiner et al. (2008) found a possible optical counterpart, deriving a spectral type K0V or later. Armas-Padilla et al. (2011) put constraints on the orbital period ( hrs) and calculated a long-term mass transfer rate of if it does contain a BH.
Assuming a distance of 8 kpc, Armas-Padilla et al. (2011) estimate that XTE J1719291 would have had a 2–10 keV peak luminosity of during its 2008 outburst, therefore classifying the system as a VFXT.
To date, no conclusive evidence is available about the nature of the accretor. As such, we include XTE J1719291 in our sample as a possible BHC.
II.2.32 GRS 1716249 (GRO J171924; B) — X-ray Nova Ophiuchi
X-ray Nova Ophiuchi (GRS 1716249) was discovered in 1993 by SIGMA aboard the GRANAT satellite (Ballet et al., 1993) and BATSE aboard CGRO (Harmon et al., 1993b). Follow up observations discovered the optical and radio counterparts, derived the distance, and suggested that GRS 1716249 was a LMXB system (della Valle et al., 1994).
The X-ray spectrum was comparable to Cyg X-1 in the hard state (Revnivtsev et al., 1998b), and the power spectra showed a QPO which varied in frequency (van der Hooft et al., 1996). This confirmed that GRS 1716249 never left the HCS during the 1993 outburst, and solidified it as a “hard-only” outburst source (Brocksopp et al., 2004).
In early 1995, Mir/Kvant detected five slow-rise, fast decay hard X-ray flares, “mini-outbursts” resembling those of the SXTs, GRS 100945 and GRO J0422+32 (Masetti et al., 1996). Hjellming et al. (1996b) found the relation between high energy X-ray and radio emission was very similar (i.e., radio emission follows the peak or onset of decay in X-ray flares seen between 20–200 keV) to that observed in GRO J165540 and GRS 1915+105 (Foster et al., 1996), implying the presence of a jet linked to state changes in the accretion disk.
Masetti et al. (1996) estimate a period of hours and a lower limit on the mass of the primary from the super hump period888There are two methods for estimating a lower limit on compact object mass (in close binary systems) when superhump behavior is present. If only the superhump period is known, hr. If both and are known, where . For detailed analysis and application of both methods, see Mineshige et al. (1992). to be .
II.2.33 XTE J1720318 (B)
XTE J1720318 was discovered by the ASM aboard RXTE undergoing an XRN-like outburst in 2003 (Remillard et al., 2003). Its X-ray spectrum included a 0.6 keV thermal component and a hard tail. Both the spectral characteristics and source luminosity were typical of a BH in the soft state (Markwardt, 2003a). Cadolle Bel et al. (2004) perform a detailed spectral analysis of the outburst and conclude that XTE J1720318 is a BHC.
The radio counterpart was discovered by Rupen et al. (2003d); O’Brien et al. (2003). Brocksopp et al. (2005) observed an unresolved radio source during the rise phase of the outburst, which reached a peak approximately coincident with the X-ray light curve. Through study of the spectral indices, they conclude that at least two ejection events occurred, similar to behavior observed in XTE J1859+226. Following a period in which the radio source was not detected, the source again switched on as XTE J1720318 transitioned back into the hard state.
II.2.34 XTE J1727476 (C)
The X-ray transient XTE J1727476 was discovered by RXTE (Levine et al., 2005a) and INTEGRAL (Turler et al., 2005a) in 2005. Observations yielded a soft spectrum, reminiscent of a BHXB in outburst (Levine et al., 2005a; Kennea et al., 2005). We therefore include XTE J1727476 in our sample as a possible BHC. An optical counterpart was discovered by Maitra et al. (2005).
II.2.35 IGR J172852922 (C)
IGR J172852922 was discovered with INTEGRAL in 2004 (Walter et al., 2004). Based on the characteristic evolution of the spectrum from soft (Markwardt & Swank, 2010) to hard (Barlow et al., 2005) observed during the 2 week outburst and its location in the Galactic bulge, IGR J172852922 was suggested to be an LMXB undergoing transient activity (Barlow et al., 2005). Given the lack of type I X-ray bursts and the relative hardness of the spectrum, Barlow et al. (2005) tentatively suggested the system may be harbouring a BH.
Assuming a distance of 8 kpc, the peak luminosity of this outburst was , classifying it as a VFXT (Sidoli et al., 2011).
Renewed activity in the transient identified as XTE J1728295 was observed in 2010 (Markwardt & Swank, 2010). During this time, the source was also detected by Swift/BAT (although never officially reported), reaching a peak of mCrab on August 28–29, coincident with the RXTE detection (Private Communication with H. Krimm). Turler et al. (2010) confirmed that IGR J172852922 and XTE J1728295 were the same source. Using XMM and INTEGRAL, Sidoli et al. (2011) were able to obtain the first broadband spectrum, dominated by a power-law with a slope consistent with the canonical range for BHXBs in the HCS (; Belloni 2010). IGR J172852922 remained in the HCS for the entire 2010 outburst, making it a “hard-only” outburst source and further suggesting a BH nature (Sidoli et al., 2011).
II.2.36 GRS 1730312 (C)
The X-ray source GRS 1730312 was discovered by SIGMA aboard GRANAT (Churazov et al., 1994) and the TTM telescope aboard Mir-Kvant (Borozdin et al., 1994) in 1994. Both Borozdin et al. (1995) and Vargas et al. (1996) observed that the source peak luminosity, contribution of the hard and soft spectral components, and hard to soft state transition during outburst, resemble the other BH sources GS 1124684 (Ebisawa et al., 1994) and 1A 062000 (Ricketts et al., 1975), and therefore classified the source as a BHC.
II.2.37 KS 1732273 (B)
GS 1732273 was discovered by the GINGA satellite during scanning observations and was first designated GS 1734275 (Makino, 1988). The spectrum was fit well with a black body model similar to those of BHXBs (Yamauchi & Koyama, 1990).
The source position was redetermined, now finding agreement with KS 1732273 (van Paradijs & McClintock, 1995; Liu et al., 2001; Yamauchi & Nakamura, 2004), discovered by Mir-Kvant in 1989 (in ’t Zand et al., 1991) and 1RXS J173602.0-272541, discovered with the RASS in 1990 (Voges et al., 1999). Given the ultra-soft spectrum and transient behavior as evidence, Yamauchi & Nakamura (2004) classify the source as a BHC.
II.2.38 IGR J173793747 (C)
IGR J173793747, originally designated XTE J1737376, was discovered by RXTE/PCA in 2004. The outburst lasted 9 days. Although not published formally, it appeared on the PCA bulge scan webpage999http://asd.gsfc.nasa.gov/Craig.Markwardt//galscan/main.html. The source position coincided with IGR J173793747, a weak hard X-ray source reported in the 3rd INTEGRAL catalog (Bird et al., 2007). Given limits on its positional accuracy, Markwardt et al. (2008b) concluded that XTE J1737376 and IGR J173793747 were most likely the same source.
This source was again detected by PCA, INTEGRAL, and BAT in 2008 (Markwardt et al., 2008b). Swift/XRT observations revealed a hard spectrum with photon index , consistent with the RXTE/PCA spectrum (Krimm et al., 2008b). The observed spectrum suggests a BHC. In addition, Curran et al. (2011a) identify a possible optical/NIR counterpart.
II.2.39 GRS 173731 (C)
GRS 173731 was discovered by SIGMA aboard GRANAT in March of 1997 (Sunyaev et al., 1997). It was also found in RXTE and BeppoSAX data (Marshall & Smith, 1997; Cui et al., 1997b; Heise, 1997). Both the hard spectrum of the source (Sunyaev et al., 1997) and the observed chaotic variability (Cui et al., 1997a) were similar to properties observed by XRN and BH source Cyg X-1 (Sunyaev & Truemper, 1979b; Sunyaev et al., 1992; Vikhlinin et al., 1994; Trudolyubov et al., 1999).
Observations from Trudolyubov et al. (1999) and Cui et al. (1997a) revealed a hard power-law spectrum. Further observations using BeppoSAX and ASCA (Heise, 1997; Ueda et al., 1997) confirmed this hard spectrum 2 weeks after the initial detection. Based on spectral and temporal properties, it was suggested that GRS 173731 was a distant XRN and BHC in the HCS (Sunyaev et al., 1997; Cui et al., 1997a; Trudolyubov et al., 1999). GRS 173731 appears to have never left the hard state for the duration of the 1997 outburst, making it a “hard-only” outburst source (Brocksopp et al., 2004).
No optical or radio observations have ever been published (Brocksopp et al., 2004).
II.2.40 GRS 1739278 (B)
The X-ray source GRS 1739278 was discovered by SIGMA aboard GRANAT in 1996 (Paul et al., 1996). The outburst was observed by Mir-Kvant (Borozdin et al., 1996), ROSAT (Greiner et al., 1997), GRANAT (Vargas et al., 1997), and RXTE (Takeshima et al., 1996).
A radio counterpart was discovered with Very Large Array (VLA) data (Durouchoux et al., 1996; Hjellming et al., 1996a) and an optical counterpart was discovered by Marti et al. (1997) to be either a luminous early/middle B type main sequence star or a middle G/early K giant star.
Borozdin et al. (1998) and Vargas et al. (1997) find the light curve behavior, optical and radio observations, evolution of the spectrum and spectral characteristics correspond to the SDS and SPL states of BHCs, and Borozdin & Trudolyubov (2000) observe QPOs, present when the source was in the SPL and SDS, allowing GRS 1739278 to reliably be classified as a BHC and soft XRN. )
II.2.41 1E 1740.72942 (B) — The Great Annihilator
The micro-quasar 1E 1740.72942, located near the Galactic centre, was discovered by Einstein in 1984 (Hertz & Grindlay, 1984). Its hard X-ray emitting nature was first reported by Skinner et al. (1987). Given the spectral shape of its soft -ray emission and the similarities to Cyg X-1, Sunyaev et al. (1991a) classified it as a BHC and the strongest persistent source in the Galactic centre region. Its micro-quasar classification came with the discovery of a double-sided radio emitting jet (Mirabel et al., 1992). Its radio emission has been found to be variable and correlated with the X-ray flux (Paul et al., 1991).
1E 1740.72942 has been suggested as a possible source of electron-positron annihilation due to an observed high energy spectral feature with GRANAT (Bouchet et al., 1991; Sunyaev et al., 1991b), hence the common name “The Great Annihilator”. However, near simultaneous observations by CGRO (Jung et al., 1995) and BATSE (Smith et al., 1996) and high energy observations by INTEGRAL (Bouchet et al., 2009) could never confirm this feature.
1E 1740.72942 is one of only three BHCs that not only remain persistently near their maximum luminosity but also spend most of their time in the HCS (Churazov et al., 1993; Main et al., 1999; del Santo et al., 2004), with an X-ray spectrum usually described by an absorbed power-law with photon index (Gallo & Fender, 2002) and high energy cutoff (Sidoli et al., 1999; Natalucci et al., 2014). Occasionally the source has been observed to make the transition to the softer states (Sunyaev et al., 1991b; del Santo et al., 2004).
Due to a source environment characterized by a high concentration of dust and high column density (), optical identification is difficult (Gallo & Fender, 2002) and its nature as a HMXB or LMXB, inclination, and distance remain unknown. However, the high absorption, position near the Galactic centre and presence of bipolar jets, all favor a distance of 8.5 kpc and disfavor a face on geometry (Natalucci et al., 2014).
Periodic modulation has been detected and interpreted as an days, suggesting the object could have a red giant companion (Smith et al., 2002a). However, Marti et al. (2010) have reported a candidate IR counterpart that would exclude the red giant companion possibility. A much longer periodicity has also been reported by Ogilvie & Dubus (2001), thought to be related to cyclic transitions between a flat and warped disk, similar to what is observed in Cyg X-1 and LMC X-3.
II.2.42 Swift J174510.8262411 (B) — Swift J174526
The transient Swift J174510.8262411 (or Swift J174526) was discovered by Swift/BAT in 2012 (Cummings et al., 2012). During this time a variable IR counterpart was identified (Rau et al., 2012b) and an optical counterpart with H emission was discovered (Muñoz-Darias et al., 2013). Muñoz-Darias et al. (2013) argue a hours and a spectral type of the counterpart as A0 or later.
Spectral and timing observations (by Swift and INTEGRAL) suggest that Swift J174526 was an LMXB BH system that never left the hard states for the duration for the outburst (Belloni et al., 2012; Grebenev & Sunyaev, 2012; Tomsick et al., 2012; Vovk et al., 2012; Sbarufatti et al., 2013; Krimm et al., 2013b), making Swift J174526 a “hard-only” outburst source (Curran et al., 2014). A radio counterpart was detected by Miller-Jones & Sivakoff (2012) and both Corbel et al. (2012) and Coriat et al. (2013a) find a spectral index suggestive of optically-thick synchrotron emission from a partially self-absorbed compact jet. See Curran et al. (2014) and Tetarenko et al. (2015d) for complete analysis of the evolution of the jet throughout the outburst from radio through sub-mm frequencies.
II.2.43 IGR J174542919 (C)
The new Galactic source IGR J174542919 was discovered by the INTEGRAL/JEM-X in October of 2014 (Chenevez et al., 2014b) and labelled a new transient XRB source (Chenevez et al., 2014a). Spectral and timing analysis with NuSTAR revealed a hard power-law index, high energy cutoff, and level of variability consistent with that of an accreting BHXB in the hard state (Tendulkar et al., 2014). This result paired with the fact that no evidence for bursts or pulsations were found make the source a probable BHC (Tendulkar et al., 2014).
II.2.44 1A 1742289 (B)
The transient source 1A 1742289 was discovered by the Ariel V satellite in 1975 (Eyles et al., 1975). Branduardi et al. (2001) observe similarity in spectral behavior and timescales with transient BH source 4U 1543475 indicating that 1A 1742289 contains a compact object (based on high X-ray luminosity) with variable mass transfer from a low mass companion of spectral type M–K. Davies et al. (1976) find a radio counterpart and observe changes in intensity at radio and X-ray wavelengths in 1A 1742289 similar to behavior observed in Cyg X-1 and 1A 062000 (Elvis et al., 1975; Owen et al., 1976). Maeda et al. (1996) give an estimate of hours. While the nature of the compact object is not known, the source is included in the BHC list of McClintock & Remillard (2006) and therefore is included in our sample.
II.2.45 CXOGC J174540.0-290031 (B)
The new transient source CXOGC J174540.0-290031, located only 0.1 pc in projection from Sgr A*, was discovered by Chandra in 2004 (Muno et al., 2005b). This source has also been detected by XMM-Newton (Belanger et al., 2005). The 7.9 hour orbital modulation detected in the Chandra X-ray light curve and upper limit on the magnitude of the infrared counterpart of , coupled with its low peak X-ray luminosity, suggest that it is an LMXB that is being viewed nearly edge-on (Muno et al., 2005a). While the bright radio outburst observed (coincident with the X-ray) suggests that it contains a BH. See Bower et al. (2005) for a detailed analysis of the radio emission.
II.2.46 H 1743322 (B)
H 1743322 was discovered during a bright outburst by the Ariel V (Kaluzienski & Holt, 1977) and HEAO–1 (Doxsey et al., 1977) satellites in 1977. The source was classified as a BHC based on its very soft spectrum (White & Marshall, 1984).
H 1743322 was detected in 1984 with EXOSAT (Reynolds et al., 1999), in 1996 with Mir-Kvant (Emelyanov et al., 2000), and again in 2003 by INTEGRAL (Revnivtsev, 2003) and RXTE (Markwardt & Swank, 2003). In 2003, QPOs of typical BHC frequencies were observed (Homan et al., 2003b) and the system followed the typical “turtlehead” pattern, transitioning through hard and soft accretion states (Capitanio et al., 2005; McClintock et al., 2009).
Detections of the radio (Rupen et al., 2003a) and optical (Steeghs et al., 2003) counterparts followed quickly thereafter. H1743322 is classified as a micro-quasar, as jets have been detected at both radio and soft X-ray wavelengths (Rupen et al., 2004; Corbel et al., 2005). There exists numerous studies of this source at radio wavelengths (Kalemci et al., 2006; Jonker et al., 2010; Coriat et al., 2011; Miller-Jones et al., 2012). An additional outflow, in the form of an accretion disk wind, has also been detected in this source (Miller et al., 2006b; Ponti et al., 2012).
Since 2003, H 1743322 has undergone 13 observed outbursts, 3 of which where the source never reached the softer states, we label H 1743322 as a “hard-only” outburst source. Despite being one of the most well studied BHXBs in the Galaxy, no dynamical confirmation has ever been made on the system (Motta et al., 2010). We adopt the distance estimated by Corbel et al. (2005) from the proper motion of the jet, kpc, for the purpose of our analysis.
II.2.47 XTE J1748288 (B)
XTE J1748288 was discovered in 1998 by the ASM aboard RXTE (Smith et al., 1998b) and BATSE aboard CGRO (Harmon et al., 1998). General spectral and timing properties and their evolution during the outburst were typical of BH XRN (Revnivtsev et al., 2000c). Revnivtsev et al. (2000c) and Brocksopp et al. (2007) suggest that the outburst began in the SPL state. As the outburst continued, the source then passed through the SDS and made the transition back to the HCS. In addition, an iron emission line was detected by Kotani et al. (2000) and Miller et al. (2001a).
The optically thin radio counterpart was discovered soon after by Hjellming et al. (1998a), confirmed to be associated with XTE J1748288 (Hjellming et al., 1998e; Fender et al., 1998) and resolved by the VLA (Rupen et al., 1998). Follow-up work revealed a jet with a velocity (Hjellming et al., 1998d), making XTE J1748288 only the third known Galactic source that has displayed superluminal motion (Brocksopp et al., 2007).
II.2.48 IGR J174972821 (C)
IGR J174972821 was discovered with ISGRI onboard INTEGRAL in 2006 (Soldi et al., 2006). Assuming a distance of 8 kpc, Kuulkers et al. (2006a) estimated a peak 2–200 keV luminosity of . Given this luminosity and a source position closely projected towards the Galactic center, this strongly suggests that IGR J174972821 was an XRB (Rodriguez et al., 2007). Spectral analysis and the FRED type light curve observed further implied that the source was a BHC in the HCS (Kuulkers et al., 2006b; Walter et al., 2007). The source never left the HCS during this outburst, classifying it as a “hard-only” outburst source (Rodriguez et al., 2007; Walter et al., 2007; Paizis et al., 2009).
Given a refined Chandra position, Paizis et al. (2007a) identified two possible optical/IR counterparts consistent with a B-type star (i.e., HMXB) or a K-giant (which would make the system a symbiotic LMXB). However, given that neither is consistent with the standard LMXB light curve of this source, it is probable that the true counterpart has not yet been identified. No radio counterpart has been found for this source (Rodriguez et al., 2007).
II.2.49 SLX 1746331 (B)
SLX 1746331 was discovered by the SpaceLab 2 X-ray Telescope in 1985 (Skinner et al., 1990) and detected by the RASS in 1990 (Motch et al., 1998). Both Skinner et al. (1990) and White & van Paradijs (1996) speculated that SLX 1746331 may harbour a BH based on both its transient nature and its soft spectrum. Further evidence was added to this claim when the source was once again detected in 2003 by the RXTE/PCA bulge scan, finding a very soft spectrum modelled by black body emission at keV (Markwardt, 2003b; Remillard & Levine, 2003) and by INTEGRAL/ISGRI that found an additional hard component to the spectrum that only contributed at most % of the flux (Lutovinov et al., 2003a). Spectral and timing analysis showed that the source had made the transition from the soft state back to the hard state, commonly associated with BHCs (Homan & Wijnands, 2003).
SLX 1746331 has since been detected twice more, once in 2007/2008 by both RXTE/PCA (Markwardt & Swank, 2007) and INTEGRAL/JEM-X (Kuulkers et al., 2008) and once in late 2010 by MAXI (Ozawa et al., 2011). Both outbursts showed the typical very soft spectrum, commonly associated with BHCs in the soft state.
II.2.50 XTE J1752223 (B)
The X-ray transient XTE J1752223 was discovered by the ASM aboard RXTE in 2009 (Markwardt et al., 2009c). RXTE, MAXI, and Swift monitoring suggested that the source was a BHC as variability was indicative of an imminent state transition (Nakahira et al., 2009; Markwardt et al., 2009a; Remillard, 2009; Shaposhnikov et al., 2009; Shaposhnikov, 2010; Shaposhnikov et al., 2010). Later works agreed (Munoz-Darias et al., 2010; Stiele et al., 2011; Reis et al., 2011; Nakahira et al., 2012a).
Optical/NIR observations revealed a possible counterpart (Torres et al., 2009b, d). However, given the crowded field (Russell et al., 2010a), it remains unclear whether this is the true counterpart. Brocksopp et al. (2009) discovered the radio counterpart with a flat spectrum consistent with a compact jet in the hard spectral state. The source appeared to stay in the hard state for an extended period of time and finally transitioned to the softer states (Homan, 2010; Curran et al., 2010; Nakahira et al., 2010; Shaposhnikov, 2010; Shaposhnikov et al., 2010; Chun et al., 2013). Radio observations of ejection events, often associated with state changes, supported this result (Brocksopp et al., 2010a; Yang et al., 2010a, 2011). There has also been evidence to suggest that XTE J1752223 contains X-ray jets (Yang et al., 2011). For in-depth radio analysis see Brocksopp et al. (2013). Using correlations between spectral and variability properties with GRO J165540 and XTEJ1550564, Shaposhnikov et al. (2010) estimated a distance of kpc and a BH mass of , which we adopt for the purpose of our analysis.
II.2.51 Swift J1753.50127 (B)
Swift J1753.50127 is an X-ray transient discovered in outburst by Swift/BAT in 2005 (Palmer et al., 2005). Soon after, the source was detected in UV, optical, NIR and radio bands (Still et al., 2005b; Halpern, 2005; Torres et al., 2005; Fender et al., 2005). The radio observations by Fender et al. (2005) indicated likely compact jet activity. The hard X-ray spectrum, up to 600 keV (no NS system has been detected past 200 keV; Cadolle Bel et al. 2007), and the detection of QPOs (Morgan et al., 2005), has provided strong evidence that the system harbours a BH (Cadolle Bel et al., 2007).
The system has not returned to quiescence since 2005, and therefore we treat Swift J1753.50127 as a persistent source in our analysis. It is usually seen in the HCS, making it a “hard-only” outburst source (Soleri et al., 2012; Shaw et al., 2013; Froning et al., 2014). However, it has been observed to make occasional transitions to the intermediate states before returning back to the hard state, similar to the incomplete state transitions of Cyg X-1 (Soleri et al., 2012).
Swift J1753.50127 follows the lower track in the X-ray/radio luminosity plane (Cadolle Bel et al., 2007), along with an increasing number of BH sources (Coriat et al., 2011; Corbel et al., 2013), and it could be the BH with the second shortest orbital period of 3.2 hours, according to Zurita et al. (2008). For complete multi-wavelength analysis, see Froning et al. (2014); Cadolle Bel et al. (2007) and for spectral and timing analysis, see Miller et al. (2006a); Soleri et al. (2012); Mostafa et al. (2013).
II.2.52 XTE J1755324 (C)
XTE J1755324 was discovered by the ASM aboard RXTE in 1997 (Remillard et al., 1997). The spectrum was fit with a multicolor disk black body at 0.7 keV and a hard power-law tail extending to 20 keV (Remillard et al., 1997). Given the spectrum, the FRED type light curve behavior (Revnivtsev et al., 1998a), typical of XRN (Tanaka & Shibazaki, 1996), and the fact that no Type-I X-ray bursts or pulsations were observed throughout the course of the outburst (Goldoni et al., 1999), the source was suggested as a good BHC (Goldoni et al., 1999). For complete X-ray spectral analysis, see Revnivtsev et al. (1998a) and Goldoni et al. (1999). Goldoni et al. (1999) did not detect any quiescent X-ray emission coincident with the position of the source in the ROSAT All-Sky Bright Source Catalogue. No radio counterpart has ever been found (Ogley et al., 1997).
II.2.53 H 1755338 (B)
H 1755338 was discovered by the UHURU satellite when it was active in 1970 (Jones, 1977). It had an unusually soft spectrum (White & Marshall, 1984; White et al., 1984) and a hard X-ray tail (Pan et al., 1995), which was suggestive of a BHC (Kaaret et al., 2006). H 1755338 shows X-ray dips indicating a high inclination and a days (White et al., 1984; Mason et al., 1985). The source was still active in 1993 (Church & Balucinska-Church, 1997), but in quiescence in 1996 (Roberts et al., 1996). Therefore the source likely remained active for at least 23 years. We classify this source as persistent (Kaaret et al., 2006).
The distance to the source is likely kpc, as the optical counterpart, which was identified during outburst by McClintock et al. (1978), was not detected in quiescence (Wachter & Smale, 1998) and kpc, suggested by the low level of visual extinction (Mason et al., 1985). Angelini & White (2003) found a linear structure in the X-ray, roughly symmetric, about the position of the source and extending outwards by , suggesting the presence of X-ray jets, see Park et al. (2005) and Kaaret et al. (2006).
II.2.54 GRS 1758258 (B)
The hard X-ray source GRS 1758258 was discovered with GRANAT in 1990 (Mandrou, 1990; Sunyaev et al., 1991a). GRS 1758258 displays a hard power-law spectrum with photon indices – and a high energy cutoff above 100 keV (Kuznetsov et al., 1999; Main et al., 1999; Lin et al., 2000) and strong short term variability up to 10 Hz (Smith et al., 1997; Lin et al., 2000), making it one of only three BHCs that not only remain persistently near their maximum luminosity, with the exception of a few dim states that can last up to several months (Pottschmidt et al., 2006), but also spend most of their time in the HCS. Sometimes a weak soft excess is seen in the spectrum, observed in conjunction with a slightly reduced X-ray flux, thought to be characteristic of the source transitioning into the intermediate states (Mereghetti et al., 1994, 1997; Lin et al., 2000; Heindl & Smith, 2002).
From the X-ray properties and radio double sided jet structure (Rodriguez et al., 1992), GRS 1758258 is classified as a micro-quasar (Pottschmidt et al., 2006). An additional outflow, in the form of an accretion disk wind, has also been detected in this source (Ponti et al., 2012).
Three possible counterparts have been identified, a K0 III giant and two main sequence A stars (Marti et al., 1998; Eikenberry et al., 2001; Rothstein et al., 2002). The former has been suggested as the most likely counterpart given the days (Smith et al., 2002a).
Numerous observational campaigns, in both the soft (Mereghetti et al., 1994, 1997; Smith et al., 1997; Main et al., 1999; Smith et al., 2001, 2002a, 2002b; Pottschmidt et al., 2006) and hard (Gilfanov et al., 1993; Kuznetsov et al., 1999; Pottschmidt et al., 2006) X-rays have been undertaken over the years, as well as a multi-wavelength study by Lin et al. (2000).
II.2.55 XTE J1812182 (C) — XMMU J181227.8181234
The X-ray transient XTE J1812182 (or XMMU J181227.8181234) was discovered by XMM-Newton in outburst in 2003. After reprocessing of data, this source was found in the RXTE/ASM data as well. Cackett et al. (2006) searched the two Micron All-Sky Survey (2MASS) All-Sky Catalog of Point Sources and the USNO-B1.0 catalogue within 6″ of the source position and found no counterpart. They reason that this is most likely due to the large absorption () in the direction of the source.
The spectrum of the source is fit equally well with an absorbed power-law () or a multi-color disk blackbody ( keV) and no pulsations were detected in the timing analysis. A color-color diagram, along with the high absorption found in the direction of the source suggests an HMXB system. However, the power-law spectral index is more typical of an LMXB (Cackett et al., 2006).
The source was detected again in 2008 with RXTE/PCA, and confirmed to be XMMU J181227.8181234 (Markwardt et al., 2008d; Torres et al., 2008b). The spectrum was again consistent with a highly absorbed power-law. While Cackett et al. (2006) speculated that the source was an HMXB, Markwardt et al. (2008d) interpreted the spectrum and variability behavior as being a BHC in a soft state. Following Markwardt et al. (2008d), we include XTE J1812182 in our sample as a possible BHC.
II.2.56 IGR J181751530 (C) — XTE J1817155
The hard X-ray transient IGR J181751530 was discovered by INTEGRAL in 2007 (Paizis et al., 2007b) and also detected during RXTE/PCA scans of the region and designated XTE J1817155 (Markwardt et al., 2007). Cheung (2007) discuss the detection of a radio source that may be associated with IGR J181751530.
II.2.57 XTE J1817330 (B)
XTE J1817330 was discovered by RXTE in 2006 (Remillard et al., 2006) and shown to have a very soft spectrum, dominated by the accretion disk component, typical of transient BHCs in the soft state (Sala et al., 2007) Both the radio counterpart (Rupen et al., 2006) and a probable optical (Torres et al., 2006) counterpart were identified. Sala et al. (2007) suggest a spectral type of K–M for the optical counterpart. An outflow, in the form of an accretion disk wind, has also been detected in this source (Ponti et al., 2012).
At the peak of the outburst, the source was in the SDS and then later transitioned back to the HCS as the source intensity gradually decreased (Gierlinski et al., 2008; Roy et al., 2011). QPOs associated with the intermediate states have also been detected in this source (Homan et al., 2006a; Roy et al., 2011). For complete analysis of QPOs present during the outburst of XTE J1817330, see Sriram et al. (2013a).
II.2.58 XTE J1818245 (B)
XTE J1818245 was discovered by the ASM aboard RXTE in 2005. The hardness ratio indicated a very soft spectrum, typical of BHCs (Levine et al., 2005b) and no pulsations were detected (Markwardt et al., 2005). Soon thereafter, the optical (Steeghs et al., 2005b) and radio (Rupen et al., 2005d) counterparts were discovered. The spectral type of the optical counterpart could not be identified as the optical emission was found to be dominated by the accretion disk (Zurita Heras et al., 2011).
Spectral parameters showed behavior typical of the SDS and intermediate states seen in BHXBs, including the usual decrease in disk temperature, increase in inner disk radius and decrease in disk flux as the high-energy flux became stronger, and radio flares associated with discrete ejecta (Cadolle Bel et al., 2009). Based on the above analysis and the observed light curve behavior, Cadolle Bel et al. (2009) concluded that XTE J1818245 is most likely a LMXB and a BHC.
They estimate a distance of 2.8–4.3 kpc using the model developed by Shahbaz et al. 1998 and the outburst light curve properties of the source. We assume a uniform distribution in this range for the purposes of our analysis.
II.2.59 SAX J1819.32525 (A) — V4641 Sgr
In 1999 the transient SAX J1819.32525 was discovered by BeppoSAX (in ’t Zand et al., 1999) and RXTE (Markwardt et al., 1999b) with a position consistent with variable star V4641 Sgr. Its optical (Stubbings, 1999) and X-ray (Smith et al., 1999a, b) flux increased rapidly and then began to decline within two hours. Emission lines found in both optical and infrared spectra, during this bright X-ray flare (Ayani & Peiris, 1999; Liller, 1999; Djorgovski et al., 1999; Charles et al., 1999), were reminiscent of accretion onto a compact object.
Shortly thereafter, the radio counterpart was discovered by Hjellming et al. (1999a). This counterpart which declined on timescales of hours to days (Hjellming et al., 1999a, b) and showed ejecta moving with relativistic motion (Hjellming et al., 1999d), which led to SAX J1819.32525 being classified as a possible micro-quasar. For a discussion of the rapid X-ray variability occurring at super-Eddington luminosities during this flare, see Wijnands & van der Klis (2000) and Revnivtsev et al. (2002).
Since 1999, major outbursts have been observed in 2000 (Hjellming, 2000), 2002 (Uemura et al., 2004), 2003 (Buxton et al., 2003; Maitra & Bailyn, 2006), 2004 (Swank, 2004) and 2015 (Yoshii et al., 2015). Each outburst was much shorter than typical compact transient systems (Maitra & Bailyn, 2006). Weaker flare-like activity has been reported in 2000 (Hjellming, 2000; Uemura et al., 2004), 2007 (Cackett & Miller, 2007), 2008/2009 (Yamaoka et al., 2008), 2010/2011 (Yamaoka & Nakahira, 2010; Yamaoka et al., 2010b, a) and 2014 (Tachibana et al., 2014a). An outburst in 1978 was found on photographic plates at the Sternberg Astronomical Institute (Barsukova et al., 2014).
Optical spectroscopy and photometry during quiescence allowed Orosz et al. (2001) to measure a and 2.8 days , estimate a distance between 7.4 and 12.3 kpc and mass between –, and classify V4641 Sgr as a B9III star, in turn making SAX J1819.32525 a confirmed BH (Revnivtsev et al., 2002).
Its optical companion, has a mass estimated at – (Orosz et al., 2001). However, MacDonald et al. (2011) argue the maintenance of the LMXB label for two reasons. The first, mass transfer occurs via Roche lobe overflow in the system. The second, the optical counterpart, is not more massive than the probable BH in the system.
More recently, MacDonald et al. (2014) have compiled and subsequently separated 10 years of data on this source into passive and active states. They find the passive state data to be dominated by ellipsoidal variations and stable in the shape and variability of the light curve. By fitting ellipsoidal models to the passive state data they find an improved set of dynamical parameters including , , and an updated distance of kpc.
II.2.60 MAXI J1836194 (B)
MAXI J1836194 was discovered in August of 2011 simultaneously by MAXI (Negoro et al., 2011b) and Swift/BAT (Ferrigno et al., 2011). Follow-up observations led to the discovery of the optical (Kennea et al., 2011b) and radio (Miller-Jones et al., 2011c) counterparts. The relatively strong radio and IR emission observed was associated with a jet (Miller-Jones et al., 2011c; Trushkin et al., 2011).
Strohmayer & Smith (2011) classified the source as a BHC from a spectrum consistent with a power-law of photon index , the presence of an iron line, and a transition from the HCS to the IMS with RXTE/PCA. Ferrigno et al. (2011) found that the source never made the transition from the HCS to the SDS, thereby classifying MAXI J1836194 as a “hard-only” outburst source (also see Reis et al. 2012). For full multi-wavelength analysis of the outburst see Russell et al. (2013) and Russell et al. (2014a).
Using optical/UV signatures of an accretion disk (H, HeII 4686) found in the optical spectra, Russell et al. (2014b) infer a plausible inclination range for the system between and . In addition, Russell et al. (2014b) are also able to place mass and radius constraints on the counterpart, and in-turn derive an upper limit on the orbital period of hours, using stellar evolution models and the quiescent luminosity limits found from optical photometry.
II.2.61 Swift J1842.51124 (C)
Swift J1842.51124 was discovered with Swift/BAT in 2008 (Krimm et al., 2008d) and studied in detail (Racusin et al., 2008; Krimm et al., 2008e, a). The spectrum of the source was fit with a black body ( keV) and power-law model (), where the black body component only contributed % of the total 2–40 keV flux. Strong QPOs near Hz were also observed (Markwardt et al., 2008a). A QPO at 8 Hz and a hard spectrum suggested that the source was transitioning from the HCS to the SDS (Krimm et al., 2013b).
As the hard X-ray peak preceded the soft X-ray peak by days in the light curve, a behavior also seen in BH sources Swift J1539.26227 (Krimm et al., 2011b) and GRO J165540, (Brocksopp et al., 2006), suggested the system was a BHC (Krimm et al., 2013b). Swift J1842.51124 underwent a later, very weak outburst in February of 2010. Follow-up optical/near IR observations performed in 2008 revealed a possible candidate counterpart (Torres et al., 2008a).
II.2.62 EXO 1846031 (C)
EXO 1846031 was discovered by EXOSAT in 1985 (Parmar & White, 1985). Parmar et al. (1993) observe an X-ray spectrum well fit with a multi-color disk blackbody and power-law component extending to 25 keV as well as significant variability in this hard component, suggesting that EXO 1846031 is a BHC. While a search for the optical counterpart was performed, no significant conclusions were made due to technical issues that affected the source positions derived (Parmar et al., 1993).
II.2.63 IGR J18539+0727 (C)
The hard X-ray transient IGR J18539+0727 was discovered by INTEGRAL in 2003 (Lutovinov et al., 2003b). Lutovinov & Revnivtsev (2003) observe an X-ray spectrum fit well with a power-law and a fluorescent line at 6.4 keV, typical of XRBs in the HCS (Gilfanov et al., 1999). IGR J18539+0727 shows strong flux variability on timescales of tenths to tens of seconds and a break frequency in the power spectrum at Hz. Although most NS systems do not demonstrate a break with this low of a frequency (Wijnands & van der Klis, 1999), Linares et al. (2007) have observed an accreting milli-second pulsar that exhibited BH-like X-ray variability, including a break frequency below 0.1 Hz. As such, alone these power spectra properties should not be taken as strong evidence for a BH primary. Given the spectrum and observed properties in the power spectra of the source, Lutovinov & Revnivtsev (2003) suggest IGR J18539+0727 is a BHC.
II.2.64 XTE J1856+053 (C)
XTE J1856+053 was discovered by RXTE/PCA in 1996 (Marshall et al., 1996). The RXTE/ASM light curve showed two peaks, separated by 4.5 months. The first in April displayed a symmetric shape, and the second in September displayed a FRED pattern (Remillard, 1999). Both outbursts are classified as successful,especially when the HIDs are also considered (Sala et al., 2008).
In 2007, XTE J1856+053 was again detected by RXTE (Levine & Remillard, 2007). Much like the 1996 outburst, two peaks were observe but this time they were separated by only a few weeks and therefore are counted as only one outburst (Sala et al., 2008). Sala et al. (2008) observed that the X-ray spectrum of the 2007 outburst was dominated by emission from the accretion disk, consistent with a BHC in the soft state (McClintock & Remillard, 2006). Our algorithm detected a fourth outburst in 2009. This short outburst, lasting days, is not found in the literature.
More recently, in March 2015, XTE J1856+053 was observed in outburst again, this time undergoing a short-lived “hard-only” outburst. Originally detected by MAXI (Suzuki et al., 2015), only basic spectral analysis from Swift/XRT is available for this outburst (Sanna et al., 2015). Similar to the 1996 and 2007 events, a second outburst, occurring 70 days after the onset of the first outburst, was also observed. During this outburst, which was brighter than the first, the source appears to have entered the soft state (Negoro et al., 2015a).
Sala et al. (2008) classify XTE J1856+053 as a LMXB based on its non-detection at IR wavelengths, therefore ruling out a massive companion. They also suggest a BH primary based on the low temperature of the accretion disk and their rough estimate of an accretor mass range between –.
II.2.65 XTE J1859+226 (A)
XTE J1859+226 was discovered by the ASM aboard RXTE in 1999 (Wood et al., 1999). Follow-up RXTE/PCA observations exhibited a hard power-law spectrum and the existence of QPOs of frequency 0.45 Hz (Markwardt et al., 1999a). BATSE observations confirmed the hard spectrum extending up to 200 keV and revealed that the hard X-ray flux peaked while the soft X-ray flux was still rising (McCollough & Wilson, 1999). A series of soft flares were seen (Focke et al., 2000), in which QPOs were detected, at 6–7 Hz and 82–187 Hz (Cui et al., 2000). Further analysis of the outburst (Farinelli et al., 2013; Casella et al., 2004; Brocksopp et al., 2002) suggested a likely BH primary in the system.
Radio (Pooley & Fender, 1997) and optical (Garnavich et al., 1999) counterparts were discovered. Brocksopp et al. (2002) found a series of radio ejections occurred simultaneously with spectral hardening of the source, suggesting a disk/jet connection. Garnavich & Quinn (2000) and Sanchez-Fernandez et al. (2000) searched the optical photometry finding a potential hours. Filippenko & Chornock (2001) determine a mass function for XTE J1859+226, indicating the BH nature of the primary.
More recently, Corral-Santana et al. (2011) perform optical photometry and spectroscopy of XTE J1859+226 and find an hours, a companion spectral type of K5–7V, and a which, while lower than the original estimate, still requires a BH primary in the system. Corral-Santana et al. (2011) fit a star-only model to find an . As their data is consistent with the passive state (Kreidberg et al., 2012), we adopt the Corral-Santana et al. (2011) value for the inclination and use it to calculate .
The distance to XTE J1859+226 remains problematic. Zurita et al. (2002) estimate 11 kpc based on the brightness of the outburst and the quiescent optical counterpart. However, this estimate is based on assumed values for both the orbital period and companion spectral type (Filippenko & Chornock, 2001). Markwardt (2001) use a combination of spectral and timing information to estimate 5–13 kpc and Hynes et al. (2000a), using fits to optical-UV spectral energy distribution, find an estimate of 4.6–8.0 kpc. Due to the uncertainty that still exists in the system parameters, we follow Hynes (2005) in believing that the distances estimated during outburst are more reliable and thus adopt their distance estimate of kpc.
II.2.66 XTE J1901+014 (C)
XTE J1901+014 was discovered by the ASM aboard RXTE in 2002 (Remillard & Smith, 2002). This outburst lasted between 2 minutes and 3 hours. Later, when reanalyzing RXTE/ASM data, Remillard & Smith (2002) found a previous outburst of the source occurring in 1997, lasting between 6 minutes and 8 hours.
Karasev et al. (2007) performed spectral and timing analysis on the 1997 and 2002 outbursts, arguing that they are not type I X-ray bursts. They fit the spectrum with a power-law of photon index , finding no cutoffs at energies between 20–30 keV (typical of pulsars; Filippova et al. 2005), or any emission lines in the spectrum. They conclude that such a spectrum, indicates that the primary is in fact a BH. Karasev et al. (2007) suggest that the outbursts are similar in spectral and timing properties to those observed in Galactic BH source SAX J1819.32525 (Stubbings & Pearce, 1999) and to a lesser degree, the outbursts of fast transients like SAX J1818.91703 (Grebenev & Sunyaev, 2005), concluding that XTE J1901+014 may be a fast X-ray transient containing a BH.
XTE J1901+014 once again became active in 2006. Karasev et al. (2008) found a power-law spectrum consistent with accreting XRBs. They failed to find the optical counterpart, estimating upper limits on the magnitude of 23.5 in the band and 24.5 in the band. In 2010, Swift/BAT detected XTE J1901+014 in outburst for the fourth time. his outburst lasted at least 2.5 minutes. The spectrum was consistent with the other three outbursts (Krimm et al., 2010). It is interesting to note that this source is generally detected as a low-level persistent source in the BAT survey101010See http://swift.gsfc.nasa.gov/results/bs70mon/SWIFT_J1901.6p0129.
II.2.67 XTE J1908+094 (B)
XTE J1908+094 was discovered serendipitously in observations of SGR 1900+14 with RXTE/PCA in 2002. The spectrum was consistent with an absorbed power-law of photon index and no pulsations were detected suggesting that XTE J1908+094 was an XRB containing a BH primary (Woods et al., 2002). Subsequent BeppoSAX observations (in’t Zand et al., 2002a) confirmed the hard spectrum, extending up to keV, and the high Galactic absorption. Detailed spectral and timing analysis by in’t Zand et al. (2002b) and Gogus et al. (2004), which confirmed that the source passed through both the HCS and SDS during outburst, agreed with Woods et al. (2002) that XTE J1908+094 is a BHC. A second outburst from this source was detected in 2013/2014 (Krimm et al., 2013c, a; Miller-Jones et al., 2013a; Coriat et al., 2013b).
The radio counterpart was discovered by Rupen et al. (2002). Jonker et al. (2004) analyzed simultaneous X-ray and radio observations during the outburst decay and discuss the X-ray/radio correlation.
A likely near IR counterpart was detected (Wagner & Starfield, 2002; Garnavich et al., 2002; Chaty et al., 2002). Once the source had returned to quiescence Chaty et al. (2006) performed NIR observations with CFHT, finding two possible counterparts (separated by 0.8″) within the X-ray error circle. They postulate that the companion star could be either (i) an intermediate/late type main-sequence star of spectral type A–K, located between 3–10 kpc; or (ii) a late-type main-sequence star of spectral type K or later, located between 1–3 kpc. They favor the former due to an independently determined lower limit on distance of 3 kpc derived by in’t Zand et al. (2002b) from the peak bolometric flux. We follow the suggestion by Chaty et al. (2006) and take the distance to be in the range 3–10 kpc.
II.2.68 Swift J1910.20546 (C) — MAXI J1910057
Swift J1910.20546 was simultaneously discovered by Swift/BAT (Krimm et al., 2012) and MAXI (as MAXI J1910057; Usui et al. 2012) in 2012. Rau et al. (2012a) detected the optical/NIR counterpart. Lloyd et al. (2012) and Casares et al. (2012b) report possible periodic variations in the optical light curve, which could be attributed to orbital variations, of hours, and hours, respectively.
The complex light curve (Krimm et al., 2013b) of the source, as well as spectral analysis from MAXI (Kimura et al., 2012; Nakahira et al., 2012b) and INTEGRAL (King et al., 2012a), show progression through state transitions and the mirrored behavior of the hard and soft X-ray flux. For this reason Krimm et al. (2013b) tentatively suggest that Swift J1910.20546 is a BHC.
II.2.69 SS 433 (C)
The Galactic micro-quasar SS 433 was first discovered in a survey of stars exhibiting H mission (Stephenson & Sanduleak, 1977) and later identified as a variable X-ray source in 1978 by the UHURU satellite (Margon, 1980). SS433 is unique among XRBs. The main property that distinguishes it from other “normal” XRBs, is that the system remains in a continuous regime of supercritical accretion onto the compact object. Basically all photometric and spectroscopic properties of the system are determined by the accretion disk and its orientation. See Fabrika (2004) for an extensive review of the system.
In the X-ray, SS 433 is a weak source, generally not observed past 30 keV (Nandi et al., 2005). The highly erratic spectral and temporal behavior of the system combined with the internal complexity of the system (Brinkmann et al., 1989) makes the nature of the compact object and companion uncertain (Fabrika & Bychkova, 1990).
The basic picture involves an evolved binary undergoing extensive mass-transfer. The secondary feeds an enlarged accretion disk around a compact object (NS or BH; Blundell et al. 2001). Some of this mass is directed through the disk toward the oppositely facing relativistic jets. We observe red and blue shifted optical lines, indicating material is accelerated by the jets (Fabian & Rees, 1979; Milgrom, 1979; Gies et al., 2002).
Margon (1984) successfully fit a precessing jet model to these lines, finding that the jets moved near constant velocity of and had a precession periodicity of 162.15 days. Radio imaging of the source, showed twin processing jets with structure on scales ranging from milliarcseconds to arcseconds (Hjellming & Johnson, 1981; Vermeulen et al., 1987, 1993; Fejes et al., 1988). The system is known to have a 13 day orbital period. This photometric periodicity, originally identified as orbital by Crampton et al. (1980); Crampton & Hutchings (1981), is further supported by both the observation of eclipses at 13 days (Cherepashchuk, 1981), and the X-ray dimming observed during the optical eclipses (Stewart et al., 1987).
SS 433 is believed to be a binary system consisting of a compact object and an O or B type star (Margon, 1984). Extensive arguments for the nature of the compact object being a BH (Zwitter & Calvani, 1989; Fabrika & Bychkova, 1990; Lopez et al., 2006; Hillwig & Gies, 2008; Kubota et al., 2010; Goranskij, 2011) and a NS (Filippenko et al., 1988; D’Odorico et al., 1991; Goranskij, 2011) have been made. The currently favored distance to the source is 5.5 kpc. Originally estimated by Hjellming & Johnson (1981) (and later Blundell & Bowler 2004) using the proper motion of the jets, this distance is now also supported by observations of HI absorption occurring as a result of a gas cloud interacting with the related supernova remnant W50 (Lockman et al., 2007).
II.2.70 GRS 1915+105 (A)
GRS 1915+105 was discovered in 1992 by the WATCH ASM aboard GRANAT (Castro-Tirado et al., 1992) and has remained active ever since (Belloni & Altamirano, 2013). The system exhibits very peculiar behavior, in the form of complex structured variability, such as QPOs ranging in frequency from Hz to Hz and patterns of dips and rapid transitions between high and low intensity in the light curve (Greiner et al., 1996; Morgan et al., 1997; Belloni et al., 2000; Klein-Wolt et al., 2002; Fender & Belloni, 2004; Hannikainen et al., 2005). Currently, there are 14 known variability classes (Belloni et al., 2000; Klein-Wolt et al., 2002; Hannikainen et al., 2005). Modelling of this X-ray variability has led to major insights into the connection between the accretion disk and relativistic jets in XRBs (Belloni et al., 1997; Klein-Wolt et al., 2002). Its luminosity is estimated to be near Eddington (Mirabel & Rodriguez, 1999).
The probable optical counterpart was discovered by Boer et al. (1996) and the radio counterpart was found with the VLA (Mirabel et al., 1993). Further radio monitoring revealed structures travelling at superluminal speed (Mirabel & Rodríguez, 1994), making GRS 1915+105 the first superluminal source in the Galaxy. GRS 1915+105 was suggested to harbour a BH based on its similarity with GRO J165540, the second Galactic source to exhibit superluminal motion for which the dynamical mass estimate proved the presence of a BH (Bailyn et al., 1995a). GRS 1915+105 also exhibits a second type of outflow in the form of an accretion disk wind (Ponti et al., 2012). Studies of the accretion disk wind in GRS 1915+105 have suggested that these winds could act as the jet suppression mechanism in the soft states (Neilsen & Lee, 2009).
The binary system parameters for GRS 1915+105 remained elusive, despite extensive observational effort (Castro-Tirado et al., 1996; Eikenberry et al., 1998; Mirabel et al., 1997; Marti et al., 2000a; Harlaftis et al., 2001; Greiner et al., 2001b), until Greiner et al. (2001a) obtained a radial velocity curve, and therefore .
Inclination has been estimated based on the orientation of the jets ( from Mirabel & Rodríguez 1994 or from Fender et al. 1999b). These parameters, along with the mass ratio estimated by Harlaftis & Greiner (2004), allowed for a dynamical mass estimate confirming the BH accretor. A trigonometric parallax measurement by Reid et al. (2014) on the system yielded a direct distance measurement and a revised estimate for BH mass.
II.2.71 4U 1956+350 (A) — Cyg X-1
Cygnus X-1, one of the brightest X-ray sources in the sky, was discovered in the X-rays by the UHURU satellite in 1971 (Tananbaum et al., 1972). The X-ray emission has been shown to exhibit strong variability on timescales from millliseconds to months (Priedhorsky et al., 1983; Miyamoto & Kitamoto, 1989).
Numerous spectral and timing studies over the years (Holt et al., 1979; Ling et al., 1983; Belloni & Hasinger, 1990; Kitamoto et al., 1990a; Barr & van der Woerd, 1990; Ubertini et al., 1991a; Miyamoto et al., 1992; Gierlinski et al., 1997; Zdziarski et al., 2002; Pottschmidt et al., 2003; Wilms et al., 2006; Gierlinski et al., 2010; Grinberg et al., 2013) have shown Cyg X-1 to spend most of its time in the HCS, resulting in its X-ray spectrum never fully being disk dominated (Grinberg et al., 2013). Cyg X-1 often undergoes “incomplete” state transitions, never fully transitioning to the softer states (Pottschmidt et al., 2003). This extended hard state of Cygnus X1 shows weak and persistent radio emission, which has been resolved to be a steady jet (Stirling et al., 2001). In fact, the “incomplete” transitions exhibited by this source are thought to be connected to the radio jet, as jet activity is thought to be quenched in the soft accretion states (Tananbaum et al., 1972).
With this being said, the source has been occasionally observed in the soft state (e.g., see Grinberg et al. 2011; Yamada et al. 2013; Jourdain et al. 2014; Grinberg et al. 2014a) and there is evidence for the presence of a weak compact jet in the softer states of Cyg X-1 (Rushton et al., 2012). For a complete list of X-ray studies see Table LABEL:table:outhistBH. For studies of Cyg X-1 at radio wavelengths, see Hjellming & Wade (1971b); Hjellming (1973); Tananbaum et al. (1972); Stirling et al. (2001); Gleissner et al. (2004); Fender et al. (2004, 2006).
This system is known to contain a O9.7Iab type supergiant companion (Gies & Bolton, 1986), which orbits around a compact object with a period of days (Holt et al., 1979). Over the past 44 years, many estimates on the mass of the compact object have been made (Orosz et al., 2011a). While there exist several low-mass models (Trimble et al., 1973; Bolton, 1975), all conventional models, which assume an O-type supergiant companion (Paczynski, 1974; Gies & Bolton, 1986; Ninkov et al., 1987; Caballero-Nieves et al., 2009), find a large (and uncertain) mass of the compact object exceeding , therefore confirming a BH primary. (Kalogera & Baym, 1996).
The large range of these mass estimates is mainly due to the large uncertainty in distance to the source (Reid et al., 2011). With the more recent trigonometric parallax distance measurement calculated by Reid et al. (2011), Orosz et al. (2011a) was able to build a complete improved dynamical model for Cyg X-1, including , and . We make use of this dynamical model for the purposes of our analysis.
II.2.72 4U 1957+115 (C)
4U 1957+115 was discovered by UHURU in 1973 (Giacconi et al., 1974). Despite having an X-ray brightness that is comparable to (and occasionally larger) than the well-studied persistent BH sources LMC X-1 and LMC X-3, little is known about the nature of the system (Nowak et al., 2008).
Optical spectra reveal a power-law continuum with H, H and He II 4686Å emission lines (Cowley et al., 1988; Shahbaz et al., 1996a), typical of systems dominated by an accretion disk (Thorstensen, 1987). Long-term variations in the optical light curve have revealed modulations (interpreted as evidence for an accretion disk with a large outer rim (possibly due to a warp) that is seen close to edge on; Hakala et al. 1999) with a 9.33 hour period, generally believed to be the orbital period of the system (Thorstensen, 1987).
The short orbital period, indicative of a late-type main sequence star as a companion, and the absence of X-ray eclipses, has allowed for an upper limit estimate of inclination between and , which is consistent with the model of optical variability (Hakala et al., 1999).
4U 1957+115 was first classified as a possible BHC in 1984 when EXOSAT observations revealed a very soft spectrum (Ricci et al., 1995). Observations by Nowak et al. (2008), who analyzed the complete set of available data from RXTE, and more recently, Nowak et al. (2012), reveal that the X-ray spectrum is a pure disk spectrum 85% of the time, with the remaining 15% involving some non-thermal component.
This dominant soft spectrum, coupled with the observed low fractional variability (Nowak & Wilms, 1999; Wijnands et al., 2002; Nowak et al., 2008), both characteristic of the soft state, make 4U 1957+115 one of only three BHCs that not only remains persistently in outburst but also spends most of its time in the soft disk-dominated accretion state (Nowak et al., 2008). Further evidence for this behavior is implied from the recent radio non-detection (Russell et al., 2011b), as jet production is believed to be quenched in the soft state. While 4U 1957+115 may not show evidence for a relativistic jet, this source has been observed to exhibit an outflow in the form of an accretion disk wind (Ponti et al., 2012). As there exists no dynamical mass or distance measurements for the system, X-ray and optical observations, analyzed at different times, have been used to argue whether the compact object is a BH (Wijnands et al., 2002; Nowak et al., 2008, 2012; Maitra et al., 2013; Gomez et al., 2015) or NS (Yaqoob et al., 1993; Ricci et al., 1995; Robinson et al., 2012). Regardless of the uncertainty, we include this system in our sample as a possible BHC.
II.2.73 GS 2000+251 (A)
GS 2000+251 was discovered by the ASM aboard GINGA in 1988 (Tsunemi et al., 1989). The source has been observed to exhibit spectral and temporal characteristics similar to other X-ray nova systems believed to contain BH primaries (van Paradijs & McClintock, 1995; Tanaka & Lewin, 1995). Hjellming et al. (1988) found a transient radio source associated with GS 2000+25 exhibiting a spectrum that was fit well with a synchrotron model, similar to the radio emission observed in 1A 062000 (Owen et al., 1976), suggesting the possibility of a radio jet in the system. Optical photometry after this outburst revealed that the system had a 8.3 hour orbital period (Chevalier & Ilovaisky, 1993). Dynamical measurements first obtained by Filippenko et al. (1995) and later improved upon by Casares et al. (1995a) and Harlaftis et al. (1996) revealed a , subsequently confirming the BH nature of the primary. The distance to this source is estimated by Barret et al. (1996a).
Ioannou et al. (2004) has performed the most extensive study of ellipsoidal variability. They measure an inclination of , which is consistent with estimates by Callanan et al. (1996) and Beekman et al. (1996). However, while Kreidberg et al. (2012) conclude that the source was passive during their observations, they suggest their inclination measurement is depressed due to the binning of the light curves, which can slightly decrease the amplitude of ellipsoidal variations. Following Kreidberg et al. (2012) we adopt from Callanan et al. (1996), and assume a uniform distribution across this range to calculate .
II.2.74 XTE J2012+381 (C)
The transient X-ray source XTE J2012+381 was discovered with the ASM aboard RXTE in 1998 during outburst (Remillard et al., 1998). The light curve exhibited FRED like behavior (Chen et al., 1997) and the X-ray spectrum was well described by a combination multicolor disk black body ( keV) and power-law with photon index (White et al., 1998), characteristic of BHXBs (McClintock & Remillard, 2006). In addition, extensive spectral and timing analysis of this outburst reveal the source exhibited the typical “turtlehead” evolution seen in BHXBs, transitioning between the hard and soft states (Vasiliev et al., 2000; Campana et al., 2001). The radio counterpart was discovered by Hjellming et al. (1998b), while Hynes et al. (1999) identified a probable optical counterpart with a faint red star heavily blended with a brighter foreground star. Given the light curve behavior, spectral and timing characteristics, XTE J2012+381 is considered a BHC.
II.2.75 GS 2023+338 (A) — V404 Cyg
GS 2023+338 (V404 Cyg) was discovered with the GINGA satellite in 1989 during outburst (Makino, 1989). V404 Cyg is one of the most well-known transient X-ray sources due to both its high X-ray luminosity and levels of variability at many different wavelengths in outburst and quiescence (Tanaka & Lewin, 1995; Hynes et al., 2002). The many X-ray observations (Kitamoto et al., 1989; in ’t Zand et al., 1992; Miyamoto et al., 1992, 1993) that exist have shown that, despite its high X-ray luminosity, no soft component exists in the spectrum (Oosterbroek et al., 1997), suggesting that V404 Cyg is a “hard-only” outburst source (Brocksopp et al., 2004). While this fact has been disputed by Zycki et al. (1999), who claim that the source spent a short period of time in the soft state, we consider the 1989 event as a possible “hard-only” outburst. Two additional outbursts of this source have been found on photographic plates at the Sonnenberg Observatory (Richer, 1987). V404 Cyg began its fourth recorded outburst in June 2015 (Negoro et al., 2015b; Kuulkers et al., 2015).
The source has also been detected at radio (Hjellming & Han, 1989) wavelengths. The persistent radio emission displays a flat spectrum, which is indicative of a self-absorbed synchrotron jet (Gallo et al., 2005; Miller-Jones et al., 2008). In addition, another type of outflow in the form of an accretion disk wind has also been observed in this source (Oosterbroek et al., 1997). The optical counterpart was identified by Wagner et al. (1989) as Nova Cygni 1938. Further optical observations led to a calculation of the mass function by Casares et al. (1992), which was later refined by Casares & Charles (1994) to be , confirming the BH nature of the primary. Shahbaz et al. (1994b) modelled ellipsoidal variations of the source obtaining a day orbital period. More recently, Miller-Jones et al. (2009) obtained a distance to V404 Cyg of kpc using trigonometric parallax, making this the first accurate parallax distance measurement to a BH system. We make use of this distance, which is significantly lower than the previously accepted values, for the purposes of our analysis.
The light curve of GS 2023+338 exhibits strong aperiodic variability making it difficult to obtain precise inclination measurements for the system. Wagner et al. (1992) and Shahbaz et al. (1994a) constrained the inclination to and , respectively. Wagner et al. (1992) obtained their lower limit from observations of Balmer spectral lines and the upper limit based on the lack of eclipses. While Shahbaz et al. (1994a) obtain their range by fitting a star only model, which provided a poor fit due to incorrect color correction. In addition, while Sanwal et al. (1996) fit a star only model to the IR data, the authors note hour time scale variability in the light curve, suggesting the source is most likely in the active state. We therefore adopt the inclination calculated by Kreidberg et al. (2012), which makes use of the inclination estimate from Sanwal et al. (1996) of to obtain a corrected inclination estimate to calculate a .
II.2.76 4U 2030+40 (B) — Cyg X-3
The X-ray source Cyg X-3 was discovered in 1967 (Giacconi et al., 1967). It is the only known Galactic XRB containing a compact object and Wolf-Rayet counterpart (van Kerkwijk, 1993; van Kerkwijk et al., 1996; Fender et al., 1999c). Despite being an HMXB, Cyg X-3 has an unusually short orbital period of only 4.8 hours (van Kerkwijk et al., 1996). The distance to the system is estimated at 7–9 kpc (Dickey, 1983; Predehl et al., 2000; Ling et al., 2009).
Cyg X-3 is a persistently accreting X-ray source that can be observed in both the hard and soft spectral states (Hjalmarsdotter et al., 2008; Szostek & Zdziarski, 2008; Szostek et al., 2008; Koljonen et al., 2010). In addition, it is also the brightest radio source among XRBs (McCollough et al., 1999), exhibiting both strong radio flares as well as resolved jets (Watanabe et al., 1994; Marti et al., 2001; Mioduszewski et al., 2001). The true nature of the compact object in the system remains uncertain (e.g., BH or NS; Hanson et al. 2000; Vilhu et al. 2009; Zdziarski et al. 2013) due to the lack of reliable estimates for the mass function and inclination. However, a BH is favored over a NS given that (i) the X-ray spectral evolution resembles the typical “turtlehead” pattern through BH accretion states, and (ii) the radio/X-ray correlation closely corresponds to that found in BHXB systems (Szostek et al., 2008).
II.2.77 MWC 656 (B) — HD 215227
In 2010, the emission line Be star MWC 656 was found within the error circle of the gamma-ray source AGL J2241+4454 with the AGILE satellite (Lucarelli et al., 2010; Williams et al., 2010). Williams et al. (2010) noted the similarity of its spectral properties and rapid H variations (unusually fast for Be stars) to the gamma-ray binary LSI +61∘303 and analyzed available optical photometry, finding a variation with a period of 60 days, which they interpreted as an orbital modulation of the flux from the disk surrounding the Be star. The distance to the star is known to be kpc (Williams et al., 2010).
Performing a radial velocity study, Casares et al. (2012a) test the binary hypothesis, estimate an inclination of and a compact object mass. Later, with new optical observations Casares et al. (2014) improve upon the previous radial velocity curve and determine a more precise set of binary parameters including a spectral classification of the Be companion of B1.5-B2 III, a mass of the companion star of 10–16 , and a compact object mass of 3.8–6.9 . This evidence makes MWC 656 the first know Be XRB to contain a BH.
The source has also been detected at X-ray (Munar-Adrover et al., 2014) and radio wavelengths (Dzib et al., 2015). Both radio and X-ray luminosities of the source agree with the behaviour of BHXBs in the hard and quiescent state, and the source occupies the same region of the radio/X-ray plane that the faintest known BHs do (e.g., 1A062000 and XTE J1118+480), making it a strong BHC.
III. Data Selection and Analysis
To construct the database we have incorporated data from the All-Sky Monitors (ASMs), Galactic Bulge Scan Surveys, and select narrow-field X-ray instruments available on four separate telescopes, making it possible to study nearly two decades of behavior exhibited by the Galactic BHXB population. Table LABEL:table:telescopes presents specific details on the telescopes and instruments used in this study. Data for this work has been acquired from the the INTEGRAL Galactic Bulge Monitoring Program111111http://integral.esac.esa.int/BULGE/, the MAXI Database121212http://maxi.riken.jp/top/, the High Energy Astrophysics Science Archive Research Center (HEASARC) Online Service provided by the NASA/Goddard Space Flight Center131313http://heasarc.gsfc.nasa.gov/, Craig Markwardt’s (RXTE/PCA) Galactic Bulge Survey Webpage141414http://asd.gsfc.nasa.gov/Craig.Markwardt//galscan/main.html, and Swift/BAT Transient Monitor151515http://swift.gsfc.nasa.gov/results/transients/.
III.1. The All-Sky Monitors
The ASMs are indispensable in the study of XRBs as they (i) provide near real-time coverage of large portions of the X-ray sky across both hard and soft X-ray energies, (ii) operate on short timescales, on the order of 1 day or less, allowing them to track short term changes in behavior in known sources as well as discover new sources, and (iii) accumulate vast databases of activity, which can be used to track outbursts, study evolution and state transitions, and derive a long term history for numerous sources (e.g., McClintock & Remillard 2006; Krimm et al. 2013b).
III.1.1 The Rossi X-ray Timing Explorer (RXTE) ASM
The RXTE (Swank, 1997) satellite was perhaps the most important vehicle for the study of transient phenomena in the last decade due to the wide-sky coverage of the ASM, high sensitivity of the PCA and its overall fast response time (McClintock & Remillard, 2006). The ASM (Levine et al., 1996) aboard RXTE, made up of three wide-field proportional counters, operated in the 1.5–12 keV band from 1996–2012 and had the ability to cover 90% of the sky every orbit, which took about 90 minutes, with a sensitivity between 10–20 mCrab (integrating all orbits over a full day)(McClintock & Remillard, 2006).
III.1.2 The Swift Burst Alert Telescope (BAT)
The BAT X-ray monitor (Krimm et al., 2013b) has provided near real time, wide-field (2 steradians) coverage of the X-ray sky in the 15–150 keV energy range, with an energy resolution of 5% at 60 keV, since 2005. The BAT has the ability to observe 80–90% of the sky every day with a sensitivity of 16 mCrab (integrating scans over 1 day) and arcminute positional accuracy. One of the key characteristics of the Swift satellite is the ability to “swiftly” ( s) and autonomously repoint itself after detection by BAT to bring the source within the field of view of the sensitive narrow-field X-ray and UV/optical instruments that are also on board the observatory.
III.1.3 The Monitor of All-Sky Image (MAXI) Telescope
MAXI (Matsuoka et al., 2009), mounted on the International Space Station (ISS) has the ability to scan 85% of the sky every 92 minutes (one orbit/rotation period of the ISS) with its wide field of view providing near real-time coverage with a positional accuracy of arcminutes and a daily sensitivity of 9 mCrab. The Gas Slit Camera (GSC; Mihara et al. 2011) detector, one of the two ASMs aboard MAXI, contains a proportional counter that covers the 2–20 keV energy band with its large detection area (5000 ) and an energy resolution of 18% at 6 keV.
III.2. The Scanning Surveys
The scanning surveys we make use of observe the Galactic Bulge, a region rich in bright variable high-energy X-ray sources, regularly during all visible periods, and provide high sensitivity long-term light curves of numerous X-ray sources that supplement the all-sky coverage.
III.2.1 The INTErnational Gamma-Ray Astrophysics Laboratory (INTEGRAL) Galactic Bulge Monitoring Program
The INTEGRAL (Winkler et al., 2003; Kuulkers et al., 2007) Monitoring Program has provided periodic scans of the Galactic Bulge since 2005. Data is taken approximately every 3 days (the length of one orbit) and is provided in the form of single observations, consisting of 7 pointings in a hexagonal pattern of spacing 2 degrees, and lasting 1.8 ksec total. The INTEGRAL satellite contains three coded mask imagers. One of which is the Integral Soft Gamma-Ray Imager (IBIS/ISGRI; Ubertini et al. 2003), which has a primary energy range of 20–60 keV, an energy resolution of 8% at 100 keV, and a field of view of 29 square degrees. The other two are the Joint European X-Ray Monitor (JEM-X; Lund et al. 2003) X-ray detectors, which have a primary energy range of 3–35 keV, an energy resolution of 9% and 13% at 30 keV, and a circular field of view of diameter 10 degrees. Note that within each observation, only one JEM-X unit is used at a time. Each observation covers 0.1% of the sky with JEM-X and 2% of the sky with ISGRI, with a sensitivity of 3–9 mCrab.
III.2.2 The Proportional Counter Array (PCA) Galactic Bulge Scan
The Galactic Bulge Scan Survey, which used the PCA (Jahoda et al., 1996; Swank & Markwardt, 2001) aboard RXTE (see Section III.3.2), provided periodic scans of the Galactic bulge region in the 2.5–10 keV energy band between 1999 and 2011. Each scan covered % of the sky with a sensitivity of 3–7 mCrab (estimated from real observations; see Table LABEL:table:telescopes for details).
III.3. Narrow-Field Instruments
We also supplement our database with pointed observations from the PCA and HEXTE instruments aboard RXTE. For details on the reduction of the PCA and HEXTE pointed observations see Section 3.6.
III.3.1 The High Energy X-ray Timing Experiment (HEXTE)
HEXTE (Rothschild et al., 1998) aboard RXTE provided high energy coverage of the X-ray sky in the 15–250 keV energy band, with an energy resolution of 15% at 60 keV, from 1996–2012. HEXTE consisted of two clusters of detectors, each of which contained four NaI(Tl)/CsI(Na) phoswich scintillation counters. Each cluster had the ability to “rock” along mutually orthogonal directions, providing background measurements 1.5 or 3.0 degrees away from the source every 16 to 128 s. Overall, HEXTE was capable of measuring a 100 mCrab X-ray source to 100 keV or greater in live seconds. The field of view per cluster was 1 degree, and all 8 detectors in both clusters covered a net open area of 1600 .
III.3.2 The Proportional Counter Array (PCA)
The PCA (Jahoda et al., 1996) aboard RXTE consisted of an array of 5 proportional counters, which operated in the 2–60 keV161616The energy range of the PCA varied over the instrument lifetime due to gain changes (see, e.g. Shaposhnikov et al. 2012a; Garcia et al. 2014). range, with an energy resolution of 18% at 6 keV, between 1996 and 2012. It had a total collecting area of 6500, a field of view of 16 square degrees and a sensitivity of 1mCrab (estimated from observations; see Heinke et al. 2010).
III.4. Calibration with the Crab Nebula
We use the Crab Nebula to effectively probe the X-ray sky over a wide energy range and long consecutive time periods using the X-ray emission from multiple telescopes/instruments. The Crab Nebula is often used as an X-ray calibration source due to the fact that it has been observed to be a bright, approximately steady X-ray source producing a constant spectrum. We make use of the now accepted “canonical” simple power-law spectrum, originally estimated by Toor & Seward (1974), of the form,
| (2) |
valid in the 2–50 keV range. Note, in this form, the index on the power-law is quoted as . See Kirsch et al. (2005) for a review of past estimates of this spectrum. Using crabs as a baseline unit of flux not only allows us to calculate approximate count rate equivalences in each energy band, therefore giving us the ability to directly compare data from a particular source across telescopes and instruments (i.e., light curves, hardness ratios etc.), but also gives us a straightforward method for converting between count rate and flux in a given energy band (via integration of the known spectrum over the given band).
That being said, our analysis clearly relies heavily on the assumption that the Crab is a steady X-ray source in any given band. Specifically the count rate over the instrumental area (or flux density in counts ) is assumed constant. This assumption brings with it two separate issues. First, being that the Crab is variable, more so at higher energies then lower energies (Wilson-Hodge et al., 2011), which will subtly affect Swift/BAT, INTEGRAL, and HEXTE data. The measured variations reach 10% at most (and no more than 4% in one year), which would lead to smaller flux errors than those produced by the current distance uncertainties in most of our sources. Since correcting for these small variations in the flux of the Crab would be quite difficult, we neglect them in our analysis.
Second, assuming that the spectrum of each of our sources is Crab-like induces errors in the flux computations. As such, we have investigated what the effect on the unabsorbed flux (in a given band) is, if we were to assume a harder photon index ( versus ) or a 1 keV blackbody, using PIMMS171717https://heasarc.gsfc.nasa.gov/docs/software/tools/pimms.html. Within each (fairly narrow) X-ray energy band we find that assuming a Crab spectral shape gives errors on the flux of no more then 20% for a flat power-law versus a blackbody, and typically %, which justifies our approach in assuming the Crab spectral shape for our analysis.
III.5. Other Data Issues
Inspection of the MAXI data suggests that it contains some remaining calibration issues . These problems are most obvious in the MAXI soft (2–4 keV) band, where the Crab light curve, displays oscillatory behavior. Given that many X-ray telescopes regularly monitor the Crab and this behavior has not been reported elsewhere, as well as that these oscillations are observed in a number of other bright sources, this behavior is unlikely to be physical in origin. As including this band would lead to a large systematic uncertainty, the MAXI soft band is not used in our analysis. In addition, we also omit analysis of just the MAXI hard (10–20 keV) band based on its relatively poor signal-to-noise ratio; however we include data from this band for combined analysis with the MAXI medium (4–10 keV) band.
As we are studying sources within the Galaxy across a wide energy range, X-ray absorption by the ISM becomes important, especially in the soft X-ray regime ( keV). LMXBs in the Galaxy show a range of , from to atoms cm-2 (e.g., Liu et al. 2007), with only a few objects (e.g., 1E 1740.72942) having near or above cm-2. This leads to a turnover in the low-energy spectrum, which for a Crablike spectrum occurs around 0.5 keV for cm-2, 1.2 keV for cm-2, 2.2 keV for cm-2, and 3 keV for cm-2. At cm-2, the flux in the 1.5–3 keV energy range is 0.3 of the unabsorbed amount. As such, we choose to omit the RXTE/ASM A band (1.5–3 keV).
III.6. Reduction of RXTE Pointed Observations
To make use of the vast array of pointed observations available in the RXTE public archive, we first collected the available Mission-Long Data Products181818https://heasarc.gsfc.nasa.gov/docs/xte/recipes/mllc_start.html for individual sources. The Mission-Long Data Products, created via the standard data products (StdProds) from the PCA and HEXTE, combine all available good pointed RXTE observations (no scans or slews) of an individual source (i.e., all observation IDs across all available proposals and the many sequential observing years of the RXTE mission). Each ObsID provides one data point for each energy band.
For PCA, a single data point in three separate energy bands (2–4, 4–9, and 9–20 keV) is calculated by taking the average rate of the background-subtracted PCA Std2 mode for that particular observation. For HEXTE, a single data point in the 15–30 keV energy band is calculated by taking the average rate of the background-subtracted HEXTE cluster B archive mode.
However, only 31 sources within our sample have available Mission-Long Data Products. As such, we have made use of existing Perl scripts within the Heasoft Software Package191919http://heasarc.nasa.gov/lheasoft/ to emulate the reduction and subsequent production of the mission-long background subtracted light curve data for the remainder of the sources in our sample.
For HEXTE data, we used the hxtlcurv202020https://heasarc.gsfc.nasa.gov/docs/xte/recipes/hexte.html#script script to create background-subtracted light curves in the 15–30 keV band, with 16 second time bins, from the cluster B archive mode data. For PCA data, we made use of the rex212121https://heasarc.gsfc.nasa.gov/docs/xte/recipes/rex.html script to extract and create background subtracted light curves in the 2–4, 4–9, and 9–20 keV bands from the PCA Std2 data. Following reduction via the specified scripts, we implemented the same procedure as outlined above, whereby long-term light curves are created by combining single data points representing each individual observation.
Note that, after 2009 December 14 (MJD = 55179), HEXTE cluster B no longer had the ability to “rock”. As such the cluster remained in an off-source position and data from this cluster was only used for background estimation until the end of the RXTE mission. In addition, during the time period of 2009 December 14 to 2010 March 29 (MJD = 55179–55284) the telemetry values that indicated the cluster position incorrectly indicated the cluster was on-source in the header files, when it was actually in an off-source position222222https://heasarc.gsfc.nasa.gov/docs/xte/whatsnew/newsarchive_2010.html. For these reasons we do not include any HEXTE cluster B data occurring after MJD = 55179 in our analysis.
III.7. The Algorithm: Outburst Discovery, Tracking, Classification, and Analysis
Data from the seven instruments listed in Table LABEL:table:telescopes are run through a custom pipeline composed of a comprehensive algorithm built to discover, track, and quantitatively classify outburst behavior. The products produced via this algorithm can then be used to analyze the details of outburst behavior, including duty cycles, recurrence times, total energy released during outburst, long-term outburst rates, state transitions, luminosity functions, and mass transfer rates of Galactic BHXB systems (see Section IV). This algorithm consists of a seven stage process; data cleaning, detection, sensitivity selection, X-ray hardness computation, spectral fitting, luminosity function and mass-transfer rate estimation, and empirical classification.
III.7.1 Data Cleaning
The purpose of data cleaning is two-fold. As we have found the background subtraction performed by the surveys to be inadequate and the quoted errors to be underestimated across all four telescopes, it becomes necessary to perform a further background subtraction on the data and include an additional factor in the treatment of the errors. The following analysis is performed on daily averaged data. If the data is collected in the form of orbital data, it is first converted to daily average data by calculating the weighted mean count rate (and uncertainty) over each day of data available (see Bevington & Robinson 2003).
In the case of the transient sources, the algorithm must first be able to identify times when a source was in quiescence for each energy band and instrument combination. To do so, it begins by calculating a background rate using an iterative bi-weight232323Here the bi-weight refers to a robust statistic for determining the central location of a distribution and quantifying the statistical dispersion in a set of data. See Beers et al. (1990) for a detailed discussion. method. This method, which makes use of -clipping, allows for a determination of both the location and scale (i.e., mean and standard deviation) of all the long-term light curve data for the source. This task is performed in part using the astLib.astStats242424Created by Matt Hilton and Steven Boada and available on SourceForge: http://astlib.sourceforge.net. python module, which makes use of methods described in Beers et al. (1990) to provide robust estimations of location and scale (i.e., robust equivalents of mean and standard deviation). From here, quiescence is defined as times in which the count rate is less then above the background rate, .
Generally, if the quoted errors are correct, you would expect the quiescent data to follow a Gaussian distribution (Bevington & Robinson, 2003). However, this is not observed in our data sets, which becomes a serious problem when the algorithm begins to identify individual outbursts (see Section III.7.2). To remedy this problem, an ad hoc method is employed, defining a correction factor as the standard deviation of a Gaussian distribution fit to the quiescent non-detection data. then acts as a multiplicative factor, scaling up the quoted errors appropriately to be .
To ensure that a transient source is not in fact being detected during times that the algorithm has defined as quiescence (which would effectively decrease the value of our errors), we have performed numerous trials comparing the algorithm results to pointed observations with more sensitive instruments found in the literature for the three most well studied recurrent transient sources in the Galaxy: 4U 1630472, GX 3394, and H 1743322.
While the above analysis is adequate for the transient sources, the persistent sources must be handled differently. In this case, the algorithm makes use of background estimates and error corrections (i.e., the standard deviation of the distribution of observed quiescence count rates) reflective of the local transient source population. Here it takes the average background rate and average error correction for all the transient sources within a radius of each persistent source, per energy band, to be the background rate and error correction for each persistent source, respectively. The radius was specifically chosen to ensure that at least two transient sources are used in the background/error correction estimation of each persistent source. The LMC sources are the obvious exception to this criterion as there are no nearby transients from our sample. In their case the algorithm makes use of all transient sources in our sample to compute the background/error correction estimates.
III.7.2 Detection
The detection stage begins by first performing a second background subtraction (via the method outlined in Section III.7.1) on the now error-corrected data, followed by differentiating the data into two separate catagories, (i) detection: in which the count rate ; and (ii) non-detection: in which . Note that negative count rates, which happen on occasion due to over-subtraction of the background are included in the non-detections. From here the algorithm produces lists of individual outbursts detected, in every given energy band (see Table LABEL:table:outhistBH), based on the minimum criteria that there must be at least 2 detections occurring every 8 days to be counted as an outburst. We set a minimum number of detections to eliminate a large number of spurious “outbursts”. This criterion is justified given that we do not currently know of any outbursts from BH transients lasting less than 2 days. Lists of outbursts detected per energy band are then combined, creating outburst lists per instrument, then per telescope, and lastly into a final outburst list for each individual source, taking into account detections from all four telescopes in our data sample (where available).
The detection stage of the algorithm is equipped to deal with (i) situations in which large gaps in the data exist (largely due to Sun constraints), there is a lack of continuous daily coverage (e.g., survey instruments), and there is known down time (e.g., Space Shuttle docked at the ISS affecting MAXI coverage); and (ii) complicated non-trivial behavior exhibited during outburst such as double (or multiple) peak features (e.g., XTE J1550564; Kubota & Makishima 2004), extended flare-like activity (e.g., 4U 1630472; Tomsick et al. 2005), and prolonged outburst periods (e.g., GX 3394; Zdziarski et al. 2004).
To deal with the complicated non-trivial behavior the algorithm repeats the data cleaning (Section III.7.1) and detection (this Section) stages on both weekly (8-day averaged) and monthly (24-day averaged) data with the minimum criteria for an outburst being at least 2 detections occurring every 24 days and at least 2 detections occurring every 72 days, respectively. This is followed by combining the produced results (1-day average, 8-day average, and 24-day average) into a final list of outbursts detected in an individual source.
III.7.3 Sensitivity Selection
Given the variable data quality at times, to ensure that the outburst detector (Section III.7.2) is catching “real” outbursts rather than artificial flare-like/dip-like profiles, which can be the product of unexpected background increases/decreases (i.e., Sun glints) or instrumental errors, the algorithm implements a sensitivity limit.
During the sensitivity selection stage, a weighted mean method (see Bevington & Robinson 2003) is used to calculate the mean count rate () and error on the mean count rate () per outburst. This calculation is followed by the application of a -clip, whereby only outbursts with are considered “real” outbursts. The limit has been determined to be the optimal value through numerous trials comparing the results from the outburst detector to literature detections of the well studied transient sources 4U 1630472, GX 3394, and H 1743322. In the hardness computation stage the algorithm computes hardness ratios using nine different combinations of energy bands, each of which are listed in Table LABEL:table:HRtable.
III.7.4 X-Ray Hardness Computation
The algorithm assumes the form of the hardness ratio to be the hard band flux density (in crab units) divided by the soft band flux density (in crab units) and computes the quantity using a Markov Chain Monte-Carlo (MCMC) method via the emcee python module (Foreman-Mackey et al., 2012). As this problem involves two-dimensional uncertainties, the standard linear formulation (i.e., ) is ill-suited. As such, the algorithm makes use of an alternative model, originally proposed by Hog et al. (2010), which involves parameterizing the slope in terms of the angle that the generative locus (line) makes with the -axis.
Adapting this technique, it parametrizes (slope ) in terms of hard band flux density (-variable) and soft band flux density (-variable) such that,
| (3) |
yielding a log likelihood of the form (Hog et al., 2010),
| (4) |
Initialization is performed using the following prescription,
| (5) |
where is a random number in the range , (E. Rosolowsky, private communication) in combination with a 100 step “burn in” phase.
After likelihood maximization is performed on (via Equation 4 ), a probability distribution function (PDF) of is obtained by taking the tangent of the resulting PDF for found via the MCMC algorithm. The algorithm takes the median of the resulting distribution to be the accepted value of at the particular time , and defines the confidence interval as the upper and lower limits on .
Within our data sets there exist three separate situations. On any given day there may be a (i) detection in both hard and soft bands; (ii) detection in the hard band and non-detection in the soft band, or; (iii) detection in the soft band and non-detection in the hard band.
In case (i), both upper and lower limits on are tabulated. However, in cases (ii) and (iii) the situation is more complex. Here we must be particularly cautious as there is a possibility for large errors on the non-detection data. As such, the algorithm disregards data with large errors by applying a -cut. Here only non-detection data points in which the errors are within of the mean error value for the given band are considered valid252525This mean and error on this mean are calculated via the bi-weight method discussed in Section III.7.1.. Note that this -cut is not applied to detection data (i.e., times in which we have detections in both the hard and soft bands). In a case (ii) situation, where there is only a hard detection, only lower limits on are tabulated. This indicates the source is most likely in the HCS, assuming similar sensitivity in hard and soft bands. Similarly, in a case (iii) situation, where there is only a soft detection, only upper limits on are tabulated. This indicates the source is most likely in the SDS.
The last part of the hardness computation stage involves a calculation of a total hardness range for each outburst, followed by the placement of a “classification flag” on each outburst indicating whether or not it meets the “minimum data requirement”. This requirement indicates whether or not the algorithm has enough data on the outburst to later confidently classify it (via procedure outlined in Section III.7.7). To receive a “classification flag” the outburst must consist of at least 5 data points in which has been computed. In addition to cases where there are not enough data points, an outburst will also fail to receive a “classification flag” when data are only available in one energy band (making the calculation of impossible).
III.7.5 Spectral Fitting
By modelling each day’s flux of a BHXB as a combination of a soft disk black body spectral component and hard Comptonized spectral component, assuming a Crab-like spectrum in each given energy band and a known distance (from the literature), it is possible to obtain X-ray luminosity (in any energy band) for a source on a given day . To accomplish this task we use an algorithm that relies on X-ray hardness to determine the relative dominance of the disk and Comptonized spectral components in the spectrum. Here we have assumed a standard two component spectral model in Xspec, diskbb+comptt, representing (i) the soft disk component of the spectrum with a keV multi-color disk black body, typical of BHXBs in the SDS (McClintock & Remillard, 2006), and (ii) the hard Componized component with the analytical comptt model corresponding to a plasma temperature of keV, a soft disk photon temperature of keV, and an optical depth , which has been calculated to roughly match a typical hard state photon index of 1.7 for the 3–20 keV range, as is often found in BHXBs (McClintock & Remillard, 2006; Done, 2010).
Several sources have been shown to soften as they fade into quiescence (e.g., see Plotkin et al. 2013; Wijnands et al. 2015), but we are not capable of following a source into quiescence with the instruments that we use (i.e., our sensitivity limit is a few times ; see Figure 17). Thus, this trend is not relevant to our analysis.
Each day’s flux for a chosen source and energy band can then be modelled as,
| (6) |
where and are the flux of the diskbb and comptt models for the energy band in question, respectively. Provided that there is one energy band available that can act as a hard band, one available energy band that can act as a soft band, and that at least one of these bands exhibits a detection of the source on the day in question, the algorithm estimates the flux of a source on this day in the chosen energy band using an MCMC method, via the emcee python module (Foreman-Mackey et al., 2012), to fit for the normalization parameters and . For a list of the and constants corresponding to each energy band used in this study see Table LABEL:table:specfit. In this case, the log likelihood takes the form,
| (7) |
Initialization is accomplished by starting the MCMC “walkers” in a very compact grid in parameter space around the point that is expected to be close to the maximum probability point, in combination with the implementation of a 500 step “burn in” phase.
The algorithm computes where this compact grid is located in any particular case by fitting for the and parameters from Equation 6 using a bounded least-squares fitting algorithm (leastsqbound262626Created by Jonathan J. Helmus, leastsqbound is a modified version of the scipy.optimize.leastsq module that allows input of bounds on each fit parameter. Constraints are enforced by using an unconstrained internal parameter list, which is transformed into a constrained parameter list, using non-linear functions. The source code is available via GitHub:https://github.com/jjhelmus/leastsqbound-scipy/.), as bounds are necessary (both and must be greater than zero) to obtain a “physical” flux (i.e., non-negative).
Once and are obtained from leastsqbound, a suitable range for each parameter is found by performing a simple grid search, splitting the parameter space from and into four equal fractional sections (i.e., 1/8, 3/8, 5/8, and 7/8 multiples of the parameter). The grid point with the minimum is applied as a symmetric error for each parameter.
After likelihood maximization is performed, the algorithm takes the median and confidence intervals of the resulting PDFs created via the MCMC algorithm as the accepted value, and upper and lower limits on each of the normalization parameters and , respectively.
Once and are found for a given day, the algorithm can then compute the flux in the 2–50 keV band on that day. This band limited flux is then converted to bolometric flux (0.001–1000 keV) by multiplying each component (disk and comptonized) by a derived bolometric correction from the Xspec models. Lastly, the disk and comptonized flux (and in turn luminosity, ) components are obtained via,
| (8) |
and a disk fraction, , is computed.
We stress that this algorithm assumes one spectral model is valid for all systems. For example, if the disk was in fact hotter then expected (i.e., when a source is in the SDS), then the algorithm would overestimate the Comptonized component and underestimate the thermal disk component in the spectrum. Similarly, if the disk was cooler then expected (i.e., when a source is in the HCS), then the algorithm would underestimate the Comptonized component and overestimate the thermal disk component in the spectrum. This assumption also breaks down when a source has a power-law index that is significantly steeper then the chosen value. This situation could occur if a source enters a SPL state or other anomalous high luminosity variability states (e.g., GRS 1915+105 and IGR J170913624; see Sections II.2.70 and II.2.26 for references).
To determine which outbursts are likely affected by these problems we (i) observe the evolution of the disk fraction over each algorithm-classified outburst, looking for deviations from the expected trend (i.e., lower disk fraction in the HCS and higher disk fraction in the SDS), and (ii) check for appearances (via spectral/timing analysis in the literature) of SPL state behavior (which could be a possible explanation for uncharacteristic behavior in the disk fraction) in outbursts that deviate from the expected disk fraction trend. Overall, this allows us to quantify the problem and eliminate affected outbursts from our analysis (see Sections IV.6–IV.9 and V.2 for a detailed discussion on the impact of this problem).
III.7.6 Luminosity Function and Mass-Transfer Rate Estimation
With the computed bolometric X-ray luminosities , the algorithm next builds an X-ray Luminosity Function (XLF), obtains a time-averaged bolometric luminosity (over the last 19 years), and derives a mass-transfer history for a source.
For transient systems, the algorithm assumes during all quiescent (non-detection) periods. It then uses the days in which data was available (and thus those days an estimate of exists via Section III.7.5) during outburst to interpolate a for the missing days in between. Using the estimates for every day a source was in outburst, the algorithm creates a complete transient XLF. To accomplish this task, the algorithm checks if an exists for every day during an outburst. If no estimate exists, the algorithm takes the nearest days bracketing the missing day(s) on either side (call them and ), that have estimates and performs a linear interpolation using an MCMC method via the emcee python module (Foreman-Mackey et al., 2012).
While the log likelihood may take the standard linear form in the linear interpolation MCMC method, the situation is more complex due to the fact that the flux values have asymmetric errors. We thus add a conditional statement to the likelihood function. If the fit (the flux calculated from fitted parameters and ) obtains a flux value greater than that of the input data point (i.e., the fit is above the data), the upper error bar is used in . In contrast, if the fit obtains a flux value less than that of the input data point (i.e., the fit is below the data), the lower error bar is used in (E. Rosolowsky, private communication). This asymmetric error situation complicates the MCMC initialization procedure. To set the initialization of the “walkers” in the linear interpolation MCMC method the algorithm again makes use of the idea of starting the “walkers” in a very compact grid in parameter space around the point that is expected to be close to the maximum probability point in combination with the implementation of a 500 step “burn in” phase. However, to compute the compact grid, the procedure presented in Section III.7.5,which makes use of the bounded least squares algorithm, must be modified. Performing a Monte-Carlo sampling for each data point (flux ) in the range bracketed by its asymmetric error bars, allows the algorithm to compute the 1 confidence intervals of the resulting distributions and in turn a suitable range for each parameter to create the compact grid.
After likelihood maximization, the algorithm takes the median of the PDF distributions created via the MCMC algorithm as the accepted values of and and the confidence intervals as the upper and lower limits on each parameter. Knowing the values of and across the time interval , it can then interpolate (and in turn calculate ) for the days missing estimates in this time interval and as such calculate a time-averaged bolometric luminosity over the last 19 years via,
| (9) |
The situation is more involved for the persistent systems as, unlike transient systems, many of these sources never fully return to quiescence. Instead persistent sources occasionally transition to a state, often occurring in between long bright outburst periods, in which a low-flux level is maintained. To deal with this situation the algorithm first estimates a detection limit, , for each particular source, by fitting the non-detection data (using the procedure outlines in Section III.7.5) to find the lowest non-detection luminosity upper limit. Whenever , then is assumed to be the true luminosity on that day.
In contrast, when the algorithm is equipped to deal with three separate cases: when a source, on a particular day, in a given energy band, is detected (i) above where the source is normally detected during that time period (e.g., when the Sun is near the Galactic Center or when a nearby bright source goes into outburst), (ii) below where the source is normally detected during that time period (e.g., a clear decrease in luminosity), or (iii) where the source is normally detected during that time period within error (e.g., no discernible increase/decrease in luminosity).
To quantify the limits on when a source is below , we begin by estimating a local sensitivity limit in each available energy band for the day in question. This is done by finding the weighted mean (and corresponding error) of the local data points corresponding to the closest two days bracketing on either side, in each available instrument/energy band (in crab units). From here we then compare the flux (in crabs) of the source on the day in question, , to this sensitivity limit in that band. If at least one instrument/energy band has a lower limit of greater then the upper limit of (i.e., case i), then we use the linear interpolation method, described above for transients, to estimate of the source on this day. If none of the data satisfies the above condition, then the algorithm checks if any of the available data show consistent (within error) of (i.e., case iii). If at least one instrument/energy band satisfies this condition then we assume on that day for each available energy band, and then use these new estimates for flux to fit for using the spectral fitting algorithm discussed in Section III.7.5. Lastly, if all available instrument/energy bands have an upper limit of less then the lower limit of (i.e., case ii), then we assume the flux on that day is a uniform distribution between zero and the lower limit of in each available energy band, and then fit for using the spectral fitting algorithm discussed in Section III.7.5. We stress that, if all requirements for spectral fitting are not met on any particular day (e.g., we do not have at least one energy band which can act as a soft band and one energy band which can act as a hard band, see Section III.7.5 for detail) or no data exists on this day, then the algorithm will default to using the linear interpolation method, described above for transients, to estimate of the source using the closest available luminosity estimates bracketing the day in question.
Because we are dealing with non-detection data, there is a possibility of large errors in flux. To deal with this possibility we use the same method used in our X-ray hardness computation algorithm, whereby we test whether a band limited flux has an error greater then of the mean error value for the given band (see Section III.7.4). If this condition is satisfied in a given band, we ignore the data and instead interpolate the flux on this day using the algorithm described above for the transient sources and the local flux data points corresponding to the closest two days bracketing the day in question on either side. Using this interpolated flux we then follow the the same three step procedure described previously to estimate .
Following the estimation of on every day over the past 19 year period, a time-averaged bolometric luminosity is calculated for each persistent source using Equation 9. Lastly, using this calculated for all transient and persistent sources, the algorithm estimates a long-term averaged mass-transfer rate for each individual source via,
| (10) |
where denotes accretion efficiency.
To provide an accurate estimate of , the algorithm uses Monte-Carlo simulations to take into account the uncertainties which come into the calculation in the form of errors in distance (), and spectral modelling (fit parameters and ). Accretion efficiency () is fixed at 0.10, corresponding to radiatively efficient flow through a thin accretion disk (Frank et al., 2002) Once again, the algorithm takes the median of the resulting distribution of to be the accepted value and the confidence interval as the upper and lower limits on this value.
We note that if the true accretion efficiency differs from the chosen value of 0.1 at any point during outburst (e.g., during the lower-luminosity hard state, which is thought to be dominated by radiatively inefficient flows; Narayan & Yi 1994; Meyer-Hofmeister 2004; Knevitt et al. 2014), then the resulting will be affected to a certain degree. See Section V.1 for a thorough discussion of the factors that have the potential to affect the long term balance of BH systems.
III.7.7 Empirical Classification
In the final stage, the algorithm makes use of the empirical hardness ratio () parameter to categorize outburst behavior into one of three classes: “successful”, “indeterminate”, and “hard-only”.
The classification procedure begins by differentiating data for each outburst into hard, soft, and intermediate states based on critical hard and critical soft hardness values. As these critical values will differ depending on the telescopes involved in , the algorithm makes use of 10 calibration sources (found in Table LABEL:table:calibS) to set these baseline critical values. These calibration sources have been specifically chosen based on the criteria that they have exhibited (proven via spectral and/or timing analysis) either “hard-only” outbursts, or a combination of “successful” and “hard-only” outbursts over the last 19 years. The literature classification is then used to find the baseline critical values for each of the nine combinations. See Table LABEL:table:HRtable for the critical values corresponding to each combination.
The criteria for a source to be in the soft state requires at least one upper error bar on , . In turn for a source to be in the hard state, all lower error bars on , . If the observation does not fall into either category, then the source is classified to be in an intermediate state.
was found by taking the minimum for each “hard-only” calibration outburst, followed by finding the absolute minimum of these values across all calibration sources, yielding the softest a source can be while still remaining in the hard state. is found by taking the minimum for each “successful” calibration outburst (thus fulfilling the minimum requirement for a source to reach the soft state that at least one ), followed by finding the absolute maximum of these values across all calibration sources, yielding the hardest a source can be while still being in the soft state.
There are multiple telescope pairs involved in this process (between 1–9 separate pairs). As such, each pair of observations (two bands involved in ) will indicate whether the source is currently hard, soft, or intermediate. The algorithm must be able to take into account all possible combinations of hard, soft, and intermediate classifications and logically combine them to classify the outburst as a whole. If a classification flag exists on the outburst the algorithm will perform the following procedure. If all observations during the outburst classify the state of the source as hard, then the outburst is classified as “hard-only”. If any observations during the outburst classify the state is soft, then the outburst is classified as “successful”. If neither of these conditions are met and/or if no classification flag exists, the outburst is classified “indeterminate”, which indicates that the outburst was detected by the algorithm but that there was not enough data available to confidently determine whether or not the source reached the soft state during the outburst.
We recommend caution when interpreting both outburst classification and accretion state when only RXTE/ASM hardness ratios (i.e., 5–12 keV/3–5 keV; “RR”) are available. We have found that when using the ratio of 3–5 keV and 5–12 keV RXTE/ASM fluxes, if the disk is hotter than we would typically assume for a source in the soft state, then the hardness ratio will mimic a ratio typical of the HCS, leading to mis-classification of the accretion state of the source on a given day and in-turn the possibility for the outburst as a whole being classified wrong by our algorithm. We have also found that if an unusually power-law dominant SPL state occurs, then the algorithm will incorrectly label this state as the HCS as we do not have the ability to differentiate the SPL state from the HCS state due to the limited available spectral information. If this situation occurs, it is possible for our “successful”/“hard-only” dichotomy to be confused. See Section IV.3 for specific examples of sources that display this behavior and further discussion on the impact these issues have on our “successful” and “hard-only” outburst detection rates.
IV. Results
IV.1. Outburst History
Combining the outburst detector, tracker, and empirical classification tools of the algorithm with an exhaustive literature review we have compiled a complete outburst history for the Galactic (transient and persistent) BHXB population encompassing over 50 years of activity and including over 200 outbursts in 66 transient sources and the long-term activity of 11 persistent sources.
Table LABEL:table:outhistBH presents, on a source by source basis, (i) a complete outburst list, (ii) the beginning and end times of outbursts (in MJD) detected by the algorithm, or the outburst year if record of the outburst is only found in the literature, and a unique outburst ID, (iii) literature and (where applicable) algorithm classification, (iv) a list of instruments that have detected each outburst, and (v) an extensive list of references. Any discrepancies existing between the literature classification and algorithm classification and/or instances in which the algorithm did not detect an outburst found in the literature, are discussed on a source by source basis in the footnotes of Table LABEL:table:outhistBH.
IV.2. Outburst Detection Rates
Calculating the overall (and instrument specific) outburst rate for transient BHXB events in the Galaxy is a non-trivial task as it depends on the sky coverage, lifetime, and limiting sensitivity of instruments launched at different times (Chen et al., 1997). To address these issues we begin by estimating outburst rates per year, with quoted 1 Gehrels errors (Gehrels, 1986), for each individual instrument (see Table LABEL:table:outrate).
We attempt to quantify sky coverage and instrument lifetime by using only the time in which data was being taken by the instrument (), rather than the total time the instrument was active () in the calculation of this rate.
Due to Sun constraints, most X-ray instruments do not point near the Galactic Bulge region (where most of our sources are located) around December every year. To take into account these Sun constraints in the calculation of for Swift/BAT and RXTE/ASM, we assume that for one month per year of operation the instrument in question was not actively observing, yielding in both cases. Given that MAXI has no Sun constraint, we assume that the GSC aboard MAXI has taken data daily for the full time period it has been active (i.e., ).
The instruments involved in the scanning surveys (as well as those that have pointed observations available) only take data in short consecutive intervals resulting in . To calculate for PCA, ISGRI, and JEM-X we begin by parsing through all available data on an individual source (including the scanning survey and/or pointed observations), checking if data is available from that instrument on a 8 day time scale. If the instrument observed the source at least once in any particular 8-day time period, that full time period is counted toward the total time the instrument was observing. If the algorithm finds a time gap greater than 8 days in which the instrument has no observations of the source, the total duration of this gap is calculated and subsequently not counted toward the total time the instrument was observing. Once the total observation time is calculated for each transient source, an average over all transient sources is calculated. This average is then used to calculate for the instrument in question.
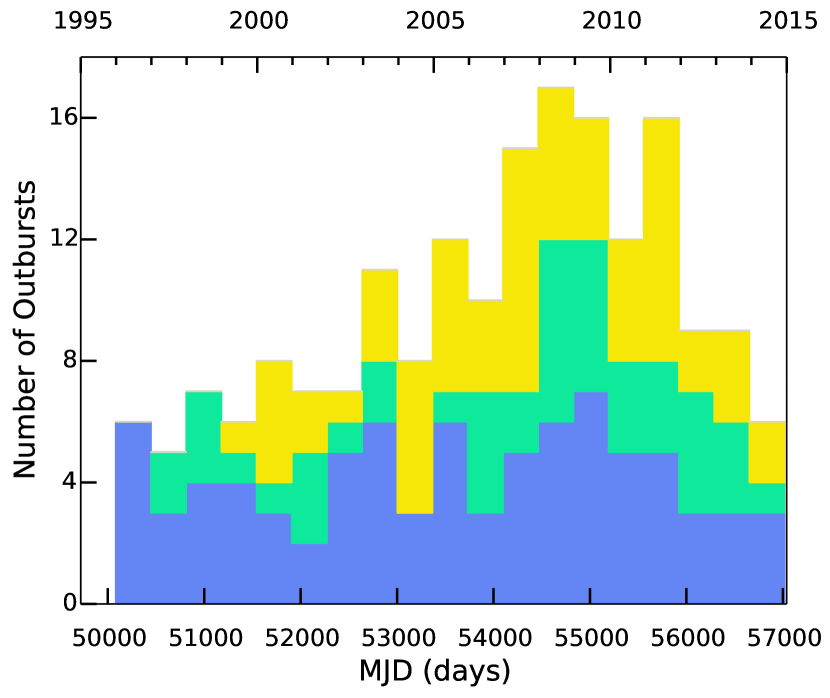
We do not attempt to take into account the differing limiting sensitivities between the instruments used in this study (e.g., PCA is the most sensitive soft instrument and INTEGRAL is the most sensitive hard instrument).
Overall, our algorithm has detected 132 outbursts occurring in 47 transient BHXBs between 1996 January 6 – 2015 May
14 (see Figure 2). Taking the above mentioned factors into consideration, we estimate that with the current suite of instruments in space we are detecting 4–12 BHXB transient events every year, more than a factor of three larger than in the pre-RXTE era (Chen et al., 1997).
Note that on 2015 May 14 (the cutoff date for our analysis in this paper), 4U 1630472 and GX3394 were both in the decay stage of their most recent outbursts (and had already reached the soft state during their outburst). As such, these outbursts are included in all of our analyses with the exception of the outburst duration statistics. In addition, during the months of June and July (2015), H 1743322, GS 135464, GS 2023+338 (V404 Cyg), and SAX J1819.32525 (V4641 Sgr) were all observed in outburst again. While these outbursts occurred after the cut-off date, and therefore are not included in our analysis, we still make an effort to provide an up-to-date list of references for them. See the relevant subsections of Section II and Tables LABEL:table:primaryBH and LABEL:table:outhistBH.
IV.3. “Hard-only” Outburst Behaviour
Using the empirical classification tools of the algorithm, we have been able to classify the behavior exhibited during (i) 92 of the 132 total transient outbursts detected and (ii) the bright periods of 10 of the 11 persistently accreting BH sources, over the last 19 years.
In contrast to the picture found in much of the large-scale population studies in the literature on state-changing versus “hard-only” BHXB behavior (e.g., Zhang et al. 2007; Dunn et al. 2010), we find that the outbursts undergone by BHXBs that do not complete the “turtlehead” pattern (i.e.,undergo a state change), failing to transition from the HCS to the SDS, the so-called “hard-only” outbursts, make up 40% (i.e., ) of all outbursts occurring in Galactic transient BHXBs in the past 19 years. Table LABEL:table:failedrate presents the “hard-only” ratio, quoted with 1 binomial Gehrels errors (Gehrels, 1986), computed for each of the nine separate hardness ratios used in the algorithm, while Table LABEL:table:failedovertime presents the “hard-only” ratio as it changes over time. With these numbers, it is clear that the “hard-only” outbursts represent a (surprisingly) substantial contribution to the total outburst sample.
By splitting the 19 year period we studied into logical segments defined by the addition/loss of each instrument, we find that after Swift and INTEGRAL were turned on the rate of observed outbursts increased by and the “hard-only” ratio increased by (see Table LABEL:table:failedovertime). While this suggests that the “hard-only” outburst ratio may have increased when the threshold for detection was lowered (i.e., since “hard-only” outbursts are faint, higher sensitivity instruments would detect more “hard-only” outbursts), the difference in “hard-only” ratios is only significant at the level. Moreover, through an extensive literature search (as presented in Table LABEL:table:outhistBH), we find a near constant appearance of these “hard-only” outbursts over the last years. Our findings suggest the “hard-only” behavior is neither a rare nor recent phenomenon.
We postulate that the steady appearance of these “hard-only” outbursts over the last years is indicative of an underlying physical process that is relatively common. Such a physical process would likely involve the mass-transfer rate onto the BH remaining at a low level rather than increasing as the outburst evolves, resulting in no state transition to the softer states occuring. To test this theory we must be able to determine whether or not a “hard-only” outburst reaches the luminosity regime where the transition to the soft state tends to happen (i.e., are all “hard-only” outbursts faint, as the detection ratios above tentatively suggest). We have therefore compared the peak Eddington scaled luminosities of all algorithm classified “hard-only” outbursts for which our spectral fitting algorithm succeeded (see Section IV.6 and Table LABEL:table:lumdata), to our estimated mean HCS-SDS transition luminosity (; see Section IV.5). We find that all of these outbursts (with the exception of GS 135464) either have (i) upper limits on their Eddington scaled peak outburst luminosities that are , or (ii) have Eddington scaled peak luminosities consistent within error of the regime. Overall, this suggests that “hard-only” behavior may indicate that a source did not reach the required mass transfer rate needed to transition to the soft state. In the case of GS 135464, the distance is poorly constrained (25–61 kpc). If we were to place this system at our assumed standard Galactic value (i.e., a uniform distribution between 2 and 8 kpc), its Eddington scaled luminosity would be consistent within error of the regime.
This being said, additional factors need to be addressed before such a strong claim against selection biases are made. These factors include (i) the effect that distance could have on the outburst behaviors that we are able to observe, as an increase in sensitivity could largely increase the distance range within which we could observe the same outburst behaviors, (ii) the significance of individual instrument performance on outburst detection rates over time (e.g., RXTE/ASM detected significantly fewer outbursts towards the end of its life in 2011–2012 in comparison to during its earlier operation; Yan & Yu 2015), and (iii) the change in sensitivity of each instrument between soft and hard X-rays (i.e., while RXTE ASM and PCA included high sensitivity to soft state X-rays, INTEGRAL/ISGRI and Swift/BAT are only sensitive to hard X-rays, INTEGRAL/JEM-X has a relatively small field-of-view, and the only band in MAXI we found useful is not sensitive below 4 keV).
Lastly, we find, through our ability to track the accretion state of a source throughout an outburst via the algorithm (see Section IV.5 and Tables LABEL:table:statetransitions and LABEL:table:statetransitions2), that this particular class of behavior is not limited to the transient systems, but is also exhibited by a number of persistently accreting systems. Rather than a “hard-only outburst”, this behavior manifests in the form of long continuous periods spent in the HCS (in the case of Cyg X-1, 1E 1740.72942, and SS 433) or periodic “incomplete” state transitions (in the case of GRS 1758258 and Swift J1753.50127). See Sections IV.6 and IV.8 for further discussion on these behaviors.
As discussed in Section III.7.7, there is a possibility that some “successful” outbursts may be mis-classified as “hard-only” when using RXTE/ASM data alone if (i) the disk is hotter then we typically expect in the soft state, or (ii) the source enters into an unusual power-law dominated SPL state, which may be mislabelled as a HCS. To investigate whether case (i) (see Figure 3 for example of this behavior) has caused any mis-classifications we analyzed all 92 algorithm classified outbursts, looking for those that had only RXTE/ASM available, and then used spectral studies in the literature to confirm or refute that the algorithm-classified accretion states reached during the outburst in question. In doing so, we found that this was a serious issue affecting the group of outbursts detected prior to the beginning of the Swift, INTEGRAL, and MAXI missions. This group amounted to over a third of the algorithm classified outbursts. To circumvent the issue we adjusted our classification scheme to include all available pointed observations from PCA and HEXTE (see Section III.6 for details). With the addition of the new data, only 13 of the algorithm-classified outbursts had only RXTE/ASM coverage. Among these 13 outbursts, we found no discrepancies between literature and algorithm classifications. Note that, while this behavior persists over the full 19 year period of our analysis, the availability of data from multiple telescopes after 2005 has allowed for the possibility of outbursts being classified with multiple instruments/energy bands. As such, the ASM-analysis alone in these cases has had no effect on the final outburst classification.
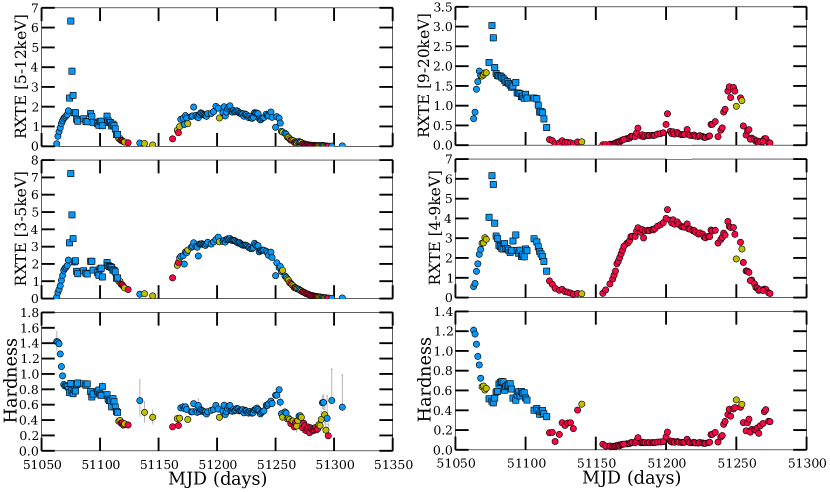
To investigate whether case (ii) has caused any outburst mis-classifications, we have compared our algorithm and literature classifications for all 92 outbursts in our sample and cross referenced any differences with the proven appearance of a SPL state via spectral/timing studies in the literature. In doing so we find one instance that meets this criteria, the 1998 outburst of XTE J1748288 (see Figures 4 and 5). During this outburst Revnivtsev et al. (2000c) were able to distinguish between the SPL, SDS, and HCS using a combination of spectral and timing analysis. In doing so they found an abnormally bright hard component (power-law contributed % of the 3–25 keV flux) during the observations in the SPL state.
This type of behavior is not an anomalous spectral feature exclusive to this source. It has been observed during the SPL state in a handful of sources including GS 1124684 (Kitamoto et al., 1992; Ebisawa et al., 1994), GRS 1730312 (Borozdin et al., 1995; Trudolyubov et al., 1996), GRS 1739278 (Borozdin et al., 1998), and 4U 1630472 (Trudolyubov et al., 2001). In addition to XTE J1748288, our algorithm classifies this power-law dominant SPL state behavior as the HCS in RXTE/ASM data on a number of other occasions (e.g., GRS 1739278 and 4U 1630472; see Figures 4–7), though the mis-classification of these few single observations does not affect the final outburst classification as a whole in any of these cases.
Lastly, we note that many of the algorithm detected outbursts that have been classified as “hard-only” are also under sampled, which brings with it the possibility that we may be missing the soft state due to the lack of coverage.
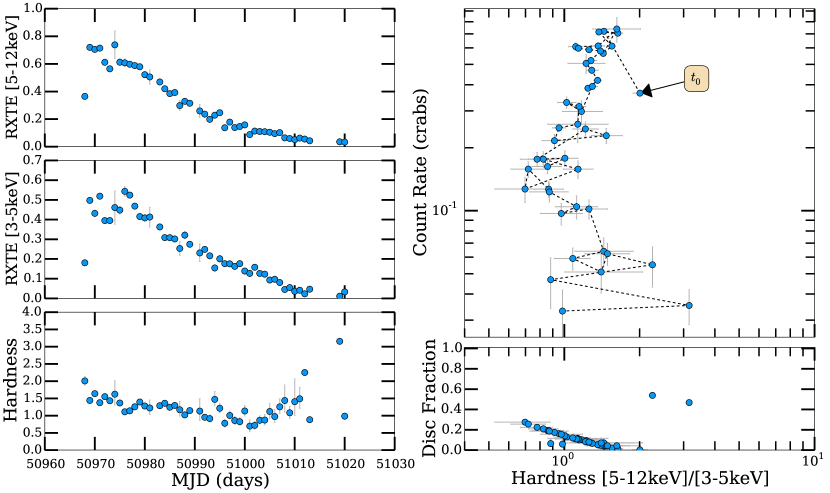
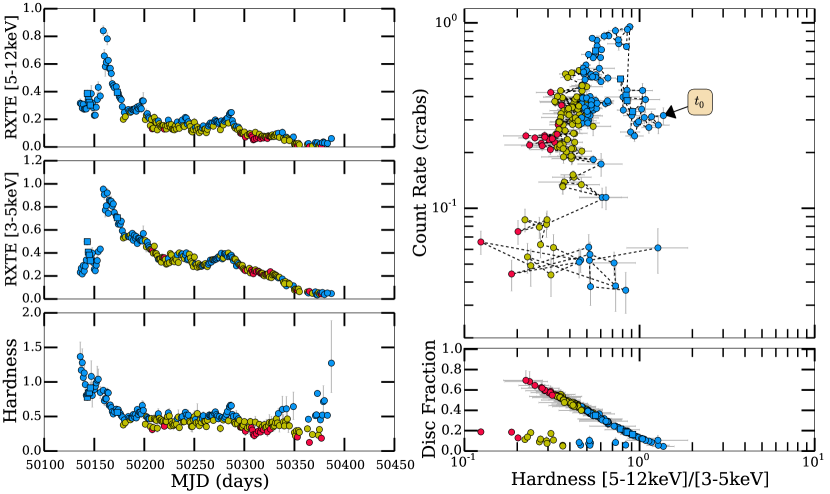
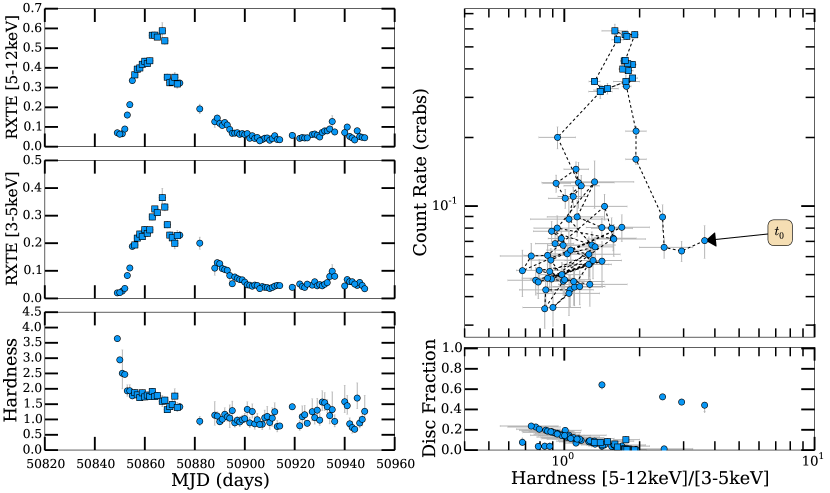
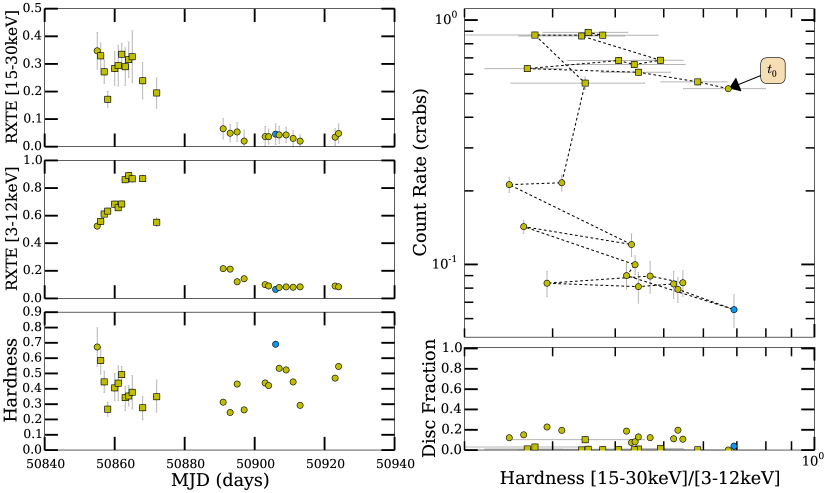
We have checked all 32 outbursts that have been classified as “hard-only” by the algorithm against available spectral/timing information in the literature, confirming that 19 of these outbursts have been classified as “hard-only” in the literature. If we assume as a worst case scenario that the remaining 13 algorithm classified “hard-only” outbursts are in fact “successful” outbursts, the ratio obtained would still be within the quoted error range (see Table LABEL:table:failedrate). While we may not be able to confidently rule out a source’s presence in the soft state in many of these “hard-only” cases, the 1 Gehrels errors provides a very conservative range on the “hard-only” outburst ratio.
IV.4. Outburst Duration, Recurrence Rate and Duty Cycles
We have calculated the duration of 130 of the 132 (only excluding the ongoing (as of May 2015) outbursts of 4U 1630472 and GX 3394) transient outbursts and the 2 outbursts from the long-term transients detected by the algorithm (see Figure 8 and Table LABEL:table:transienthistory). We find that the mean outburst duration for the Galactic transient (and long-term transient) BHXB population is days. When comparing the outburst durations of “successful” (i.e., state transitions have occurred) versus “hard-only” outbursts, we find mean outburst durations of and days, respectively. In addition, we test whether or not the durations of “successful” and “hard-only” outbursts are systematically different by performing a two sample KS-test. We find a p-value of , providing clear statistical evidence that the durations of “successful” and “hard-only” outbursts do not arise from the same parent distribution.
Using these durations and the number of outbursts detected, we have estimated the duty cycle for the 47 transient and 2 long-term transient sources in which the algorithm has detected at least one outburst in the last 19 years (See Table LABEL:table:transienthistory). The duty cycle, defined as the fraction of its lifetime that a transient source has spent in outburst, is an important parameter needed to understand both the luminosity functions and binary evolution of these types of systems (e.g, Belczynski et al. 2004; Fragos et al. 2008, 2009). As such, being able to quantify the range of duty cycles exhibited by the transient BH population is of crucial importance.
Figure 9 shows the distribution of duty cycles, calculated by taking the total time each source has spent in outburst and dividing by the total observation time (1996 January 6 – 2015 May 14; days), for all 47 transient and 2 long-term transient BH sources. Here the dividing line between outburst and quiescence is defined as a count rate (in crabs) greater then the background rate plus for each individual source (see Sections III.7.1 and III.7.2 for thorough discussion). We find a wide distribution of duty cycles exhibited by the transient population. Including upper limits we find duty cycles ranging from 0.20–100%, with an mean value of 10%, a median value of 2.7%, and that there is no observable systematic difference in duty cycle between those sources that have exclusively undergone “successful” outbursts, exclusively undergone “hard-only” outbursts, or have undergone a combination of the two types of outbursts over the last 19 years.
We note that many of the sources in our sample have only undergone one outburst during the 19 year time period, making the duty cycle we estimated only an upper limit on the true value. While the long term evolutionary history of these transient systems may not be fully represented by the 19 years of behavior we have cataloged, our analysis can at least provide order of magnitude estimates for their duty cycles, which are still exceedingly helpful input into the theoretical modelling of luminosity functions and binary evolution codes (Yan & Yu, 2015).
We note that in making this argument we are assuming that the outburst recurrence times for these systems do not exceed years (an order of magnitude longer than our observation history). To determine if this assumption is valid we begin with an analytical relationship between orbital period and recurrence time. Using the Disc Instability Model (e.g., see Meyer & Meyer-Hofmeister 1981; Cannizzo et al. 1995; King & Ritter 1998; Lasota 2001) and assuming recurrence time can be estimated as the time required to fill the disk to its maximum mass , Menou et al. (1999) find,
| (11) |
where is the viscosity parameter, is the mass of the BH, is the mass transfer rate onto the BH, and is the disk outer radius in units of cm. Following Menou et al. (1999), we assume is approximately 70% of the Roche-lobe equivalent radius and use the formula for the Roche lobe equivalent radius given by Paczynski (1971) to approximate .
From Equation 11, it is clear that a large would be needed to give a long recurrence time. For a system with a BH, and an typical for longer period ( hr) systems of (see Figure 26), a hours would be required to give a years. Using the typical radius-period relation (Frank et al., 2002), a system with an hours (and therefore a years) would have to contain a giant companion of spectral type K7 or later. None of the known spectral types in our sample are red and large enough to give such a long recurrence time, except for GRS 1915+105, which is thought to have a years (Deegan et al., 2009).
While companion stars as large as the one in GRS 1915+105 can be ruled out in many of our systems with this argument, it can not be used to rule out long recurrence times in systems where we have no serious limits on the companion. With this being said, one could also turn this argument around and say that a long recurrence time will also imply a long outburst time, so short outbursts will suggest short recurrence times. Examining the remainder of the transient population, for which we have no information on companion spectral type or orbital period, we find all outburst durations are years. We therefore believe that the assumption that does not exceed years for the systems in our sample is a reasonable one.
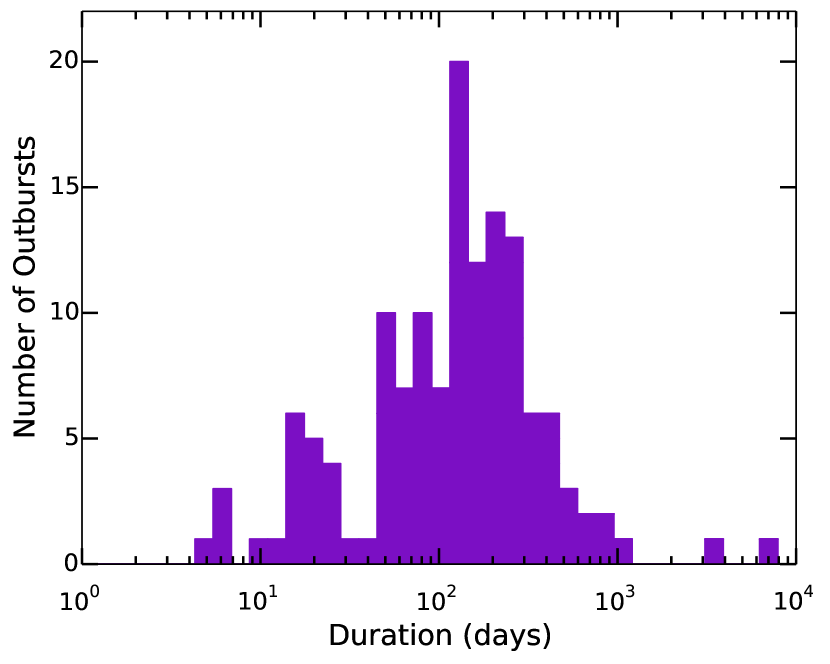
In addition, we have also calculated the recurrence times between outbursts (over the last 19 years) for these 47 transient and 2 long-term transient sources (see Table LABEL:table:transienthistory). Figure 10 displays the distribution of outburst recurrence times over the 19 year time period, calculated by finding the time difference between the beginning of each outburst detected in a
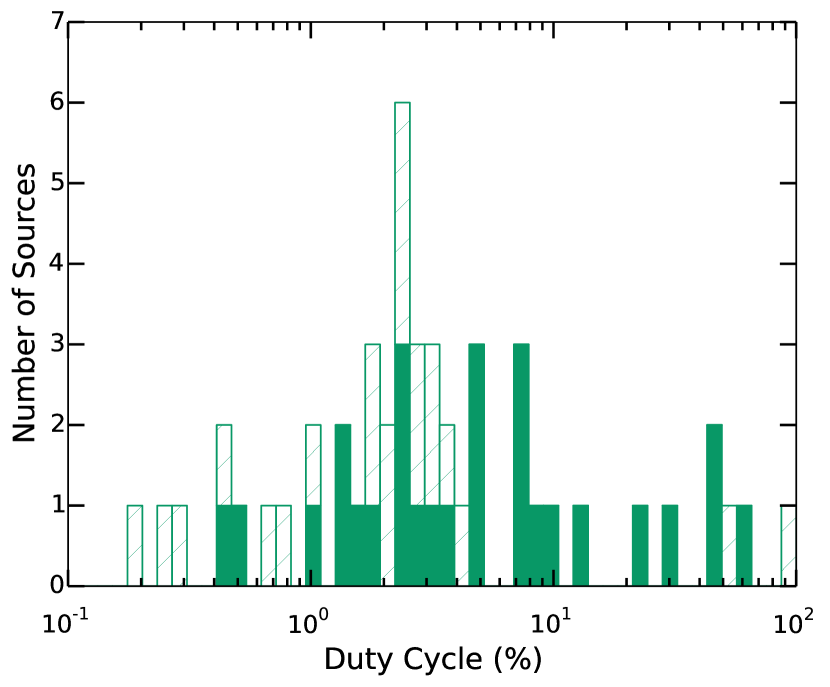
particular source. In the case where a source has only undergone one outburst in the last 19 years, a lower limit is estimated by taking the time difference between (i) the beginning of our analysis (1996 January 6 – MJD = 50088) and the beginning of the outburst in the case where the outburst occurred closer to end of our analysis (2015 May 14 – MJD = 57156), or (ii) the end of our analysis and the beginning of the outburst in the case where the outburst occurred closer to the beginning of our analysis. Taking into account all detected recurrent events (i.e., not including lower limits) and ignoring the possibility that we may have missed events between some of the recorded outbursts, we find the minimum, maximum, and median recurrence time exhibited by the transient population to be approximately 29, 6589, and 414 days, respectively.
We note that there is a possibility that our distribution is not the true distribution due to two contributing factors. First, there could be (and are) outbursts that our algorithm has not detected (see footnotes of Table LABEL:table:outhistBH). This would increase the count of short recurrence times. Second, the many sources that have only one recorded outburst (and in turn only a lower limit on recurrence time) may go into outburst in the future. This would effectively increase the count of long recurrence times.
IV.5. State Transitions and Transition Luminosities
In addition to classification, our algorithm makes use of the X-ray hardness ratio to track a source as it transitions through varying combinations of the three accretion states, during outburst and/or periods of continuous activity on a day-by-day basis. In Tables LABEL:table:statetransitions and LABEL:table:statetransitions2 we present the results of tracking 46 transient and 10 persistent sources for which we have sufficient data available. Each outburst (or period of long-term activity) has been differentiated into three separate stages: (i) rise, corresponding to times preceding the outburst peak (in luminosity); (ii) decline, corresponding to times following the outburst peak (in luminosity); and (iii) transition, corresponding to time periods in which the source changes accretion state, either between soft and hard, or just to an intermediate state and back.
In addition to stage differentiation, an outburst (or period of long-term activity) is also separated into three possible accretion states where the data will allow: HCS, SDS, or IMS. Due to the limited spectral information in broad-band count rates, while we observe the likely signature of the SPL state (i.e., the “dragon horn” in the HIDs) occurring in a number of sources over the last 19 years, we do not have the ability to empirically differentiate it from the other three accretion states using hardness ratio, and flux, alone.
By using independent spectral/timing studies in the literature we are able to make note of two interesting observations regarding the behavior of sources which enter this state. First, we observe that this “dragon horn” feature appears in two different shapes in our HIDs, either (i) curling backwards (i.e., a significant increase in hardness coupled with a moderate increase in luminosity, followed by a softening and moderate decrease in luminosity of the source) or (ii) standing closeto straight up (i.e., a near constant hardness and rapid luminosity change during the time period). Second, we observe that SPL behavior spans the hardness ratios that our algorithm associates with the HCS, SDS, and IMS. See Figures 4–7, and 13–14 for examples of the aforementioned behavior as well as Sections III.7.7 and IV.3 for a discussion on how the appearance of the SPL states affects our outburst classification algorithm.
In addition to single states represented, Tables LABEL:table:statetransitions and LABEL:table:statetransitions2 also present transitions of two different forms, “(state name one) (state name two)” and “(state name one) IMS (state name two)”. The first depicts the full transitions between hard and soft states, while the second describes the attempted transitions (or erratic “jumps”) between one of the two principal states and the IMS. It is important to note that as we only have daily time resolution, HCS to SDS transitions taking less than 1 day to complete are not included here. Lastly, Tables LABEL:table:statetransitions and LABEL:table:statetransitions2 also indicate times when we do not have adequate information to define the state of the system. The “-” symbol is used to indicate situations where (i) only one energy band is available during the time period, which is adequate for outburst detection but not for classification via , or (ii) no data is available during the particular time period.
We have also estimated the luminosity of transient BHXB systems during both the forward (HCS-SDS) and reverse (SDS-HCS) state transitions. In Figure 11 we plot the probability distribution of transition luminosities in Eddington units (). Using luminosities in Eddington units allows us to accurately compare across sources and take into account both uncertainties in distance to a source as well as BH mass. See Section IV.6 for a discussion of how the distances are estimated for the sources without distance estimates in the literature. We are careful to include only those outbursts in which our spectral fitting algorithm has not failed and only instances within each of these outbursts where a source made a complete hard-soft or soft-hard transition. We do not include the erratic “jumps” between the intermediate states and the hard and soft states in this analysis.
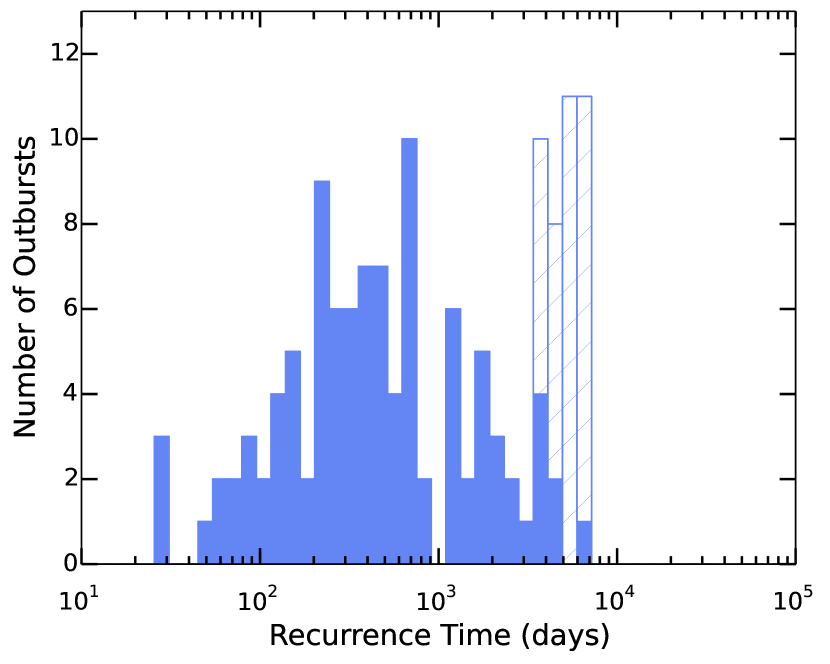
The transition luminosity of a particular source during an outburst is estimated by finding the days in which the source was undergoing the specific state transition (see Table LABEL:table:statetransitions) and calculating a weighted mean (and error) of the estimates during this time period. To take into account the errors in the estimated transition luminosities we make use of the Monte Carlo method presented in Dunn et al. (2010), whereby we randomly select a value of from a Gaussian distribution with 1 values derived from the propagated error in the transition luminosity estimate for each state transition in our sample. We then use this to estimate the underlying probability distribution and display this in Figure 11.
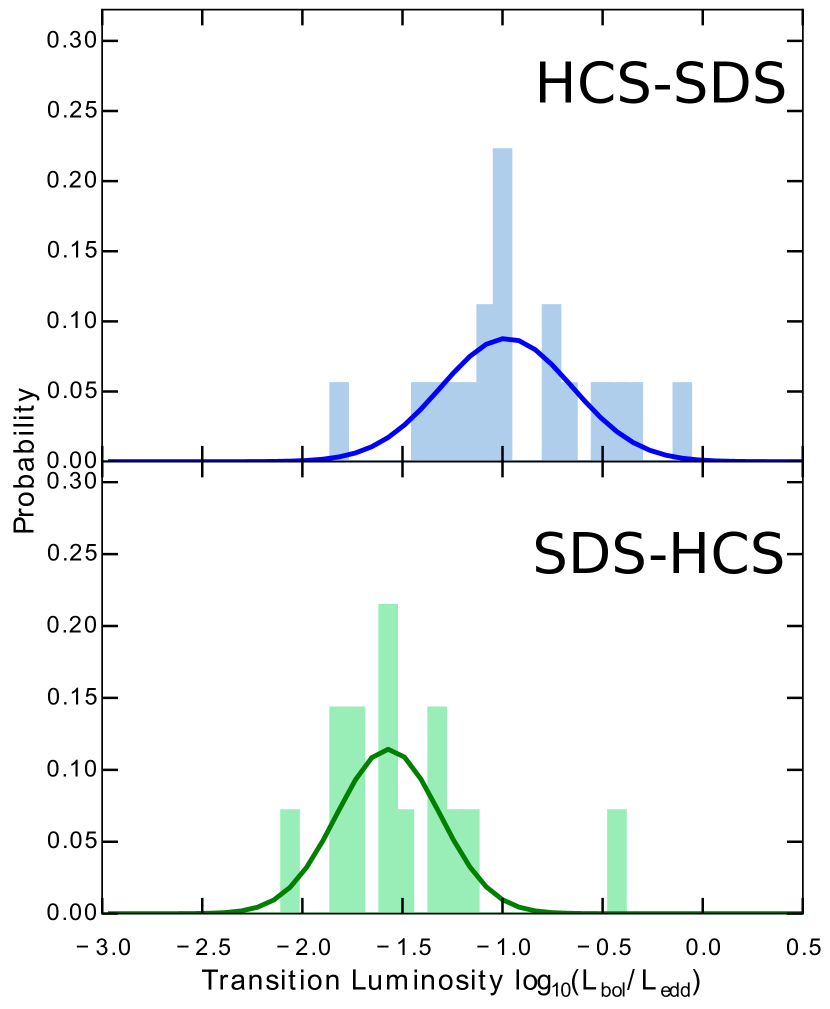
Rather than fit a Gaussian distribution to the probability distribution (despite a large number of Monte Carlo simulations, the precision of the distribution is relatively poor given the small number of total sources) as has been done in previous work, we have performed more distribution agnostic characterizations of the hard-soft transition luminosities and the soft-hard transition luminosities. For each Monte Carlo simulation we measure the mean and standard deviation of the log luminosities. The hard to soft transition is described by and , while the soft to hard transition is described by and . For illustrative purposes, we overplot Gaussian distributions given by the median and (Shapiro-Wilk tests can not reject the hypothesis that either population is drawn from a normal distribution; and ). A non-parametric Wilcoxon rank-sum test of each simulation implies that the median (two-sided) probability that the hard-to-soft transition luminosities and the soft-to-hard transition luminosities are drawn from the same distribution is ().
A number of similar studies analyzing transition luminosities in BHXBs exist. Dunn et al. (2010) used disk fraction luminosity diagrams (DFLDs) to determine transition luminosities for 25 BHXB systems, and found a mean HCS-SDS transition luminosity () that is significantly larger than our estimate; however, their range was comparable to our estimate (0.03–). Gierlinski & Newton (2006), using RXTE/ASM data and HIDs, find a HCS-SDS transition luminosity comparable to our result, though they quote a range that is significantly narrower (0.01–).
In contrast, our mean SDS-HCS transition luminosity of is consistent with both the estimates by Dunn et al. (2010) () and Maccarone (2003) (), the latter who tabulated transition luminosities using available data of 6 BHXBs from the literature. However, both Dunn et al. (2010) and Maccarone (2003) find a significantly narrower range (0.05– and 0.01–, respectively) for the SDS-HCS transition luminosity, when compared to our results.
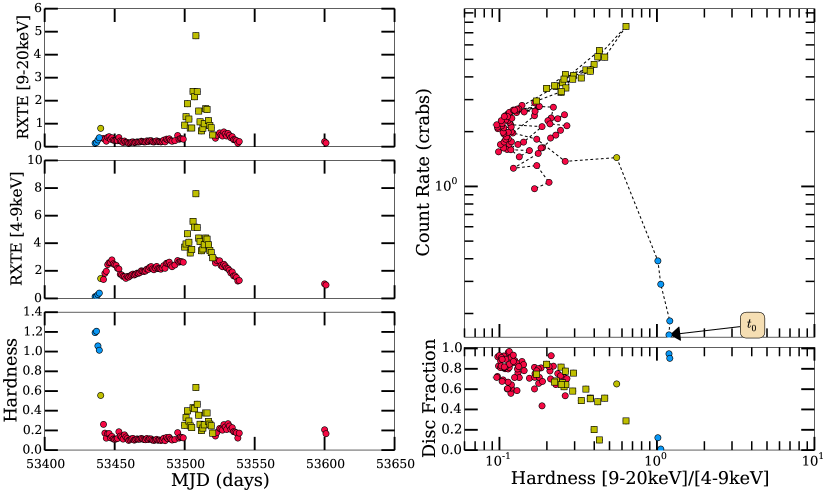
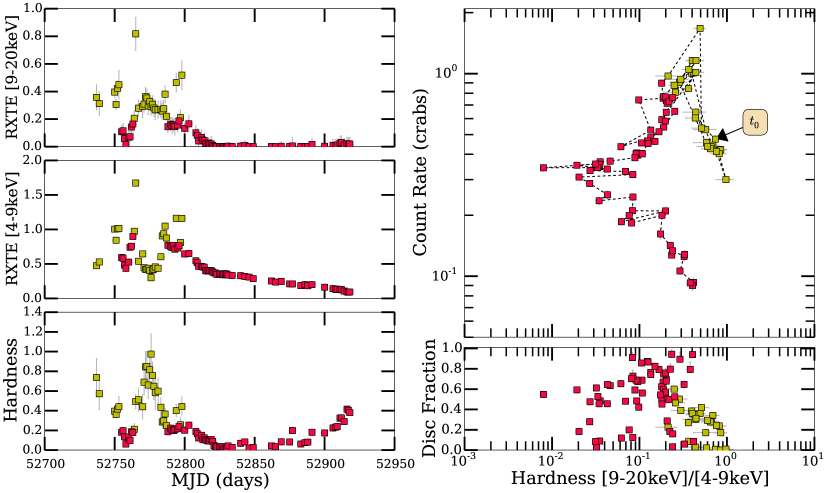
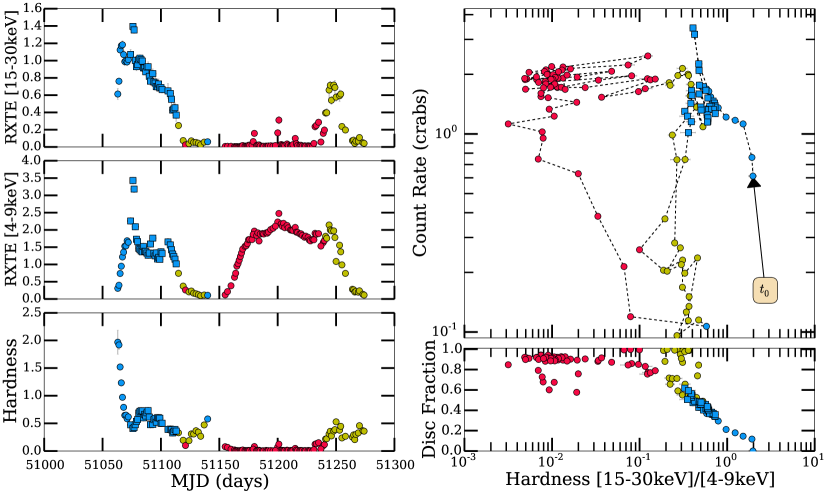
IV.6. Peak Outburst Luminosity
We analyzed the peak luminosities for individual transient outbursts and long-term activity in the persistent sources. Table LABEL:table:lumdata presents peak luminosities in the HCS, SDS, and for the outburst as a whole, a deconvolution of the outburst into total time spent in the HCS, SDS, and in transition, and an estimate of total energy released during outburst (discussed further in Section IV.7) for each of the 92 classified algorithm detected outbursts. If there are no available distance and/or BH mass estimates for a source, luminosity analysis is performed assuming a distance corresponding to a uniform distribution between 2 and 8 kpc and a BH mass that is sampled from the Ozel et al. (2010) mass distribution. Note that the BH mass estimates are only used for scaling the peak luminosity by the Eddington luminosity.
This inferred distance was chosen by taking the central 90% range of distances spanned by the 18 individual systems with known mass measurements (i.e., the dynamically confirmed BHs in class A and/or the most likely BHCs in class B), allowing us to sample from a range in distance in our analysis (e.g., bolometric luminosity, luminosity functions, long-term mass transfer rates) that we would expect the majority of Galactic BH systems to lie. Using this criterion the closest and farthest systems, 1A 062000 at 1 kpc and GS 135464, which if the estimated distance (inferred from X-ray observations) is correct would make it the only known BH source in the Galactic halo, are excluded.
By choosing this uniform distribution in distance, we are implicitly assuming that whether or not follow-up observations have been performed on a source to determine distance/mass is more or less random. However, one could argue that the sources without distance/mass estimates are most likely to be those sources that are optically the faintest and behind the most reddening, which is more likely for sources on the far side of the Galaxy. In addition, if one were to look at a map of locations of XRBs with distance estimates (e.g., Jonker & Nelemans 2004), they seem to be concentrated on the near side of the Galaxy. On the other hand, (i) many large scale population studies like this work use similar assumptions for distance (e.g., Dunn et al. 2010), and (ii) we separate sources with and without known distances, and provide individual results, in all analyses involving luminosity in this work. As such, the reader should either (i) retain the caveat that, for our full sample, truncating uncertain distance distributions at 8 kpc may potentially cause inferred luminosity estimates to be skewed lower than the true luminosities for those sources, or (ii) focus only on the “known distance” parts of our analysis.
We perform several analyses with the peak outburst luminosities. First, we observe a clear demonstration (also see Figure 27) of the under-luminous nature of a “hard-only” outburst (or long-term period spent in the HCS), indicated by the sub-Eddington peak luminosities, when compared to the “successful” outbursts (or long-term persistent “turtlehead” pattern behavior), as expected.
Second, we determine the state in which the peak luminosity of an outburst occurs. In the standard picture of outburst evolution (Maccarone & Coppi, 2003; Vadawale et al., 2003), the peak luminosity is expected in the SDS, when the mass transfer rate is high enough to shift the truncation radius of the disk in towards the ISCO. However, a fair number of outbursts that display this (“turtlehead”) outburst behavior appear to exhibit a peak in the HCS. However, upon further analysis, we find that this HCS peak behavior can be explained away by (i) the fact that the bolometric corrections are poorly known, (ii) missing coverage of the soft state peaks due to Sun constraints near the month of December, or (iii) the breakdown of our spectral modelling algorithm in certain situations where the true spectral shape of the source does not match the assumed spectral shape of our model (e.g., the presence of a SPL state).
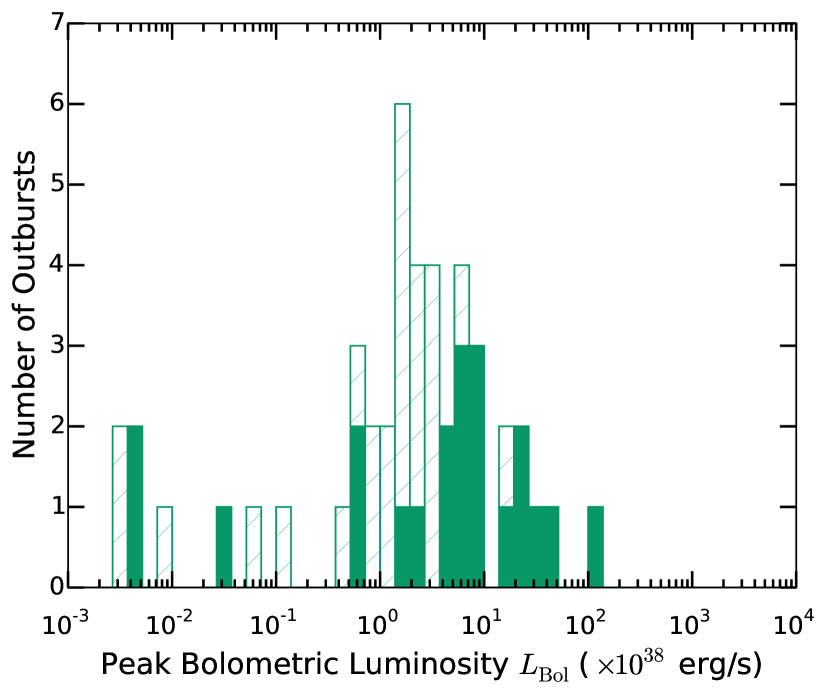
Third, we determine the fraction of time over the last 19 years that a source spends in each state, particularly the persistent sources. Doing so, in combination with analysis of the state transitions occurring (see Tables LABEL:table:statetransitions and LABEL:table:statetransitions2 and Section IV.5) has allowed us to separate the 10 persistent sources, for which data is available, into four separate classes based on long term behavioral characteristics as follows: (i) mainly HCS behavior: the source spends % of the time it was in an X-ray bright state in the HCS and routinely undergoes attempted hard-soft transitions (i.e., “incomplete” state transitions), in which the source only reaches as soft as the IMS; (ii) mainly SDS behavior: the source spends % of the time it was in an X-ray bright state in the SDS and routinely undergoes a combination of attempted hard-soft and soft-hard (‘incomplete”) transitions only reaching as soft/hard as the IMS; (iii) mainly IMS behavior: the source spends % of the time it was in an X-ray bright state in the IMS and routinely undergoes attempted intermediate-hard transitions; and (iv) anomalous/high behavior: while the source appears to spend the majority of its time repeatedly undergoing the basic “turtlehead” pattern of behavior, it routinely shows peak luminosities at high fractions of Eddington, suggesting the presence of a high luminosity state such as an SPL state or perhaps a more complicated situation (e.g., “heartbeat” states of GRS 1915+105; Neilsen et al. 2011). 1E 1740.72942, SS 433, and 4U 1956+350 fall under case (i); 4U 1957+115 falls under case (ii); GRS 1758258 and Swift J1753.50127 fall under case (iii); and GRS 1915+105, LMC X-1, LMC X-3, and Cyg X-3 fall under case (iv).
Lastly, in Figure 15 we plot the distribution of peak outburst luminosities for the transient (and long-term transient) population, not including those outbursts that we have identified to contain days when our spectral fitting algorithm has failed (see Section III.7.5 and outbursts marked with a “*” in Table LABEL:table:lumdata). Eliminating outbursts undergone by sources with no available distance estimates yields a range in peak outburst luminosity of and a mean peak outburst luminosity of . Note that the one outburst peaking above is the 1997/1998 outburst of GS135464. However, the distance to this source is poorly constrained (25–61 kpc). If we were to place this system at our assumed standard Galactic value (i.e., a uniform distribution between 2 and 8 kpc) its peak luminosity would be on the order of .
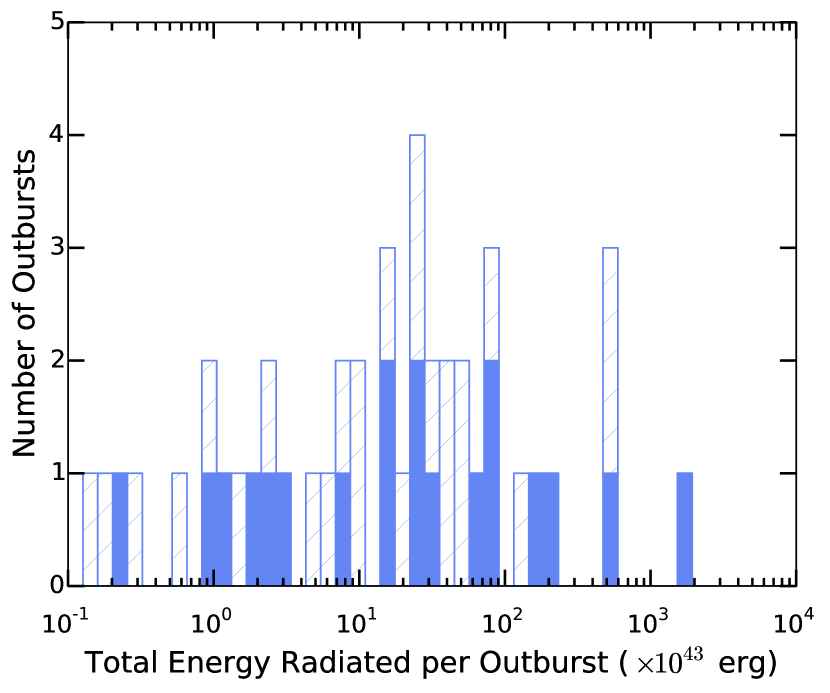
IV.7. Total Energy Radiated During Outburst
We have estimated the total X-ray energy released during outburst for each of the 92 classified algorithm detected outbursts as well as the activity in the 2 long-term transient sources. We define the total radiated energy as the (see Section III.7.5) integrated over the duration of an outburst and calculate the quantity by first finding the weighted mean of during outburst then multiplying it by the total duration of the outburst. As there are asymmetric errors on our estimates, we calculate this weighted mean iteratively. Figure 16 shows the distribution of total radiated energy. Including only those sources that have a distance measurement available (31 sources; see Table LABEL:table:binaryBH) and only those outbursts that we have identified to not contain days when our spectral fitting algorithm has failed (see Section III.7.5 and outbursts marked with a “*” in Table LABEL:table:lumdata), we find a mean and range of total radiated energy during outburst for the transient population to be erg and erg, respectively.
IV.8. X-ray Luminosity Functions (XLFs)
Using the methods described in Section III.7.6, and given bolometric X-ray luminosity for a source on any given day, we have obtained the empirical XLFs for 46 transient sources and the 10 persistent sources for which sufficient data is available.
In Figures 29–30 (located in Appendix) luminosity data have been arranged into 31 bins between and , where any values below are placed in the lowest bin. The errors on each bin are quoted as 1 Gehrels errors. All luminosity data has been differentiated into accretion states where blue, red, yellow, and grey represent the HCS, SDS, IMS, and days in which we are unable to define state with available data, respectively.
As discussed in Section III.7.5, there are days during an outburst of a given source when our spectral fitting algorithm fails, resulting in a large uncertainty in the derived luminosity for that day. While we have identified 47 transient outbursts and multiple occurrences in the persistent sources in which this problem occurs (see Table LABEL:table:lumdata), the number of days when the algorithm fails during an outburst or long-term bright state is in many cases either only a small fraction of the outburst duration as a whole or a small fraction of the total 19 year outburst period of the source (i.e., in those sources with short recurrence times). As this problem would be difficult to correct, we include all data in each source XLF and note that some source XLFs may not be representative of the true luminosity distribution for that individual source.
One may expect the exclusively “hard-only” outburst source XLFs to only exhibit one peak located at lower luminosities, associated with the HCS to which the source has been observed to remain in for the duration of outburst periods. Of the 12 sources that have been observed to undergo exclusively “hard-only” outbursts, 5 exhibit this behavior (e.g., XTE J1118+480, SAX J1711.63808, XMMSL1 J171900.4353217, GRS 173737, and IGRJ 172852922). GS 135464 also displays a singular feature. While this feature may peak at , we note that the upper bound on the poorly constrained distance estimate (61 kpc) is the most likely cause of these excessively high luminosity values. Unfortunately, our ability to properly analyze the remaining 6 sources is hindered by either (i) uncertainties in derived bolometric luminosities caused by our spectral fitting algorithm failing, presumably leading to a scattered contribution at higher luminosities in addition to the expected low luminosity peak in the XLFs (e.g., Swift J1357.20933, and MAXI J1836194), and (ii) not enough data available for a source to determine what state the source was in on a significant number of days during outburst (e.g., XTE J0421+560 and IGRJ173793747).
In addition, we also observe the appearance of significant hard state contributions in the higher luminosity regime () in a few sources (e.g., GX 3394, GRS 1739278, H1743322). We find that the appearance of this features correlates with sources that undergo outbursts that peak in the HCS and display the “dragon horn” feature in their HIDs. Given that these sources have been shown (through spectra/timing studies in the literature) to enter the SPL (or high luminosity state) state during outburst (i.e., see Borozdin et al. 1998; Motta et al. 2009; McClintock et al. 2009), this behavior is perhaps indicative of the SPL state extending into the hard state regime (see discussion in Section IV.5). A second alternative is that this contribution at higher luminosities could be caused (at least in part) by the days when our spectral fitting algorithm fails.
Lastly, in the case of the persistent XLFs, we find that the features exhibited correlate with each of the four classes we have defined above based on luminosity and temporal evolution observed. Specifically, (i) 1E 1740.72942, SS 433, and 4U1956+350, which spend most of their time in the HCS, exhibit a prominent HCS peak component at low luminosities (), (ii) GRS 1758258 and Swift J1753.50127, which show mainly IMS behavior exhibit a dominate IMS contribution at lower luminosities (), (iii) 4U 1957+115, which undergoes mainly SDS behavior exhibits a single peak feature at and (iv) GRS 1915+105, LMC X-1, LMC X-3, and Cyg X-3, which exhibit anomalous/high behavior, display a single peak feature between and .
We must also take into account our knowledge of where the spectral fitting algorithm fails in our analysis of the persistent source XLFs. In both cases (i) and (ii), in addition to the observed peaks, we also observe the presence of a higher luminosity “tail”. This feature can be seen in 1E 1740.72942, Swift J1753.50127, SS 433, and GRS 1758258. Given that 4U 1956+350, a source in which our spectral fitting algorithm has never failed, is the only source in these two groups that does not exhibit this feature in the XLF, we conclude that it is probable that this higher luminosity “tail” may (at least in part) be an artificial feature occurring as a result of incorrect bolometric luminosity estimates.
We have also created combined XLFs over time for the transient population, persistent population, and the entire Galactic BHXB population as a whole by combining each individual source XLF (See Figure 17) . The population XLFs are rendered for two cases: (i) including the entire source population in our sample, and (ii) including those sources that belong to BH classes A or B (i.e., securely classified BHs or BHCs) with distance estimates 10 kpc.
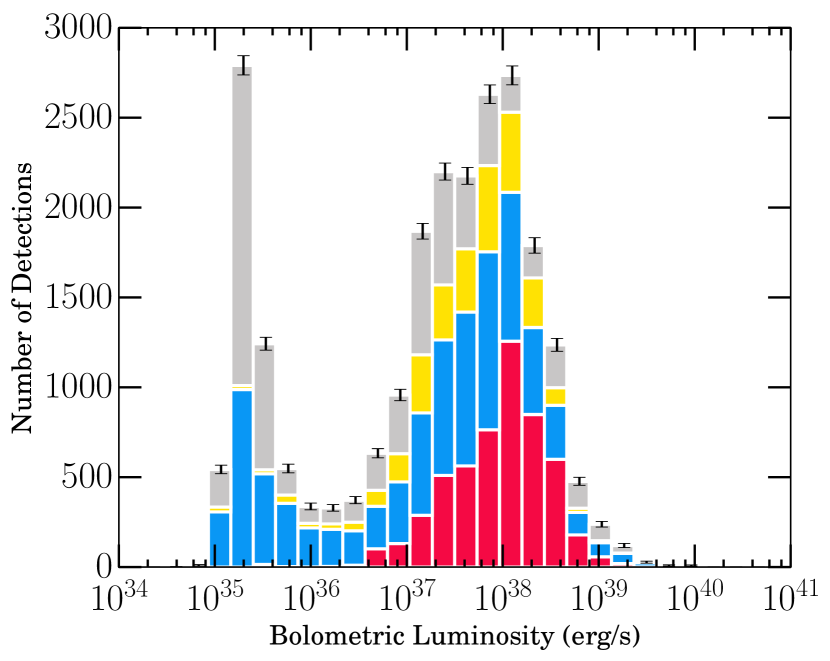
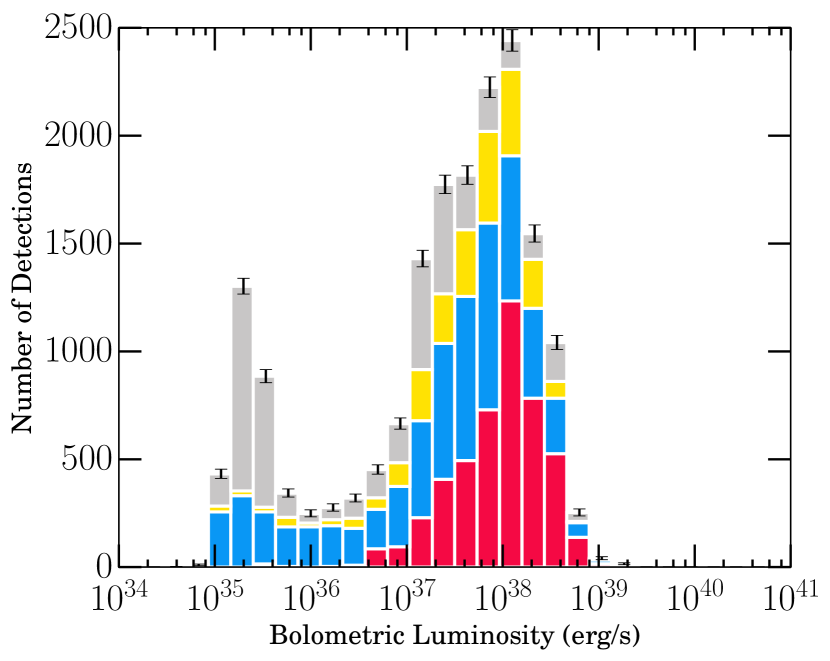
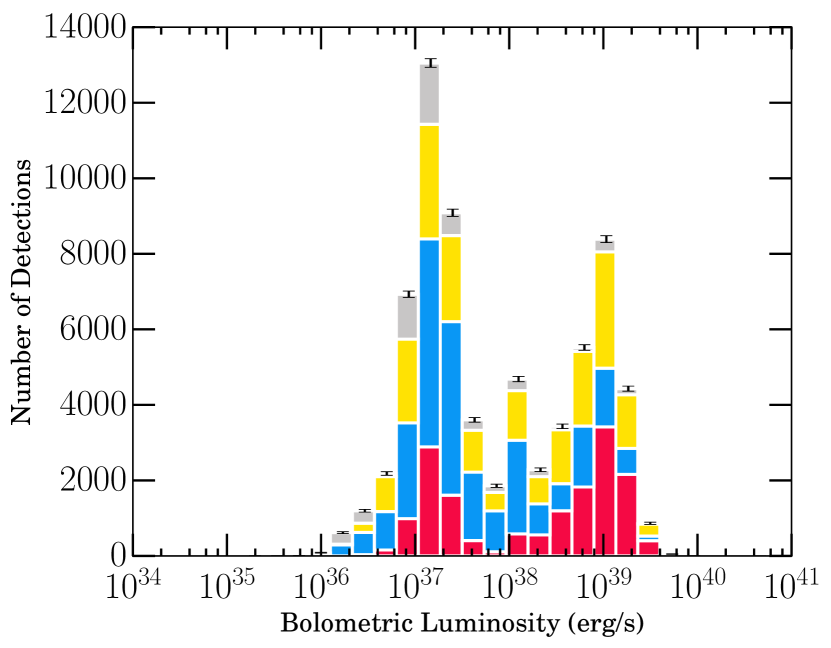
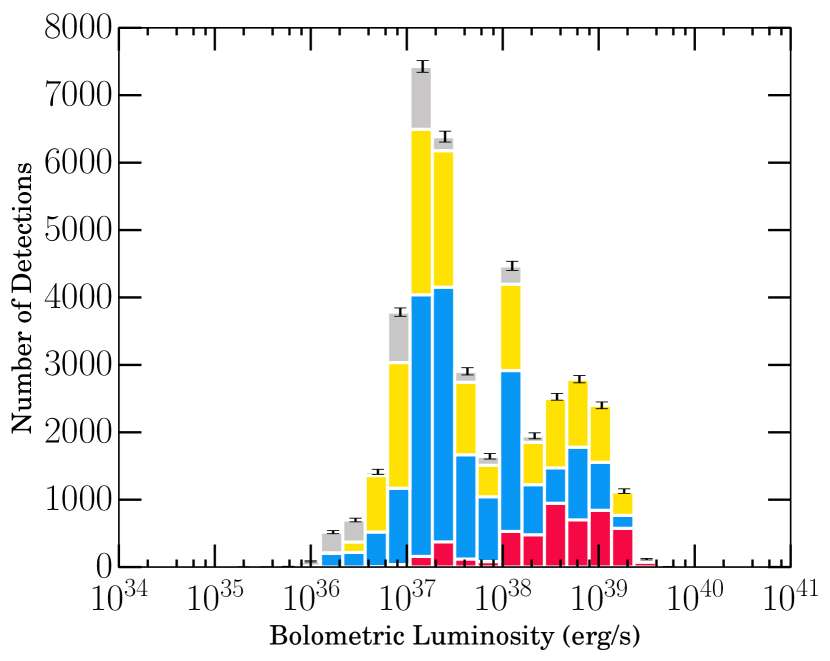
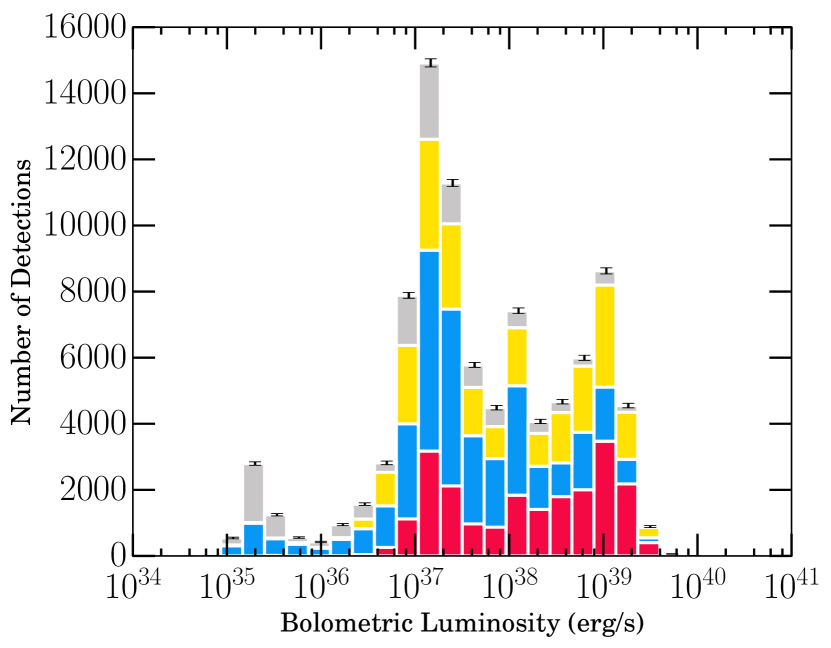
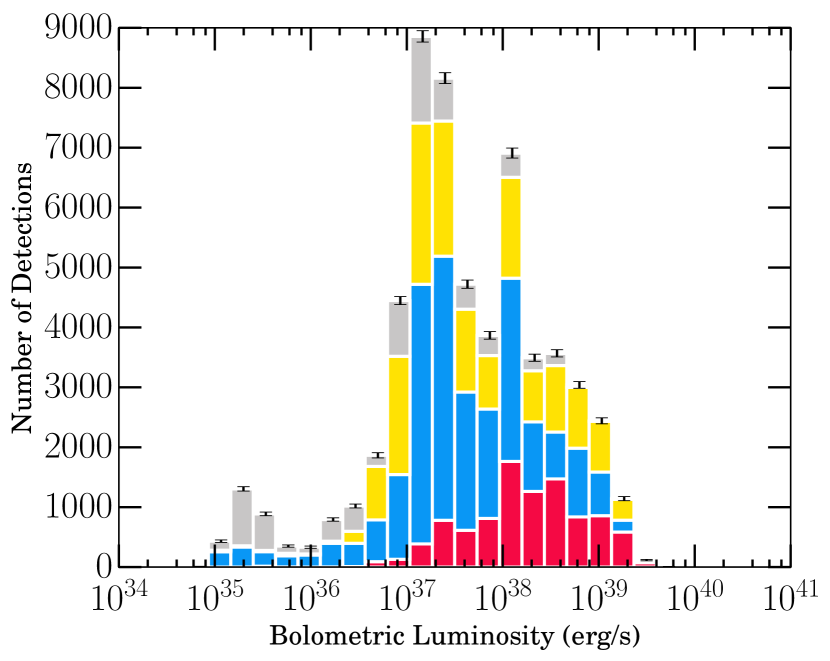
In the case of the transient sources, we observe the appearance of a double-peaked profile, a complete deviation from the power-law type distribution found for the entire XRB population of the Galaxy in previous studies (e.g., Grimm et al. 2002). We note that even when we only use measurements in a single energy band (as to directly compare to the Grimm et al. 2002 result), this double-peaked profile is still present. By splitting all the luminosity data into accretion states, we find one soft state contribution peaking at , and two significant hard state contributions, one peaking between and and, another that appears to peak only one bin below the maximum of the soft state contribution. This implies that the bi-modal distribution exhibited by the transient population as a whole may likely be the result of the “turtlehead” behavior characteristic of BHXB systems. We note that that while the small hard state contribution at may be indicative of a SPL state it may also (at least in part) be due to the failure of spectral fitting algorithm in some cases.
In addition, we note that, despite all that has been discussed, we may also be dealing with incompleteness at lower luminosities due to the limited sensitivity of the all-sky and scanning instruments. In analyzing the XLFs for the individual transient sources it becomes clear that the limiting luminosity at which the number of detections for a given source begin to fall off is highly dependent on distance. In the case of nearby sources (e.g., XTEJ1650500 at 2.6 kpc, GRO J165540 at 3.2 kpc, and XTEJ1752223 at kpc) we have a significant amount of detections at luminosities as low as a few times . In comparison, detections in Galactic Center sources (e.g., 4U 1543475 at 7.5 kpc, XTEJ1859+226 at 8 kpc, and H 1743322 at 8–10 kpc) appear to fall off at luminosities between . Despite this possible bias, the existence of a bimodal profile in the XLF, as opposed to a single power-law distribution, is still robust.
Lastly, we note that this bi-modal distribution is still present even when we do not include those sources that have undergone outbursts that the spectral modelling algorithm has failed to accurately estimate bolometric luminosity on a select number of days. This implies that the problem we have with our spectral modelling algorithm is not the cause of the peaked behavior we observe.
For the persistent sources, we also observe a bi-modal profile. However, as we are including the LMC sources in our persistent sample, we must take into account the effect distance will have on the total XLF before making any solid claims. We are not sensitive to the lower luminosity XRBs in the Magellanic Clouds, resulting in our XLF of the LMC being artificially truncated at a few times . As such, a strong argument can be made that the double peaked profile in the persistent sources is the result of the sample being divided into two segments at two distances, and thus two different luminosity cutoffs (at a few times and a few times ), rather than the result of BHXB hysteresis. However, when we consider only class A and B systems at kpc, the bi-modal profile is still present, suggesting that the distance effect may not in fact be causing the bimodal shape. In addition, we note that this bimodal profile could also be caused naturally by random clumping of the very small number of persistent sources in our sample, which in general tend to stay roughly at the same X-ray luminosity over time. Lastly, we note that while an argument can be made for the exclusion of SS 433 in this type of population analysis, given its unique behaviour when compared to other persistent XRBs (see Section II.2.69), we find excluding this source has little impact on the observed bi-model profile, and therefore include the source in the presented population XLFs and note that the luminosity profile of SS 433 presented here may not be the true distribution.
IV.9. Mass-Transfer History
We have derived the time averaged bolometric luminosity and long-term mass transfer rates making use of the method described in Section III.7.6 for 46 transient sources and 10 persistent sources for which sufficient data is available to us during the time period. If a source has undergone repeated outbursts in the past 19 years, an estimate is given in Table LABEL:table:mdotsum. If a transient source has only undergone one outburst in the last 19 years, only an upper limit estimate on the for the source is presented in Table LABEL:table:mdotsum (indicated by a “”).
The resulting values, coupled with a summary of the prominent outburst behavior, are presented in Table LABEL:table:mdotsum. In the case of the transient sources, the outburst behavior column indicates whether the source has undergone only “successful”, only “hard-only”, or a combination of “successful” and “hard-only” outbursts over the last 19 years. In the case of persistent sources, it indicates one of the four long-term behavioral characteristics discussed above in Sections IV.6 and IV.8.
As discussed in Section III.7.5, there are days during outburst of a source when our spectral fitting algorithm fails, resulting in a large uncertainty in the derived luminosity for that day. We have identified 47 outbursts in which this problem occurs (see outbursts marked with a “*” in Table LABEL:table:lumdata). Of these outbursts, 25 still display the expected trend in disk fraction (soft and hard states corresponding to high and low disk fraction, respectively), only with the addition of a few outliers often occurring when a source is very soft or very hard. While the other 20 outbursts display a % failure rate, the outbursts within this group either (i) belong to a rapidly recurring transient source (i.e., outbursts in the last 19 years), or (ii) have total outburst periods amounting to % of the past 19 years for which we calculate over. As such, we believe this problem will not significantly affect our derived long term mass transfer rates, even though this may be a possible source of error that has not been accounted for in our calculations. See Section V.1 for further discussion on the long-term mass transfer rates derived for the Galactic population.
IV.10. Algorithm Data Products
In Figures 19–25 we present a sample of the detailed data products, created via the algorithm. The full set of data products is available on the WATCHDOG website (http://astro.physics.ualberta.ca/WATCHDOG/). The sample includes example data products detailing two “successful” and two “hard-only” transient outbursts, and the long-term activity of two persistent sources. These data products come in two separate forms: long-term light curves depicting the structure of the outbursts undergone in each available energy band and an analysis package for each detected transient outburst or period of long-term persistent activity. The long-term light curves have been color coded by instrument, with INTEGRAL/ISGRI in dark green, INTEGRAL/JEM-X in light green, MAXI/GSC in yellow, RXTE/ASM in blue, RXTE/HEXTE in orange, RXTE/PCA in purple and, Swift/BAT in red. The outburst analysis package presented includes the following: (i) individual hard and soft band light curves for the outburst; (ii) the evolution of over the duration of the outburst; (iii) the complete HID of the outburst; and (iv) the evolution of disk fraction as a function of throughout the outburst. Note that in the HIDs the “intensity” on any particular day is the maximum of the hard and soft bands and that within the analysis package each data point is color coded with respect to the accretion state the system was in on that particular day (see Section III.7.7 for details), where blue represents the HCS, red represents the SDS, and yellow represents the IMS.
V. Discussion
V.1. The relationship between average mass transfer rate and orbital period
| Source Name | Sourcea | b | c | Outburst |
|---|---|---|---|---|
| Type | ergs/s) | ) | Behaviour | |
| XTEJ0421+560 | T | hard-only | ||
| 4U0538641 | P | “turtlehead”/anomalous high | ||
| 4U0540697 | P | “turtlehead”/anomalous high | ||
| XTEJ1118+480 | T | hard-only | ||
| MAXIJ1305704 | T | undefined | ||
| SWIFTJ1357.20933 | T | hard-only | ||
| GS135464 | T | hard-only | ||
| SWIFTJ1539.26227 | T | successful only | ||
| MAXIJ1543564 | T | successful only | ||
| 4U1543475 | T | successful only | ||
| XTEJ1550564 | T | combined | ||
| 4U1630472 | T | successful only | ||
| XTEJ1637498 | T | undefined | ||
| XTEJ1650500 | T | successful only | ||
| XTEJ1652453 | T | successful only | ||
| GROJ165540 | T | successful only | ||
| MAXIJ1659152 | T | successful only | ||
| GX3394 | T | combined | ||
| IGRJ170913624 | T | successful only | ||
| SAXJ1711.63808 | T | hard-only | ||
| SWIFTJ1713.44219 | T | undefined | ||
| XMMSL1J171900.4353217 | T | hard-only | ||
| XTEJ1720318 | T | successful only | ||
| XTEJ1727476 | T | successful only | ||
| IGRJ172852922 | T | hard-only | ||
| IGRJ173793747 | T | hard-only | ||
| GRS173731 | T | hard-only | ||
| GRS1739278 | T | successful only | ||
| 1E1740.72942 | P | mainly HCS | ||
| SWIFTJ174510.8262411 | T | hard-only | ||
| IGRJ174542919 | T | undefined | ||
| H1743322 | T | combined | ||
| XTEJ1748288 | T | hard-only | ||
| IGRJ174972821 | T | combined | ||
| SLX1746331 | T | successful only | ||
| XTEJ1752223 | T | successful only | ||
| SWIFTJ1753.50127 | P | combined | ||
| XTEJ1755324 | T | successful only | ||
| GRS1758258 | P | mainly IMS | ||
| XTEJ1812182 | T | combined | ||
| IGRJ181751530 | T | undefined | ||
| XTEJ1817330 | T | successful only | ||
| XTEJ1818245 | T | successful only | ||
| SAXJ1819.32525 | T | combined | ||
| MAXIJ1836194 | T | hard-only | ||
| SWIFTJ1842.51124 | T | successful only | ||
| XTEJ1856+053 | T | successful only | ||
| XTEJ1859+226 | T | successful only | ||
| XTEJ1908+094 | T | successful only | ||
| SWIFTJ1910.20546 | T | successful only | ||
| SS433 | P | mainly HCS | ||
| GRS1915+105 | P | “turtlehead”/anomalous high | ||
| 4U1956+350 | P | mainly HCS | ||
| 4U1957+115 | P | mainly SDS | ||
| XTEJ2012+381 | T | successful only | ||
| 4U2030+40 | P | “turtlehead”/anomalous high | ||
| NOTE 1.– This table is also available in machine readable format online at the Astrophysical Journal and on the WATCHDOG website - http://astro.physics.ualberta.ca/WATCHDOG/. | ||||
| aIndicates whether the source type is transient (T) or persistent (P). | ||||
| bThe time averaged bolometric luminosity calculated between 1996 January 6 – 2015 May 14. | ||||
| cThe average mass-transfer rate calculated between 1996 January 6 – 2015 May 14. If a source has only one detected outburst, the is considered an upper limit (indicated by ). | ||||
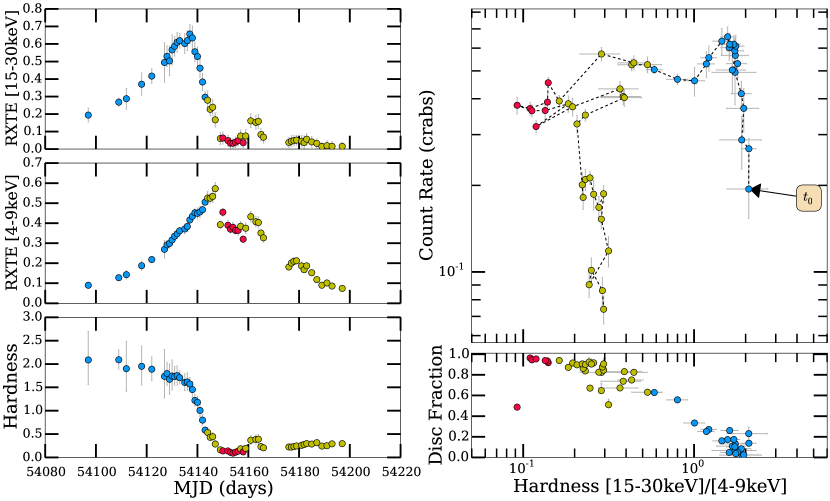
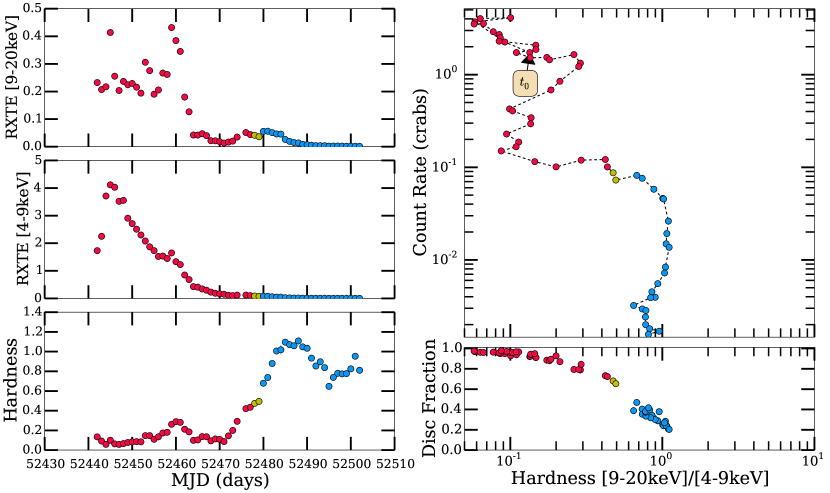
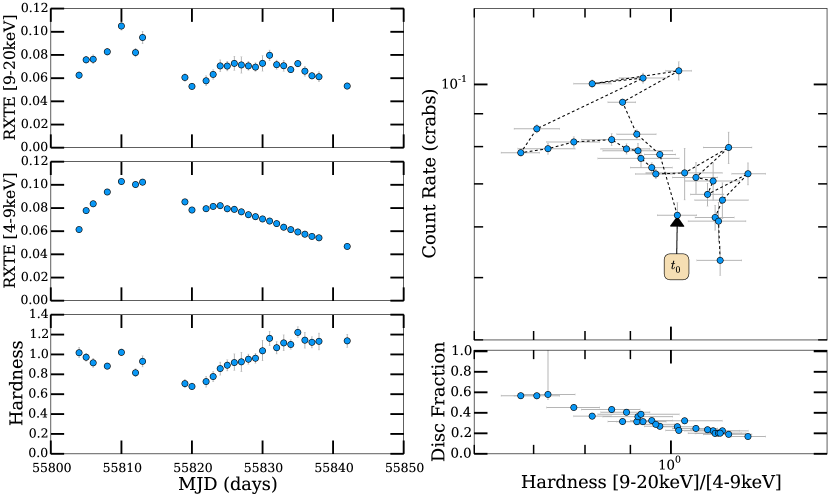
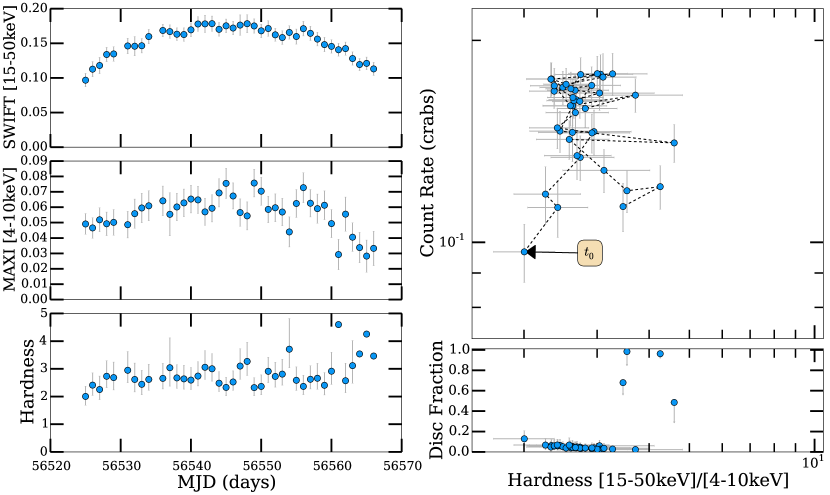
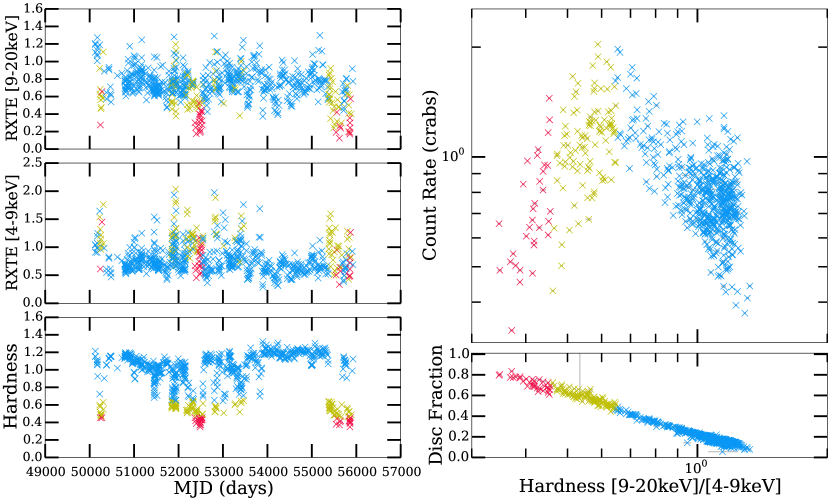
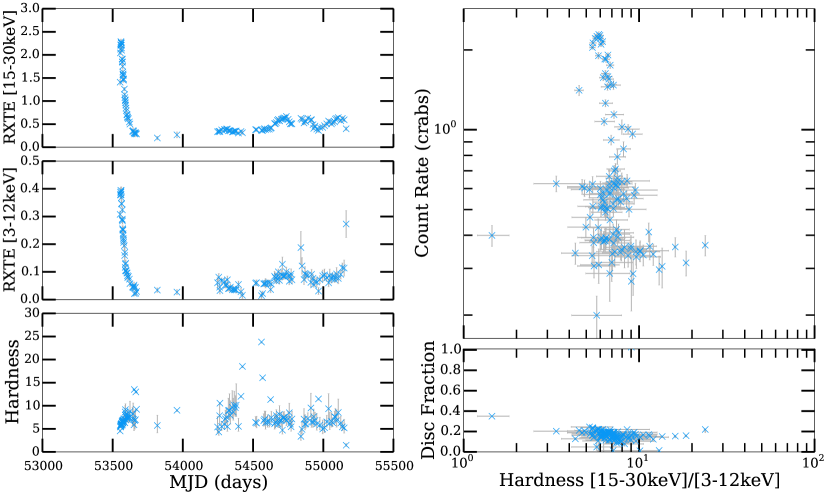
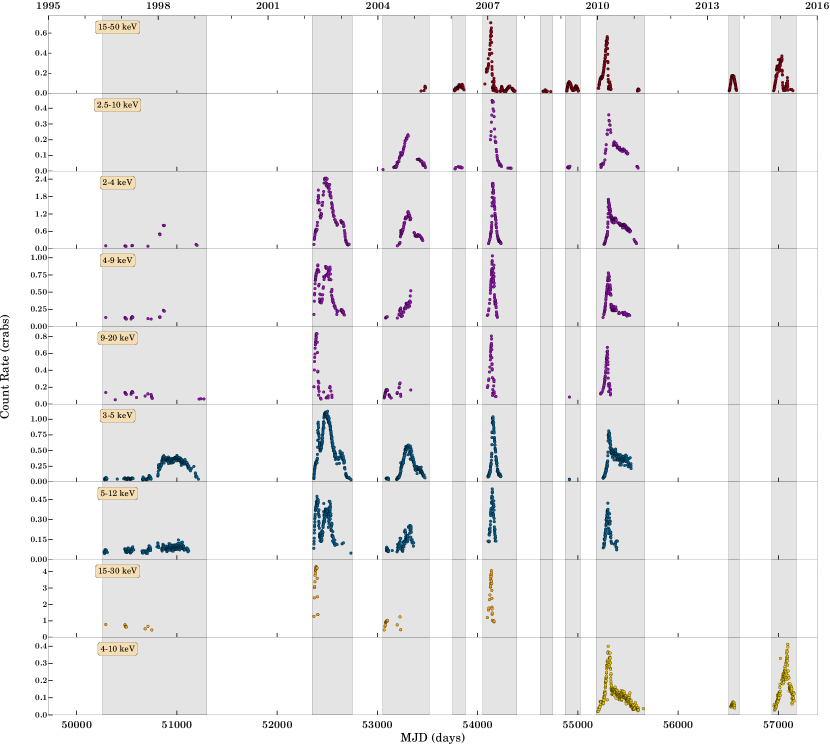
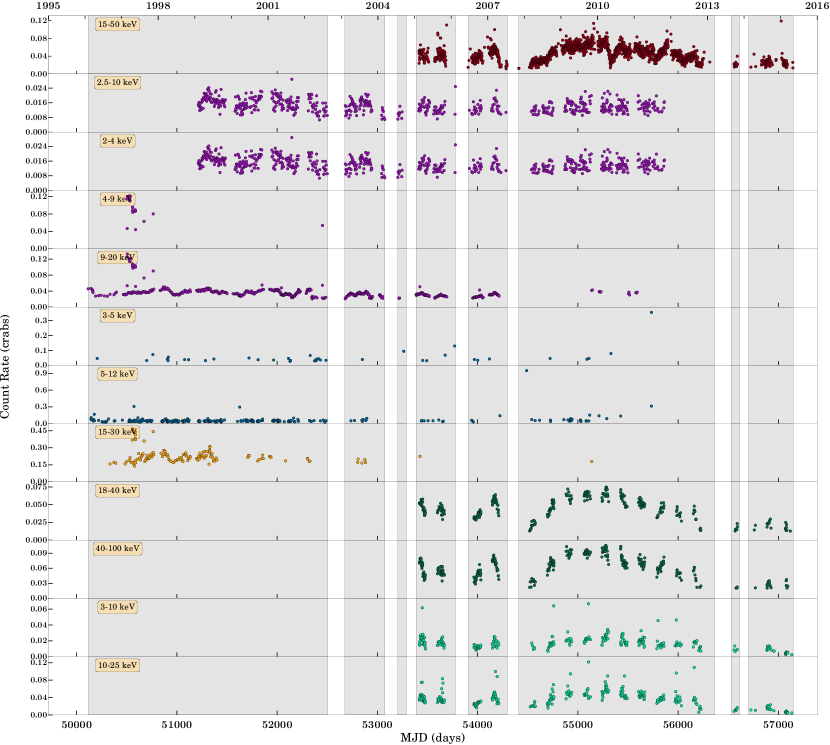
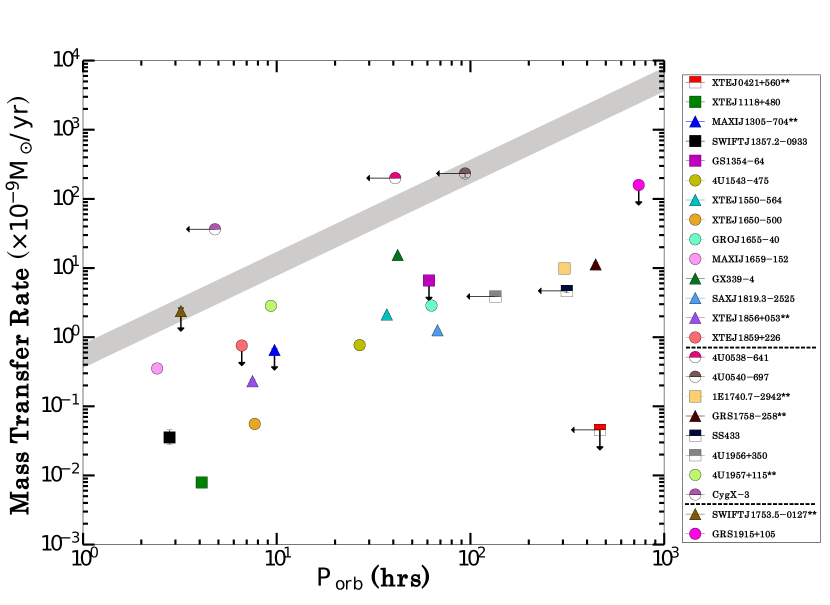
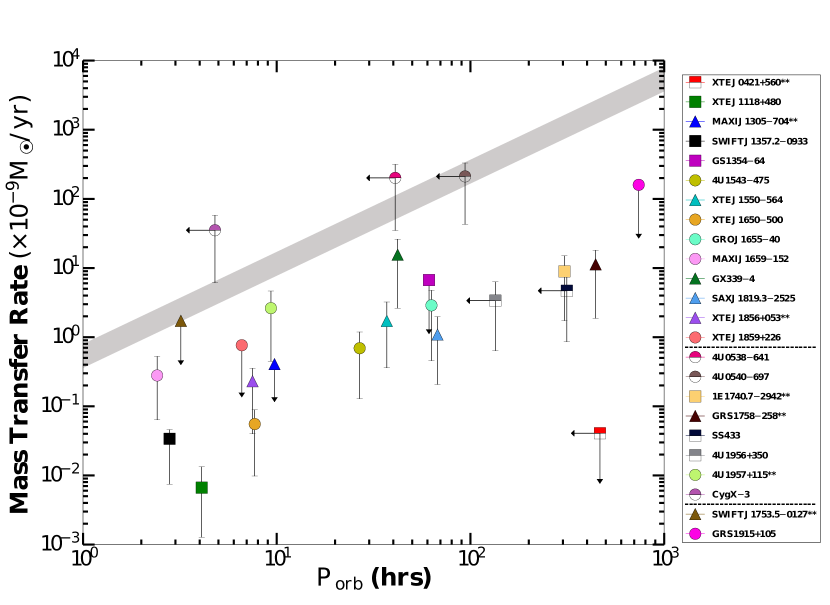
We have analyzed the relationship between and for the Galactic population. Figure 26 presents the diagram for the 14 transient and 10 persistently accreting sources (note that we classify the two long-term transient sources, GRS 1915+105 and Swift J1753.50127, as persistent) from our sample for which the orbital period is known (see Section 2 or Table LABEL:table:binaryBH for references). This plot distinguishes between (i) LMXBs (filled shapes) and HMXBs (shapes with colored hats), (ii) outburst behavior by shape: exclusively “hard-only” or mainly HCS (squares), exclusively “successful” or long-term “turtlehead” pattern (circles), combination “successful” and “hard-only” or exhibiting mainly IMS (incomplete state transition) behavior (triangles), (iii) sources that have undergone multiple outbursts versus those with only lower limits on recurrence time (upper limit arrows) and (iv) sources with and without known distance estimates (the later indicated by ** in legend).
We note that all our estimates are in agreement with previous work down by Coriat et al. (2012), with the exception of XTE J1118+480 and GS 135464. In the case of XTE J1118+480, the discrepancy is most likely the result of Coriat et al. (2012) using a different accretion efficiency prescription when , a luminosity regime in which this source remains in throughout outburst (i.e., ). In the case of GS 135464, the discrepancy is due to the use of a different distance estimate. While we use the full 25–61 kpc range, Coriat et al. (2012) use the lower limit of 25 kpc.
Generally, theory predicts a correlation, where a larger should correspond to a larger (Podsiadlowski et al., 2002). This expectation is based on the predictions of angular momentum loss mechanisms, magnetic braking for relatively short-orbit systems (Verbunt & Zwaan, 1981), and nuclear evolution timescales for longer-orbit systems (Webbink et al., 1983). See King (1988) and King et al. (1996) for a review on the mechanisms driving mass transfer in these binary systems.
However, we observe the appearance of numerous outliers and a great deal of scatter, in both transient and persistent sources, implying that the mass transfer rates presented here may in fact be systematically mis (under) estimating the true mass transfer from the companion.
First, we observe that the exclusively “hard-only” outburst transient sources appear to have significantly lower average then those sources that exhibit exclusively “successful” or a mix of “successful” and “hard-only” behavior. Performing a two sample KS-test between (i) the exclusively “hard-only” outburst transient sources and those transients that have never undergone any “hard-only” outbursts and (ii) the persistent sources that either remain in the HCS or IMS for the majority of the time or exhibit “incomplete” state transition behavior and those which regularly undergo the typical “turtlehead” pattern or spend the majority of time in the SDS yields p-values of 0.028 and 0.082, respectively. While this implies marginal evidence that we can reject the null hypothesis that either set of paired data arise from the same parent distribution, the combination of these independent tests provide clear statistical evidence of a difference between the long-term mass transfer rates exhibited by those sources which have been observed to undergo “hard-only” outburst behavior and “incomplete” transitions in persistent sources in comparison to those that undergo “turtlehead” patterned outbursts and persistent state transition behavior.
Second, we find many persistent sources appear to occupy the region of the diagram reserved for transient sources (i.e., below the critical accretion rate for an irradiated disk around the BH; King & Ritter 1998). This group of systems includes (i) GRS 1915+105, one of the long-term transient sources that we treat as persistent, and (ii) those sources that have been observed to exhibit mainly HCS, mainly IMS, and/or incomplete state transition behavior and have mass transfer rates that are apparently too low to sustain a persistent flux (i.e., 1E 1740.72942, GRS 1758258, SS 433, Cyg X-1, and 4U 1957+115).
All these sources must be considered carefully on a case-by-case basis to understand the situation. Cyg X-1 is an HMXB, meaning it transfers mass via a stellar wind, resulting in the radius of the accretion disk likely being smaller than one would expect at its orbital period if it was a Roche lobe overflow source. Moreover, it is also worth considering that the long period, apparently persistent sources 1E 1740.72942, GRS 1758258, and SS 433 may actually be long-term transients like GRS 1915+105. As discussed by Coriat et al. 2012, while these sources are usually classified as persistent within the literature (see relevant subsections in Section II for references), the validity of this classification is brought into question by both their large orbital periods, which in principle could allow for decade long outbursts, and their similar position to GRS 1915+105 in the diagram. Lastly, it is also possible that 1E 1740.72942, GRS 1758258, SS 433, and 4U 1957+115 may be putting significant amounts of accretion energy into powering an outflow in the form of a relativistic jet, which has been observed in SS 433 (Hjellming & Johnson, 1981; Vermeulen et al., 1987; Fejes et al., 1988; Vermeulen et al., 1993), 1E 1740.72942 (Mirabel et al., 1992), GRS 1758258 (Rodriguez et al., 1992; Pottschmidt et al., 2006) and GRS 1915+105 (Mirabel & Rodríguez, 1994), or an accretion disk wind, as observed in 4U 1957+115, GS 1758258, and GRS 1915+105 (Ponti et al., 2012).
We consider, in more detail, two possibilities to explain (i) why some persistent sources lie well below the irradiated disk stability line and (ii) the scatter in the transient sources. First, the scatter could imply a change in efficiency between the two regimes (e.g., more advection of energy during the hard state). However, given that (i) models that suggest this (e.g., ADAFs; Narayan & Yi 1994) show that the brightest hard states have only a minor reduction in luminosity due to advection (), and (ii) there is an observed absence of a clear luminosity change during spectral transitions in these types of systems (e.g., Maccarone 2005), the difference in accretion efficiencies between the hard and soft states (at the transition luminosity) is most likely minimal, ruling out the idea that radiative efficiency changes between the soft and hard states could effectively alter the observed mass transfer rates.
Second, the scatter may also be a result of significant mass (and energy) loss via outflows present in BHXB systems. Specifically in the case of “hard-only” outbursts, the question becomes where all the accreted material (or more specifically its energy) going, if it is not contributing to the accretion luminosity. Thus, we consider how significant a role the the compact, steady, relativistic plasma jet (an outflow known to arise only in the hard state and not seen in the soft state; Fender et al. 2004) could play. While some material will of course leave in the jet, the amount of material lost to the outflow is most likely not as much as has been found for
accretion disk winds. However, what the jet may transport more effectively than mass is energy. It is thought that at lower Eddington luminosities (a regime associated with “hard-only” outbursts) a larger fraction of the energy released from the accreted material goes into the kinetic (and magnetic) energy of the jet rather than being radiated away (e.g., Fender et al. 2003), effectively resulting in a smaller contribution to accretion luminosity (and hence a lower ) than would be the case if the jet was not present.
Since we also observe outliers that correspond to sources that routinely spend significant periods of time in the soft state, we also consider the opposite situation, namely significant outflows that exist in the soft state but are not observed in the hard state. Originally predicted by the early works on accretion disk theory (Shakura & Sunyaev, 1973), the presence of winds from the outer accretion disk have been observed (exclusively) in the soft accretion state (Neilsen & Lee, 2009; Ponti et al., 2012) of many Galactic BH systems (Lee et al., 2002; Miller et al., 2004, 2006c, 2006b, 2008; King et al., 2012b; Neilsen & Homan, 2012; Diaz Trigo et al., 2014), indicating that these systems can drive outflows in forms other then jets (Diaz Trigo et al., 2011). For a recent review on accretion disk winds see Neilsen (2013).
Ponti et al. (2012) have estimated the wind outflow rate, , in the majority of the sources in which a wind has been detected, to be at least twice the . In addition, a few exceptional cases at high Eddington ratio (e.g., the “heartbeat” states of GRS 1915+105 and IGR J170913624; Neilsen & Lee 2009 and King et al. 2012b), show mass loss rates in excess of 10–20 . In particular, it seems quite plausible that 4U1957+115, which is a persistent BH with a short orbital period that spends substantial time in the SDS, may be losing a large fraction of the mass passing through its outer disk, and thus have an actual mass transfer rate consistent with the irradiated disk stability criterion.
Unfortunately, full calculations of kinetic energy, mass, and momentum flux for the jets and winds have yet to be done (Fender & Gallo, 2014). However, recently Fender & Munoz-Darias (2015) have been able to provide basic estimates for both the mass flow and radiative and kinetic feedback over the course of an individual outburst of GX3394. While we recognize that these estimates are based on a number of assumptions, they are consistent with the ideas postulated above. Namely that, (i) the jet kinetic power exceeds the radiative luminosity during the early and late stages of an outburst (when the source is in the jet-dominated hard state), and (ii) the disk winds (present when the source is in the soft state) are the mechanism responsible for the majority of the mass lost (to the environment) throughout outburst.
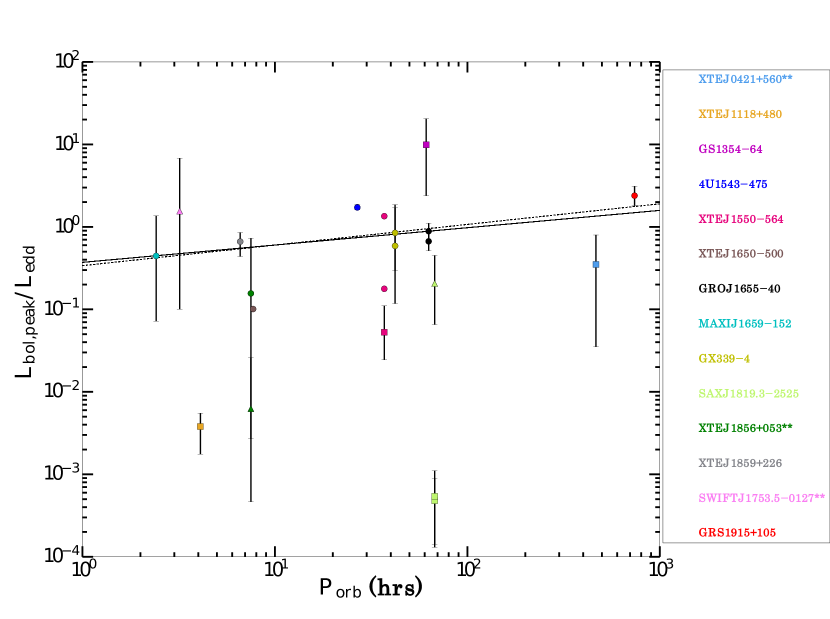
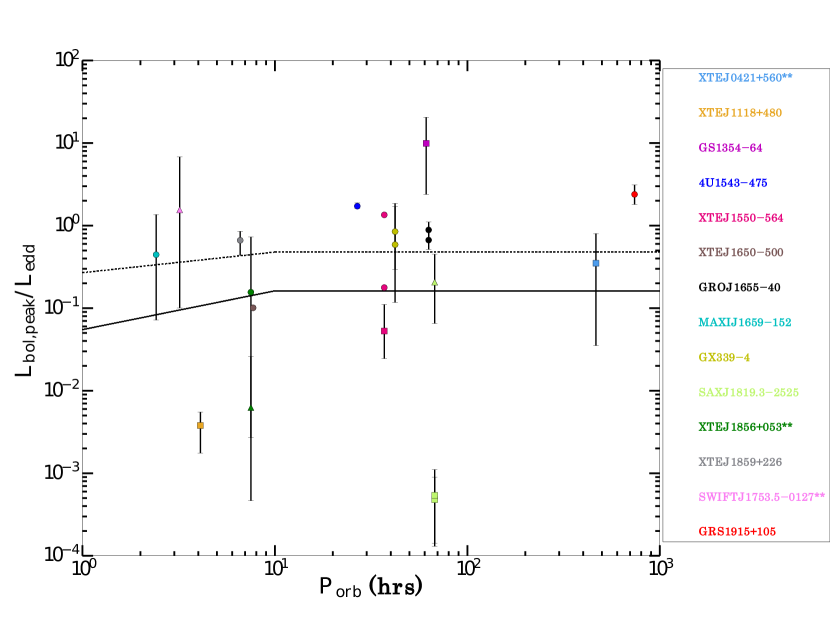
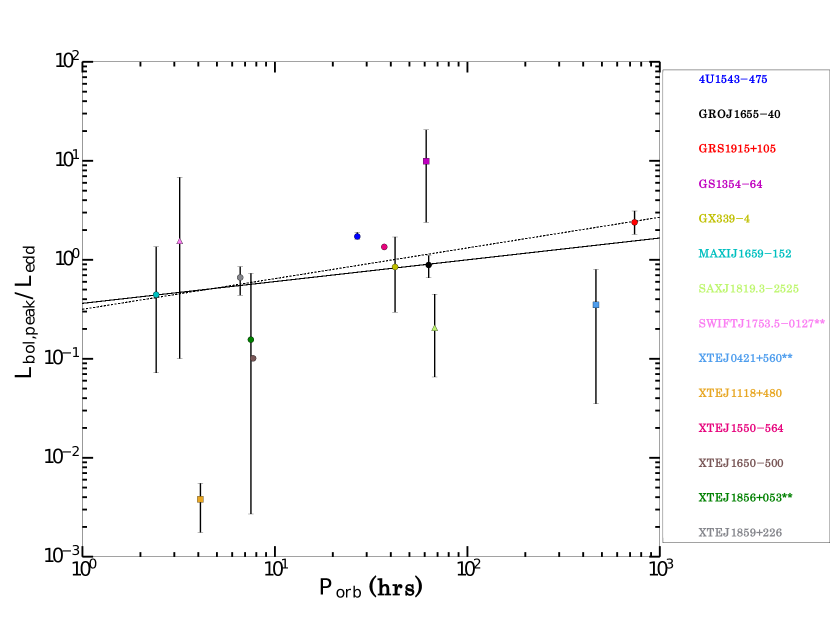
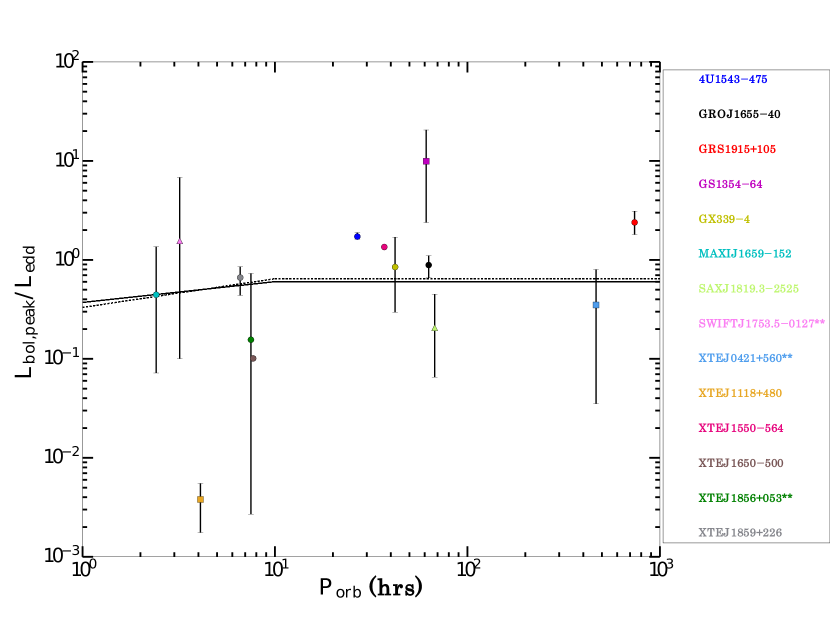
V.2. The relationship between peak outburst luminosity and orbital period
A positive correlation between and peak outburst luminosity for LMXBs has been established in previous studies. (e.g., Shahbaz et al., 1998; Portegies Zwart et al., 2004; Wu et al., 2010). In Figure 27 we plot peak outburst luminosity versus for all the outbursts detected in the 12 recurrent transient and 2 long-term transient (GRS1915+105 and Swift J1753.50127) sources from our sample for which the orbital period is known (see Section II or Table LABEL:table:binaryBH for references). In addition, given that it is the brightest outburst of each source that will tell us the most about the intrinsic properties of the binary, we also plot peak outburst luminosity vs. , for the brightest outburst detected in each of the 12 recurrent transient and 2 long-term transient (GRS1915+105 and Swift J1753.50127) sources from our sample for which the orbital period is known, in Figure 28. Note that we do not include those outbursts that we have identified to contain days when our spectral fitting algorithm has failed, due to the resulting uncertainty in the bolometric luminosities derived from this process (see Sections III.7.5 and IV.6 for discussion and outbursts marked with a “*” in Table LABEL:table:lumdata), in any analysis presented in this Section.
Before comparing our results to past results, we performed non-parametric (Kendall-Tau) tests to determine whether there is evidence for a positive correlation between and peak outburst luminosity. As our data in Figures 27 & 28 include several subsamples, we performed analysis on both the full sample, as well as the individual subsamples of the “successful”, and “hard-only” outbursts. To account for the errors in the peak luminosity, we performed Monte Carlo simulations in logarithmic space assuming a normal distribution and the errors we measured for each outburst. We performed this analysis for all outbursts (Figure 27) and the brightest outbursts (Figure 28). Contrary to past claims, we do not find definitive evidence of a positive correlation. In particular, the “hard-only” outbursts do not show any correlation, which affects both this subsample and the complete sample. However, we find potential agreement with past results for the “successful outburst” sample. In the case where we consider all outbursts, this subsample had a median Kendall-Tau correlation of with only a 23% chance that is consistent with 0. When we only consider the brightest outburst in each source, this sample had a median with only a 14% chance that is consistent with 0. We note that in both cases, the median results from the Monte Carlo simulations are more conservative than the results one gets if the error in luminosity is ignored. If we ignore luminosity errors, we measure with only a 7.9% chance that is consistent with 0 and with only a 9.5% chance that is consistent with 0 for the entire “successful outburst” sample and the brightest “successful outburst” sample, respectively. Given that past results did not consider as broad a suite of errors as we considered and did not use non-parametric tests, this might explain why our result only marginally suggests a correlation. Despite this, we consider the potential correlations that other studies have found in more detail below.
First, following the procedures of Portegies Zwart et al. (2004) and Wu et al. (2010), we attempt to fit the data on a logarithmic scale. Using the MCMC algorithm described in Sections 3.7.5 and 3.7.6 we attempt to fit two different models to the data. We first fit all the data as well as only the data from sources with available distance estimates with a linear relation (resulting in a single power-law model of luminosity versus orbital period). The fit results are presented in Table LABEL:table:linearfit. We note that our best fit slopes in all four cases are smaller then than Wu et al. (2010) result.
Next, following Portegies Zwart et al. (2004), we fit all the data as well as only the data from sources with available distance estimates with a linear model that saturates at a constant for long (resulting in a single power-law model of luminosity versus orbital period at low orbital period and a flat model at high orbital period). This model is motivated by theoretical studies that have suggested that the amount of mass accumulated in the disk during an outburst is related to the orbital period, with a cutoff at longer periods (see Meyer-Hofmeister & Meyer 2000 and Meyer-Hofmeister 2004). As discussed in Wu et al. (2010), if the at which the break occurs is not constrained, the best fit for this parameter will be exceedingly large, essentially making the model identical to the basic linear relation discussed above. For this reason, we do not attempt to fit for the break . Instead, following Portegies Zwart et al. (2004) we choose to fix the break at a value of 10 hours, as suggested by the theory.
The best fit parameters found by fitting the linear saturation model are presented in Table LABEL:table:linearfit2. Comparing the resulting of the linear saturation model to those obtained for the pure linear relation, we find that in the case involving all outbursts from only the sources with known distance estimates, the goodness of fit improves when adding a break and saturation luminosity at long orbital periods, on par with the result found in Portegies Zwart et al. (2004). While the decreases for the same numbers of degrees of freedom compared to the linear model, Monte Carlo simulations indicate that this difference is not statistically significant enough to favor the saturation model over the linear model. Similarly, Monte Carlo simulations indicate that the improved when fitting all outbursts and only the brightest outbursts of the entire sample of sources is not statistically significant enough to favor the linear model over the saturation model in either case. We note that in the two cases involving only sources with known distance estimates, we find a best fit saturation luminosity (constant for the hrs) consistent with the results found by Portegies Zwart et al. (2004). However, in all four cases, our best fit slope is significantly smaller then the results found by Portegies Zwart et al. (2004).
We chose to consider all outbursts to be consistent with past studies, but have additionally fit the relations with respect to the brightest outburst of each source. From a theoretical perspective, we expect any relation between orbital period and outburst luminosity to break down for low luminosity sources, as in these outbursts it is more likely that much a smaller fraction of the accretion disk has been accreted. However, this choice does not provide sufficient statistical leverage to disentangle which model is preferred in our current sample.
Second, given that outbursts from transient systems are far from phenomenologically identical (see Chen et al. 1997, Wu et al. 2010, and this study) and the fact that we have numerous outliers in our dataset, the question becomes whether or not “hard-only” outbursts have statistically different peak outburst luminosities when compared to “successful” outbursts. Performing a two sample KS-test comparing these two sample groups yields p-values of 0.002 and 0.069 for all data and for only outbursts from sources with known distance estimates, respectively.
The former test provides clear statistical evidence that the peak outburst luminosities of “hard-only” and “successful” outbursts do not arise from the same parent distribution, while the latter subsample only provides suggestive statistical evidence of the same.
Third, we find that all “hard-only” outbursts (with the exception of GS 135464) have significantly lower (sub-Eddington) peak luminosities when compared to “successful” outbursts from systems at the same orbital period. This observation is expected as it is the inevitable result of these systems never reaching the high luminosity soft state associated with radiatively efficient accretion. In the case of GS 135464, the higher then expected peak luminosity maybe due to uncertainty in the poorly constrained distance estimate ( kpc). If we were to place GS 135464 at our assumed standard Galactic value (i.e., a uniform distribution between 2 and 8 kpc), , on par with the behavior we see from the other “hard-only” outbursts in our sample.
Lastly, it has been postulated that the low peak outburst luminosities associated with short period BH LMXBs could potentially cause them to remain in the low luminosity hard state (as peak outburst luminosity drops near the limit for radiatively inefficient accretion), rather than entering the high luminosity soft state expected for radiatively efficient accretion. This implies that short period systems may be more prone to “hard-only” outbursts then the longer period systems (Meyer-Hofmeister, 2004; Maccarone & Patruno, 2013; Knevitt et al., 2014).
Currently there are few known BH systems that belong to the short ( hours) regime (See Portegies Zwart et al. 2004 and this work). There are only two possible explanations for why these types of systems are missing from the observed sample: (i) they are too faint to detect with current instrumentation, or (ii) they do not exist. However, given that binary evolution indicates that these systems should not only exist but also dominate the total BHXB number counts (e.g., see Knevitt et al. 2014), we favor case (i) and reason that we need a more-sensitive all-sky monitor to detect their faint (and likely “hard-only”) outbursts (Maccarone et al., 2015).
VI. Summary
Taking advantage of the current suite of more sensitive all-sky, narrow field and scanning X-ray instruments on board INTEGRAL, MAXI, RXTE, and Swift, which have made an in-depth exploration of the transient X-ray Universe possible, we have established a comprehensive database of BH (and BHC) XRB activity over the last 19 years. This database collates observable properties from the literature with the X-ray light curves to enable quantitative classification of these accreting stellar mass BHs. We have assembled our database by running data from seven separate instruments through a custom pipeline composed of a comprehensive algorithm built to discover, track, and quantitatively classify outburst behavior. Until the 2015 May 14 cutoff for our database, we have detected 132 transient outbursts, tracked and classified behavior occurring in 47 transient and 10 persistently accreting black holes, and performed a statistical study on a number of outburst properties across the Galactic population, including outburst detection rates, duration, recurrence rates, duty cycles, total energy radiated, peak luminosity and state transitions.
We have found that not only are our current suite of more sensitive X-ray instruments in space detecting a greater number of sources, an estimated 4–12 transient outbursts per year, more than a factor of three larger than in the pre-RXTE era (Chen et al., 1997) alone, but also that % of the outbursts detected in the last 19 years do not complete the typical “turtlehead” pattern, never transitioning from the HCS to the SDS. This “hard-only” behavior is not just limited to recurrent transients but can also be observed in a number of long-term transient and persistently accreting BH systems as well. In their case this takes the form of long continuous periods spent in the HCS or periodic “incomplete” state transitions (i.e., attempted hard-soft state transitions in which the source only reached as far as the IMS before transitioning back to the hard state).
This “hard-only” behavior is neither a rare nor recent phenomena. Through an extensive literature search, we find a near constant appearance of these “hard-only” outbursts over the last years. This finding, paired with the fact that “hard-only” outbursts tend to have peak Eddington scaled luminosities that are (a regime at or below that where we expect the transition from the hard to the soft state to happen) may indicate that the “hard-only” behavior simply involves the mass-transfer rate onto the BH remaining at a low level throughout the outburst, below the (yet unknown) instability that triggers the change to the soft state.
Given that we find a substantial fraction of the total transient BH outburst sample over the past two decades is represented by “hard-only” outbursts, we have considered the ramifications the larger number of these so-called “hard-only” outbursts (and the entire population of observed BHXB outbursts) have on the luminosity function and mass-transfer history of the Galactic BHXB population.
First, we observe the appearance of a bi-modal distribution present in the luminosity function for the entire transient population, presumably indicative of the cyclic “turtlehead” patterns of temporal evolution in BHXBs. This is a complete deviation from the power-law type distribution found for the entire XRB population of the Galaxy in previous studies (e.g., Grimm et al. 2002). In addition, we find that the features present in the individual source XLFs correlate with outburst classifications and temporal evolution observed in the sources. In particular we find the appearance of a single peak contribution at low luminosities () in the exclusively “hard-only” outburst and persistently HCS sources, a prominent peak at lower luminosity () that is dominated by intermediate state detections in those source that exhibit mainly “incomplete” state transitions, and a dominant contribution at high luminosities (), that is found in those sources that exhibit the typical “turtlehead” pattern (i.e., a significant soft state).
Second, we observe numerous outliers (including both transient and persistent sources) from the theoretically expected correlation in the diagram (Podsiadlowski et al., 2002). There exist a number of explanations for these outliers, including but not limited to, different binary evolution paths (i.e., not all objects at one have the same history), differing local conditions at the first Lagrangian point (e.g., star spots), irradiation-induced mass transfer cycles (e.g., see Podsiadlowski 1991; Harpaz & Rappaport 1991; Buning & Ritter 2004), uncertainties in distance and inclination (and thus beaming), a significant change in accretion efficiency existing between accretion states (e.g., more advection of energy during the hard state; see Knevitt et al. 2014), the possibility that some long period apparently persistent sources are actually long-term transients, or the possibility that a significant amount of accreted matter (or energy from this matter) may be removed from a system via a substantial outflow arising either exclusively in the hard state or exclusively in the soft state (i.e., relativistic jet vs. accretion disk wind) before it has a chance to fall through the disk and contribute to the accretion luminosity, simultaneously implying that the observational difference in estimates is in fact physical and providing further indirect observational evidence signifying the importance of outflows to accretion theory.
In this study we have considered the last three options. Given that previous studies (e.g., Maccarone 2005) have ruled out the possibility that the bright hard states of BHXBs have a significantly different radiative efficiency than the soft states at similar luminosities, we favor a combination of the last two scenarios to explain the scatter in the observed mass transfer rates from the expected correlation. We conclude that our inferred estimates may in fact only be lower limits on the true mass transfer rates from the companions in these systems.
Third, while we find that fitting a linear saturation model (see Meyer-Hofmeister & Meyer 2000 and Meyer-Hofmeister 2004) between and peak outburst luminosity does improve the goodness of fit when the distance to a source is known, when compared to fitting a pure linear model (Shahbaz et al., 1998), the improvement is only marginal. As such, we can not favor either model over the other. For the pure linear model, we find best fit slopes, taking into account all outbursts and only outbursts from sources with distance estimates, that are significantly smaller then previous studies (e.g., Wu et al. 2010). For the linear saturation model, we find best fit saturation luminosities for the hrs regime consistent with the results found by Portegies Zwart et al. (2004) and best fit slopes for the hrs regime that are significantly smaller then the results found by Portegies Zwart et al. (2004).
Overall, this all-sky study has allowed us to probe the wide and varying array of outburst behavior exhibited by Galactic BHXBs, its impact on the physical observables of individual systems alone, and thus the universal properties of the Galactic population as a whole. With our results we have demonstrated that enumerating the frequency at which outbursts occur, tracking outburst properties across the population and quantitatively classifying the wide range of behavior exhibited during outburst will be critical to furthering our understanding of the physical mechanisms driving mass-transfer in binary BH systems and a key step toward filling in the many gaps in our knowledge of how BHXBs form, accrete and evolve.
VII. Acknowledgements
BET would like to thank Hans Krimm for sharing his extensive knowledge of the Galactic BH population and his enthusiastic interest in the project, Erik Rosolowsky for helping develop the MCMC algorithms, Serena Repetto for catching multiple mistakes in the long list of references and her useful comments on the manuscript, Ann Hornschemeier for her interest in this project and positive encouragement during the writing of the manuscript, and Alex Tetarenko for her help creating the name and logo of the Database. BET, GRS, and COH acknowledge support by NSERC Discovery Grants. COH additionally acknowledges support by an Alexander von Humboldt fellowship, and is grateful to the Max Planck Institute for Radioastronomy in Bonn for their hospitality. The authors would also like to thank the anonymous scientific and statistical referees for there detailed comments that have significantly improved the manuscript. This research has made use of data, software, and/or web tools obtained from the High Energy Astrophysics Science Archive Research Center (HEASARC), a service of the Astrophysics Science Division at NASA/GSFC and of the Smithsonian Astrophysical Observatory’s High Energy Astrophysics Division, and the MAXI data provided by RIKEN, JAXA and the MAXI team. This work has also made extensive use of NASA’s Astrophysics Data System (ADS).
References
- Abe et al. (2005) Abe, Y., Fukazama, Y., Kubota, A., Kasama, D., & Makishima, K. 2005, PASJ, 57, 629
- Abell & Margon (1979) Abell, G. O., & Margon, B. 1979, Nature, 279, 701
- Abramowicz & Igumenshchev (2001) Abramowicz, M., & Igumenshchev, I. 2001, ApJ, 554, L53
- Altamirano et al. (2011a) Altamirano, D., Linares, M., van der Klis, M., et al. 2011a, ATEL, 3225
- Altamirano et al. (2011b) Altamirano, D., Belloni, T., Krimm, H., et al. 2011b, ATEL, 3230
- Altamirano et al. (2011c) Altamirano, D., Belloni, T., Linares, M., et al. 2011c, ApJ, 742, L17
- Altamirano et al. (2015) Altamirano, D., Bahramian, A., Sivakoff, G. R., et al. 2015, ATEL, 7874
- Ambrosino et al. (2015) Ambrosino, F., Bruni, I., Cretaro, P., et al. 2015, ATEL, 7842
- Anantharamaiah et al. (1993) Anantharamaiah, K. R., Dwarakanath, K. S., Morris, D., Goss, W. M., & Radhakrishnan, V. 1993, ApJ, 410, 110
- Angelini & White (2003) Angelini, L., & White, N. 2003, ApJ, 586, L71
- Aref’ev et al. (2004) Aref’ev, V. A., Revnivtsev, M. G., Lutovinov, A. A., & Sunyaev, R. A. 2004, AstL, 30, 669
- Arkharov et al. (2015) Arkharov, A., Larionov, V., & Di Paola, A. 2015, ATEL, 7760
- Armas-Padilla et al. (2011) Armas-Padilla, M., Degenaar, N., Patruno, A., et al. 2011, MNRAS, 417, 659
- Armas Padilla et al. (2010a) Armas Padilla, M., Degenaar, N., Patruno, A., & Wijnands, R. 2010a, ATEL, 2656
- Armas Padilla et al. (2013a) Armas Padilla, M., Degenaar, N., Russell, D. M., & Wijnands, R. 2013a, MNRAS, 428, 3083
- Armas Padilla et al. (2010b) Armas Padilla, M., Kaur, R., Degenaar, N., et al. 2010b, ATEL, 2722
- Armas Padilla et al. (2013b) Armas Padilla, M., Wijnands, R., Altamirano, D., et al. 2013b, arXiv:1308.4326
- Atapin et al. (2015) Atapin, K., Fabrika, S., Medvedev, A., & Vinokurov, A. 2015, MNRAS, 446, 893
- Atoyan & Aharonian (1997) Atoyan, A. M., & Aharonian, F. A. 1997, ApJ, 490, L149
- Augusteijn et al. (2001) Augusteijn, T., Coe, M., & Groot, P. 2001, IAU Circ., 7710
- Ayani & Peiris (1999) Ayani, K., & Peiris, T. 1999, IAU Circ., 7254
- Bailyn et al. (2003) Bailyn, C., Maitra, D., Buxton, M., Jeanty, L., & Gonzalez, D. 2003, ATEL, 171
- Bailyn & Orosz (1995) Bailyn, C., & Orosz, J. 1995, ApJ, 440, L73
- Bailyn et al. (1995a) Bailyn, C., Orosz, J., McClintock, J., & Remillard, R. 1995a, Nature, 378, 157
- Bailyn et al. (1995b) Bailyn, C., Orosz, J., Girard, T., et al. 1995b, Nature, 374, 701
- Balam & Graham (2015) Balam, D., & Graham, M. 2015, ATEL, 7706
- Balbus & Hawley (1991) Balbus, S., & Hawley, J. 1991, ApJ, 376, 214
- Balbus & Hawley (1998) —. 1998, RvMP, 70, 1
- Ball et al. (1995) Ball, L., Kesteven, M. J., Campbell-Wilson, D., Turtle, A. J., & Hjellming, R. M. 1995, MNRAS, 273, 722
- Ballet et al. (1993) Ballet, J., Denis, M., Gilfanov, M., & Sunyaev, R. 1993, IAU Circ., 5874
- Band (1989) Band, D. 1989, ApJ, 336, 937
- Barlow et al. (2005) Barlow, E. J., Bird, A. J., Clark, D. J., et al. 2005, A&A, 437, L27
- Barnes & Evans (1976) Barnes, T., & Evans, D. 1976, MNRAS, 174, 489
- Barr & van der Woerd (1990) Barr, P., & van der Woerd, H. 1990, ApJ, 352, L41
- Barret et al. (1996a) Barret, D., McClintock, J., & Grindlay, J. 1996a, ApJ, 473, 963
- Barret et al. (1995) Barret, D., Motch, C., Pietsch, W., & Voges, W. 1995, A&A, 296, 459
- Barret et al. (1992) Barret, D., Roques, J. P., Mandrou, P., et al. 1992, ApJ, 392, L19
- Barret et al. (1996b) Barret, D., Grindlay, J. E., Bloser, P. F., et al. 1996b, IAU Circ., 6519
- Barsukova et al. (2014) Barsukova, E., Goranskij, V., & Kroll, P. 2014, arXiv:1410.2055
- Barsukova et al. (2005) Barsukova, E. A., Borisov, N. V., Burenkov, A. N., et al. 2005, ATEL, 416
- Barsukova et al. (2006) Barsukova, E. A., Borisov, N. V., Burenkov, A. N., et al. 2006, in ASP Conference Proceedings, Vol. 355, Stars with the B[e] Phenomenon, ASP, 305
- Bartlett et al. (2013) Bartlett, E. S., Clark, J. S., Coe, M. J., Garcia, M. R., & Uttley, P. 2013, MNRAS, 429, 1213
- Bazzano et al. (1992) Bazzano, A., La Padula, C., Ubertini, P., & Sood, R. 1992, ApJ, 385, L17
- Beals & Oke (1953) Beals, C. S., & Oke, J. B. 1953, MNRAS, 113, 530
- Beardmore et al. (2015) Beardmore, A. P., Altamirano, D., Kuulkers, E., et al. 2015, ATEL, 7736
- Beekman et al. (1997) Beekman, G., Shahbaz, T., Naylor, T., et al. 1997, MNRAS, 290, 303
- Beekman et al. (1996) Beekman, G., Shahbaz, T., Naylor, T., & Charles, P. A. 1996, MNRAS, 281, L1
- Beer & Podsiadlowski (2002) Beer, M., & Podsiadlowski, P. 2002, MNRAS, 331, 351
- Beers et al. (1990) Beers, T., Flynn, K., & Gebhardt, K. 1990, AJ, 100, 32
- Begelman & Mckee (1983) Begelman, M., & Mckee, C. 1983, ApJ, 271, 89
- Belanger et al. (2005) Belanger, G., Goldwurm, A., Melia, F., et al. 2005, ApJ, 635, 1095
- Belczynski et al. (2004) Belczynski, K., Kalogera, V., Zezas, A., & Fabbiano, G. 2004, ApJ, 601, L147
- Belloni (2010) Belloni, T., ed. 2010, Lecture Notes in Physics, Berlin Springer Verlag, Vol. 794, The Jet Paradigm
- Belloni et al. (2002) Belloni, T., Colombo, A. P., Homan, J., Campana, S., & van der Klis, M. 2002, A&A, 390, 199
- Belloni & Hasinger (1990) Belloni, T., & Hasinger, G. 1990, A&A, 227, L33
- Belloni et al. (2005) Belloni, T., Homan, J., Casella, P., et al. 2005, A&A, 440, 207
- Belloni et al. (2000) Belloni, T., Klein-Wolt, M., Méndez, M., van der Klis, M., & van Paradijs, J. 2000, A&A, 355, 271
- Belloni et al. (1997) Belloni, T., Mendez, M., King, A. R., van der Klis, M., & van Paradijs, J. 1997, ApJ, 479, 145
- Belloni et al. (1999a) Belloni, T., Mendez, M., van der Klis, M., et al. 1999a, ApJ, 519, L159
- Belloni et al. (2013) Belloni, T., Motta, S., & Casella, P. 2013, ATEL, 5417
- Belloni et al. (1999b) Belloni, T., Dieters, S., van den Ancker, M. E., et al. 1999b, ApJ, 527, 345
- Belloni et al. (2006) Belloni, T., Parolin, I., Del Santo, M., et al. 2006, MNRAS, 367, 1113
- Belloni et al. (2012) Belloni, T., Cadolle Bel, M., Casella, P., et al. 2012, ATEL, 4450
- Belloni & Altamirano (2013) Belloni, T. M., & Altamirano, D. 2013, MNRAS, 432
- Belloni et al. (2011) Belloni, T. M., Motta, S. E., & Munoz-Darias, T. 2011, BASI, 39, 409
- Bernardini et al. (2015) Bernardini, F., Russell, D. M., & Lewis, F. 2015, ATEL, 7434
- Bevington & Robinson (2003) Bevington, P., & Robinson, D. 2003, Data Reduction and Error Analysis for the Physical Sciences, 3rd edn. (McGraw-Hill)
- Bird et al. (2010) Bird, A., Bazzano, A., Bassani, L., & Capitanio, F. 2010, ApJS, 186, 1
- Bird et al. (2007) Bird, A. J., Malizia, A., Bazzano, A., et al. 2007, ApJS, 170, 175
- Blandford & Begelman (1999) Blandford, R., & Begelman, M. 1999, MNRAS, 303, L1
- Blandford & Konigl (1979) Blandford, R. D., & Konigl, A. 1979, ApJ, 232, 34
- Blay et al. (2015) Blay, P., Munoz-Darias, T., Kajava, J., et al. 2015, ATEL, 7678
- Blundell & Bowler (2004) Blundell, K., & Bowler, M. 2004, ApJ, 616, L159
- Blundell et al. (2001) Blundell, K., Mioduszewski, A., Muxlow, T., Podsiadlowski, P., & Rupen, M. 2001, ApJ, 562, L79
- Bodaghee et al. (2012) Bodaghee, A., Bozzo, E., Tomsick, J. A., et al. 2012, ATEL, 4328
- Boer et al. (1996) Boer, M., Greiner, J., & Motch, C. 1996, A&A, 305, 835
- Bolton (1975) Bolton, C. 1975, ApJ, 200, 269
- Bonanos et al. (2009) Bonanos, A. Z., Massa, D. L., Sewilo, M., et al. 2009, AJ, 138, 1003
- Borozdin et al. (1994) Borozdin, K., Alexandrovich, N., Arefiev, V., et al. 1994, IAU Circ., 6083
- Borozdin et al. (1996) Borozdin, K., Alexandrovich, N., & Sunyaev, R. 1996, IAU Circ., 6350
- Borozdin & Trudolyubov (2000) Borozdin, K., & Trudolyubov, S. 2000, ApJ, 533, L131
- Borozdin et al. (1995) Borozdin, K. N., Aleksandrovich, N. L., Aref’ev, V. A., Syunyaev, R. A., & Skinner, G. K. 1995, AstL, 21, 212
- Borozdin et al. (1998) Borozdin, K. N., Revnivtsev, M. G., Trudolyubov, S. P., et al. 1998, AstL, 24, 435
- Bouchet et al. (2009) Bouchet, L., del Santo, M., Jourdain, E., et al. 2009, ApJ, 693, 1871
- Bouchet et al. (1991) Bouchet, L., Mandrou, P., Roques, J. P., et al. 1991, ApJ, 383, L45
- Bower et al. (2005) Bower, G., Roberts, D., Yusef-Zadeh, F., et al. 2005, ApJ, 633, 218
- Bradt et al. (1979) Bradt, H., Doxsey, V., & Jernigan, J. 1979, in X-Ray Astronomy, ed. W. Baity & L. Peterson (Oxford), 3
- Bradt & McClintock (1983) Bradt, H., & McClintock, J. 1983, ARA&A, 21, 13
- Braes & Miley (1971) Braes, L. L. E., & Miley, G. K. 1971, Nature, 232, 246
- Braes & Miley (1976) —. 1976, Nature, 264, 731
- Branduardi et al. (2001) Branduardi, G., Ives, J. C., Sanford, P. W., Brinkman, A. C., & Maraschi, L. 2001, MNRAS, 175, 47
- Brinkmann et al. (1989) Brinkmann, W., Kawai, N., & Matsuoka, M. 1989, A&A, 218, 13
- Brinkmann et al. (1991) Brinkmann, W., Kawai, N., Matsuoka, M., & Fink, H. H. 1991, A&A, 241, 112
- Brocksopp et al. (2004) Brocksopp, C., Bandyopadhyay, R. M., & Fender, R. P. 2004, New Ast., 9, 249
- Brocksopp et al. (2005) Brocksopp, C., Corbel, S., Fender, R. P., et al. 2005, MNRAS, 356, 125
- Brocksopp et al. (2013) Brocksopp, C., Corbel, S., Tzioumis, A., et al. 2013, MNRAS, 432, 931
- Brocksopp et al. (2009) Brocksopp, C., Corbel, S., Tzioumis, T., & Fender, R. 2009, ATEL, 2278
- Brocksopp et al. (2010a) Brocksopp, C., Corbel, S., Tzioumis, T., Fender, R., & Coriat, M. 2010a, ATEL, 2400
- Brocksopp et al. (2001) Brocksopp, C., Jonker, P. G., Fender, R. P., et al. 2001, MNRAS, 323, 517
- Brocksopp et al. (2010b) Brocksopp, C., Jonker, P. G., Maitra, D., et al. 2010b, MNRAS, 404, 908
- Brocksopp et al. (2007) Brocksopp, C., Miller-Jones, J. C. A., Fender, R. P., & Stappers, B. W. 2007, MNRAS, 378, 1111
- Brocksopp et al. (2002) Brocksopp, C., Fender, R. P., McCollough, M., et al. 2002, MNRAS, 331, 765
- Brocksopp et al. (2006) Brocksopp, C., McGowan, K., Krimm, H., et al. 2006, MNRAS, 365, 1203
- Broderick et al. (2015) Broderick, J., Stewart, A., Fender, R., Miller-Jones, J., & Mooley, K. nad Pietka, M. 2015, ATEL, 7720
- Buning & Ritter (2004) Buning, A., & Ritter, H. 2004, A&A, 423
- Buxton et al. (2012) Buxton, M., Bailyn, C., Capelo, H., et al. 2012, ApJ, 143, 130
- Buxton et al. (2013a) Buxton, M., Hasan, I., MacPherson, E., & Bailyn, C. 2013a, ATEL, 5244
- Buxton et al. (2013b) —. 2013b, ATEL, 5244
- Buxton et al. (2003) Buxton, M., Maitra, D., Bailyn, C., Jeanty, L., & Gonzalez, D. 2003, ATEL, 170
- Caballero-Garcia et al. (2015a) Caballero-Garcia, M. D., Castro-Tirado, A. J., Jelinek, M., et al. 2015a, ATEL, 7772
- Caballero-Garcia et al. (2015b) Caballero-Garcia, M. D., Castro-Tirado, A. J., Oates, S., & Jeong, S. 2015b, ATEL, 7699
- Caballero-Nieves et al. (2009) Caballero-Nieves, S. M., Gies, D. R., Bolton, C. T., et al. 2009, ApJ, 701, 1895
- Cabellero Garcia et al. (2007) Cabellero Garcia, M., Miller, J., Kuulkers, E., et al. 2007, ApJ, 669, 534
- Cackett et al. (2006) Cackett, E., Wijnands, R., & Remillard, R. 2006, MNRAS, 369, 1965
- Cackett & Miller (2007) Cackett, E. M., & Miller, J. M. 2007, ATEL, 1135
- Cadolle Bel et al. (2004) Cadolle Bel, M., Rodriguez, J., Sizun, P., et al. 2004, A&A, 426, 659
- Cadolle Bel et al. (2007) Cadolle Bel, M., Ribó, M., Rodriguez, J., et al. 2007, ApJ, 659, 549
- Cadolle Bel et al. (2009) Cadolle Bel, M., Prat, L., Rodriguez, J., et al. 2009, A&A, 501, 1
- Callanan et al. (1996) Callanan, P., Garcis, M., Filippenko, A., McLean, I., & Teplitz, H. 1996, ApJ, 470, L57
- Callanan et al. (1995) Callanan, P., Garcia, M., McClintock, J., et al. 1995, ApJ, 441, 786
- Calvelo et al. (2009) Calvelo, D. E., Tzioumis, T., Corbel, S., Brocksopp, C., & Fender, R. P. 2009, ATEL, 2135
- Campana et al. (2001) Campana, S., Stella, L., Belloni, T., et al. 2001, A&A, 384, 163
- Campana et al. (2002) —. 2002, A&A, 384, 163
- Campbell-Wilson et al. (1998) Campbell-Wilson, D., McIntyre, V., Hunstead, R., et al. 1998, IAU Circ., 7010
- Cannizzo (1993) Cannizzo, J. 1993, Accretion Disks in Compact Stellar Systems, ed. J. Wheeler (World Scientific)
- Cannizzo et al. (1995) Cannizzo, J., Chen, W., & Livio, M. 1995, ApJ, 454, 880
- Cannizzo et al. (1985) Cannizzo, J. K., Wheeler, J. C., & Ghosh, P. 1985, in Proceedings of the Seventh North American Workshop, 307
- Cantrell et al. (2008) Cantrell, A., Bailyn, C., McClintock, J., & Orosz, J. 2008, ApJ, 673, L159
- Cantrell et al. (2010) Cantrell, A., Bailyn, C., Orosz, J., et al. 2010, ApJ, 710, 1127
- Capitanio et al. (2006) Capitanio, F., Bazzano, A., Ubertini, P., & Bird, A. J. 2006, in VI Microquasar Workshop: Microquasars and Beyond, 74
- Capitanio et al. (2009a) Capitanio, F., Belloni, T., Del Santo, M., & Ubertini, P. 2009a, MNRAS, 398, 1194
- Capitanio et al. (2012) Capitanio, F., Del Santo, M., Bozzo, E., et al. 2012, MNRAS, 422, 3130
- Capitanio et al. (2010) Capitanio, F., Ubertini, P., Bazzano, A., & Del Santo, M. 2010, in The First Year of MAXI: Monitoring Variable X-ray Sources, 11P
- Capitanio et al. (2005) Capitanio, F., Ubertini, P., Bazzano, A., et al. 2005, ApJ, 622, 503
- Capitanio et al. (2006) Capitanio, F., Bazzano, A., Ubertini, P., et al. 2006, ApJ, 643, 376
- Capitanio et al. (2009b) Capitanio, F., Giroletti, M., Molina, M., et al. 2009b, ApJ, 690, 1621
- Capitanio et al. (2011) Capitanio, F., Tramacere, A., Del Santo, M., et al. 2011, ATEL, 3159
- Carrasco et al. (2015) Carrasco, L., Recillas, E., Porras, A., et al. 2015, ATEL, 7751
- Cartwright et al. (2013) Cartwright, T. F., Engel, M. C., Heinke, C. O., et al. 2013, ApJ, 768, 183
- Casares & Charles (1994) Casares, J., & Charles, P. A. 1994, MNRAS, 271, L5
- Casares et al. (1995a) Casares, J., Charles, P. A., & Marsh, T. R. 1995a, MNRAS, 277, L45
- Casares et al. (1992) Casares, J., Charles, P. A., & Naylor, T. 1992, Nature, 355, 614
- Casares et al. (1995b) Casares, J., Martin, A., Charles, P. A., et al. 1995b, MNRAS, 276, L35
- Casares et al. (1997) Casares, J., Martín, E. L., Charles, P. A., Molaro, P., & Rebolo, R. 1997, New Ast., 1, 299
- Casares et al. (2014) Casares, J., Negueruela, I., Ribó, M., et al. 2014, Nature, 505, 378
- Casares et al. (2012a) Casares, J., Ribo, M., Ribas, I., et al. 2012a, MNRAS, 421, 1103
- Casares et al. (2012b) Casares, J., Rodriguez-Gil, P., Zurita, C., et al. 2012b, ATEL, 4347
- Casares et al. (2011) Casares, J., Torres, M., Negueruela, I., et al. 2011, ATEL, 3206
- Casares et al. (2004) Casares, J., Zurita, C., Shahbaz, T., Charles, P., & Fender, R. 2004, ApJ, 613, L133
- Casares et al. (2009) Casares, J., Orosz, J. A., Zurita, C., et al. 2009, ApJS, 181, 238
- Casella et al. (2004) Casella, P., Belloni, T., Homan, J., & Stella, L. 2004, A&A, 426, 587
- Casella et al. (2005) Casella, P., Belloni, T., & Stella, L. 2005, ApJ, 629, 403
- Castro-Tirado et al. (1994) Castro-Tirado, A., Brandt, S., Lund, N., et al. 1994, ApJS, 92, 469
- Castro-Tirado et al. (1992) Castro-Tirado, A., Branndt, S., & Lund, S. 1992, IAU Circ., 5590
- Castro-Tirado et al. (1996) Castro-Tirado, A., Geballe, T., & Lund, N. 1996, ApJ, 461, L99
- Castro-Tirado et al. (1997) Castro-Tirado, A., Ilovaisky, S., & Pederson, H. 1997, IAU Circ., 6775
- Castro-Tirado et al. (2001) Castro-Tirado, A. J., Kilmartin, P., Gilmore, A., et al. 2001, IAU Circ., 7707
- Chakrabarti et al. (2003) Chakrabarti, S., Pal, S., Nandi, A., Anandarao, B. G., & Mondal, S. 2003, ApJ, 595, L45
- Chakrabarti et al. (2005) Chakrabarti, S., Anandarao, B. G., Pal, S., et al. 2005, MNRAS, 362, 957
- Chakrabarty et al. (2011) Chakrabarty, D., Jonker, P., & Markwardt, C. 2011, ATEL, 3407
- Charles et al. (1999) Charles, P., Shahbaz, T., & Geballe, T. 1999, IAU Circ., 7267
- Charles & Coe (2006) Charles, P. A., & Coe, M. J. 2006, in Compact stellar X-ray sources, ed. W. H. G. Lewin & M. van der Klis (Cambridge University Press), 215–265
- Chaty et al. (2006) Chaty, S., Mignani, R. P., & Israel, G. L. 2006, MNRAS, 365, 1387
- Chaty et al. (2002) Chaty, S., Mignani, R. P., & Vanzi, L. 2002, IAU Circ., 7897
- Chaty et al. (1996) Chaty, S., Mirabel, I. F., Duc, P. A., Wink, J. E., & Rodriguez, L. F. 1996, A&A, 310, 825
- Chen et al. (1997) Chen, W., Shrader, C., & Livio, M. 1997, ApJ, 491, 312
- Chen et al. (2010) Chen, Y., Zhang, S., Torres, D., et al. 2010, A&A, 522, 99C
- Chen et al. (2015) Chen, Y. T., Ishioka, R., King, S. K., et al. 2015, ATEL, 7722
- Chenevez et al. (2014a) Chenevez, J., Brandt, S., Budtz-Jorgensen, C., et al. 2014a, ATEL, 6602
- Chenevez et al. (2014b) —. 2014b, ATEL, 6530
- Cherepashchuk (1981) Cherepashchuk, A. 1981, MNRAS, 194, 761
- Cheung (2007) Cheung, C. C. 2007, ATEL, 1289
- Chevalier & Ilovaisky (1992) Chevalier, C., & Ilovaisky, S. 1992, IAU Circ., 5520
- Chevalier & Ilovaisky (1993) —. 1993, ApJ, 269, 301
- Chun et al. (2013) Chun, Y., Dinçer, T., Kalemci, E., et al. 2013, ApJ, 770, 10
- Churazov et al. (1994) Churazov, E., Gilfanov, M., Ballet, J., & Jourdain, E. 1994, IAU Circ., 6083
- Churazov et al. (1993) Churazov, E., Gilfanov, M., Sunyaev, R., et al. 1993, ApJ, 407, 752
- Church & Balucinska-Church (1997) Church, M., & Balucinska-Church, M. 1997, A&A, 317, L47
- Clark et al. (2000) Clark, J. S., Miroshnichenko, A. S., Larionov, V. M., et al. 2000, A&A, 356, 50
- Cooke et al. (1984) Cooke, B. A., Levine, A. M., Lang, F. L., Primini, F. A., & Lewin, W. H. G. 1984, ApJ, 285, 258
- Corbel et al. (2013) Corbel, S., Coriat, M., Brocksopp, C., et al. 2013, MNRAS, 428, 2500
- Corbel et al. (2012) Corbel, S., Edwards, P., Tzioumis, T., et al. 2012, ATEL, 4410
- Corbel et al. (2004) Corbel, S., Fender, R. P., Tomsick, J. A., Tzioumis, A. K., & Tingay, S. 2004, ApJ, 617, 1272
- Corbel et al. (2000) Corbel, S., Fender, R. P., Tzioumis, A. K., et al. 2000, A&A, 359, 251
- Corbel et al. (2002) —. 2002, Science, 298, 196
- Corbel et al. (2005) Corbel, S., Kaaret, P., Fender, R. P., et al. 2005, ApJ, 632, 504
- Corbel et al. (2003) Corbel, S., Nowak, M., Fender, R. P., Tzioumis, A. K., & Markoff, S. 2003, A&A, 400, 1007
- Corbel et al. (2011) Corbel, S., Rodriguez, J., Tzioumis, T., & Tomsick, J. 2011, ATEL, 3167
- Cordier et al. (1994) Cordier, B., Paul, J., & Hameury, J.-M. 1994, ApJS, 92, 401
- Cordier et al. (1993) Cordier, B., Paul, J., Ballet, J., et al. 1993, A&A, 275, 1
- Coriat et al. (2013a) Coriat, M., Edwards, P., Fender, R., et al. 2013a, ATEL, 4760
- Coriat et al. (2012) Coriat, M., Fender, R., & Dubus, G. 2012, MNRAS, 424, 1991
- Coriat & Rodriguez (2009) Coriat, M., & Rodriguez, J. 2009, ATEL, 2219
- Coriat et al. (2013b) Coriat, M., Tzioumis, T., Corbel, S., & Fender, R. 2013b, ATEL, 5575
- Coriat et al. (2015) Coriat, M., Tzioumis, T., Corbel, S., Fender, R., & Miller-Jones, J. 2015, ATEL, 7656
- Coriat et al. (2011) Coriat, M., Corbel, S., Prat, L., et al. 2011, MNRAS, 414, 677
- Corral-Santana et al. (2015) Corral-Santana, J., Casares, J., Munoz-Darias, T., et al. 2015, arXiv:1510.08869
- Corral-Santana et al. (2013) Corral-Santana, J. M., Casares, J., Muñoz-Darias, T., et al. 2013, Science, 339, 1048
- Corral-Santana et al. (2011) Corral-Santana, J. M., Casares, J., Shahbaz, T., et al. 2011, MNRAS, 413, L15
- Cowley (1992) Cowley, A. 1992, ARA&A, 30, 287
- Cowley et al. (1988) Cowley, A. P., Crampton, D., & Hutchings, J. B. 1988, ApJ, 333, 906
- Cowley et al. (1983) Cowley, A. P., Crampton, D., Hutchings, J. B., Remillard, R., & Penfold, J. E. 1983, ApJ, 272, 118
- Crampton et al. (1980) Crampton, D., Cowley, A., & Hutchings, J. 1980, ApJ, 235, 131
- Crampton & Hutchings (1981) Crampton, D., & Hutchings, J. 1981, ApJ, 251, 604
- Crampton & Hutchings (1987) Crampton, D., & Hutchings, J. B. 1987, ApJ, 251, 604
- Cui et al. (1997a) Cui, W., Heindl, W. A., Swank, J. H., et al. 1997a, ApJ, 487, 73
- Cui et al. (1997b) Cui, W., Morgan, E. H., Heindl, W. A., Swank, J. H., & Smith, D. M. 1997b, IAU Circ., 6604
- Cui et al. (2000) Cui, W., Shrader, C., Haswell, C., & Hynes, R. 2000, ApJ, 525, L123
- Cui et al. (1999) Cui, W., Zhang, S., Chen, W., & Morgan, E. 1999, ApJ, 512, L443
- Cummings et al. (2012) Cummings, J. R., Gronwall, C., Grupe, D., et al. 2012, GCN, 13774
- Curran et al. (2011a) Curran, P., Chaty, S., & Zurita Heras, J. A. 2011a, A&A, 533, A3
- Curran & Chaty (2013) Curran, P. A., & Chaty, S. 2013, A&A, 557, 45
- Curran et al. (2010) Curran, P. A., Evans, P. A., Still, M., Brocksopp, C., & Done, C. 2010, ATEL, 2424
- Curran et al. (2011b) Curran, P. A., Maccarone, T. J., Casella, P., et al. 2011b, MNRAS, 410, 541
- Curran et al. (2014) Curran, P. A., Coriat, M., Miller-Jones, J. C. A., et al. 2014, MNRAS, 437, 3265
- Cutri et al. (2003) Cutri, R. M., Skrutskie, M. F., van Dyk, S., et al. 2003, VizieR Online Data Catalog, 2246, 0
- Davies et al. (1976) Davies, R. D., Walsh, D., Browne, I. W. A., Edwards, M. R., & Noble, R. G. 1976, Nature, 261, 476
- Davis et al. (1975) Davis, R. J., Edwards, M. R., Morison, J., & Spencer, R. E. 1975, Nature, 257, 659
- de Ugarte Postigo et al. (2010) de Ugarte Postigo, A., Flores, H., Wiersema, K., et al. 2010, GCN, 11307
- Debnath et al. (2013a) Debnath, D., Chakrabarti, S., & Nandi, A. 2013a, AdSpR, 52, 2143
- Debnath et al. (2013b) Debnath, D., Mondal, S., & Chakrabarti, S. 2013b, arXiv:1306.3745v1
- Deegan et al. (2009) Deegan, P., Combet, C., & Wynn, G. 2009, MNRAS, 400, 1337
- Degenaar et al. (2008a) Degenaar, N., Altamirano, D., Klein-Wolt, M., & Wijnands, R. 2008a, ATEL, 1451
- Degenaar et al. (2008b) Degenaar, N., Altamirano, D., & Wijnands, R. 2008b, ATEL, 1467
- Degenaar & Wijnands (2008) Degenaar, N., & Wijnands, R. 2008, ATEL, 1541
- Degenaar & Wijnands (2009) —. 2009, A&A, 495, 547
- Del Santo et al. (2008) Del Santo, M., Malzac, J., Jourdain, E., Belloni, T., & Ubertini, P. 2008, MNRAS, 390, 227
- del Santo et al. (2004) del Santo, M., Bazzano, A., Zdziarski, A. A., et al. 2004, A&A, 433, 613
- Del Santo et al. (2011) Del Santo, M., Kuulkers, E., Bozzo, E., et al. 2011, ATEL, 3203
- della Valle & Benetti (1993) della Valle, M., & Benetti, S. 1993, IAU Circ., 5890
- della Valle et al. (1997) della Valle, M., Benetti, S., Cappellaro, E., & Wheeler, C. 1997, A&A, 318, 179
- della Valle et al. (1991) della Valle, M., Jarvis, B., & West, R. 1991, A&A, 247, L33
- della Valle et al. (1998) della Valle, M., Massetti, N., & Bianchini, A. 1998, A&A, 329, 606
- della Valle et al. (1994) della Valle, M., Mirabel, I. F., & Rodriguez, L. F. 1994, A&A, 290, 803
- Dhawan et al. (2000) Dhawan, V., Mirabel, I. F., & Rodríguez, L. F. 2000, ApJ, 543, 373
- Diaz Trigo et al. (2011) Diaz Trigo, M., Boirin, L., Costantini, E., Mendez, M., & Parmar, A. 2011, A&A, 528, A150
- Diaz Trigo et al. (2014) Diaz Trigo, M., Migliari, S., Miller-Jones, J. C. A., & Guaninazzi, M. 2014, A&A, 571, A76
- Díaz Trigo et al. (2013) Díaz Trigo, M., Miller-Jones, J., Migliari, S., Broderick, J., & Tzioumis, T. 2013, Nature, 504, 260
- Diaz Trigo et al. (2007) Diaz Trigo, M., Parmar, A. N., Miller, J., Kuulkers, E., & Cabellero Garcia, M. 2007, A&A, 462, 657
- Dickey (1983) Dickey, J. 1983, ApJ, 273, 71
- Dieters et al. (2000) Dieters, S. W., Belloni, T., Kuulkers, E., et al. 2000, ApJ, 538, 307
- Djorgovski et al. (1999) Djorgovski, S. G., Gal, R. R., Mahabal, A., et al. 1999, ATEL, 44
- D’Odorico et al. (1991) D’Odorico, S., Oosterloo, T., Zwitter, T., & Calvani, M. 1991, Nature, 353, 329
- Doebereiner et al. (1989) Doebereiner, S., Englhauser, J., Pietsch, W., et al. 1989, in ESA Special Publication, Vol. 296, Two Topics in X-Ray Astronomy, Volume 1: X Ray Binaries. Volume 2: AGN and the X Ray Background, ed. J. Hunt & B. Battrick, 387–392
- Dolan et al. (1979) Dolan, J. F., Crannell, C. J., Dennis, B. R., Frost, K. J., & Orwig, L. E. 1979, ApJ, 230, 551
- Domingo et al. (2015) Domingo, J., Alfonso-Garzón, J., Mas-Hesse, J., Rodriguez, J., & Cadolle Bel, M. 2015, ATEL, 7717
- Done (2010) Done, C. 2010, in XXI Canary Islands Winter School of Astrophysics, ed. T. Shahbaz (Cambridge University Press), 184–226
- Done & Gierlinski (2003) Done, C., & Gierlinski, M. 2003, MNRAS, 342, 1041
- Done et al. (2007) Done, C., Gierlinski, M., & Kubota, A. 2007, ARA&A, 15, 1
- Done et al. (2004) Done, C., Wardzinski, G., , & Gierlinski, M. 2004, MNRAS, 349, 393
- Downes et al. (2001) Downes, R., Webbink, R., Shara, M., et al. 2001, PASJ, 113, 764
- Doxsey et al. (1977) Doxsey, H., Bradt, G., & Fabbiano, R. 1977, IAU Circ., 3113
- Ducci et al. (2014) Ducci, L., Rodriguez, J., Grinberg, V., Kuulkers, E., & Bozzo, E. 2014, ATEL, 6474
- Duldig et al. (1979) Duldig, M. L., Greenhill, J. G., Thomas, R. M., et al. 1979, MNRAS, 187, 567
- Dunn et al. (2010) Dunn, R. J. H., Fender, R. P., Körding, E. G., Belloni, T., & Cabanac, C. 2010, MNRAS, 403, 61
- Durouchoux et al. (1996) Durouchoux, P., Smith, I. A., Hurley, K., et al. 1996, IAU Circ., 6383
- Dzib et al. (2015) Dzib, S., Massi, M., & Jaron, F. 2015, A&A, 580, 6
- Eachus et al. (1976) Eachus, L., Wright, E., & Liller, W. 1976, ApJ, 203, L17
- Ebisawa et al. (2003) Ebisawa, K., Bourban, G., Bodaghee, A., Mowlavi, N., & Courvoisier, T. J.-L. 2003, A&A, 411, L59
- Ebisawa et al. (1993) Ebisawa, K., Makino, F., Mitsuda, K., et al. 1993, ApJ, 403, 684
- Ebisawa et al. (1996) Ebisawa, K., Ueda, Y., Inoue, H., Tanaka, Y., & White, N. 1996, ApJ, 467, 419
- Ebisawa et al. (1994) Ebisawa, K., Ogawa, M., Aoki, T., et al. 1994, PASJ, 46, 375
- Eikenberry et al. (1998) Eikenberry, S., Matthews, K., Morgan, E., Remillard, R., & Nelson, R. 1998, ApJ, 494, L61
- Eikenberry et al. (2001) Eikenberry, S. S., Fischer, W. J.a nd Egami, E., & Djorgovski, S. G. 2001, ApJ, 556, 1
- Elvis et al. (1975) Elvis, M., Page, C. G., Pounds, K. A., Ricketts, M. J., & Turner, M. J. L. 1975, Nature, 257, 656
- Emelyanov et al. (2000) Emelyanov, A. N., Aleksandrovich, N. L., & Sunyaev, R. A. 2000, AstL, 26, 297
- Esin et al. (1997) Esin, A., McClintock, J., & Narayan, R. 1997, ApJ, 489, 865
- Eyles et al. (1975) Eyles, C. J., Skinner, G. K., Willmore, A. P., & Rosenberg, F. D. 1975, Nature, 257, 291
- Fabian & Rees (1979) Fabian, A., & Rees, M. 1979, MNRAS, 187, 13P
- Fabrika (2004) Fabrika, S. 2004, ASPRv, 12, 1
- Fabrika & Bychkova (1990) Fabrika, S., & Bychkova, L. 1990, A&A, 240, L5
- Falcke et al. (2004) Falcke, H., Kording, E., & Markoff, S. 2004, A&A, 414, 895
- Farinelli et al. (2013) Farinelli, R., Amati, L., Shaposhnikov, N., et al. 2013, MNRAS, 428, 3295
- Fejes et al. (1988) Fejes, I., Schilizzi, R., & Vermeulen, R. 1988, A&A, 189, 124
- Fender (2010) Fender, R. 2010, in Lecture Notes in Physics, Berlin Springer Verlag, Vol. 794, Lecture Notes in Physics, Berlin Springer Verlag, ed. T. Belloni, 115
- Fender & Belloni (2004) Fender, R., & Belloni, T. 2004, ARA&A, 42, 317
- Fender et al. (2004) Fender, R., Belloni, T., & Gallo, E. 2004, MNRAS, 355, 1105
- Fender & Gallo (2014) Fender, R., & Gallo, E. 2014, arXiv:1407.3674
- Fender et al. (2003) Fender, R., Gallo, E., & Jonker, P. 2003, MNRAS, 343, 99
- Fender et al. (2005) Fender, R., Garrington, S., & Muxlow, T. 2005, ATEL, 558
- Fender et al. (2000a) Fender, R., Rayner, D., Norris, R., Sault, R. J., & Pooley, G. 2000a, ApJ, 530, L29
- Fender et al. (1998) Fender, R., Stappers, B., Wieringa, M., & Wark, R. 1998, IAU Circ., 6937
- Fender et al. (1999a) Fender, R., Corbel, S., Tzioumis, T., et al. 1999a, ApJ, 519, L165
- Fender et al. (1999b) Fender, R. P., Garrington, S. T., McKay, D. J., et al. 1999b, MNRAS, 304, 865
- Fender et al. (1999c) Fender, R. P., Hanson, M. M., & Pooley, G. G. 1999c, MNRAS, 308, 473
- Fender et al. (2001) Fender, R. P., Hjellming, R. M., Tilanus, R. P. J., et al. 2001, MNRAS, 322, L23
- Fender & Munoz-Darias (2015) Fender, R. P., & Munoz-Darias, T. 2015, arXiv:1505.03526v1
- Fender & Pooley (1998) Fender, R. P., & Pooley, G. G. 1998, MNRAS, 300, 573
- Fender et al. (1997a) Fender, R. P., Pooley, G. G., Brocksopp, C., & Newell, S. J. 1997a, MNRAS, 290, L65
- Fender et al. (2000b) Fender, R. P., Pooley, G. G., Durouchoux, P., Tilanus, R. P. J., & Brocksopp, C. 2000b, MNRAS, 312, 853
- Fender et al. (2002) Fender, R. P., Rayner, D., McCormick, D. G., et al. 2002, MNRAS, 336, 39
- Fender et al. (1997b) Fender, R. P., Spencer, R. E., Newell, S. J., & Tzioumis, A. K. 1997b, MNRAS, 286, L29
- Fender et al. (2006) Fender, R. P., Stirling, A. M., Spencer, R. E., et al. 2006, MNRAS, 369, 603
- Fender et al. (1997c) Fender, R. P., Tingay, S., Higdon, J., Wark, R., & Wieringa, M. 1997c, IAU Circ., 6779
- Ferrigno et al. (2015a) Ferrigno, C., Bozzo, E., Boissay, R., Kuulkers, E., & Kretschmar, P. 2015a, ATEL, 7731
- Ferrigno et al. (2011) Ferrigno, C., Bozzo, E., Del Santo, M., & Capitanio, F. 2011, A&A, 537, L7
- Ferrigno et al. (2015b) Ferrigno, C., Fotopoulou, S., Domingo, A., et al. 2015b, ATEL, 7662
- Filippenko et al. (1995) Filippenko, A., Matheson, T., & Ho, L. 1995, ApJ, 455, 614
- Filippenko et al. (1988) Filippenko, A., Romani, R., Sargent, W., & Blandford, R. 1988, AJ, 96, 242
- Filippenko & Chornock (2001) Filippenko, A. V., & Chornock, R. 2001, IAU Circ., 7644
- Filippenko et al. (1999) Filippenko, A. V., Leonard, D., Matheson, T., et al. 1999, PASP, 111, 969
- Filippenko et al. (1997) Filippenko, A. V., Matheson, T., Leonard, D. C., Barth, A. J., & van Dyk, S. D. 1997, PASP, 109, 461
- Filippova et al. (2014a) Filippova, E., Kuulkers, E., Skådt, N. M., et al. 2014a, ATEL, 5991
- Filippova et al. (2014b) Filippova, E., Kuulkers, E., Skadt, N. M., et al. 2014b, ATEL, 5991
- Filippova et al. (2005) Filippova, E. V., Tsygankov, S. S., Lutovinov, A. A., & Sunyaev, R. A. 2005, AstL, 31, 729
- Focke et al. (2000) Focke, W. B., Markwardt, C. B., Swank, J. H., & Taam, R. E. 2000, in Astrophysics with the Rossi X-ray Timing Explorer, NASA’s Goddard Space Flight Center
- Foreman-Mackey et al. (2012) Foreman-Mackey, D., Hogg, D., Lang, D., & Goodman, J. 2012, arXiv:1202.365v4
- Foster et al. (1996) Foster, R. S., Waltman, E. B., Tavani, M., et al. 1996, ApJ, 467, L81
- Fragos et al. (2008) Fragos, T., Kalogera, V., Belczynski, K., et al. 2008, ApJ, 683, 346
- Fragos et al. (2009) —. 2009, ApJ, 702, L143
- Francey (1971) Francey, R. 1971, Nature Phys. Sci., 229, 228
- Frank et al. (2002) Frank, J., King, A., & Raine, D. 2002, Accretion Power in Astrophysics (Cambridge University Press)
- Freedman et al. (2001) Freedman, W., Madore, B., Gibson, B., et al. 2001, ApJ, 553, 47
- Froning et al. (2014) Froning, C., Maccarone, T., France, K., et al. 2014, ApJ, 780, 48
- Froning & Robinson (2001) Froning, C., & Robinson, E. 2001, AJ, 121, 2212
- Froning et al. (2011) Froning, C., Cantrell, A., Maccarone, T., et al. 2011, ApJ, 743, 26
- Frontera et al. (1998) Frontera, F., Orlandini, M., Amati, L., et al. 1998, A&A, 339, L69
- Frontera et al. (2001) Frontera, F., Zdziarski, A. A., Amati, L., et al. 2001, ApJ, 561, 1006
- Fuhrmeister & Schmitt (2003) Fuhrmeister, B., & Schmitt, J. 2003, A&A, 403, 247
- Gallo et al. (2003) Gallo, E., Fender, R., & Pooley, G. G. 2003, MNRAS, 344, 60
- Gallo & Fender (2002) Gallo, E., & Fender, R. P. 2002, MNRAS, 337, 869
- Gallo et al. (2005) Gallo, E., Fender, R. P., & Hynes, R. I. 2005, MNRAS, 356, 1017
- Gallo et al. (2006) Gallo, E., Fender, R. P., Miller-Jones, J. C. A., et al. 2006, MNRAS, 370, 1351
- Gallo et al. (2007) Gallo, E., Migliari, S., Markoff, S., et al. 2007, ApJ, 670, 600
- Gallo et al. (2012) Gallo, E., Miller, B., & Fender, R. 2012, MNRAS, 423, 590
- Gandhi et al. (2015a) Gandhi, P., Littlefair, S., Hardy, L., et al. 2015a, ATEL, 7686
- Gandhi et al. (2015b) Gandhi, P., Shaw, A. W., Pahari, M., et al. 2015b, ATEL, 7727
- Garcia et al. (2014) Garcia, J., McClintock, J., Steiner, J., Remillard, R., & Grinberg, V. 2014, ApJ, 794, 73
- Garnavich et al. (2002) Garnavich, P., Quinn, J., & Callanan, P. 2002, IAU Circ., 7877
- Garnavich & Quinn (2000) Garnavich, P. M., & Quinn, J. 2000, IAU Circ., 7388
- Garnavich et al. (1999) Garnavich, P. M., Stanek, K. Z., & Berlind, P. 1999, IAU Circ., 7276
- Garner et al. (2015) Garner, A., Eikenberry, S., Stelter, R. D., et al. 2015, ATEL, 7663
- Gazeas et al. (2015) Gazeas, K., Vasilopoulos, G., Petropoulou, M., & Sapoutntzis, K. 2015, ATEL, 7650
- Gehrels (1986) Gehrels, N. 1986, ApJ, 303, 336
- Geldzahler (1983) Geldzahler, B. J. 1983, ApJ, 264, L49
- Gelino (2001) Gelino, D. 2001, PhD thesis, New Mexico State University
- Gelino et al. (2006) Gelino, D., Balman, S., Kızıloglu, U., et al. 2006, ApJ, 642, 438
- Gelino et al. (2010) Gelino, D., Gelino, C., & Harrison, T. 2010, ApJ, 718, 1
- Gelino & Harrison (2003) Gelino, D., & Harrison, T. 2003, ApJ, 599, 1254
- Gelino et al. (2001a) Gelino, D., Harrison, T., & McNamara, B. 2001a, AJ, 122, 971
- Gelino et al. (2001b) Gelino, D., Harrison, T., & Orosz, J. 2001b, AJ, 122, 2668
- Gelino et al. (2001c) —. 2001c, AJ, 122, 2668
- Gelino (2002) Gelino, D.M. Harrison, T. 2002, BAAS, 34, 654
- Giacconi et al. (1967) Giacconi, R., Gorenstein, P., Gursky, H., & Waters, J. R. 1967, ApJ, 148, 119
- Giacconi et al. (1974) Giacconi, R., Murray, S., Gursky, H., et al. 1974, ApJ, 27, 37
- Gierlinski et al. (2008) Gierlinski, M., Done, C., & Page, K. 2008, MNRAS, 388, 753
- Gierlinski et al. (2009) —. 2009, MNRAS, 392, 1106
- Gierlinski & Newton (2006) Gierlinski, M., & Newton, J. 2006, MNRAS, 370, 837
- Gierlinski et al. (2010) Gierlinski, M., Zdziarski, A., & Done, C. 2010, arXiv:1011.5840
- Gierlinski et al. (1997) Gierlinski, M., Zdziarski, A., Done, C., et al. 1997, MNRAS, 288, 958
- Gies & Bolton (1982) Gies, D. R., & Bolton, C. T. 1982, ApJ, 260, 240
- Gies & Bolton (1986) —. 1986, ApJ, 304, 371
- Gies et al. (2002) Gies, D. R., McSwain, M. V., Riddle, R. L., et al. 2002, ApJ, 566, 1069
- Gilfanov (2010) Gilfanov, M. 2010, in Lecture Notes in Physics, Berlin Springer Verlag, Vol. 794, Lecture Notes in Physics, Berlin Springer Verlag, ed. T. Belloni (Springer), 17
- Gilfanov et al. (1999) Gilfanov, M., Churazov, E., & Revnivtsev, M. 1999, ApJ, 352, 182
- Gilfanov et al. (1993) Gilfanov, M., Churazov, E., Sunyaev, R., et al. 1993, ApJ, 418, 844
- Gladstone et al. (2007) Gladstone, J. C., Done, C., & Gierlinski, M. 2007, MNRAS, 378, 13
- Gleissner et al. (2004) Gleissner, T., Wilms, J., Pooley, G. G., et al. 2004, A&A, 425, 1061
- Gogus et al. (2004) Gogus, E., Finger, M., Kouveliotou, C., et al. 2004, ApJ, 609, 977
- Goldoni et al. (1999) Goldoni, P., Vargas, M., Goldwurm, A., et al. 1999, ApJ, 511, 847
- Gomez et al. (2015) Gomez, S., Mason, P., & Robinson, E. 2015, arXiv:1506.00181
- Gonzalez Hernandez et al. (2008) Gonzalez Hernandez, J., Rebolo, R., Israelian, G., et al. 2008, ApJ, 679, 732
- Goranskij (2011) Goranskij, V. 2011, Peremennye Zvezdy, 31, 5
- Grebenev et al. (2005a) Grebenev, S. A., Molkov, S. V., Revnivtsev, M. G., & Sunyaev, R. A. 2005a, ATEL, 447
- Grebenev et al. (2007) Grebenev, S. A., Molkov, S. V., Revnivtsev, M. G., & Sunyaev, R. A. 2007, in ESA Special Publication, Vol. 622, ESA Special Publication, 373
- Grebenev et al. (2005b) Grebenev, S. A., Molkov, S. V., & Sunyaev, R. A. 2005b, ATEL, 444
- Grebenev & Sunyaev (2005) Grebenev, S. A., & Sunyaev, R. A. 2005, AstL, 31, 672
- Grebenev & Sunyaev (2012) —. 2012, ATEL, 4401
- Greene et al. (2001) Greene, J., Bailyn, C., & Orosz, J. 2001, ApJ, 554, 1290
- Greiner et al. (2001a) Greiner, J., Cuby, J. G., & McCaughrean, M. J. 2001a, Nature, 414, 522
- Greiner et al. (2001b) Greiner, J., Cuby, J. G., McCaughrean, M. J., Castro-Tirado, A. J., & Mennickent, R. E. 2001b, A&A, 373, L37
- Greiner et al. (1997) Greiner, J., Dennerl, K., & Predehl, P. 1997, A&A, 314, L21
- Greiner et al. (1996) Greiner, J., Morgan, E., & Remillard, R. 1996, ApJ, 473, L107
- Greiner et al. (2012) Greiner, J., Rau, A., & Schady, P. 2012, ATEL, 4030
- Greiner & Reid (1993) Greiner, J., & Reid, N. 1993, IAU Circ., 5786
- Greiner et al. (2008) Greiner, J., Sla, G., & Kruehler, T. 2008, ATEL, 1577
- Greiner et al. (1994) Greiner, J., Snowden, S., Harmon, B. A., Kouveliotou, C., & Paciesas, W. 1994, in American Institute of Physics Conference Series, Vol. 304, American Institute of Physics Conference Series, ed. C. E. Fichtel, N. Gehrels, & J. P. Norris, 260–264
- Griffiths et al. (1977) Griffiths, R., Johnston, M., Doxsey, R., et al. 1977, IAU Circ., 3110
- Griffiths et al. (1978) Griffiths, R. E., Bradt, H., Doxsey, R., et al. 1978, ApJ, 221, L63
- Grimm et al. (2002) Grimm, H., Gilfanov, M., , & Sunyaev, R. 2002, A&A, 391, 923
- Grinberg et al. (2011) Grinberg, V., Boeck, M., Pottschmidt, K., et al. 2011, ATEL, 3616
- Grinberg et al. (2013) Grinberg, V., Hell, N., Pottschmidt, K., et al. 2013, A&A, 554, 88
- Grinberg et al. (2014a) Grinberg, V., Wilms, J., Pottschmidt, K., et al. 2014a, ATEL, 6344
- Grinberg et al. (2014b) Grinberg, V., Pottschmidt, K., Böck, M., et al. 2014b, A&A, 565, 1
- Grindlay et al. (1984) Grindlay, J. E., Band, D., Seward, F., et al. 1984, ApJ, 277, 286
- Groot et al. (2001) Groot, P., Tingay, S., Udalski, A., & Miller, J. 2001, IAU Circ., 7708
- Haardt et al. (2001) Haardt, F., Galli, M. R., Treves, A., et al. 2001, ApJS, 133, 187
- Hakala et al. (1999) Hakala, P., Muhli, P., & Dubus, G. 1999, MNRAS, 306, 701
- Halpern (2005) Halpern, J. P. 2005, ATEL, 549
- Halpern & Tyagi (2005) Halpern, J. P., & Tyagi, S. 2005, ATEL, 682
- Hameury et al. (1986) Hameury, J., King, A. R., & Lasota, J. 1986, A&A, 162, 71
- Hameury et al. (1987) —. 1987, A&A, 171, 140
- Hameury et al. (1988) —. 1988, A&A, 192, 187
- Hameury et al. (1990) —. 1990, ApJ, 353, 585
- Han et al. (1999) Han, P., Qu, J., Zhang, S., et al. 1999, MNRAS, 413, 1072
- Han et al. (2011) —. 2011, MNRAS, 413, 1072
- Han & Hjellming (1992) Han, X., & Hjellming, R. M. 1992, ApJ, 400, 304
- Hannikainen et al. (2001) Hannikainen, D., Campbell-Wilson, D., Hunstead, R., et al. 2001, ApSS, 276, 45
- Hannikainen et al. (1998) Hannikainen, D. C., Hunstead, R. W., Campbell-Wilson, D., & Sood, R. K. 1998, A&A, 337, 460
- Hannikainen et al. (2005) Hannikainen, D. C., Rodriguez, J., Vilhu, O., et al. 2005, A&A, 435, 995
- Hanson et al. (2000) Hanson, M. M., Still, M. D., & Fender, R. P. 2000, ApJ, 541, 308
- Hardy et al. (2015) Hardy, L., Littlefair, S., Dhillon, V., Butterley, T., & Wilson, R. 2015, ATEL, 7681
- Harlaftis et al. (1999) Harlaftis, E., Collier, S., Horne, K., & Filippenko, A. 1999, A&A, 341, 491
- Harlaftis et al. (2001) Harlaftis, E., Dhillion, V., & Castro-Tirado, A. 2001, A&A, 369, 210
- Harlaftis et al. (1996) Harlaftis, E., Horne, K., & Filippenko, A. 1996, PASP, 108, 762
- Harlaftis et al. (1997) Harlaftis, E., Steeghs, D., Horne, K., & Filippenko, A. 1997, AJ, 114, 1170
- Harlaftis & Greiner (2004) Harlaftis, E. T., & Greiner, J. 2004, A&A, 413, L13
- Harmon et al. (1992) Harmon, B., Wilson, R., & Finger, M. 1992, IAU Circ., 5504
- Harmon et al. (1993a) Harmon, B., Zhang, S., Paciesas, W., & Fishman, G. 1993a, IAU Circ., 5900
- Harmon et al. (1997) Harmon, B. A., Deal, K. J., Paciesas, W. S., et al. 1997, ApJ, 471, 85
- Harmon et al. (1998) Harmon, B. A., McCollough, M. L., Wilson, C. A., Zhang, S. N., & Paciesas, W. S. 1998, IAU Circ., 6933
- Harmon et al. (1994a) Harmon, B. A., Paciesas, W. S., & Fishman, G. J. 1994a, IAU Circ., 5619
- Harmon et al. (1993b) Harmon, B. A., Zhang, S. N., Fishman, G. J., & Wilson, C. A. 1993b, IAU Circ., 5890
- Harmon et al. (1994b) Harmon, B. A., Wilson, C. A., Paciesas, W. S., et al. 1994b, ApJ, 425, L17
- Harmon et al. (1995) Harmon, B. A., Wilson, C. A., Zhang, S. N., et al. 1995, Nature, 374, 703
- Harpaz & Rappaport (1991) Harpaz, A., & Rappaport, S. 1991, ApJ, 383, 739
- Haswell et al. (2001) Haswell, C., King, A., Murray, J., & Charles, P. 2001, MNRAS, 321, 475
- Haswell et al. (1993) Haswell, C., Robinson, E., Horne, K., Steining, R., & Abbott, T. 1993, ApJ, 411, 802
- Heindl et al. (1994) Heindl, W., Prince, T., & Grunsfeld, J. 1994, ApJ, 430, 829
- Heindl & Smith (2002) Heindl, W. A., & Smith, D. M. 2002, ApJ, 578, L125
- Heinke et al. (2010) Heinke, C. O., Altamirano, D., Cohn, H. N., et al. 2010, ApJ, 714, 894
- Heise (1997) Heise, J. 1997, IAU Circ., 6606
- Herbig (1995) Herbig, G. 1995, ARA&A, 33, 19
- Hertz & Grindlay (1984) Hertz, P., & Grindlay, J. 1984, ApJ, 278, 137
- Hiemstra et al. (2011) Hiemstra, B., Mendez, M., Done, C., et al. 2011, MNRAS, 411, 137
- Hillwig & Gies (2008) Hillwig, T. C., & Gies, D. R. 2008, ApJ, 676, 37
- Hiroi et al. (2011) Hiroi, K., Ueda, Y., Isobe, N., et al. 2011, PASJ, 63, S677
- Hjalmarsdotter et al. (2008) Hjalmarsdotter, L., Zdziarski, A. A., Larsson, S., et al. 2008, MNRAS, 384, 278
- Hjellming (2000) Hjellming, R. 2000, ATEL, 61
- Hjellming & Rupen (1995) Hjellming, R., & Rupen, M. 1995, Nature, 375, 464
- Hjellming et al. (1998a) Hjellming, R., Rupen, M., & Mioduszewski, A. 1998a, IAU Circ., 6934
- Hjellming et al. (1998b) —. 1998b, IAU Circ., 6924
- Hjellming et al. (1999a) —. 1999a, IAU Circ., 7254
- Hjellming et al. (1999b) —. 1999b, IAU Circ., 7265
- Hjellming et al. (1996a) Hjellming, R., Rupen, M. P., Marti, J., Mirabel, F., & Rodriguez, L. 1996a, IAU Circ., 6383
- Hjellming (1973) Hjellming, R. M. 1973, ApJ, 182, L29
- Hjellming et al. (1988) Hjellming, R. M., Calovini, T. A., Han, X., & Cordova, F. A. 1988, ApJ, 335, L75
- Hjellming & Han (1989) Hjellming, R. M., & Han, X.-H. 1989, IAU Circ., 4796
- Hjellming & Johnson (1981) Hjellming, R. M., & Johnson, K. 1981, ApJ, 246, L141
- Hjellming et al. (1998c) Hjellming, R. M., Mioduszewski, A. J., Ueda, Y., et al. 1998c, IAU Circ., 6872
- Hjellming et al. (1998d) Hjellming, R. M., Rupen, M. P., Mioduszewski, A. J., et al. 1998d, BAAS, 193
- Hjellming et al. (1996b) Hjellming, R. M., Rupen, M. P., Shrader, C. R., et al. 1996b, ApJ, 470, L105
- Hjellming & Wade (1971a) Hjellming, R. M., & Wade, C. M. 1971a, Nature, 234, 138
- Hjellming & Wade (1971b) —. 1971b, ApJ, 168, L21
- Hjellming et al. (1998e) Hjellming, R. M., Rupen, M. P., Ghigo, F., et al. 1998e, IAU Circ., 6937
- Hjellming et al. (1999c) Hjellming, R. M., Rupen, M. P., Mioduszewski, A. J., et al. 1999c, ApJ, 514, 383
- Hjellming et al. (1999d) Hjellming, R. M., Rupen, M. P., Hunstead, R. W., et al. 1999d, ApJ, 544, 977
- Hjellming et al. (2000) —. 2000, ApJ, 544, 977
- Hog et al. (2010) Hog, D., Bovy, J., & Lang, D. 2010, arXiv:1008.4686v1
- Hog et al. (2000a) Hog, E., Fabricius, C., Makarov, V. V., et al. 2000a, A&A, 355, L27
- Hog et al. (2000b) —. 2000b, A&A, 355, 27
- Holt et al. (1979) Holt, S., Kaluzienski, L., Boldt, E., & Serlemitsos, P. 1979, ApJ, 233, 334
- Homan (2010) Homan, J. 2010, ATEL, 2387
- Homan & Belloni (2005) Homan, J., & Belloni, T. 2005, Ap&SS, 300, 107
- Homan et al. (2005) Homan, J., Buxton, M., Markoff, S., et al. 2005, ApJ, 624, 295
- Homan et al. (2003a) Homan, J., Klein-Wolt, M., Rossi, S., et al. 2003a, ApJ, 586, 1262
- Homan et al. (2006a) Homan, J., Miller, J., & Wijnands, R. 2006a, ATEL, 752
- Homan et al. (2003b) Homan, J., Miller, J. M., Wijnands, R., et al. 2003b, ATEL, 162
- Homan & Wijnands (2003) Homan, J., & Wijnands, R. 2003, ATEL, 169
- Homan et al. (2006b) Homan, J., Wijnands, R., Kong, A., et al. 2006b, MNRAS, 366, 235
- Homan et al. (2001) Homan, J., Wijnands, R., van der Klis, M., et al. 2001, ApJS, 132, 377
- Huang & Wheeler (1989) Huang, M., & Wheeler, J. 1989, ApJ, 343, 229
- Hunstead & Webb (2002) Hunstead, R., & Webb, J. 2002, IAU Circ., 7925
- Hutchings et al. (1983) Hutchings, J. B., Crampton, D., & Cowley, A. P. 1983, ApJ, 275, L43
- Hutchings et al. (1987) Hutchings, J. B., Crampton, D., Cowley, A. P., Bianchi, L., & Thompson, I. B. 1987, AJ, 94, 340
- Hynes et al. (2015a) Hynes, R., Robinson, E., & Morales, J. 2015a, ATEL, 7677
- Hynes et al. (2015b) —. 2015b, ATEL, 7710
- Hynes et al. (1999) Hynes, R., Rocher, P., Charles, P., & Coe, M. 1999, MNRAS, 305, L49
- Hynes (2005) Hynes, R. I. 2005, ApJ, 623, 1026
- Hynes et al. (2000a) Hynes, R. I., Haswell, C. A., Chaty, S., Shrader, C. R., & Cui, W. 2000a, MNRAS, 331, 169
- Hynes et al. (2000b) Hynes, R. I., Mauche, C. W., Haswell, C. A., et al. 2000b, ApJ, 539, L37
- Hynes et al. (2005) Hynes, R. I., Robinson, E., & Bitner, M. 2005, ApJ, 630, 405
- Hynes et al. (2003) Hynes, R. I., Steeghs, D., Casares, J., Charles, P. A., & O’Brien, K. 2003, ApJ, 593, L95
- Hynes et al. (2004) —. 2004, ApJ, 609, 317
- Hynes et al. (2002) Hynes, R. I., Zurita, C., Haswell, C. A., et al. 2002, MNRAS, 330, 1009
- Ichimaru (1977) Ichimaru, S. 1977, ApJ, 217, 840
- in ’t Zand et al. (1999) in ’t Zand, J., Heise, J., Bazzano, A., et al. 1999, IAU Circ., 7119
- in ’t Zand et al. (2001) in ’t Zand, J. J. M., Kaptein, R. G., & Heise, J. 2001, IAU Circ., 7582
- in ’t Zand et al. (1992) in ’t Zand, J. J. M., Pan, H. C., Bleeker, J. A. M., et al. 1992, A&A, 266, 283
- in ’t Zand et al. (1991) in ’t Zand, J. J. M., Heise, J., Brinkman, A. C., et al. 1991, AdSpR, 11, 187
- in’t Zand et al. (2002a) in’t Zand, J. J. M., Capalbi, M., & Perri, M. 2002a, IAU Circ., 7873
- in’t Zand et al. (2003) in’t Zand, J. J. M., Heise, J., Lowes, P., & Ubertini, P. 2003, ATEL, 160
- in’t Zand et al. (2002b) in’t Zand, J. J. M., Miller, J. M., Oosterbroek, T., & Parmar, A. N. 2002b, A&A, 394, 553
- in’t Zand et al. (2000) in’t Zand, J. J. M., Kuulkers, E., Bazzano, A., et al. 2000, A&A, 357, 520
- in’t Zand et al. (2002c) in’t Zand, J. J. M., Markwardt, C. B., Bazzano, A., et al. 2002c, A&A, 390, 587
- Ioannou et al. (2004) Ioannou, Z., Robinson, E. L., Welsh, W. F., & Haswell, C. A. 2004, AJ, 127, 481
- Ishibashi et al. (2010) Ishibashi, W., Bozzo, E., Terrier, R., et al. 2010, ATEL, 2803
- Ishida et al. (2004) Ishida, M., Morio, K., & Ueda, Y. 2004, ApJ, 601, 1088
- Itoh et al. (2015) Itoh, R., Watanabe, M., Imai, M., et al. 2015, ATEL, 7709
- Iyudin & Haberl (1997) Iyudin, A., & Haberl, F. 1997, IAU Circ., 6738
- Jahoda et al. (1996) Jahoda, K., Swank, J. an Giles, A., Stark, M., et al. 1996, in X-Ray, and Gamma-Ray Instrumentation for Astronomy VII, ed. O. Siegmund & M. Gummin, Vol. 2808, 59–70
- Jain et al. (1999) Jain, R., Bailyn, C., Orosz, J., Remillard, R., & McClintock, J. 1999, ApJ, 517, L131
- Jenke et al. (2015) Jenke, P., Wilson-Hodge, C., Finder, M., Paciesas, W., & Connaughton, V. 2015, ATEL, 7715
- Joinet et al. (2008) Joinet, A., Kalemci, E., & Senziani, F. 2008, ApJ, 679, 655
- Jones (1977) Jones, C. 1977, ApJ, 214, 856
- Jones et al. (1976) Jones, C., Forman, W., Tananbaum, H., & Turner, M. J. L. 1976, ApJ, 210, L9
- Jonker et al. (2004) Jonker, P. G., Gallo, E., Dhawan, V., et al. 2004, MNRAS, 351, 1359
- Jonker & Nelemans (2004) Jonker, P. G., & Nelemans, G. 2004, MNRAS, 354, 355
- Jonker et al. (2010) Jonker, P. G., Miller-Jones, J., Homan, J., et al. 2010, MNRAS, 401, 1255
- Jourdain et al. (2014) Jourdain, E., Roques, J. P., & Chauvin, M. 2014, ApJ, 789, 26
- Jung et al. (1995) Jung, G. V., Kurfess, D. J., Johnson, W. N., et al. 1995, A&A, 295, 23
- Kaaret et al. (2003) Kaaret, P., Corbel, S., Tomsick, J. A., et al. 2003, ApJ, 582, 945
- Kaaret et al. (2006) —. 2006, ApJ, 641, 410
- Kalamkar et al. (2011) Kalamkar, M., Homan, J., Altamirano, D., et al. 2011, ApJ, 731, L2
- Kalemci et al. (2005) Kalemci, E., Tomsick, J. A., Buxton, M. M., et al. 2005, ApJ, 622, 508
- Kalemci et al. (2006) Kalemci, E., Tomsick, J. A., Rothschild, R. E., et al. 2006, ApJ, 639, 340
- Kalemci et al. (2003) —. 2003, ApJ, 586, 419
- Kalemci et al. (2001) Kalemci, E., Tomsick, J. A., Rothschild, R. E., Pottschmidt, K., & Kaaret, P. 2001, ApJ, 563, 239
- Kalemci et al. (2008) Kalemci, E., Tomsick, J. A., Yamaoka, K., & Ueda, Y. 2008, ATEL, 1348
- Kalemci et al. (2014) Kalemci, E., Arabacı, M. Özbeyand Güver, T., Russell, D. M., et al. 2014, MNRAS, 445, 1288
- Kallman et al. (2009) Kallman, T. R., Bautista, M. A., Goriely, S., et al. 2009, ApJ, 701, 865
- Kalogera & Baym (1996) Kalogera, V., & Baym, G. 1996, ApJ, 470, L61
- Kaluzienski & Holt (1977) Kaluzienski, L. J., & Holt, S. S. 1977, IAU Circ., 3104
- Kaluzienski et al. (1975) Kaluzienski, L. J., Holt, S. S., Boldt, E. A., et al. 1975, ApJ, 201, L121
- Kaluzienski et al. (1977) Kaluzienski, L. J., Holt, S. S., Swank, J. H., Boldt, E. A., & Serlemitsos, P. J. 1977, BAAS, 9, 592
- Kaniovsky et al. (1993) Kaniovsky, A., Borozdin, K., & Sunyaev, R. 1993, IAU Circ., 5878
- Kaplin et al. (1980) Kaplin, G., Kallarakl, V., Harrington, R., Johnston, K., & Spencer, J. 1980, ApJ, 85, 1
- Karasev et al. (2008) Karasev, D. I., Lutovinov, A. A., & Burenin, R. A. 2008, AstL, 34, 753
- Karasev et al. (2007) Karasev, D. I., Lutovinov, A. A., & Grebenev, S. A. 2007, AstL, 33, 159
- Kassim et al. (2015) Kassim, N. E., Giacintucci, S., Lane-Peters, W. M., et al. 2015, ATEL, 7728
- Kaur et al. (2012) Kaur, R., Kaper, L., Ellerbroek, L., et al. 2012, ApJ, 746, L23
- Kennea et al. (2012a) Kennea, J., Miller, J. M., Beardmore, A., Degenaar, N., & Reynolds, M. T. 2012a, ATEL, 4071
- Kennea et al. (2005) Kennea, J., Palmer, D., Burrows, D., & Gehrels, N. 2005, ATEL, 626
- Kennea et al. (2007) Kennea, J., Steeghs, D., Torres, M., Homan, J., & Miller, J. 2007, ATEL, 1237
- Kennea et al. (2010) Kennea, J. A., Krimm, H., Mangano, V., et al. 2010, ATEL, 2877
- Kennea et al. (2011a) Kennea, J. A., Romano, P., Mangano, V., et al. 2011a, ApJ, 736, 22
- Kennea et al. (2011b) Kennea, J. A., Hoversten, E. A., Siegel, M. H., et al. 2011b, ATEL, 3613
- Kennea et al. (2012b) Kennea, J. A., Altamirano, D., Evans, P. A., et al. 2012b, ATEL, 4034
- Kennea et al. (2012c) Kennea, J. A., Yang, Y. J., Altamirano, D., et al. 2012c, ATEL, 4044
- Kennea et al. (2012d) Kennea, J. A., Krimm, H. A., Holland, S. T., et al. 2012d, ATEL, 4145
- Kimura et al. (2012) Kimura, M., Tomida, H., Nakahira, S., et al. 2012, ATEL, 4198
- King (1988) King, A. 1988, QJRAS, 29, 1
- King (1995) —. 1995, in X-Ray Binaries, ed. W. Lewin, J. van Paraijs, & E. van den Heuvel (Cambridge University Press), 419–456
- King et al. (2015) King, A., Miller, J., & Morningstar, W. 2015, ATEL, 7745
- King et al. (2012a) King, A. L., Miller, J. M., Degenaar, N., Reynolds, M., & Reis, R. 2012a, ATEL, 4295
- King et al. (2012b) King, A. L., Miller, J. M., Raymond, J., et al. 2012b, ApJL, 746, L20
- King et al. (1996) King, A. R., Kolb, U., & Burderi, L. 1996, ApJ, 464, 127
- King & Ritter (1998) King, A. R., & Ritter, H. 1998, MNRAS, 293, 42
- Kirsch et al. (2005) Kirsch, M. G., Briel, U. G., Burrows, D., et al. 2005, in UV, X-Ray, and Gamma-Ray Space Instrumentation for Astronomy XIV, ed. O. Siegmund, Vol. 5898, 22–23
- Kitamoto et al. (1984) Kitamoto, S., Miyamoto, S., & Tsunemi, H. 1984, PASJ, 36, 799
- Kitamoto et al. (1990a) Kitamoto, S., Takahashi, K., & Yamashita, K. 1990a, PASJ, 42, 85
- Kitamoto et al. (1992) Kitamoto, S., Tsunemi, H., Miyamoto, S., & Hyashida, K. 1992, ApJ, 394, 609
- Kitamoto et al. (1989) Kitamoto, S., Tsunemi, H., Miyamoto, S., Yamashita, K., & Mizobuchi, S. 1989, Nature, 342, 518
- Kitamoto et al. (1990b) Kitamoto, S., Tsunemi, H., Pedersen, H., Ilovaisky, S., & van der Klis, M. 1990b, ApJ, 361, 590
- Klein-Wolt et al. (2002) Klein-Wolt, M., Fender, R., Pooley, G., et al. 2002, MNRAS, 331, 745
- Knevitt et al. (2014) Knevitt, G., Wynn, G. A., Vaughan, S., & Watson, M. G. 2014, MNRAS, 437, 3087
- Knigge et al. (2015a) Knigge, C., Marsh, T. R., Sivakoff, G. R., et al. 2015a, ATEL, 7735
- Knigge et al. (2015b) Knigge, C., Sivakoff, G. R., Kuulkers, E., Altamirano, D., & Neilsen, J. 2015b, ATEL, 7773
- Koljonen et al. (2015) Koljonen, K., Russell, D. M., & Lewis, F. 2015, ATEL, 7887
- Koljonen et al. (2010) Koljonen, K. I. I., Hannikainen, D. C., McCollough, M. L., Pooley, G. G., & Trushkin, S. A. 2010, MNRAS, 406, 307
- Kong (2005) Kong, A. 2005, ATEL, 625
- Kong et al. (2002) Kong, A., Charles, P., Kuulkers, E., & Kitamoto, S. 2002, MNRAS, 329, 588
- Kong (2012) Kong, A. K. H. 2012, ApJ, 760, L127
- Kong et al. (2010a) Kong, A. K. H., Lin, C.-C., Chen, Y.-T., et al. 2010a, ATEL, 2976
- Kong et al. (2010b) Kong, A. K. H., Price, P. A., Magnier, E., et al. 2010b, ATEL, 3011
- Kotani et al. (1994) Kotani, T., Kawai, N., Aoki, T., et al. 1994, PASJ, 46, L147
- Kotani et al. (2000) Kotani, T., Kawai, N., Nagase, F., et al. 2000, ApJ, 543, L133
- Kreidberg et al. (2012) Kreidberg, L., Bailyn, C., Farr, W., & Kalogera, V. 2012, ApJ, 757, 36
- Krimm et al. (2011a) Krimm, H., Kennea, J., & Holland, S. 2011a, ATEL, 3142
- Krimm et al. (2013a) —. 2013a, ATEL, 5529
- Krimm et al. (2008a) Krimm, H., Racusin, J., & Markwardt, C. 2008a, ATEL, 1706
- Krimm et al. (2014a) Krimm, H. A., Kennea, J., Shaposhnikov, N., & Tomsick, J. 2014a, in AAS/High Energy Astrophysics Division, Vol. 14, AAS/High Energy Astrophysics Division, 109.03
- Krimm & Kennea (2011) Krimm, H. A., & Kennea, J. A. 2011, ATEL, 3148
- Krimm et al. (2008b) Krimm, H. A., Kennea, J. A., Evans, P. A., & Markwardt, C. B. 2008b, ATEL, 1714
- Krimm et al. (2011b) Krimm, H. A., Tomsick, J. A., Markwardt, C. B., et al. 2011b, ApJ, 735, 104
- Krimm et al. (2008c) Krimm, H. A., Barthelmy, S. D., Baumgartner, W., et al. 2008c, ATEL, 1855
- Krimm et al. (2008d) Krimm, H. A., Kennea, J., Barthelmy, S. D., et al. 2008d, ATEL, 1610
- Krimm et al. (2008e) Krimm, H. A., Gehrels, N., Hoversten, E. A., et al. 2008e, GCN Circ., 8200
- Krimm et al. (2009a) Krimm, H. A., Kennea, J. A., Barthelmy, S. D., et al. 2009a, ATEL, 2156
- Krimm et al. (2009b) Krimm, H. A., Strohmayer, T. E., Swank, J. H., et al. 2009b, ATEL, 2300
- Krimm et al. (2010) Krimm, H. A., Romano, P., Vercellone, S., et al. 2010, ATEL, 2375
- Krimm et al. (2011c) Krimm, H. A., Barthelmy, S. D., Baumgartner, W., et al. 2011c, ATEL, 3138
- Krimm et al. (2012) —. 2012, ATEL, 4139
- Krimm et al. (2013b) Krimm, H. A., Holland, S. T., Corbet, R. H. D., et al. 2013b, ApJSS, 209, 14
- Krimm et al. (2013c) Krimm, H. A., Barthelmy, S. D., Baumgartner, W., et al. 2013c, ATEL, 5523
- Krimm et al. (2014b) —. 2014b, ATEL, 5986
- Krivonos et al. (2005) Krivonos, R., Molkov, S., Revnivtsev, M., et al. 2005, ATEL, 545
- Kubota & Makishima (2004) Kubota, A., & Makishima, K. 2004, ApJ, 601, 428
- Kubota et al. (2001) Kubota, A., Makishima, K., & K., E. 2001, ApJ, 560, L147
- Kubota et al. (2010) Kubota, K., Ueda, Y., Fabrika, S., et al. 2010, ApJ, 709, 1374
- Kuiper et al. (1988) Kuiper, L., van Paradijs, J., & van der Klis, M. 1988, A&A, 203, 79
- Kuulkers (2015a) Kuulkers, E. 2015a, ATEL, 7695
- Kuulkers (2015b) —. 2015b, ATEL, 7758
- Kuulkers et al. (1999) Kuulkers, E., Fender, R. P., Spencer, R., Davis, R., & Morison, I. 1999, MNRAS, 306, 919
- Kuulkers et al. (2003) Kuulkers, E., Lutovinov, A., Parmar, A., et al. 2003, ATEL, 149
- Kuulkers et al. (2015) Kuulkers, E., Motta, S., Kajava, J., et al. 2015, ATEL, 7647
- Kuulkers et al. (1997a) Kuulkers, E., Parmar, A. N., Kitamoto, S., Cominsky, L. R., & Sood, R. K. 1997a, MNRAS, 291, 81
- Kuulkers et al. (1997b) Kuulkers, E., van der Klis, M., & Parmar, A. 1997b, ApJ, 474, L47
- Kuulkers et al. (2006a) Kuulkers, E., Chenevez, J., Shaw, S., et al. 2006a, ATEL, 888
- Kuulkers et al. (2006b) Kuulkers, E., Shaw, S., Paizis, A., et al. 2006b, ATEL, 874
- Kuulkers et al. (2007) Kuulkers, E., Shaw, S. E., Paizis, A., et al. 2007, A&A, 466, 595
- Kuulkers et al. (2008) Kuulkers, E., Beckmann, V., Shaw, S., et al. 2008, ATEL, 1385
- Kuulkers et al. (2010) Kuulkers, E., Ibarra, A., Pollock, A., et al. 2010, ATEL, 2912
- Kuulkers et al. (2013) Kuulkers, E., Kouveliotou, C., Belloni, T., et al. 2013, A&A, 552, 32
- Kuznetsov et al. (1999) Kuznetsov, S. I., Gilfanov, M. R., Churazov, E. M., et al. 1999, AstL, 25, 351
- Lapshov et al. (1993) Lapshov, I., Sazonov, S., & Sunyaev, R. 1993, IAU Circ., 5864
- Lasota (2001) Lasota, J. 2001, NewAR, 45, 449
- Lee et al. (2002) Lee, J. C., Reynolds, C. S., Remillard, R., et al. 2002, ApJ, 567, 1102
- Leibowitz et al. (1998) Leibowitz, E., Hemar, S., & Orio, M. 1998, MNRAS, 300, 463
- Leong et al. (1971) Leong, C., Kellogg, E., Gursky, H., Tananbaum, H., & Giacconi, R. 1971, ApJ, 170, 67
- Levine et al. (1996) Levine, A., Bradt, H., Cui, W., et al. 1996, ApJ, 469, L33
- Levine et al. (2005a) Levine, A., Lin, D., & Remillard, R. 2005a, ATEL, 623
- Levine et al. (2005b) Levine, A., Swank, J., Lin, D., & Remillard, R. 2005b, ATEL, 578
- Levine & Remillard (2007) Levine, A. M., & Remillard, R. A. 2007, ATEL, 1024
- Levine, A.M. and Lin, D. and Remillard, R.A. (2005) Levine, A.M. and Lin, D. and Remillard, R.A. 2005, ATEL, 623
- Liller (1999) Liller, W. 1999, ATEL, 7254
- Lin et al. (2000) Lin, D., Smith, I., Liang, E., et al. 2000, ApJ, 532, 548
- Lin & Taam (1984) Lin, D. N. C., & Taam, R. E. 1984, in , AIP, 82
- Linares et al. (2007) Linares, M., van der Klis, M., & Wijnands, R. 2007, ApJ, 660, 595
- Ling et al. (1983) Ling, J., Mahoney, W., Wheaton, W., Jacobson, A., & Kaluzienski, L. 1983, ApJ, 275, 307
- Ling et al. (1987) Ling, J. C., Mahoney, W. A., Wheaton, W. A., & Jacobson, A. S. 1987, ApJ, 321, L117
- Ling et al. (2009) Ling, Z., Zhang, S., & Tang, S. 2009, ApJ, 695, 1111
- Lipunov et al. (2015) Lipunov, V., Rebolo, R., Gorbovskoy, E., et al. 2015, ATEL, 7696
- Liu et al. (2000) Liu, Q. Z., van Paradijs, J., & van den Heuvel, E. P. J. 2000, A&A, 147, 25
- Liu et al. (2001) —. 2001, A&A, 368, 1021
- Liu et al. (2006) —. 2006, A&A, 455, 1165
- Liu et al. (2007) —. 2007, A&A, 469, 807
- Lloyd et al. (2012) Lloyd, C., Oksanen, A., Starr, P., Darlington, G., & Pickard, R. 2012, ATEL, 4246
- Lockman et al. (2007) Lockman, F., Blundell, K., & Goss, W. 2007, MNRAS, 381, 881
- Longmore et al. (1977) Longmore, A., Cannon, R., Murdin, P., & Malin, D. 1977, IAU Circ., 3110
- Lopez et al. (2006) Lopez, L., Marshall, H., Canizares, C., Schulz, N., & Kane, J. 2006, ApJ, 650, 338
- Lucarelli et al. (2010) Lucarelli, F., Verrecchia, F., Striani, E., et al. 2010, ATEL, 2761, 1
- Lund et al. (2003) Lund, N., et al. 2003, A&A, 411, 231
- Lundt & Brandt (1991) Lundt, N., & Brandt, S. 1991, IAU Circ., 5161
- Lutovinov et al. (2003a) Lutovinov, A., RKretschmar, P., Budtz-Joergensen, C., et al. 2003a, ATEL, 145
- Lutovinov et al. (2003b) Lutovinov, A., Rodriguez, J., Produit, N., et al. 2003b, ATEL, 151
- Lutovinov & Revnivtsev (2003) Lutovinov, A. A., & Revnivtsev, M. G. 2003, AstL, 29, 719
- Maccarone (2003) Maccarone, T. 2003, A&A, 409
- Maccarone (2005) —. 2005, MNRAS, 360, 68
- Maccarone (2014) —. 2014, SSRv, 183, 101
- Maccarone & Coppi (2003) Maccarone, T., & Coppi, P. 2003, MNRAS, 338, 189
- Maccarone & Patruno (2013) Maccarone, T. J., & Patruno, A. 2013, MNRAS, 428, 1335
- Maccarone et al. (2015) Maccarone, T. J., Wijnands, R. A. M., Degenaar, N., et al. 2015, arXiv:1505.02769
- MacDonald et al. (2014) MacDonald, R., Bailyn, C., Buxton, M., et al. 2014, ApJ, 784, 2
- MacDonald et al. (2011) MacDonald, R. K. D., Bailyn, C. D., & Cantrell, A. G. 2011, in Bulletin of the American Astronomical Society, Vol. 43, American Astronomical Society Meeting Abstracts #217, #144.20
- Maeda et al. (1996) Maeda, Y., Koyama, K., Sakano, M., Takeshima, T., & Yamauchi, S. 1996, PASJ, 48, 417
- Main et al. (1999) Main, D. S., Smith, D. M., Heindl, W. A., et al. 1999, ApJ, 525, 901
- Maitra & Bailyn (2006) Maitra, D., & Bailyn, C. 2006, ApJ, 637, 992
- Maitra et al. (2005) Maitra, D., Cobb, B., Bailyn, C., Nelan, J., & Gonzalez, D. 2005, ATEL, 628
- Maitra et al. (2013) Maitra, D., Miller, J., Reynolds, M., Reis, R., & Nowak, M. 2013, arXiv:1306.4365
- Makino (1987) Makino, F. 1987, IAU Circ., 4342
- Makino (1988) —. 1988, IAU Circ., 4571
- Makino (1989) —. 1989, IAU Circ., 4782
- Makino & the Ginga Team (1991) Makino, F., & the Ginga Team. 1991, IAU Circ., 5161
- Makishima et al. (1986) Makishima, K., Maejima, Y., Mitsuda, K., et al. 1986, ApJ, 308, 635
- Malzac & Belmont (2009) Malzac, J., & Belmont, R. 2009, MNRAS, 392, 570
- Mandrou (1990) Mandrou, P. 1990, IAU Circ., 5032
- Mangano et al. (2010a) Mangano, V., Baumgartner, W. H., Cummings, J. R., et al. 2010a, GCN, 11294
- Mangano et al. (2010b) Mangano, V., Hoversten, E. A., Markwardt, C. B., et al. 2010b, GCN, 11296
- Margon (1980) Margon, B. 1980, in Annals of the New York Academy of Sciences, Vol. 336, Ninth Texas Symposium on Relativistic Astrophysics, ed. J. Ehlers, J. J. Perry, & M. Walker, 550–565
- Margon (1984) Margon, B. 1984, ARA&A, 22, 507
- Margon & Anderson (1989) Margon, B., & Anderson, S. 1989, ApJ, 347, 448
- Margon et al. (1978) Margon, B., Thorstensen, J., & Bowyer, S. 1978, ApJ, 221, 907
- Markert et al. (1973) Markert, T. H., Canizares, C. R., Clark, G. W., et al. 1973, ApJ, 184, L67
- Markert et al. (1979) Markert, T. H., Laird, F. N., Clark, G. W., et al. 1979, ApJS, 39, 573
- Markoff et al. (2003) Markoff, S., Nowak, M., Corbel, S., Fender, R., & Falcke, H. 2003, A&A, 397, 645
- Markwardt (2001) Markwardt, C. B. 2001, Ap&SS, 276, 209
- Markwardt (2003a) —. 2003a, ATEL, 115
- Markwardt (2003b) —. 2003b, ATEL, 143
- Markwardt (2006) Markwardt, C. B. 2006, in AIP Conference Proceedings, Vol. 840, The Transient Milky Way: A Perspective for MIRAX, AIP, 45
- Markwardt et al. (2009a) Markwardt, C. B., Barthelmy, S. D., Evans, P. A., & Swank, J. H. 2009a, ATEL, 2261
- Markwardt & Beardmore (2009) Markwardt, C. B., & Beardmore, A. 2009, ATEL, 2120
- Markwardt et al. (2008a) Markwardt, C. B., Halpern, J. P., Holland, S. T., et al. 2008a, ATEL, 1716
- Markwardt et al. (2007) Markwardt, C. B., Klein-Wolt, M., Swank, J. H., & Wijnands, R. 2007, ATEL, 1249
- Markwardt et al. (2008b) Markwardt, C. B., Krimm, H., Wijnands, R., & Swank, J. H. 2008b, ATEL, 1709
- Markwardt et al. (1999a) Markwardt, C. B., Marshall, F. E., & Swank, J. H. 1999a, IAU Circ., 7274
- Markwardt et al. (2008c) Markwardt, C. B., Pereira, D., & Swank, J. H. 2008c, ATEL, 1699
- Markwardt et al. (2008d) —. 2008d, ATEL, 1685
- Markwardt et al. (2005) Markwardt, C. B., Strohmayer, T., Swank, J. H., & Levine, A. 2005, ATEL, 579
- Markwardt et al. (2010) Markwardt, C. B., Strohmayer, T. E., & Swank, J. H. 2010, ATEL, 2615
- Markwardt & Swank (2003) Markwardt, C. B., & Swank, J. H. 2003, ATEL, 133
- Markwardt & Swank (2007) —. 2007, ATEL, 1235
- Markwardt & Swank (2008) —. 2008, ATEL, 1442
- Markwardt & Swank (2009) —. 2009, ATEL, 2108
- Markwardt & Swank (2010) —. 2010, ATEL, 2823
- Markwardt et al. (2009b) Markwardt, C. B., Swank, J. H., Krimm, H. A., Pereira, D., & Strohmayer, T. E. 2009b, ATEL, 2107
- Markwardt et al. (1999b) Markwardt, C. B., Swank, J. H., & Marshall, F. E. 1999b, IAU Circ., 7120
- Markwardt et al. (2001) Markwardt, C. B., Swank, J. H., & Smith, E. 2001, IAU Circ., 7707
- Markwardt et al. (2009c) Markwardt, C. B., Swank, J. H., Barthelmy, S. D., et al. 2009c, ATEL, 2258
- Marsh et al. (1994) Marsh, T., Robinson, E., & J.H., W. 1994, MNRAS, 266, 137
- Marshall et al. (1996) Marshall, F. E., Ebisawa, K., Remillard, R., & Valinia, A. 1996, IAU Circ., 6504
- Marshall et al. (1993) Marshall, F. E., Mushotzky, R. F., Petre, R., & Serlemitsos, P. J. 1993, ApJ, 419, 301
- Marshall & Smith (1997) Marshall, F. E., & Smith, D. M. 1997, IAU Circ., 6603
- Marshall et al. (1979) Marshall, F. E., Swank, J. H., Boldt, E. A., Holt, S. S., & Serlemitsos, P. J. 1979, ApJ, 230, L45
- Marshall et al. (2002) Marshall, H., Canizares, C., & Schulz, N. 2002, ApJ, 564, 941
- Marti et al. (2010) Marti, J., Luque-Escamilla, P. L., Sanchez-Sutil, J. R., et al. 2010, ApJ, 721, L126
- Marti et al. (1998) Marti, J., Mereghetti, S., Chaty, S., et al. 1998, A&A, 338, L95
- Marti et al. (2000a) Marti, J., Mirabel, I., Chaty, S., & Rodriguez, L. 2000a, A&A, 56, 943
- Marti et al. (2000b) —. 2000b, A&A, 363, 184
- Marti et al. (1997) Marti, J., Mirabel, I. F., Duc, P.-A., & Rodriguez, L. F. 1997, A&A, 323, 158
- Martí et al. (2002) Martí, J., Mirabel, I. F., Rodríguez, L. F., & Smith, I. A. 2002, A&A, 386, 571
- Marti et al. (2001) Marti, J., Paredes, J. M., & Peracaula, M. 2001, A&A, 375, 476
- Martin et al. (1995) Martin, A., Casares, J., Charles, P., van der Hooft, F., & van Paradijs, J. 1995, MNRAS, 274, L46
- Martin-Carrillo et al. (2015a) Martin-Carrillo, A., Murphy, D., Hanlon, L., et al. 2015a, ATEL, 7729
- Martin-Carrillo et al. (2015b) —. 2015b, ATEL, 7718
- Masetti et al. (1996) Masetti, N., Bianchini, A., Bonibaker, J., della Valle, M., & Vio, R. 1996, A&A, 314, 123
- Mason et al. (1985) Mason, K. O., Parmar, A. N., & White, N. E. 1985, MNRAS, 216, 1033
- Matilsky et al. (1972) Matilsky, T. A., Giacconi, R., Gursky, H., Kellogg, E. M., & Tananbaum, H. D. 1972, ApJ, 174, L53
- Matsuoka et al. (1986) Matsuoka, M., Takano, S., & Makishima, K. 1986, MNRAS, 222, 605
- Matsuoka et al. (2009) Matsuoka, M., Kawasaki, K., Ueno, S., et al. 2009, PASJ, 61, 999
- McClintock et al. (1978) McClintock, J., Canizares, C., & Petro, L. 1978, IAU Circ., 3251
- McClintock et al. (2009) McClintock, J., Remillard, R., Rupen, M., et al. 2009, ApJ, 698, 1398
- McClintock et al. (2001a) McClintock, J. E., Garcia, M. R., Caldwell, N., et al. 2001a, ApJ, 551, L147
- McClintock & Remillard (1986) McClintock, J. E., & Remillard, R. A. 1986, ApJ, 308, 110
- McClintock & Remillard (2006) McClintock, J. E., & Remillard, R. A. 2006, in Compact stellar X-ray sources, ed. W. H. G. Lewin & M. van der Klis (Cambridge University Press), 157–213
- McClintock et al. (2001b) McClintock, J. E., Haswell, C. A., Garcia, M. R., et al. 2001b, ApJ, 555, 477
- McCollough & Wilson (1999) McCollough, M., & Wilson, C. 1999, IAU Circ., 7282
- McCollough et al. (1999) McCollough, M. L., Robinson, C. R., Zhang, S. N., et al. 1999, ApJ, 517, 951
- McCrosky (1992) McCrosky, R. 1992, IAU Circ., 5597
- Meier (2005) Meier, D. 2005, Ap&SS, 300, 55
- Menou et al. (1999) Menou, K., Narayan, R., & J.P., L. 1999, ApJ, 513, 811
- Mereghetti et al. (1994) Mereghetti, S., Belloni, T., & Goldwurm, A. 1994, ApJ, 433, L21
- Mereghetti et al. (1997) Mereghetti, S., Cremonesi, D., Haardt, F., et al. 1997, ApJ, 476, 829
- Meyer et al. (2007) Meyer, F., Liu, B. F., & Meyer-Hofmeister, E. 2007, A&A, 463, 1
- Meyer & Meyer-Hofmeister (1981) Meyer, F., & Meyer-Hofmeister, E. 1981, A&A, 104, 10
- Meyer-Hofmeister (2004) Meyer-Hofmeister, E. 2004, A&A, 423, 321
- Meyer-Hofmeister & Meyer (2000) Meyer-Hofmeister, E., & Meyer, F. 2000, ApJ, 355, 1073
- Migliari et al. (2007) Migliari, S., Tomsick, J. A., Markoff, S., et al. 2007, ApJ, 670, 610
- Mihara et al. (2011) Mihara, T., Nakajima, M., Sugizaki, M., et al. 2011, PASJ, 63, 623
- Milgrom (1979) Milgrom, M. 1979, A&A, 76, L3
- Miller et al. (2012a) Miller, J. M., Beardmore, A., Kennea, J., et al. 2012a, ATEL, 4070
- Miller et al. (2001a) Miller, J. M., Fox, D. W., Di Matteo, T., et al. 2001a, ApJ, 546, 1055
- Miller et al. (2006a) Miller, J. M., Homan, J., & Miniutti, G. 2006a, ApJ, 652, 113
- Miller et al. (2006b) Miller, J. M., Raymond, J., Fabian, A., et al. 2006b, Nature, 441, 953
- Miller et al. (2008) Miller, J. M., Raymond, J., Reynolds, C. S., et al. 2008, ApJ, 680, 1359
- Miller et al. (2015a) Miller, J. M., Reynolds, M. T., & Kennea, J. 2015a, ATEL, 7612
- Miller et al. (2015b) —. 2015b, ATEL, 7614
- Miller et al. (2001b) Miller, J. M., Wijnands, R., Homan, J., et al. 2001b, ApJ, 563, 928
- Miller et al. (2004) Miller, J. M., Raymond, J., Fabian, A. C., et al. 2004, ApJ, 601, 450
- Miller et al. (2006c) Miller, J. M., Raymond, J., Homan, J., et al. 2006c, ApJ, 646, 394
- Miller et al. (2012b) Miller, J. M., Raymond, J., Kennea, J., et al. 2012b, ATEL, 4191
- Miller-Jones et al. (2011a) Miller-Jones, J., Tzioumis, A., Jonker, P., et al. 2011a, ATEL, 3364
- Miller-Jones et al. (2008) Miller-Jones, J. C. A., Gallo, E., Rupen, M. P., et al. 2008, MNRAS, 388, 1751
- Miller-Jones et al. (2009) Miller-Jones, J. C. A., Jonker, P. G., Dhawan, V., et al. 2009, ApJ, 706, L230
- Miller-Jones et al. (2011b) Miller-Jones, J. C. A., Madej, O. K., Jonker, P. G., et al. 2011b, ATEL, 3358
- Miller-Jones et al. (2005) Miller-Jones, J. C. A., McCormick, D. G., Fender, R. P., et al. 2005, MNRAS, 363, 867
- Miller-Jones & Sivakoff (2012) Miller-Jones, J. C. A., & Sivakoff, G. R. 2012, ATEL, 4394
- Miller-Jones et al. (2013a) Miller-Jones, J. C. A., Sivakoff, G. R., & Krimm, H. 2013a, ATEL, 5530
- Miller-Jones et al. (2011c) Miller-Jones, J. C. A., Sivakoff, G. R., Rupen, M., & Altamirano, D. 2011c, ATEL, 3628
- Miller-Jones et al. (2012) Miller-Jones, J. C. A., Sivakoff, G. R., Altamirano, D., et al. 2012, MNRAS, 421, 468
- Miller-Jones et al. (2013b) Miller-Jones, J. C. A., Sivakoff, G., Maccarone, T., et al. 2013b, ATEL, 5285
- Mineshige et al. (1992) Mineshige, S., Hirose, M., & Osaki, Y. 1992, PASJ, 44, L15
- Mineshige & Wheeler (1989) Mineshige, S., & Wheeler, J. 1989, ApJ, 343, 241
- Mioduszewski et al. (2001) Mioduszewski, A., Rupen, M., , et al. 2001, ApJ, 553, 766
- Mioduszewski & Rupen (2004) Mioduszewski, A., & Rupen, M. 2004, ApJ, 614, 432
- Mirabel et al. (1997) Mirabel, I. F., Bandyopadhyay, R., Charles, P. A., Shahbaz, T., & Rodríguez, L. F. 1997, ApJ, 477, L45
- Mirabel & Rodríguez (1994) Mirabel, I. F., & Rodríguez, L. F. 1994, Nature, 371, 46
- Mirabel & Rodriguez (1999) Mirabel, I. F., & Rodriguez, L. F. 1999, ARA&A, 37, 409
- Mirabel et al. (1992) Mirabel, I. F., Rodriguez, L. F., Cordier, B., Paul, J., & Lebrun, F. 1992, Nature, 358, 215
- Mirabel et al. (1993) Mirabel, I. F., Rodriguez, L. F., Marti, J., et al. 1993, IAU Circ., 5773
- Mitsuda et al. (1984) Mitsuda, K., Inoue, H., Koyama, K., et al. 1984, PASJ, 36, 741
- Miyamoto et al. (1991) Miyamoto, S., Kimura, K., & Kitamoto, S. 1991, ApJ, 383, 807
- Miyamoto & Kitamoto (1989) Miyamoto, S., & Kitamoto, S. 1989, Nature, 342, 773
- Miyamoto et al. (1993) Miyamoto, S., Kitamoto, S., Iga, S., et al. 1993, in Plasma Physics and Controlled Nuclear Fusion (ITC-4), ed. H. T. D. Guyenne & J. J. Hunt, 353–357
- Miyamoto et al. (1992) Miyamoto, S., Kitamoto, S., Iga, S., Negoro, H., & Terada, K. 1992, ApJ, 391, L21
- Mooley et al. (2015a) Mooley, K., Clarke, F., & Fender, R. 2015a, ATEL, 7714
- Mooley et al. (2015b) Mooley, K., Fender, R., Anderson, G., et al. 2015b, ATEL, 7658
- Morgan et al. (2005) Morgan, E., Swank, J., Markwardt, C., & Gehrels, N. 2005, ATEL, 550
- Morgan et al. (1997) Morgan, E. H., Remillard, R. A., & Greiner, J. 1997, ApJ, 482, 993
- Morihana et al. (2013) Morihana, K., Sugizaki, M., Nakahira, S., et al. 2013, PASJ, 65, L10
- Mostafa et al. (2013) Mostafa, R., Mendez, M., Hiemstra, B., et al. 2013, MNRAS, 431, 2341
- Motch et al. (1985) Motch, C., Ilovaisky, S. A., Chevalier, C., & Angebault, P. 1985, SSRv, 40, 219
- Motch et al. (1998) Motch, C., Guillout, P., Haberl, F., et al. 1998, A&AS, 132, 341
- Motta et al. (2015a) Motta, S., Beardmore, A., Kuulkers, E., & Altamirano, D. 2015a, ATEL, 7694
- Motta et al. (2015b) Motta, S., Beardmore, A., Oates, S., et al. 2015b, ATEL, 7665
- Motta et al. (2015c) —. 2015c, ATEL, 7666
- Motta et al. (2009) Motta, S., Belloni, T., & Homan, J. 2009, MNRAS, 400, 1603
- Motta et al. (2012) Motta, S., Homan, J., Muñoz Darias, T., et al. 2012, MNRAS, 427, 595
- Motta et al. (2010) Motta, S., Muñoz-Darias, T., & Belloni, T. 2010, MNRAS, 408, 1796
- Munar-Adrover et al. (2014) Munar-Adrover, P., Paredes, J. M., Ribo, M., et al. 2014, ApJ, 786, 11
- Muno et al. (2005a) Muno, M. P., Lu, J. R., Baganoff, F. K., et al. 2005a, ApJ, 633, 228
- Muno et al. (2005b) Muno, M. P., Pfahl, E., Baganoff, F. K., et al. 2005b, ApJ, 622, 113
- Muñoz-Darias et al. (2014) Muñoz-Darias, T., Fender, R. P., Motta, S. E., & Belloni, T. M. 2014, arXiv1407.1318
- Munoz-Darias et al. (2015a) Munoz-Darias, T., Mata Sanchez, D., & Casares, J. 2015a, ATEL, 7669
- Munoz-Darias et al. (2010) Munoz-Darias, T., Motta, S., Pawar, D., et al. 2010, MNRAS, 404, L94
- Munoz-Darias et al. (2011) Munoz-Darias, T., Motta, S., Stiele, H., & Belloni, T. 2011, ATEL, 3341
- Muñoz-Darias et al. (2011) Muñoz-Darias, T., Motta, S., Stiele, H., & Belloni, T. M. 2011, MNRAS, 415, 292
- Munoz-Darias et al. (2015b) Munoz-Darias, T., Sanchez, D. M., Casares, J., et al. 2015b, ATEL, 7659
- Muñoz-Darias et al. (2013) Muñoz-Darias, T., de Ugarte Postigo, A., Russell, D. M., et al. 2013, MNRAS, 432, 1133
- Murdin et al. (1977) Murdin, P., Griffiths, R. E., Pounds, K. A., Watson, M. G., & Longmore, A. J. 1977, MNRAS, 178, 27
- Nakahira et al. (2009) Nakahira, S., Negoro, H., Yamaoka, K., et al. 2009, ATEL, 2259
- Nakahira et al. (2010) Nakahira, S., Yamaoka, K., Sugizaki, M., et al. 2010, PASJ, 62, L27
- Nakahira et al. (2011) Nakahira, S., Negoro, H., Mihara, T., et al. 2011, ATEL, 3830
- Nakahira et al. (2012a) Nakahira, S., Koyama, S., Ueda, Y.a nd Yamaoka, K., et al. 2012a, PASJ, 64, 13
- Nakahira et al. (2012b) Nakahira, S., Ueda, Y., Takagi, T., et al. 2012b, ATEL, 4273
- Nakahira et al. (2013) Nakahira, S., Sugimoto, J., Serino, M., et al. 2013, ATEL, 5241
- Namiki et al. (2003) Namiki, M., Kawai, N., Kotani, T., & Makishima, K. 2003, PASJ, 55, 281
- Nandi et al. (2005) Nandi, A., Chakrabarti, S., Belloni, T., & Goldoni, P. 2005, MNRAS, 359, 629
- Narayan & Yi (1994) Narayan, R., & Yi, I. 1994, ApJ, 452, 710
- Natalucci et al. (2014) Natalucci, L., Tomsick, J., Bazzano, A., et al. 2014, ApJ, 780, 63
- Negoro et al. (2012) Negoro, H., Kawai, N., Yamaoka, K., & MAXI Team. 2012, in American Institute of Physics Conference Series, Vol. 1427, American Institute of Physics Conference Series, ed. R. Petre, K. Mitsuda, & L. Angelini, 314–315
- Negoro et al. (2010) Negoro, H., Yamaoka, K., Nakahira, S., et al. 2010, ATEL, 2873
- Negoro et al. (2011a) Negoro, H., Nakahira, S., Ueda, Y., et al. 2011a, ATEL, 3330
- Negoro et al. (2011b) Negoro, H., Nakajima, M., Nakahira, S., et al. 2011b, ATEL, 3611
- Negoro et al. (2012) Negoro, H., Kawai, N., Nakahira, S., et al. 2012, ATEL, 3842
- Negoro et al. (2015a) Negoro, H., Itoh, D., Ueno, S., et al. 2015a, ATEL, 7579
- Negoro et al. (2015b) Negoro, H., Matsumitsu, T., Mihara, T., et al. 2015b, ATEL, 7646
- Neil et al. (2007) Neil, E., Bailyn, C., & Cobb, B. 2007, AJ, 657, 409
- Neilsen (2013) Neilsen, J. 2013, AdSpR, 52, 732
- Neilsen et al. (2014) Neilsen, J., Coriat, M., Fender, R., et al. 2014, ApJ, 784, L5
- Neilsen & Homan (2012) Neilsen, J., & Homan, J. 2012, ApJ, 750, 27
- Neilsen & Lee (2009) Neilsen, J., & Lee, J. 2009, Nature, 458, 481
- Neilsen et al. (2015) Neilsen, J., Motta, S., Coriat, M., et al. 2015, ATEL, 7652
- Neilsen et al. (2011) Neilsen, J., Remillard, R., & Lee, J. 2011, ApJ, 737, 69
- Neilsen et al. (2008) Neilsen, J., Steeghs, S., & Vrtilek, S. 2008, MNRAS, 384, 849
- Ninkov et al. (1987) Ninkov, Z., Walker, G., & Yang, S. 1987, ApJ, 321, 425
- Nolan et al. (1983) Nolan, P. L., Gruber, D. E., Knight, F. K., et al. 1983, Nature, 293, 275
- Nolan & Matteson (1983) Nolan, P. L., & Matteson, J. L. 1983, ApJ, 265, 389
- Nowak et al. (2008) Nowak, M., Juett, A., Homan, J., et al. 2008, ApJ, 689, 1199
- Nowak & Wilms (1999) Nowak, M., & Wilms, J. 1999, ApJ, 522, 476
- Nowak et al. (2001) Nowak, M. A., Wilms, J., Heindl, W. A., et al. 2001, MNRAS, 320, 316
- Nowak et al. (2012) Nowak, M. A., Wilms, J., & Pottschmidt, K. 2012, ApJ, 744, 107
- Oates et al. (2015) Oates, S. R., Motta, S., Kuulkers, E., et al. 2015, ATEL, 7734
- O’Brien et al. (2003) O’Brien, K., Clarke, F., Fender, R., et al. 2003, ATEL, 117
- Ogilvie & Dubus (2001) Ogilvie, G., & Dubus, G. 2001, MNRAS, 320, 485
- Ogley et al. (1997) Ogley, R. N., Ash, T. D. C., & Fender, R. P. 1997, IAU Circ., 6726
- Okamura & Noguchi (1988) Okamura, S., & Noguchi, T. 1988, IAU Circ., 4589
- Oke (1977) Oke, J. B. 1977, ApJ, 217, 181
- Oosterbroek et al. (1998) Oosterbroek, T., Parmar, A. N., Kuulkers, E., et al. 1998, ApJ, 340, 431
- Oosterbroek et al. (1997) Oosterbroek, T., van der Klis, M., van Paradijs, J., et al. 1997, A&A, 321, 776
- Orlandini et al. (2000) Orlandini, M., Parmar, A. N., Frontera, F., et al. 2000, ApJ, 356, 163
- Orosz & Bailyn (1995) Orosz, J., & Bailyn, C. 1995, ApJ, 446, L59
- Orosz & Bailyn (1997) —. 1997, ApJ, 477, 876
- Orosz et al. (1998a) Orosz, J., Bailyn, C., & Jain, R. 1998a, IAU Circ., 7009
- Orosz et al. (1996) Orosz, J., Bailyn, C., McClintock, J., & Remillard, R. 1996, ApJ, 468, 380
- Orosz et al. (1998b) Orosz, J., Jain, R., Bailyn, C., McClintock, J., & Remillard, R. 1998b, ApJ, 499, 375
- Orosz et al. (2011a) Orosz, J., McClintock, J., Aufdenberg, J., et al. 2011a, ApJ, 742, 84
- Orosz et al. (2004) Orosz, J., McClintock, J., Remillard, R., & Corbel, S. 2004, ApJ, 616, 376
- Orosz et al. (2014) Orosz, J., Steiner, J., McClintock, J., et al. 2014, arXiv:1402.0085
- Orosz et al. (2011b) —. 2011b, ApJ, 730, 75
- Orosz et al. (2001) Orosz, J., Kuulkers, E., van der Klis, M., et al. 2001, ApJ, 555, 489
- Orosz et al. (2002) Orosz, J., Groot, P., van der Klis, M., et al. 2002, ApJ, 568, 845
- Orosz et al. (2009) Orosz, J., Steeghs, D., McClintock, J., et al. 2009, ApJ, 697, 573
- Orosz (2003) Orosz, J. A. 2003, in IAU Symposium, Vol. 212, A Massive Star Odyssey: From Main Sequence to Supernova, ed. K. van der Hucht, A. Herrero, & C. Esteban, 365
- Orosz et al. (2002) Orosz, J. A., Polisensky, E. J., Bailyn, C. D., et al. 2002, in Bulletin of the American Astronomical Society, Vol. 34, American Astronomical Society Meeting Abstracts, 1124
- Osaki (1974) Osaki, Y. 1974, PASJ, 26, 429
- Osaki (1985) —. 1985, A&A, 144, 369
- Osaki (1996) —. 1996, PASP, 108, 39
- Owen et al. (1976) Owen, F. N., Balonek, T. J., Dickey, J., Terzian, Y., & Gottesman, S. T. 1976, ApJ, 203, L15
- Ozawa et al. (2011) Ozawa, H., Suwa, F., Negoro, H., et al. 2011, ATEL, 3098
- Ozel et al. (2010) Ozel, F., Psaltis, D., Narayan, R., & McClintock, J. 2010, ApJ, 725, 1918
- Paciesas et al. (1992) Paciesas, W. S., Briggs, M. S., Harmon, B. A., Wilson, R. B., & Finger, M. H. 1992, IAU Circ., 5580
- Paczynski (1971) Paczynski, B. 1971, A&A, 9, 183
- Paczynski (1974) —. 1974, A&A, 34, 161
- Paizis et al. (2007a) Paizis, A., Nowak, M. A., Chaty, S., et al. 2007a, ApJ, 657, L109
- Paizis et al. (2007b) Paizis, A., Beckmann, V., Gotz, D., et al. 2007b, ATEL, 1248
- Paizis et al. (2009) Paizis, A., Ebisawa, K., Takahashi, H., et al. 2009, PASJ, 61, 107
- Palmer et al. (2005) Palmer, D. M., Barthelmey, S. D., Cummings, J. R., et al. 2005, ATEL, 546
- Pan et al. (1995) Pan, H., Skinner, G., Sunyaev, R., & Borozdn, K. 1995, MNRAS, 274, L15
- Pandey et al. (2005) Pandey, M. D., Durouchoux, P., Manchanda, R. K., et al. 2005, astro-ph/0509645
- Panopoulou et al. (2015) Panopoulou, G., Reig, P., & Blinov, D. 2015, ATEL, 7674
- Park et al. (2005) Park, S., Miller, J., McClintock, J., & Murray, S. 2005, ApJ, 618, L45
- Park et al. (2004) Park, S. Q., Miller, J. M., McClintock, J. E., et al. 2004, ApJ, 610, 378
- Parmar et al. (1993) Parmar, A., Angelini, L., Roche, P., & White, N. 1993, A&A, 279, 179
- Parmar et al. (1995) Parmar, A., Angelini, L., & White, N. 1995, ApJ, 452, L129
- Parmar et al. (1986) Parmar, A., Stella, L., & White, N. 1986, ApJ, 304, 664
- Parmar & White (1985) Parmar, A., & White, N. 1985, IAU Circ., 4051
- Parmar et al. (1997) Parmar, A., Williams, O., Kuulkers, E., Angelini, L., & White, N. 1997, A&A, 319, 855
- Paul et al. (1997) Paul, B., Agrawal, P. C., Rao, A. R., et al. 1997, A&A, 320, 37
- Paul et al. (1998) —. 1998, ApJ, 492, 63
- Paul et al. (1996) Paul, J., Bouchet, L., Churazov, E., & Sunyaev, R. 1996, IAU Circ., 6348
- Paul et al. (1991) Paul, J., Cordier, B., Goldwurm, A., et al. 1991, in American Institute of Physics Conference Series, Vol. 232, Gamma-Ray Line Astrophysics, ed. P. Durouchoux & N. Prantzos, 17–28
- Pawar et al. (2015) Pawar, D., Altamirano, D., Motta, S., et al. 2015, ATEL, 7009
- Pawar et al. (2013a) Pawar, D., Altamirano, D., Sivakoff, G., et al. 2013a, ATEL, 5252
- Pawar et al. (2013b) —. 2013b, ATEL, 5594
- Pederson (1983) Pederson, H. 1983, The Messenger, 34, 21
- Phinney (1982) Phinney, E. S. 1982, MNRAS, 198, 1109
- Plant et al. (2014) Plant, D. S., Fender, R. P., Ponti, G., Muñoz-Darias, T., & Coriat, M. 2014, MNRAS, 442, 1767
- Plotkin et al. (2013) Plotkin, R., Gallo, E., & Jonker, P. 2013, ApJ, 773, 59
- Plotkin et al. (2015) Plotkin, R., Gallo, E., Markoff, S., et al. 2015, MNRAS, 446, 4098
- Podsiadlowski (1991) Podsiadlowski, P. 1991, Nature, 350, 136
- Podsiadlowski et al. (2002) Podsiadlowski, P., Rappaport, S., & Pfahl, E. 2002, ApJ, 565, 1107
- Ponti et al. (2012) Ponti, G., Fender, R. P., Begelman, M. C., et al. 2012, MNRAS, 422, 11
- Pooley (2005) Pooley, G. 2005, ATEL, 385
- Pooley & Fender (1997) Pooley, G. G., & Fender, R. P. 1997, MNRAS, 222, 925
- Pooley & Waldram (2000) Pooley, G. G., & Waldram, E. 2000, IAU Circ., 7390
- Popper (1980) Popper, D. 1980, ARA&A, 18, 115
- Portegies Zwart et al. (2004) Portegies Zwart, S., Dewi, J., & Maccarone, T. 2004, MNRAS, 355, 413
- Pottschmidt et al. (2006) Pottschmidt, K., Chernyakova, M., Zdziarski, A. A., et al. 2006, A&A, 452, 285
- Pottschmidt et al. (2003) Pottschmidt, K., Wilms, J., Nowak, M. A., et al. 2003, A&A, 407, 1039
- Pounds (1974) Pounds, K. 1974, IAU Circ., 2729
- Prat et al. (2009) Prat, L., Rodriguez, J., Cadolle Bel, M., et al. 2009, ATEL, 2003
- Predehl et al. (2000) Predehl, P., Burwitz, V., Paerels, F., & Trümper, J. 2000, A&A, 357, 25
- Priedhorsky (1986) Priedhorsky, W. 1986, Ap&SS, 126, 89
- Priedhorsky et al. (1983) Priedhorsky, W. C., Terrell, J., & Holt, S. S. 1983, ApJ, 270, 233
- Pringle & Rees (1972) Pringle, J., & Rees, M. J. 1972, A&A, 21, 1
- Prosvetov & Grebenev (2015) Prosvetov, A., & Grebenev, S. 2015, ATEL, 7726
- Racusin et al. (2008) Racusin, J. L., Evans, P. A., Grupe, D., et al. 2008, GCN Circ., 8199
- Rau et al. (2011a) Rau, A., Greiner, J., Elliott, J., & E.F., O. 2011a, ATEL, 3365
- Rau et al. (2011b) Rau, A., Greiner, J., & Filgas, R. 2011b, ATEL, 3140
- Rau et al. (2012a) Rau, A., Greiner, J., & Schady, P. 2012a, ATEL, 4144
- Rau et al. (2012b) Rau, A., Knust, F., Kann, D., & Greiner, J. 2012b, ATEL, 4380
- Read et al. (2010a) Read, A., Saxton, R., & Esquej, P. 2010a, ATEL, 2607
- Read et al. (2010b) Read, A., Saxton, R., Esquej, P., & Evans, P. 2010b, ATEL, 2627
- Reich & Schlickeiser (1992) Reich, W., & Schlickeiser, R. 1992, A&A, 256, 408
- Reid et al. (2011) Reid, M., McClintock, J., Narayan, R., et al. 2011, ApJ, 742, 83
- Reid et al. (2014) Reid, M., McClintock, J., Steiner, J., et al. 2014, ApJ, 796, 2
- Reig et al. (2003) Reig, P., Belloni, T., & van der Klis, M. 2003, A&A, 412, 229
- Reis et al. (2012) Reis, R. C., Miller, J. M., Reynolds, M. T., Fabian, A. C., & Walton, D. J. 2012, ApJ, 751, 34
- Reis et al. (2013) Reis, R. C., Reynolds, M. T., Miller, J. M., et al. 2013, ApJ, 778, 155
- Reis et al. (2011) Reis, R. C., Miller, J. M., Fabian, A. C., et al. 2011, MNRAS, 410, 2497
- Remillard (1999) Remillard, R. 1999, Mem. S.A. It., 70, 881
- Remillard (2001) —. 2001, IAU Circ., 7707
- Remillard et al. (2005) Remillard, R., Garcia, M., Torres, M. A. P., Steeghs, D., & ASM Team at MIT, G. 2005, ATEL, 384
- Remillard & Levine (2003) Remillard, R., & Levine, A. 2003, ATEL, 144
- Remillard et al. (2003) Remillard, R., Levine, A., Morgan, E., Smith, E., & Swank, J. 2003, IAU Circ., 8050
- Remillard et al. (1997) Remillard, R., Levine, A., Swank, J., & Strohmayer, T. 1997, IAU Circ., 6710
- Remillard et al. (2006) Remillard, R., Levine, A. M., Morgan, E. H., Markwardt, C. B., & Swank, J. H. 2006, ATEL, 714
- Remillard & McClintock (2006) Remillard, R., & McClintock, J. 2006, ARA&A, 44, 49
- Remillard et al. (1992) Remillard, R., McClintock, J., & Bailyn, C. 1992, ApJ, 399, L145
- Remillard et al. (1999a) Remillard, R., McClintock, J., Sobczak, G., et al. 1999a, ApJ, 517, L127
- Remillard et al. (1999b) Remillard, R., Morgan, E., McClintock, J., Bailyn, C., & Orosz, J. 1999b, ApJ, 522, 397
- Remillard et al. (2000) Remillard, R., Morgan, E., Smith, D., & Smith, E. 2000, IAU Circ., 7389
- Remillard et al. (1996) Remillard, R., Orosz, J., McClintock, J., & Bailyn, C. 1996, ApJ, 459, 226
- Remillard & Smith (2002) Remillard, R., & Smith, D. 2002, ATEL, 88
- Remillard et al. (2002) Remillard, R., Sobczak, G., Muno, M., & McClintock, J. 2002, ApJ, 564, 962
- Remillard et al. (1998) Remillard, R., Levine, A., Wood, A., et al. 1998, IAU Circ., 6920
- Remillard (2009) Remillard, R. A. 2009, ATEL, 2265
- Revnivtsev (2003) Revnivtsev, M. 2003, A&A, 410
- Revnivtsev et al. (2000a) Revnivtsev, M., Borozdin, K., Priedhorsky, W., & Vikhlinin, A. 2000a, ApJ, 530, 955
- Revnivtsev et al. (1998a) Revnivtsev, M., Gilfanov, M., & Churazov, E. 1998a, A&A, 339, 483
- Revnivtsev et al. (2002) Revnivtsev, M., Gilfanov, M., Churazov, E., & Sunyaev, R. 2002, A&A, 391, 1013
- Revnivtsev et al. (2003) —. 2003, ATEL, 150
- Revnivtsev & Sunyaev (2001) Revnivtsev, M., & Sunyaev, R. 2001, IAU Circ., 7715
- Revnivtsev et al. (2000b) Revnivtsev, M., Sunyaev, R., & Borozdin, K. 2000b, A&A, 361, 37
- Revnivtsev et al. (1998b) Revnivtsev, M., Gilfanov, M., Churazov, E., et al. 1998b, A&A, 331, 557
- Revnivtsev et al. (2000c) Revnivtsev, M. G., Trudolyubov, S. P., & Borozdin, K. N. 2000c, MNRAS, 312, 151
- Reynolds et al. (1999) Reynolds, A. P., Parmar, A. N., Hakala, P. J., et al. 1999, A&AS, 134, 287
- Reynolds et al. (2007) Reynolds, M., Callanan, P., & Filippenko, A. 2007, MNRAS, 374, 657
- Reynolds et al. (2009) Reynolds, M., Callanan, P., & Nagayama, T. 2009, ATEL, 2125
- Rhoades & Ruffini (1974) Rhoades, C., & Ruffini, R. 1974, PhRvL, 32, 324
- Ricci et al. (1995) Ricci, D., Israel, G., & Stella, L. 1995, A&A, 299, 731
- Richer (1987) Richer, G. 1987, IBVS, 3362
- Ricketts et al. (1981) Ricketts, M. J., Hall, R., Page, C. G., Pounds, K. A., & Sims, M. R. 1981, Vistas in Astronomy, 25, 71
- Ricketts et al. (1975) Ricketts, M. J., Pounds, K. A., & Turner, M. J. L. 1975, Nature, 257, 658
- Roberts et al. (1996) Roberts, M. S. E., Michelson, P. F., Cominsky, L. R., et al. 1996, IAU Circ., 6302
- Robinson et al. (2002) Robinson, E., Ivans, I., & Welsh, W. 2002, ApJ, 565, 1169
- Robinson et al. (2012) Robinson, E. L., Bayless, A. J., Mason, P. A., & Robertson, P. 2012, in American Astronomical Society Meeting Abstracts, Vol. 219, American Astronomical Society Meeting Abstracts #219, #153.13
- Rodriguez et al. (2007) Rodriguez, J., Cadolle Bel, M., Tomsick, J., et al. 2007, ApJ, 655, L97
- Rodriguez et al. (2011a) Rodriguez, J., Corbel, S., Caballero, I., et al. 2011a, A&A, 533, L4
- Rodriguez et al. (2004) Rodriguez, J., Corbel, S., Kalemci, E., Tomsick, J. A., & Tagger, M. 2004, ApJ, 612, 1018
- Rodriguez et al. (2003) Rodriguez, J., Corbel, S., & Tomsick, J. A. 2003, ApJ, 595, 1032
- Rodriguez et al. (2011b) Rodriguez, J., Corbel, S., Tomsick, J. A., Paizis, A., & Kuulkers, E. 2011b, ATEL, 3168
- Rodriguez et al. (2015) Rodriguez, J., Ferrigno, C., Cadolle Bel, M., et al. 2015, ATEL, 7702
- Rodríguez & Mirabel (1997) Rodríguez, L., & Mirabel, I. 1997, ApJ, 474, L123
- Rodriguez et al. (1995) Rodriguez, L. F., Gerard, E., Mirabel, I. F., Gomez, Y., & Velazquez, A. 1995, ApJS, 101, 173
- Rodriguez & Mirabel (1998) Rodriguez, L. F., & Mirabel, I. F. 1998, A&A, 101, 173
- Rodriguez et al. (1992) Rodriguez, L. F., Mirabel, I. F., & Marti, J. 1992, ApJ, 401, L15
- Rojas et al. (2011) Rojas, A. F., Masetti, N., & Minniti, D. 2011, ATEL, 3372
- Roques et al. (2015) Roques, J., Jourdain, E., & Kuulkers, E. 2015, ATEL, 7693
- Rossi et al. (2004) Rossi, S., Homan, J., Miller, J. M., & Belloni, T. 2004, NuPhS, 132, 416
- Rothschild et al. (1998) Rothschild, R. E., Blanco, P. R., Gruber, D. E., et al. 1998, ApJ, 496, 538
- Rothstein et al. (2002) Rothstein, D. M., Eikenberry, S. S., Chatterjee, S., et al. 2002, ApJ, 580, L61
- Roy et al. (2011) Roy, J., Agrawal, P. C., Paul, B., & Duorah, K. 2011, MNRAS, 412, 1011
- Rubin et al. (1998) Rubin, B. C., Harmon, B. A., Paciesas, W. S., et al. 1998, ApJ, 492, L67
- Rupen et al. (2003a) Rupen, M., Dhawan, V., & Mioduszewski, A. 2003a, ATEL, 210
- Rupen et al. (2005a) —. 2005a, ATEL, 419
- Rupen et al. (2005b) —. 2005b, ATEL, 489
- Rupen et al. (2006) —. 2006, ATEL, 717
- Rupen et al. (2003b) Rupen, M., Mioduszewski, A., & Dhawan, V. 2003b, ATEL, 152
- Rupen et al. (2003c) —. 2003c, ATEL, 172
- Rupen et al. (2005c) —. 2005c, ATEL, 434
- Rupen et al. (2003d) Rupen, M. P., Brocksopp, C., Mioduszewski, A. J., et al. 2003d, IAU Circ., 8054
- Rupen et al. (2002) Rupen, M. P., Dhawan, V., & Mioduszewski, A. J. 2002, IAU Circ., 7874
- Rupen et al. (2005d) —. 2005d, ATEL, 589
- Rupen et al. (1998) Rupen, M. P., Hjellming, R. M., & Mioduszewski, A. J. 1998, IAU Circ., 6938
- Rupen et al. (2003e) Rupen, M. P., Mioduszewski, A. J., & Dhawan, V. 2003e, ATEL, 137
- Rupen et al. (2004) —. 2004, BAAS, 36, 937
- Rupen et al. (2005e) —. 2005e, ATEL, 490
- Rupin et al. (2006) Rupin, M., Dhawan, V., & Mioduszewski, A. 2006, ATEL, 721
- Rushton et al. (2015) Rushton, A., Rumsey, C., Motta, S., et al. 2015, ATEL, 7338
- Rushton et al. (2012) Rushton, A., Miller-Jones, J. C. A., Campana, R., et al. 2012, MNRAS, 419, 3194
- Russell et al. (2010a) Russell, D., Munoz-Darias, T., Lewis, F., & Soleri, P. 2010a, ATEL, 2775
- Russell et al. (2006) Russell, D. M., Fender, R. P., Hynes, R. I., et al. 2006, MNRAS, 371, 1334
- Russell & Lewis (2015) Russell, D. M., & Lewis, F. 2015, ATEL, 7637
- Russell et al. (2011a) Russell, D. M., Lewis, F., Roche, P., & Altamirano, D. 2011a, ATEL, 3359
- Russell et al. (2011b) Russell, D. M., Miller-Jones, J. C. A., Maccarone, T. J., et al. 2011b, ApJ, 739, L19
- Russell et al. (2010b) Russell, D. M., Yang, Y. J., Patruno, A., et al. 2010b, ATEL, 2827
- Russell et al. (2012) Russell, D. M., Markoff, S., Casella, P., et al. 2012, MNRAS, 429, 815
- Russell et al. (2013) Russell, D. M., Russell, T. D., Miller-Jones, J. C. A., et al. 2013, ApJ, 768, L35
- Russell et al. (2014a) Russell, T. D., Soria, R., Miller-Jones, J. C. A., et al. 2014a, MNRAS, 439, 1390
- Russell et al. (2014b) Russell, T. D., Soria, R., Motch, C., et al. 2014b, MNRAS, 439, 1381
- Saito et al. (2006) Saito, K., Yamaoka, K., Fukuyama, M., et al. 2006, in VI Microquasar Workshop: Microquasars and Beyond, 93
- Sala et al. (2007) Sala, G., Greiner, J., Ajello, M., Bottacini, E., & Haberl, F. 2007, A&A, 473, 561
- Sala et al. (2008) Sala, G., Greiner, J., Ajello, M., & Primak, N. 2008, A&A, 489, 1239
- Samus et al. (1999) Samus, N. N., Hazen, M., Williams, D., et al. 1999, IAU Circ., 7277
- Sanchez-Fernandez et al. (2000) Sanchez-Fernandez, C., Zurita, C., Casares, J., Shahbaz, T., & Castro-Tirado, A. 2000, IAU Circ., 7506
- Sanchez-Fernandez et al. (2009) Sanchez-Fernandez, C., Kuulkers, E., Bird, A. J., et al. 2009, ATEL, 2194
- Sanna et al. (2015) Sanna, A., Altamirano, D., Rushton, A., & Jonker, P. 2015, ATEL, 7278
- Sanwal et al. (1996) Sanwal, D., Robinson, E. L., Zhang, E., et al. 1996, ApJ, 460, 437
- Sato et al. (2012) Sato, R., Serino, M., Nakahira, S., et al. 2012, ATEL, 4024
- Sbarufatti et al. (2013) Sbarufatti, B., Kennea, J. A., Stroh, M. C., et al. 2013, ATEL, 4782
- Scarpaci & Maitra (2015) Scarpaci, J., & Maitra, D. 2015, ATEL, 7721
- Scarpaci et al. (2015) Scarpaci, J., Maitra, D., Hynes, R., & Markoff, S. 2015, ATEL, 7737
- Segreto et al. (2015) Segreto, A., Del Santo, M., D’Ai’, A., et al. 2015, ATEL, 7755
- Seward et al. (1986) Seward, F. D., Page, C. G., Turner, M. J. L., & Pounds, K. A. 1986, MNRAS, 175, 39
- Sguera et al. (2007) Sguera, V., Bazzano, A., Bird, A. J., et al. 2007, A&A, 468, L21
- Sguera et al. (2011) Sguera, V., Drave, S. P., Bird, A. J., et al. 2011, MNRAS, 417, 573
- Shahbaz et al. (1998) Shahbaz, T., Charles, P., & King, A. 1998, MNRAS, 301, 382
- Shahbaz et al. (2001) Shahbaz, T., Fender, R., & Charles, P. 2001, A&A, 376, L17
- Shahbaz et al. (1994a) Shahbaz, T., Naylor, T., & Charles, P. A. 1994a, MNRAS, 268, 756
- Shahbaz et al. (1994b) Shahbaz, T., Ringwald, F. A., Bunn, J. C., et al. 1994b, MNRAS, 271, L10
- Shahbaz et al. (2013) Shahbaz, T., Russell, D. M., Zurita, C., et al. 2013, MNRAS, 434, 2696
- Shahbaz et al. (1996a) Shahbaz, T., Smale, A. P., Naylor, T., et al. 1996a, MNRAS, 282, 1437
- Shahbaz et al. (1999) Shahbaz, T., van der Hooft, F., Casares, J., Charles, P. A., & van Paradijs, J. 1999, MNRAS, 306, 89
- Shahbaz et al. (1996b) Shahbaz, T., van der Hooft, F., Charles, P. A., Casares, J., & van Paradijs, J. 1996b, MNRAS, 282, L47
- Shakura & Sunyaev (1973) Shakura, N., & Sunyaev, R. A. 1973, A&A, 24, 337
- Shaposhnikov (2010) Shaposhnikov, N. 2010, ATEL, 2391
- Shaposhnikov et al. (2012a) Shaposhnikov, N., Jahoda, K., Markwardt, C., Swank, J., & Strohmayer, T. 2012a, ApJ, 757, 159
- Shaposhnikov et al. (2010) Shaposhnikov, N., Markwardt, C., Swank, J., & Krimm, H. 2010, ApJ, 723, 1817
- Shaposhnikov et al. (2009) Shaposhnikov, N., Markwardt, C. B., & Swank, J. H. 2009, ATEL, 2269
- Shaposhnikov et al. (2012b) Shaposhnikov, N., Swank, J., Markwardt, C., & Krimm, H. 2012b, in The First Year of MAXI: Monitoring variable X-ray sources - 4th International MAXI Workshop, ed. T. Mihara & M. Serino, 51
- Shaposhnikov et al. (2007) Shaposhnikov, N., Swank, J., Shrader, C. R., et al. 2007, ApJ, 655, 434
- Shaposhnikov & Titarchuk (2009) Shaposhnikov, N., & Titarchuk, L. 2009, ApJ, 699, 453
- Shaw et al. (2015) Shaw, A., Knigge, C. nad Meisenheimer, K., & Ibanez, J. 2015, ATEL, 7738
- Shaw et al. (2013) Shaw, A. W., Charles, P. A., Bird, A. J., et al. 2013, MNRAS, 433, 740
- Shaw et al. (2008) Shaw, S., Kuulkers, E., Markwardt, C. B., & Galis, R. 2008, ATEL, 1711
- Shidatsu et al. (2012) Shidatsu, M., Negoro, H., Nakahira, S., et al. 2012, ATEL, 4419
- Shidatsu et al. (2013) Shidatsu, M., Ueda, Y., Nakahira, S., et al. 2013, ApJ, 779, 26
- Shidatsu et al. (2014) Shidatsu, M., Ueda, Y., Yamada, S., et al. 2014, ApJ, 789, 100
- Shrader et al. (1994) Shrader, C. R., Wagner, R., Hjellming, R. M., Han, X. H., & Starrfield, S. G. 1994, ApJ, 434, 698
- Shrader et al. (1997) Shrader, C. R., Wagner, R. M., Charles, P. A., Harlaftis, E. T., & Naylor, T. 1997, ApJ, 487, 858
- Sidoli et al. (1999) Sidoli, L., Mereghetti, S., Israel, G. L., et al. 1999, ApJ, 525, 215
- Sidoli et al. (2011) Sidoli, L., Paizis, A., Mereghetti, S., Gotz, D., & Del Santo, M. 2011, MNRAS, 415, 2373
- Simon et al. (2006) Simon, V., Bartolini, C., Piccioni, A., & Guarenieri, A. 2006, MNRAS, 369, 355
- Singh et al. (1994) Singh, K., Apparao, K., & Kraft, R. 1994, ApJ, 421, 753
- Sivakoff et al. (2011) Sivakoff, G., Miller-Jones, J., & Krimm, H. 2011, ATEL, 3147
- Sivakoff et al. (2015a) Sivakoff, G., Tetarenko, A., & Miller-Jones, J. 2015a, ATEL, 7671
- Sivakoff et al. (2015b) Sivakoff, G. R., Bahramian, A., Altamirano, D., Miller-Jones, J. C. A., & Russell, D. 2015b, ATEL, 7763
- Sivakoff et al. (2015c) Sivakoff, G. R., Bahramian, A., Heinke, C., et al. 2015c, ATEL, 7788
- Skinner et al. (1990) Skinner, G. K., Foster, A. J., Willmore, A. P., & Eyles, C. J. 1990, MNRAS, 243, 72
- Skinner et al. (1987) Skinner, G. K., Willmore, A. P., Eyles, C. J., Bertram, D., & Church, M. J. 1987, Nature, 330, 544
- Skinner et al. (1991) Skinner, G. K., Pan, H. C., Maisack, M., et al. 1991, A&A, 252, 172
- Smale & Boyd (2012) Smale, A., & Boyd, P. 2012, ApJ, 756, 146
- Smith et al. (1997) Smith, D., Heindl, W., Swank, J., et al. 1997, ApJ, 489, L51
- Smith et al. (1998a) Smith, D., Remillard, R., Swank, J., Takeshima, T., & Smith, E. 1998a, IAU Circ., 6855
- Smith (1998) Smith, D. A. 1998, IAU Circ., 7008
- Smith et al. (1999a) Smith, D. A., Levine, A., & Morgan, E. 1999a, IAU Circ., 7523
- Smith et al. (1999b) —. 1999b, ATEL, 143
- Smith et al. (1998b) Smith, D. A., Levine, A., & Wood, A. 1998b, IAU Circ., 6932
- Smith et al. (2001) Smith, D. M., Heindl, W. A., Markwardt, C. B., & Swank, J. H. 2001, ApJ, 554, 41
- Smith et al. (2002a) Smith, D. M., Heindl, W. A., & Swank, J. H. 2002a, ApJ, 578, L129
- Smith et al. (2002b) —. 2002b, ApJ, 569, 362
- Smith et al. (1996) Smith, D. M., Leventhal, M., Cavallo, R., et al. 1996, ApJ, 458, 576
- Sobczak et al. (1999) Sobczak, G., McClintock, J., Remillard, R., Bailyn, C., & Orosz, J. 1999, ApJ, 520, 776
- Sobczak et al. (2000) Sobczak, G., McClintock, J., Remillard, R., et al. 2000, ApJ, 544, 993
- Soldi et al. (2006) Soldi, S., Walter, R., Eckert, D., et al. 2006, ATEL, 885
- Soleri et al. (2012) Soleri, P., Muñoz-Darias, T., Motta, S., et al. 2012, MNRAS, 429, 1244
- Sonka et al. (2015) Sonka, A., Tudose, V., Nedelcu, A., & Popescu, M. 2015, ATEL, 7730
- Sood & Cambell-Wilson (1994) Sood, R., & Cambell-Wilson, D. 1994, IAU Circ., 6006
- Soria et al. (1997) Soria, R., Bessell, M., & Wood, P. 1997, IAU Circ., 6732
- Sriram et al. (2013a) Sriram, K., Rao, A. R., & Choi, C. S. 2013a, A&A, 541, 6
- Sriram et al. (2013b) —. 2013b, A&A, 775, 28
- Starling et al. (2008) Starling, R., Evans, P., & Wijnands, R. 2008, ATEL, 1704
- Steeghs et al. (2003) Steeghs, D., Miller, J., Kaplan, D., & Rupen, M. 2003, ATEL, 146
- Steeghs et al. (2005a) Steeghs, D., Torres, M. A. P., Jonker, P. G., et al. 2005a, ATEL, 494
- Steeghs et al. (2005b) Steeghs, D., Torres, M. A. P., Pych, W., & Thompson, I. 2005b, ATEL, 585
- Steiner et al. (2014) Steiner, J., McClintock, J., Orosz, J., et al. 2014, ApJ, 783, 101
- Stephen et al. (2005) Stephen, J. B., Bassani, L., Molina, M., et al. 2005, A&A, 432, L49
- Stephenson & Sanduleak (1977) Stephenson, C. B., & Sanduleak, N. 1977, ApJS, 33, 459
- Stewart et al. (1987) Stewart, G. C., Watson, M. G., Matsuoka, M., et al. 1987, MNRAS, 228, 293
- Stiele et al. (2011) Stiele, H., Munoz-Darias, T., Motta, S., & Belloni, T. 2011, arXiv:1103.4312
- Stiele et al. (2012) Stiele, H., Munoz-Darias, T., Motta, S., & Belloni, T. M. 2012, MNRAS, 422, 679
- Still et al. (2005a) Still, M., Hehrels, N., Steeghs, D., et al. 2005a, ATEL, 588
- Still et al. (2005b) Still, M., Roming, P., Brocksopp, C., & Markwardt, C. 2005b, ATEL, 553
- Stirling et al. (2001) Stirling, A. M., Spencer, R. E., de la Force, C. J., et al. 2001, MNRAS, 327, 1273
- Strohmayer & Smith (2011) Strohmayer, T. E., & Smith, E. A. 2011, ATEL, 3618
- Stubbings (1999) Stubbings, R. 1999, IAU Circ., 7523
- Stubbings & Pearce (1999) Stubbings, R., & Pearce, A. 1999, IAU Circ., 7253
- Sturner & Shrader (2005) Sturner, S. J., & Shrader, C. R. 2005, ApJ, 625, 923
- Sugizaki et al. (2011) Sugizaki, M., Mihara, T., Serino, M., et al. 2011, PASJ, 63, S635
- Sunyaev & Revnivtsev (2000) Sunyaev, R., & Revnivtsev, M. 2000, A&A, 358, 617
- Sunyaev et al. (1991a) Sunyaev, R., Churazov, E., Gilfanov, M., et al. 1991a, ApJ, 247, L29
- Sunyaev et al. (1991b) —. 1991b, ApJ, 383, L49
- Sunyaev et al. (1991c) Sunyaev, R., Gilfanov, M., Churazov, E., et al. 1991c, SvAL, 17, 50
- Sunyaev et al. (1992) Sunyaev, R., Churazov, E., Gilfanov, M., et al. 1992, ApJ, 389, L75
- Sunyaev et al. (1997) Sunyaev, R., Churazov, E., Revnivtsev, M., et al. 1997, IAU Circ., 6599
- Sunyaev & Truemper (1979a) Sunyaev, R. A., & Truemper, J. 1979a, Nature, 279, 506
- Sunyaev & Truemper (1979b) —. 1979b, Nature, 279, 506
- Sunyaev et al. (1994) Sunyaev, R. A., Borozdin, K. N., Aleksandrovich, N. L., et al. 1994, AstL, 20, 777
- Suwa et al. (2012) Suwa, F., Negoro, H., Nakahira, S., et al. 2012, ATEL, 4035
- Suzuki et al. (2015) Suzuki, K., Fukushima, K., Negoro, H., et al. 2015, ATEL, 7233
- Swank (1997) Swank, J. 1997, in Nuclear Physics B Proceedings Supplements, ed. L. Scarsi, H. Bradt, P. Giommi, & F. Fiore (Rome, Italy: astro–ph/9802188)
- Swank (2004) Swank, J. 2004, ATEL, 295
- Swank & Markwardt (2001) Swank, J., & Markwardt, C. 2001, in Astronomical Society of the Pacific Conference Series, Vol. 251, New Century of X-ray Astronomy, ed. H. Inoue & H. Kunieda, 94
- Swank & Markwardt (2005) Swank, J., & Markwardt, C. 2005, ATEL, 390
- Swank et al. (2002) Swank, J., Smith, E., & Markwardt, C. 2002, IAU Circ., 7792
- Szostek & Zdziarski (2008) Szostek, A., & Zdziarski, A. 2008, MNRAS, 386, 593
- Szostek et al. (2008) Szostek, A., Zdziarski, A., & McCollough, M. L. 2008, MNRAS, 388, 1001
- Tachibana et al. (2014a) Tachibana, Y., Takagi, T., Serino, M., et al. 2014a, ATEL, 5803
- Tachibana et al. (2014b) —. 2014b, ATEL, 5803
- Takagi et al. (2015) Takagi, T., Serino, M., Nakahira, S., et al. 2015, ATEL, 6991
- Takeshima et al. (1996) Takeshima, T., Cannizzo, J. K., Corbet, R., & Marshall, F. E. 1996, IAU Circ., 6390
- Tanaka & Lewin (1995) Tanaka, Y., & Lewin, W. 1995, in X-Ray Binaries, ed. W. Lewin, J. van Paradijs, & P. van den Heuvel (Cambridge University Press), 126
- Tanaka & Shibazaki (1996) Tanaka, Y., & Shibazaki, N. 1996, ARA&A, 34, 607
- Tanaka et al. (2014) Tanaka, Y., Yamaoka, K., Yoshida, A., & Sakamoto, T. 2014, in Suzaku-MAXI 2014: Expanding the Frontiers of the X-ray Universe, ed. M. Ishida, R. Petre, & K. Mitsuda, 246
- Tananbaum et al. (1972) Tananbaum, H., Gursky, H., Kellogg, E., & Giacconi, R. 1972, ApJ, 177, L5
- Tavani et al. (1996) Tavani, M., Fruchter, A., Zhang, S. N., et al. 1996, ApJ, 473, L103
- Tendulkar et al. (2014) Tendulkar, S., Bachetti, M., Tomsick, J., Chenevez, J., & Harrison, F. 2014, ATEL, 6574
- Terndrup et al. (2015) Terndrup, D., Wagner, R., & Starrfield, S. 2015, ATEL, 7725
- Tetarenko et al. (2015a) Tetarenko, A., Sivakoff, G., Gurwell, M., et al. 2015a, ATEL, 7661
- Tetarenko et al. (2015b) Tetarenko, A., Sivakoff, G., Young, K., Wouterloot, J., & Miller-Jones, J. 2015b, ATEL, 7708
- Tetarenko et al. (2015c) Tetarenko, A., Sivakoff, G. R., Bremer, M., et al. 2015c, ATEL, 7740
- Tetarenko et al. (2015d) Tetarenko, A. J., Sivakoff, G. R., Miller-Jones, J. C. A., et al. 2015d, ApJ, 805, 30
- Thorne & Price (1975) Thorne, K., & Price, R. 1975, ApJ, 195, 101
- Thorstensen (1987) Thorstensen, J. 1987, ApJ, 312, 739
- Tigelaar et al. (2004) Tigelaar, S. P., Fender, R. P., Tilanus, R. P. J., Gallo, E., & Pooley, G. G. 2004, MNRAS, 352, 1015
- Tingay et al. (1995) Tingay, S. J., Jauncey, D. L., Preston, R. A., et al. 1995, Nature, 374, 141
- Tomida et al. (2009) Tomida, H., Negoro, H., Mihara, T., et al. 2009, ATEL, 2363
- Tomsick (2005) Tomsick, J. 2005, ATEL, 675
- Tomsick et al. (2006) Tomsick, J., Chaty, S., Rodriguez, J., Walter, R., & Kaaret, P. 2006, ATEL, 959
- Tomsick et al. (2003) Tomsick, J., Corbel, S., Fender, R., et al. 2003, ApJ, 582, 933
- Tomsick et al. (2005) Tomsick, J., Corbel, S., Goldwurm, A., & Kaaret, P. 2005, ApJ, 630, 413
- Tomsick et al. (2001a) Tomsick, J., Corbel, S., & Kaaret, P. 2001a, ApJ, 563, 229
- Tomsick & Kaaret (2000) Tomsick, J., & Kaaret, P. 2000, ApJ, 537, 448
- Tomsick et al. (1999) Tomsick, J., Kaaret, P., Kroeger, R., & Remillard, R. 1999, ApJ, 512, 892
- Tomsick et al. (2004) Tomsick, J., Kalemci, E., & Kaaret, P. 2004, ApJ, 601, 439
- Tomsick et al. (2012) Tomsick, J. A., Del Santo, M., & Belloni, T. 2012, ATEL, 4393
- Tomsick et al. (2001b) Tomsick, J. A., Smith, E., Swank, J., Wijnands, R., & Homan, J. 2001b, IAU Circ., 7575
- Toor & Seward (1974) Toor, A., & Seward, F. D. 1974, AJ, 79, 995
- Torres et al. (2009a) Torres, M. A. P., Jonker, P. G., Steeghs, D., et al. 2009a, ATEL, 1958
- Torres et al. (2011) Torres, M. A. P., Jonker, P. G., Steeghs, D., & Mulchaey, J. 2011, ATEL, 3150
- Torres et al. (2009b) Torres, M. A. P., Jonker, P. G., Steeghs, D., et al. 2009b, ATEL, 2263
- Torres et al. (2008a) Torres, M. A. P., Steeghs, D., Jonker, P. G., Greene, J. E., & Hainline, K. N. 2008a, ATEL, 1720
- Torres et al. (2006) Torres, M. A. P., Steeghs, D., Jonker, P. G., et al. 2006, ATEL, 733
- Torres et al. (2009c) —. 2009c, ATEL, 2190
- Torres et al. (2010) Torres, M. A. P., Steeghs, D., Jonker, P. G., & Ross, N. R. 2010, ATEL, 2870
- Torres et al. (2009d) Torres, M. A. P., Steeghs, D., Jonker, P. G., Thompson, I., & Soderberg, A. M. 2009d, ATEL, 2269
- Torres et al. (2008b) Torres, M. A. P., Steeghs, D., Kennea, J., Homan, J., & Miller, J. 2008b, ATEL, 1696
- Torres et al. (2005) Torres, M. A. P., Steeghs, D., Blake, C., et al. 2005, ATEL, 566
- Treves et al. (1988) Treves, A., Belloni, T., Chiappetti, L., et al. 1988, ApJ, 325, 119
- Trimble et al. (1973) Trimble, V., Rose, W., & Weber, J. 1973, ApJ, 162, 1P
- Trudolyubov et al. (2001) Trudolyubov, S., Borozdin, K., & Priedhorsky, W. 2001, MNRAS, 322, 309
- Trudolyubov et al. (1996) Trudolyubov, S., Gilfanov, M. R., Churazov, E. M., et al. 1996, AstL, 22, 664
- Trudolyubov et al. (1997) Trudolyubov, S., Churazov, E., Gilfanov, M., et al. 1997, A&A, 342, 496
- Trudolyubov et al. (1998) Trudolyubov, S., Gilfanov, M., Churazov, E., et al. 1998, A&A, 334, 895
- Trudolyubov et al. (1999) Trudolyubov, S., Churazov, E., Gilfanov, M., et al. 1999, A&A, 342, 496
- Trushkin et al. (2015a) Trushkin, S., Nizhelskij, N., & Tsybulev, P. 2015a, ATEL, 7716
- Trushkin et al. (2015b) Trushkin, S., Nizhelskij, N., & Tybulev, P. 2015b, ATEL, 7667
- Trushkin et al. (2011) Trushkin, S. A., Nizhelskij, N. A., & Zhekanis, G. V. 2011, ATEL, 3656
- Truss et al. (2002) Truss, M. R., Wynn, G. A., Murray, J. R., & King, A. R. 2002, MNRAS, 337, 1329
- Tsubono et al. (2015a) Tsubono, K., Aoki, T., Asuma, K., et al. 2015a, ATEL, 7701
- Tsubono et al. (2015b) —. 2015b, ATEL, 7733
- Tsunemi et al. (1989) Tsunemi, H., Kitamoto, S., Okamura, S., & Roussel-Dupre, D. 1989, ApJ, 337, L81
- Tudose et al. (2015) Tudose, V., Paragi, Z., Miller-Jones, J. C. A., et al. 2015, ATEL, 7742
- Turler et al. (2005a) Turler, M., Cadolle Bel, M., Diehl, R., et al. 2005a, ATEL, 624
- Turler et al. (2005b) Turler, M., Paltani, S., & Mowlavi, N. 2005b, ATEL, 631
- Turler et al. (2010) Turler, M., Kuulkers, C., Ferrigno, E., et al. 2010, ATEL, 2825
- Ubertini et al. (1991a) Ubertini, P., Bazzano, A., La Padula, C., manchanda, R., & Polcaro, V. 1991a, ApJ, 383, 262
- Ubertini et al. (1991b) Ubertini, P., Bazzano, A., Perotti, F., et al. 1991b, ApJ, 366, 544
- Ubertini et al. (2003) Ubertini, P., Lebrun, F., Di Cocco, G., et al. 2003, A&A, 411, 131
- Ueda et al. (1997) Ueda, Y., Dotani, T., Uno, S., et al. 1997, IAU Circ., 6627
- Uemura et al. (2014) Uemura, M., Moritani, Y., Itoh, R., et al. 2014, ATEL, 5836
- Uemura et al. (2000a) Uemura, M., Kato, T., Yamaoka, H., et al. 2000a, IAU Circ., 7390
- Uemura et al. (2000b) Uemura, M., Kato, T., Matsumoto, K., et al. 2000b, PASJ, 52, L15
- Uemura et al. (2004) Uemura, M., Kato, T., Ishioka, R., et al. 2004, PASJ, 56, 61
- Usui et al. (2012) Usui, R., Nakahira, S., Tomida, H., et al. 2012, ATEL, 4140
- Vadawale et al. (2003) Vadawale, S. V., Rao, A. R., Naik, S., et al. 2003, ApJ, 597, 1023
- van der Hooft et al. (1996) van der Hooft, F., Kouveliotou, C., van Paradijs, J., et al. 1996, ApJ, 458, L75
- van der Hooft et al. (1999a) —. 1999a, ApJ, 513, 477
- van der Hooft et al. (1999b) —. 1999b, ApJ, 519, 332
- van der Horst et al. (2010) van der Horst, A. J., Granot, J., Paragi, Z., et al. 2010, ATEL, 2874
- van der Klis (2006) van der Klis, M. 2006, in Compact Stellar X-ray Sources, ed. W. Lewin & M. van der Klis (Cambridge University Press)
- van Kerkwijk (1993) van Kerkwijk, M. H. 1993, A&A, 276, 9
- van Kerkwijk et al. (1996) van Kerkwijk, M. H., Geballe, T. R., King, D. L., van der Klis, M., & van Paradijs, J. 1996, A&A, 314, 521
- van Leeuwen (2007) van Leeuwen, F. 2007, A&A, 474, 653
- van Paradijs & McClintock (1995) van Paradijs, J., & McClintock, J. 1995, in X-Ray Binaries, ed. W. Lewin, J. van Paradijs, & P. van den Heuvel (Cambridge University Press), 58
- van Paradijs & Verbunt (1984) van Paradijs, J., & Verbunt, F. 1984, in American Institute of Physics Conference Series, Vol. 115, American Institute of Physics Conference Series, ed. S. E. Woosley, 49–62
- Vargas et al. (1996) Vargas, M., Goldwurm, A., Paul, J., et al. 1996, A&A, 313, 828
- Vargas et al. (1997) Vargas, M., Goldwurm, A., Laurent, P., et al. 1997, A&A, 476, 23
- Vasiliev et al. (2000) Vasiliev, L., Trudolyubov, S., & Revnivtsev, M. 2000, A&A, 362, L53
- Verbunt & Zwaan (1981) Verbunt, F., & Zwaan, C. 1981, A&A, 100, L7
- Vermeulen et al. (1987) Vermeulen, R. C., Icke, V., Schilizzi, R. T., Fejes, I., & Spencer, R. E. 1987, Nature, 328, 309
- Vermeulen et al. (1993) Vermeulen, R. C., Schilizzi, R. T., Spencer, R. E., Romney, J., & Feyes, I. 1993, A&A, 270, 177
- Vikhlinin et al. (1994) Vikhlinin, A., Churazov, E., Gilfanov, M., et al. 1994, ApJ, 424, 395
- Vilhu et al. (2009) Vilhu, O., Hakala, P., Hannikainen, D. C., McCollough, M., & Koljonen, K. 2009, A&A, 501, 677
- Voges et al. (1999) Voges, W., Aschenbach, B., Boller, T., et al. 1999, A&A, 349, 389
- Vovk et al. (2012) Vovk, I., Ferrigno, C., Drave, E., et al. 2012, ATEL, 4381
- Wachter & Smale (1998) Wachter, S., & Smale, A. 1998, ApJ, 496, L21
- Wagner et al. (2001) Wagner, R., Foltz, C. B., Shahbaz, T., et al. 2001, ApJ, 556, 42
- Wagner & Starfield (2002) Wagner, R., & Starfield, S. 2002, ATEL, 86
- Wagner et al. (2015) Wagner, R., Woodward, C., & Starrfield, S. 2015, ATEL, 7655
- Wagner et al. (1992) Wagner, R. M., Kreidl, T. J., Howell, S. B., & Starrfield, S. G. 1992, ApJ, 401, L97
- Wagner et al. (1989) Wagner, R. M., Starrfield, S. G., Cassatella, A., et al. 1989, IAU Circ., 4783
- Walter et al. (2004) Walter, R., Bodaghee, A., Barlow, E. J., et al. 2004, ATEL, 229
- Walter et al. (2007) Walter, R., Lubinski, P., Paltani, S., et al. 2007, A&A, 461, L17
- Walton et al. (2015a) Walton, D., Harrison, F., Forster, K., et al. 2015a, ATEL, 7752
- Walton et al. (2015b) —. 2015b, ATEL, 7797
- Wang et al. (2015) Wang, Y., Ferrigno, C., & Bodaghee, A. 2015, ATEL, 7159
- Watanabe et al. (1994) Watanabe, H., Kitamoto, S., Miyamoto, S., et al. 1994, ApJ, 433, 350
- Watson et al. (1978) Watson, M., Ricketts, M., & Griffiths, R. 1978, ApJ, 221, L69
- Watson et al. (1986) Watson, M. G., Stewart, G. C., King, A. R., & Brinkmann, W. 1986, MNRAS, 222, 261
- Webb et al. (2000) Webb, N. A., Naylor, T., Ioannou, Z., Charles, P. A., & Shahbaz, T. 2000, MNRAS, 317, 528
- Webbink et al. (1983) Webbink, R., Rapport, S., & Savonije, G. 1983, ApJ, 270, 678
- White & Holt (1982) White, N., & Holt, S. 1982, ApJ, 257, 318
- White & Marshall (1984) White, N., & Marshall, F. 1984, ApJ, 281, 354
- White et al. (1995) White, N., Nagase, F., & Parmar, A. 1995, in X-Ray Binaries, ed. W. Lewin, J. van Paraijs, & E. van den Heuvel (Cambridge University Press), 1
- White et al. (1984) White, N., Parmar, A., Sztajno, M., et al. 1984, ApJ, 283, L9
- White et al. (1988) White, N., Stella, L., & Parmar, A. 1988, ApJ, 324, 363
- White et al. (1998) White, N., Ueda, Y., Dotani, T., & Nagase, F. 1998, IAU Circ., 6927
- White & van Paradijs (1996) White, N. E., & van Paradijs, J. 1996, ApJ, 473, L25
- Wiersema (2015) Wiersema, K. 2015, ATEL, 7688
- Wijnands et al. (2015) Wijnands, R., Degenaar, N., Armas Padilla, M., et al. 2015, MNRAS, 454, 1371
- Wijnands et al. (1999) Wijnands, R., Homan, J., & van der Klis, M. 1999, ApJ, 526, L33
- Wijnands et al. (2008) Wijnands, R., Linares, M., Degenaar, N., & Markwardt, C. 2008, ATEL, 1700
- Wijnands & Miller (2002) Wijnands, R., & Miller, J. 2002, ApJ, 564, 974
- Wijnands et al. (2001) Wijnands, R., Miller, J., & Lewin, W. 2001, IAU Circ., 7715
- Wijnands et al. (2002) Wijnands, R., Miller, J., & van der Klis, M. 2002, MNRAS, 331, 60
- Wijnands & van der Klis (1999) Wijnands, R., & van der Klis, M. 1999, ApJ, 528, L93
- Wijnands & van der Klis (2000) —. 2000, ApJ, 528, L93
- Wijnands et al. (2006) Wijnands, R., in’t Zand, J. J. M., Rupen, M., et al. 2006, MNRAS, 449, 1117
- Williams et al. (2010) Williams, S. J., Gies, D. R., Matson, R. A., et al. 2010, ApJ, 723, 93
- Wilms et al. (1999) Wilms, J., Nowak, M., Dove, J., Fender, R., & Di Matteo, T. 1999, ApJ, 522, 460
- Wilms et al. (2001) Wilms, J., Nowak, M. A., Pottschmidt, K., et al. 2001, MNRAS, 320, 327
- Wilms et al. (2006) Wilms, J., Nowak, M. A., Pottschmidt, K., Pooley, G. G., & Fritz, S. 2006, A&A, 447, 245
- Wilson & Rothschild (1983) Wilson, C., & Rothschild, R. 1983, ApJ, 274, 717
- Wilson-Hodge et al. (2011) Wilson-Hodge, C., Cherry, M. L., Case, G. L., et al. 2011, ApJ, 727, 40
- Winkler et al. (2003) Winkler, C., Courvoisier, T. J.-L., Di Cocco, G., et al. 2003, A&A, 411, L1
- Wood et al. (1999) Wood, A., Smith, D. A., Marshall, F. E., & Swank, J. 1999, IAU Circ., 7274
- Woods et al. (2002) Woods, P. M., Kouveliotou, C., Finger, M. H., et al. 2002, IAU Circ., 7856
- Wren & McKay (2000) Wren, J., & McKay, T. 2000, IAU Circ., 7394
- Wu et al. (2010) Wu, Y. X., Yu, W., Li, T. P., Maccarone, T. J., & Li, X. D. 2010, ApJ, 718, 620
- Yamada et al. (2013) Yamada, S., Torii, S., Mineshige, S., et al. 2013, ApJ, 767, 35
- Yamaoka et al. (2008) Yamaoka, K., Homan, J., & Uemura, M. 2008, ATEL, 1796
- Yamaoka & Nakahira (2010) Yamaoka, K., & Nakahira, S. 2010, ATEL, 2785
- Yamaoka et al. (2010a) Yamaoka, K., Nakahira, S., & Tomsick, J. 2010a, ATEL, 2892
- Yamaoka et al. (2010b) Yamaoka, K., Nakahira, S., Tomsick, J., & Trushkin, S. 2010b, ATEL, 2832
- Yamaoka et al. (2012) Yamaoka, K., Allured, R., Kaaret, P., et al. 2012, PASJ, 64, 32
- Yamauchi & Koyama (1990) Yamauchi, S., & Koyama, K. 1990, PASJ, 42, L83
- Yamauchi & Nakamura (2004) Yamauchi, S., & Nakamura, E. 2004, PASJ, 56, 803
- Yan & Yu (2015) Yan, Z., & Yu, W. 2015, ApJ, 805, 87
- Yan et al. (2015) Yan, Z., Zhang, W., Lin, J., & Yu, W. 2015, ATEL, 7649
- Yan et al. (2014) Yan, Z., Zhang, W., Zhang, H., Stiele, H., & Yu, W. 2014, ATEL, 6649
- Yang et al. (2011) Yang, J., Paragi, Z., Corbel, S., et al. 2011, MNRAS, 418, L25
- Yang et al. (2010a) Yang, Y., Brocksopp, C., Corbel, S., et al. 2010a, MNRAS, 409, L64
- Yang et al. (2010b) Yang, Y., Patruno, A., Degenaar, N., et al. 2010b, ATEL, 2824
- Yao et al. (2005) Yao, Y., Wang, Q., & Zhang, S. 2005, MNRAS, 362, 229
- Yaqoob et al. (1993) Yaqoob, T., Ebisawa, K., & Mitsuda, K. 1993, MNRAS, 264, 411
- Yoshii et al. (2015) Yoshii, T., Negoro, H., Ueno, S., et al. 2015, ATEL, 7858
- Yoshikawa et al. (2015) Yoshikawa, A., Yamada, S., Nakahira, S. Matsuoka, M., et al. 2015, arXiv:1503.01238v1
- Yuan et al. (1995) Yuan, W., Kawai, N., Brinkmann, W., & Matsuoka, M. 1995, A&A, 297, 451
- Zdziarski et al. (2004) Zdziarski, A., Gierlinski, M., Mikolajewska, J., et al. 2004, MNRAS, 351, 791
- Zdziarski et al. (2013) Zdziarski, A., Mikołajewska, J., & Belczyński, K. 2013, MNRAS, 429, 104
- Zdziarski et al. (1998) Zdziarski, A., Poutanen, J., Mikolajewska, J., et al. 1998, MNRAS, 301, 435
- Zdziarski et al. (2002) Zdziarski, A., Poutanen, J., Paciesas, W., & Wen, L. 2002, ApJ, 578, 357
- Zhang et al. (2007) Zhang, G., Qu, J., Zhang, S., et al. 2007, ApJ, 659, 1511
- Zhang et al. (2015a) Zhang, H., Yu, W., Lin, J., Zhang, W., & Yan, Z. 2015a, ATEL, 7607
- Zhang et al. (2015b) Zhang, H., Yu, W., Zhang, W., & Yan, Z. 2015b, ATEL, 7201
- Zhang et al. (1994) Zhang, S. N., Wilson, C. A., Harmon, B. A., et al. 1994, IAU Circ., 6046
- Zhang et al. (1997) Zhang, S. N., Ebisawa, K., Sunyaev, R., et al. 1997, ApJ, 479, 381
- Zhou et al. (2013) Zhou, J., Liu, Q., Chen, Y., et al. 2013, MNRAS, 421, 2285
- Zurita et al. (2008) Zurita, C., Durant, M., Torres, M. A. P., et al. 2008, ApJ, 681, 1458
- Zurita et al. (2002) Zurita, C., Sánchez-Fernández, C., Casares, J., et al. 2002, MNRAS, 334, 999
- Zurita et al. (2005) Zurita, C., Rodríguez, D., Rodríguez-Gil, P., et al. 2005, ATEL, 383
- Zurita et al. (2006) Zurita, C., Torres, M. A. P., Steeghs, D., et al. 2006, ApJ, 644, 432
- Zurita Heras et al. (2011) Zurita Heras, J. A., Chaty, S., Cadolle Bel, M., & Prat, L. 2011, MNRAS, 413, 235
- Zwitter & Calvani (1989) Zwitter, T., & Calvani, M. 1989, MNRAS, 236, 581
- Zycki et al. (1999) Zycki, P., Done, C., & Smith, D. 1999, MNRAS, 309, 561
| Source Namea | Optical Counterpart/a | Classb | Typec | RA (J2000)d | DEC (J2000)d | Discoverye | Outburstsf | Referencesg | |
|---|---|---|---|---|---|---|---|---|---|
| Alternate Name(s) | Year | Telescope | Undergone | ||||||
| XTE J0421+560 | CI Cam | C | BHC,T,R | 04 19 42.141 (0.0566″) | +55 59 57.70 (0.0678″) | 1998 | Rx | 1 | 5,185–189,276–278,367 |
| GRO J0422+32 | V518 Per | A | BH,T,R | 04 21 42.79 (0.2″) | +32 54 27.1 (0.2″) | 1992 | CG | 3 | 1,36–38,279 |
| Nova Per 1992 | |||||||||
| 4U 0538641 | LMC X-3 | A | BH,P | 05 38 56.299 (0.15″) | 64 05 03.00 (0.15″) | 1971 | U | - | 1,11,12 |
| 4U 0540697 | LMC X-1 | A | BH,P | 05 39 38.839 (0.0015″) | 69 44 35.66 (0.0015″) | 1971 | U | - | 1,12,13 |
| 1A 062000 | V616 Mon | A | BH,T,R,J | 06 22 44.503 (0.18″) | 00 20 44.72 (0.10″) | 1975 | Ar | 2 | 1,5,6,280–284,365 |
| Nova Mon 1975 | |||||||||
| Mon X1 | |||||||||
| GRS 100945 | MM Vel | A | BH,T | 10 13 36.377 (0.16″) | 45 04 31.95 (0.15″) | 1993 | G,CG | 1 | 1,13,26,274,386 |
| Nova Vel 1993 | |||||||||
| XTE J1118+480 | KV UMa | A | BH,T,R,J | 11 18 10.80 (0.11″) | +48 02 12.6 (0.04″) | 2000 | Rx | 2 | 1,13,190–195,285,286 |
| GS 1124684 | GU Mus | A | BH,T,R | 11 26 26.7 (0.60″) | 68 40 32.6 (0.17″) | 1991 | G,GS | 1 | 1,45,46,287,385 |
| Nova Muscae 1991 | |||||||||
| IGR J113215311 | - | C | BHC,T | 11 32.1 (2.0′) | 53 11 (2.0′) | 2005 | I | 1 | 5,84,85 |
| MAXI J1305704 | - | B | BHC,T | 13 06 56.440 (5.0 ″) | 70 27 04.91 (5.0″) | 2012 | Mx | 1 | 123–127 |
| SWIFT J1357.20933 | SWIFT J13572093313 | A | BH,T,R,J? | 13 57 16.818 (0.255″) | 09 19 12.00 (0.164″) | 2011 | Sw | 1 | 164,175–179 |
| GS 135464 | BW Cir | A | BH,T,R,J? | 13 58 09.74 (0.5″) | 64 44 05.2 (0.5″) | 1987 | GS | 5 | 1,45,47,48,288,384,394 |
| 1A 152462 | KY TrA | B | BHC,T | 15 28 17.2 (3.0″) | 61 52 58 (3.0″) | 1974 | Ar | 2 | 1,7–9,275,382 |
| TrA X1 | |||||||||
| Swift J1539.26227 | - | B | BHC,T | 15 39 11.963 (0.5 ″) | 62 28 02.30 (0.5″) | 2008 | Sw | 1 | 162–164 |
| MAXI J1543564 | - | B | BHC,T,R,J? | 15 43 17.336 (0.6″) | 56 24 48.35 (0.6″) | 2011 | Mx | 1 | 128–132,289 |
| 4U 1543475 | IL Lupi | A | BH,T,R | 15 47 08.6 (30.0″) | 47 40 10 (30.0″) | 1971 | U | 4 | 1,7,14, 268–271,290 |
| XTE J1550564 | V381 Nor | A | BH,T,R,J | 15 50 58.78 (2.0″) | 56 28 35.0 (2.0″) | 1998 | Rx,CG | 5 | 1,5,196–202,291–294,368 |
| 4U 1630472 | Nor X1 | B | BHC,T,R,J,W | 16 34 01.61 (0.30″) | 47 23 34.8 (0.30″) | 1970 | U,V | 23 | 1,5,15–21,116,295,323,388 |
| XTE J1637498 | - | C | BHC,T | 16 37 02.67 (1.8″) | 49 51 40.6 (1.8″) | 2008 | Rx | 1 | 203,204 |
| XTE J1650500 | - | A | BH,T,R,J?,W | 16 50 00.98 (0.6″) | 49 57 43.6 (0.6″) | 2001 | Rx | 1 | 1,5,205–208,388,391 |
| XTE J1652453 | - | B | BHC,T,R | 16 52 20.33 (2.5″) | 45 20 39.6 (2.5″) | 2009 | Rx | 1 | 209–212,296 |
| GRO J165540 | V1033 Sco | A | BH,T,R,J,W | 16 54 00.137 (0.23″) | 39 50 44.90 (0.20″) | 1994 | CG | 3 | 1,5,39–41,115,297–300 |
| Nova Sco 1994 | 369,388–390 | ||||||||
| MAXI J1659152 | CXOU J165902.6151518 | B | BHC,T,R | 16 59 01.71 (0.7″) | 15 15 28.5 (0.7″) | 2010 | Sw | 1 | 133–137,301 |
| GX 3394 | V821 Ara | A | BH,T,R,J,W | 17 02 49.36 (0.05″) | 48 47 22.8 (0.05″) | 1972 | O7 | 20 | 1,13,53–61,302–305 |
| 3A 1659487 | 388,391 | ||||||||
| H 1705250 | V2107 Oph | A | BH,T | 17 08 14.6 (3.0″) | 25 05 29 (2.0″) | 1977 | Ar,H | 1 | 1,7,62–65 |
| Nova Oph 1977 | |||||||||
| IGR J170913624 | SAX J1709.13624 | B | BHC,T,R,J,W | 17 09 08 (24.0″) | 36 24.4 (24.0″) | 2003 | I | 6 | 5,81,86–93,306,307 |
| IGR J170983628 | 2MASSJ170946123627573 | B | BHC,T,R | 17 09 46.124 (0.03″) | 36 27 57.31 (0.03″) | 2005 | I | 2 | 5,13,94–97,308,392 |
| SAX J1711.63808 | - | C | BHC,T | 17 11 37.1 (3.2″) | 38 07 06 (3.2″) | 2001 | Be | 1 | 1,5,142–144 |
| Swift J1713.44219 | - | C | BHC,T | 17 13 26.60 (3.0′) | 42 19 37.2 (3.0′) | 2009 | Sw | 1 | 164,387 |
| XMMSL1J171900.4353217 | XTE J1719356 | C | BHC,T | 17 19 00.4 (8.0″) | 35 32 17 (8.0″) | 2010 | X | 16 | 183,184 |
| XTE J1719291 | Swift J171916.9290410 | C | BHC,T | 17 19 16.970 (3.8″) | 29 04 10.35 (3.8″) | 2008 | Rx | 1 | 213–215 |
| GRS 1716249 | V2293 Oph | B | BHC,T,R,J? | 17 19 36.93 (0.5″) | 25 01 03.4 (0.5″) | 1993 | G,CG | 2 | 1,7,27,28,310,311 |
| GRO J171924 | |||||||||
| Nova Oph 1993 | |||||||||
| XTE J1720318 | V1228 Sco | B | BHC,T,R,J? | 17 19 58.994 (0.25″) | 31 45 01.25 (0.25″) | 2003 | Rx | 1 | 5,216–218,309 |
| Nova Sco 2003 | |||||||||
| XTE J1727476 | IGR J172694737 | C | BHC,T | 17 26 49.28 (0.3″) | 47 38 24.9 (0.3″) | 2005 | Rx,I | 1 | 5,219,220,370 |
| IGR J172852922 | XTE J1728295 | C | BHC,T | 17 28 38.97 (3.5″) | 29 21 44.9 (3.5″) | 2004 | I | 2 | 5,99,101–102 |
| GRS 1730312 | KS 1730312 | C | BHC,T | 17 33 52.3 (2′) | 31 12 25 (2′) | 1994 | G,M | 1 | 1,5,29,30 |
| AX J1733.93112 | |||||||||
| KS 1732273 | GS 1734275 | B | BHC,T | 17 36 02.0 (7.0″) | 27 25 41 (7.0″) | 1988 | GS | 1 | 5,42–44,371 |
| IGR J173793747 | XTE J1737376 | C | BHC,T | 17 37 58.81 (5.3′) | 37 46 19.6 (5.3′) | 2004 | Rx | 2 | 106–109 |
| GRS 173731 | AX J1740.13102 | C | BHC,T | 17 40 09 (30″) | 31 02.4 (30″) | 1997 | G | 1 | 1,5,31,32,372 |
| GRS 1739278 | XTE J1739278 | B | BHC,T,R | 17 42 40.03 (0.4″) | 27 44 52.7 (0.4″) | 1996 | G | 2 | 1,5,33,272,313 |
| V2606 Oph | |||||||||
| 1E 1740.72942 | Great Annihilator | B | BHC,P,R,J | 17 43 54.83 (0.1″) | 29 44 42.6 (0.1″) | 1984 | E | - | 1–4,314–317 |
| Swift J1743.92944 | |||||||||
| Swift J174510.8262411 | Swift J1745.12624 | B | BHC,T,R,J | 17 45 10.849 (0.01″) | 26 24 12.60 (0.01″) | 2012 | Sw | 1 | 164–166,318–320 |
| IGR J174542919 | - | C | BHC,T | 17 45 28 (5.0″) | 29 19 55 (5.0″) | 2014 | I | 1 | 80,117,118 |
| 1A 1742289 | - | B | BHC,T,R | 17 45 37.0 (3.0″) | 29 01 07 (3.0″) | 1975 | Ar | 1 | 1,7,10,312,373 |
| CXOGC J174540.0290031 | - | B | BHC,T,R,J? | 17 45 40.03 (0.3″) | 29 00 31.0 (0.3″) | 2004 | CH | 1 | 399–402 |
| H 1743322 | IGR J174643213 | B | BHC,T,R,J,W | 17 46 15.608 (0.17″) | 32 14 00.60 (0.5″) | 1977 | Ar,H | 17 | 1,68–79,103,321 |
| XTE J174643213 | 366,388,393 | ||||||||
| XTE J1748288 | AX J1748.02829 | B | BHC,T | 17 48 05.06 (0.6″) | 28 28 25.8 (0.6″) | 1998 | Rx,CG | 1 | 5,221–224 |
| IGR J174972821 | SWIFT J1749.62820 | C | BHC,T | 17 49 38.037 (0.6″) | 28 21 17.37 (0.6″) | 2006 | I | 1 | 5,110–114 |
| SLX 1746331 | 1RXS J174948.4331215 | B | BHC,T | 17 49 48.50 (18.4″) | 33 12 18.3 (18.4″) | 1990 | S2 | 5 | 1,23,155–160,374 |
| XTE J1752223 | SWIFT J1752.12220 | B | BHC,T,R,J | 17 52 15.0950 (0.3″) | 22 20 32.782 (0.3″) | 2009 | Rx | 1 | 225–230,322 |
| Swift J1753.50127 | SwiftJ175328.5012704 | B | BHC,P,R,J | 17 53 28.29 (0.05″) | 01 27 06.2 (0.05″) | 2005 | Sw | 1 | 5,82,164,167–172,324 |
| XTE J1755324 | - | C | BHC,T | 17 55 28.6 (1.0′) | 32 28 39 (1.0′) | 1997 | Rx | 1 | 1,5,7,231–233 |
| H 1755338 | V4134 Sgr | B | BHC,P | 17 58 40.0 (20.0″) | 33 48 27 (20.0″) | 1971 | - | 1,7,66,67,267,373 | |
| GRS 1758258 | SWIFT J1801.22544 | B | BHC,P,R,J,W | 18 01 12.40 (0.15″) | 25 44 36.1 (0.20″) | 1990 | G | - | 1,3,5,34,325,326,388 |
| XTE J1812182 | XMMUJ181227.8181234 | C | BHC,T | 18 12 27.8 (2.0″) | 18 12 34 (2.0″) | 2003 | X | 2 | 5,234,235 |
| IGR J181751530 | XTE J1817155 | C | BHC,T | 18 17 34.3 (2.5′) | 15 30 41 (2.5′) | 2007 | I | 1 | 119–121 |
| XTE J1817330 | SWIFT J1817.63300 | B | BHC,T,R,W | 18 17 43.54 (30.0″) | 33 01 07.8 (30.0″) | 2006 | Rx | 1 | 5,236–241,327,388 |
| XTE J1818245 | - | B | BHC,T,R | 18 18 24.8 (7.0″) | 24 32 15 (7.0″) | 2005 | Rx | 1 | 5,242–245,328 |
| SAX J1819.32525 | V4641 Sgr | A | BH,T,R,J | 18 19 21.63 (0.7″) | 25 24 25.8 (0.7″) | 1999 | Be,Rx | 26 | 1,13,145–154,329,375,397,398 |
| XTE J1819254 | |||||||||
| MAXI J1836194 | - | B | BHC,T,R,J | 18 35 43.43 (1.8″) | 19 19 12.1 (1.8″) | 2011 | Mx | 1 | 138–141,330,331 |
| Swift J1842.51124 | - | C | BHC,T | 18 42 17.45 (0.6″) | 11 25 03.9 (0.6″) | 2008 | Sw | 2 | 164,173,174 |
| EXO 1846031 | - | C | BHC,T | 18 49 17.1 (11.0″) | 03 03 44 (11.0″) | 1985 | EX | 1 | 1,7, 25 |
| IGR J18539+0727 | - | C | BHC,T | 18 53.9 (3.0′) | +07 27 (3.0′) | 2003 | I | 1 | 5,87,122 |
| XTE J1856+053 | - | C | BHC,T | 18 56 39 (1.8′) | +05 19.8 (1.8′) | 1996 | Rx | 5 | 5,246–248 |
| XTE J1859+226 | V406 Vul | A | BH,T,R,J | 18 58 41.58 (0.5″) | +22 39 29.4 (0.5″) | 1999 | Rx | 1 | 1,5,249–251,273,332,376 |
| XTE J1901+014 | SWIFT J1901.6+0127 | C | BHC,T | 19 01 41.00 (12.0″) | +01 26 18.5 (12.0″) | 2002 | Rx | 4 | 83,253–257 |
| 1RXSJ190141.0+012618 | |||||||||
| XTE J1908+094 | - | B | BHC,T,R,J | 19 08 53.077 (0.1″) | +09 23 04.90 (0.1″) | 2002 | Rx | 2 | 1,5,258–262,333 |
| SWIFT J1910.20546 | MAXI J1910057 | C | BHC,T,R | 19 10 22.8 (3.5″) | 05 47 58 (3.5″) | 2012 | Sw,Mx | 1 | 164,180–182,334,377 |
| SS 433 | V1343 Aql | C | BHC,P,R,J | 19 11 49.57 (0.15″) | +04 58 57.9 (0.10″) | 1978 | U | - | 13,83,161,338-343,381 |
| 3A 1909+048 | |||||||||
| GRS 1915+105 | V1487 Aql | A | BH,P,R,J,W | 19 15 11.55 (0.001″) | +10 56 44.8 (0.001″) | 1992 | G | 1 | 1,5,35,104,105,344-357 |
| 378,388 | |||||||||
| 4U 1956+350 | V1357 Cyg | A | BH,P,R,J | 19 58 21.675 (0.003″) | +35 12 05.778 (0.003″) | 1971 | U | - | 1,22,358-364 |
| Cyg X-1 | |||||||||
| 4U 1957+115 | V1408 Aql | C | BHC,P,W | 19 59 24.21 (1.0″) | +11 42 32.4 (1.0″) | 1973 | U | - | 1,23,24,383,388 |
| GS 2000+251 | QZ Vul | A | BH,T,R,J? | 20 02 49.58 (0.60″) | +25 14 11.3 (0.70″) | 1988 | GS | 1 | 1,5,49,335,379 |
| Nova Vul 1988 | |||||||||
| XTE J2012+381 | - | C | BHC,T,R | 20 12 37.67 (0.40″) | +38 11 01.2 (0.40″) | 1998 | Rx | 1 | 1,5,263–266,336 |
| GS 2023+338 | V404 Cyg | A | BH,T,R,J?,W | 20 24 03.83 ( ″) | +33 52 02.2 (0.00005″) | 1989 | GS | 4 | 1,13,50–52,337,380,395,396,414 |
| 4U 2030+40 | Cyg X-3 | B | BHC,P,R,J | 20 32 25.78 (0.03″) | +40 57 27.9 (0.03″) | 1966 | Ae | - | 13,403–413 |
| V1521 Cyg | |||||||||
| MWC 656 | HD 215227 | B | BHC,T,R,J? | 22 42 57.30 (0.003 ″) | +44 43 18.25 (0.003 ″) | 2010 | AG | 0 | 22,415–419 |
| AGL J2241+4454 | |||||||||
| NOTE 1.– This table is also available in machine readable format online at the Astrophysical Journal and on the WATCHDOG website - http://astro.physics.ualberta.ca/WATCHDOG/. | |||||||||
| a The first column states the name exclusively used in this work. The second column states name(s) recognized by the SIMBAD Database or the Astrophysics Data System (ADS). | |||||||||
| b System class identified by A, B or C as defined in Section II. | |||||||||
| c Confirmed Black Hole (BH) or Black Hole Candidate (BHC), system type: T - transient or P - persistent, radio detection (R), confirmed jet (J), possible jet (J?) or accretion disk wind (W). | |||||||||
| d Right Ascension (RA) and Declination (DEC) in J2000 coordinates with errors in parentheses stated in arc seconds (″) or arc minutes (′). If the original reference is quoted as (i) an error radius (), then errors in RA and DEC are quoted as this radius, or (ii) an error ellipse, an equal side error box, calculated from the projection of the semi-major axis onto the xy plane. | |||||||||
| e Telescope: Ae - Proportional Counters aboard the Aerobee 150 Sounding Rocket, AG -AGILE Satellite, Ar - Ariel V, Be - BeppoSAX, CH - Chandra, CG - CGRO, E - Einstein Observatory, EX - EXOSAT, G - GRANAT, GS - GINGA, H - HEAO 1, I - INTEGRAL, Mx - MAXI, M - MIR Space Station, O7 - OSO 7, Rx - RXTE, Ro - ROSAT, S2 - Spacelab 2 Telescope, Sw - Swift, U - UHURU, V - VELA 5B, X - XMM-Newton. | |||||||||
| fTotal number of outbursts detected in each source, including those referenced in the literature and the results of our algorithm. | |||||||||
| gReferences. — [1] McClintock & Remillard (2006) and references therein, [2] Marti et al. (2000b), [3] Sunyaev et al. (1991a), [4] Hertz & Grindlay (1984), [5] Liu et al. (2007) and references therein ,[6] Elvis et al. (1975), [7] Ebisawa et al. (2003), [8] Kaluzienski et al. (1975), [9] Pounds (1974), [10] Eyles et al. (1975), [11] Bonanos et al. (2009), [12] Leong et al. (1971), [13] Cutri et al. (2003), [14] Matilsky et al. (1972), [15] Jones et al. (1976), [16] Tomsick et al. (2005) and references therein, [17] Priedhorsky (1986), [18] Tomsick (2005), [19] Kalemci et al. (2008), [20] Tomida et al. (2009), [21] Nakahira et al. (2011),[22] van Leeuwen (2007), [23] Fuhrmeister & Schmitt (2003), [24] Giacconi et al. (1974), [25] Parmar et al. (1993), [26] Filippenko et al. (1999), [27] Ballet et al. (1993), [28] Harmon et al. (1993a), [29] Borozdin et al. (1995), [30] Vargas et al. (1996), [31] Trudolyubov et al. (1999), [32] Sunyaev et al. (1997), [33] Paul et al. (1996), [34] Mandrou (1990), [35] Castro-Tirado et al. (1992), [36] McCrosky (1992), [37] Paciesas et al. (1992), [38] Shrader et al. (1997), [39] Zhang et al. (1994), [40] Brocksopp et al. (2006), [41] Sobczak et al. (1999), [42] Yamauchi & Koyama (1990), [43] Makino (1988), [44] Yamauchi & Nakamura (2004), [45] Downes et al. (2001), [46] Kitamoto et al. (1992) and references therein, [47] Makino (1987), [48] Casares et al. (2004), [49] Tsunemi et al. (1989), [50] Richer (1987), [51] Kitamoto et al. (1989), [52] Zycki et al. (1999), [53] Markert et al. (1973), [54] Motch et al. (1985), [55] Zdziarski et al. (2004) and references therein, [56] Rubin et al. (1998), [57] Motta et al. (2009), [58] Buxton et al. (2012) and references therein, [59] Belloni (2010) and references therein, [60] Corbel et al. (2013) and references therein, [61] Buxton et al. (2013a), [62] Griffiths et al. (1977), [63] Griffiths et al. (1978), [64] Kaluzienski & Holt (1977), [65] Watson et al. (1978), [66] White et al. (1988), [67] Pan et al. (1995), [68] Steeghs et al. (2003), [69] Doxsey et al. (1977), [70] Kaluzienski et al. (1977), [71] Reynolds et al. (1999), [72] Emelyanov et al. (2000), [73] Zhou et al. (2013) and references therein, [74] Corbel et al. (2005) and references therein, [75] Capitanio et al. (2010) and references therein, [76] Nakahira et al. (2013), [77] Shidatsu et al. (2012), [78] Negoro et al. (2012), [79] Debnath et al. (2013a), [80] Tendulkar et al. (2014), [81] King et al. (2012b), [82] Yoshikawa et al. (2015), [83] Liu et al. (2006) and references therein, [84] Krivonos et al. (2005), [85] Sguera et al. (2007), [86] Kuulkers et al. (2003), [87] Lutovinov & Revnivtsev (2003), [88] Capitanio et al. (2006), [89] Revnivtsev et al. (2003), [90] in’t Zand et al. (2003), [91] Capitanio et al. (2012) and references therein, [92] Altamirano et al. (2011c), [93] Bird et al. (2010), [94] Grebenev et al. (2005b), [95] Grebenev et al. (2005a), [96] Grebenev et al. (2007), [97] Capitanio et al. (2009b), [99] Yang et al. (2010b), [100] Barlow et al. (2005), [101] Walter et al. (2004), [102] Sidoli et al. (2011), [103] Miller et al. (2006c), [104] Lee et al. (2002), [105] Neilsen & Lee (2009), [106] Bird et al. (2007), [107] Markwardt et al. (2008b), [108] Shaw et al. (2008), [109] Krimm et al. (2008b), [110] Soldi et al. (2006), [111] Rodriguez et al. (2007), [112] Walter et al. (2007), [113] Paizis et al. (2007a), [114] Paizis et al. (2009), [115] Kallman et al. (2009), [116] Diaz Trigo et al. (2014), [117] Chenevez et al. (2014b), [118] Chenevez et al. (2014a), [119] Paizis et al. (2007b), [120] Markwardt et al. (2007), [121] Cheung (2007), [122] Lutovinov et al. (2003b), [123] Greiner et al. (2012), [124] Sato et al. (2012), [125] Suwa et al. (2012), [126] Morihana et al. (2013), [127] Shidatsu et al. (2013), [128] Chakrabarty et al. (2011), [129] Negoro et al. (2011a), [130] Munoz-Darias et al. (2011), [131] Stiele et al. (2012), [132] Negoro et al. (2012), [133] Kennea et al. (2011a), [134] Negoro et al. (2010), [135] Mangano et al. (2010a), [136] Kuulkers et al. (2013), [137] Yamaoka et al. (2012), [138] Ferrigno et al. (2011), [139] Negoro et al. (2011b), [140] Remillard et al. (2002), [141] Russell et al. (2014a), [142] in ’t Zand et al. (2001), [143] in’t Zand et al. (2002c), [144] Wijnands & Miller (2002), [145] in ’t Zand et al. (1999), [146] Markwardt et al. (1999b), [147] Wijnands & van der Klis (2000), [148] Orosz et al. (2001), [149] Maitra & Bailyn (2006) and references therein, [150] in’t Zand et al. (2000), [151] Tachibana et al. (2014a), [152] Yamaoka et al. (2008); Yamaoka & Nakahira (2010); Yamaoka et al. (2010a), [153] Cackett & Miller (2007), [154] Revnivtsev et al. (2002), [155] White & van Paradijs (1996), [156] Skinner et al. (1990), [157] Markwardt (2003b), [158] Markwardt & Swank (2007), [159] Kuulkers et al. (2008), [160] Ozawa et al. (2011), [161] Margon (1980), [162] Krimm et al. (2008c), [163] Krimm et al. (2011b), [164] Krimm et al. (2013b) and references therein, [165] Cummings et al. (2012), [166] Curran et al. (2014), [167] Palmer et al. (2005), [168] Soleri et al. (2012), [169] Cadolle Bel et al. (2007), [170] Shaw et al. (2013), [171] Froning et al. (2014), [172] Mostafa et al. (2013), [173] Markwardt et al. (2008a), [174] Krimm et al. (2008d), [175] Sivakoff et al. (2011), [176] Krimm et al. (2011c), [177] Armas Padilla et al. (2013a), [178] Armas Padilla et al. (2013b), [179] Shahbaz et al. (2013), [180] Krimm et al. (2012), [181] Usui et al. (2012), [182] Reis et al. (2013), [183] Read et al. (2010a), [184] Markwardt et al. (2010), [185] Hog et al. (2000a), [186] Robinson et al. (2002), [187] Belloni et al. (1999b), [188] Smith et al. (1998a), [189] Bartlett et al. (2013), [190] Remillard et al. (2000), [191] Hynes et al. (2000b), [192] McClintock et al. (2001b), [193] Remillard et al. (2005), [194] Zurita et al. (2006), [195] Brocksopp et al. (2010b), [196] Smith (1998), [197] Sobczak et al. (2000), [198] Sturner & Shrader (2005), [199] Rodriguez et al. (2004), [200] Belloni et al. (2002), [201] Tomsick et al. (2001b), [202] Curran & Chaty (2013), [203] Starling et al. (2008), [204] Markwardt et al. (2008c), [205] Remillard (2001), [206] Corbel et al. (2004), [207] Rossi et al. (2004), [208] Tomsick et al. (2004), [209] Ozel et al. (2010), [210] Hiemstra et al. (2011), [211] Markwardt et al. (2009b), [212] Han et al. (2011), [213] Degenaar et al. (2008a), [214] Markwardt & Swank (2008), [215] Armas-Padilla et al. (2011), [216] Remillard et al. (2003), [217] Cadolle Bel et al. (2004), [218] Brocksopp et al. (2005), [219] Levine et al. (2005a), [220] Turler et al. (2005a), [221] Hjellming et al. (1998a), [222] Smith et al. (1998b), [223] Brocksopp et al. (2007), [224] Revnivtsev et al. (2000c), [225] Brocksopp et al. (2009), [226] Markwardt et al. (2009c), [227] Munoz-Darias et al. (2010), [228] Stiele et al. (2011), [299] Curran et al. (2011b), [230] Chun et al. (2013), [231] Revnivtsev et al. (1998a), [232] Goldoni et al. (1999), [233] Remillard et al. (1997), [234] Cackett et al. (2006), [235] Markwardt et al. (2008d), [236] Rupen et al. (2006), [237] Remillard et al. (2006), [238] Sriram et al. (2013a), [239] Roy et al. (2011), [240] Gierlinski et al. (2009), [241] Sala et al. (2007), [242] Still et al. (2005a), [243] Levine, A.M. and Lin, D. and Remillard, R.A. (2005), [244] Cadolle Bel et al. (2009), [245] Zurita Heras et al. (2011), [246] Barret et al. (1996b), [247] Marshall et al. (1996), [248] Sala et al. (2008), [249] Wood et al. (1999), [250] Farinelli et al. (2013), | |||||||||
| Table 2 – Continued | |||||||||
|---|---|---|---|---|---|---|---|---|---|
| Source Namea | Optical Counterpart/a | Classb | Typec | RA (J2000)d | DEC (J2000)d | Discoverye | Outburstsf | Referencesg | |
| Alternate Name(s) | Year | Telescope | Undergone | ||||||
| gReferences. (cont.) — [251] Casella et al. (2004), [252] Sriram et al. (2013b), [253] Stephen et al. (2005), [254] Remillard & Smith (2002), [255] Karasev et al. (2007), [256] Karasev et al. (2008), [257] Krimm et al. (2010), [258] Woods et al. (2002), [259] in’t Zand et al. (2002b), [260] Gogus et al. (2004), [261] Jonker et al. (2004), [262] Krimm et al. (2013c), [263] Hynes et al. (1999), [264] Remillard et al. (1998), [265] Campana et al. (2002), [266] Vasiliev et al. (2000), [267] Remillard & McClintock (2006), [268] Kitamoto et al. (1984), [269] Harmon et al. (1992), [270] Park et al. (2004), [271] Kalemci et al. (2005), [272] Krimm et al. (2014b), [273] Cui et al. (2000), [274] Lapshov et al. (1993), [275] Barret et al. (1992), [276] Hjellming et al. (1998c), [277] Clark et al. (2000), [278]Mioduszewski & Rupen (2004), [279] Shrader et al. (1994), [280] Davis et al. (1975), [281] Duldig et al. (1979), [282] Geldzahler (1983), [283] Gallo et al. (2006), [284] Owen et al. (1976), [285] Uemura et al. (2000a), [286] Fender et al. (2001), [287] Ball et al. (1995), [288] Brocksopp et al. (2001), [289] Miller-Jones et al. (2011a),[290] Hunstead & Webb (2002), [291] Hannikainen et al. (2001), [292] Corbel et al. (2002), [293] Tomsick et al. (2003), [294] Kaaret et al. (2003), [295] Hjellming et al. (1999c), [296] Calvelo et al. (2009), [297] Tavani et al. (1996), [298] Harmon et al. (1995), [299] Hjellming & Rupen (1995), [300] Tingay et al. (1995), [301] van der Horst et al. (2010), [302] Corbel et al. (2000), [303] Fender et al. (1997b), [304] Fender et al. (1999a), [305] Hannikainen et al. (1998), [306] Rupen et al. (2003b), [307] Pandey et al. (2005), [308] Rupen et al. (2005e), [309] Rupen et al. (2003d), [310] della Valle et al. (1994), [311] Hjellming et al. (1996b), [312] Davies et al. (1976), [313] Hjellming et al. (1996a), [314] Anantharamaiah et al. (1993), [315] Reich & Schlickeiser (1992), [316] Heindl et al. (1994), [317] Mirabel et al. (1992), [318] Miller-Jones & Sivakoff (2012), [319] Corbel et al. (2012), [320] Coriat et al. (2013a), [321] Rupen et al. (2003e), [322] Brocksopp et al. (2013), [323] Díaz Trigo et al. (2013),[324] Fender et al. (2005), [325] Martí et al. (2002), [326] Rodriguez et al. (1992), [327] Rupin et al. (2006), [328] Rupen et al. (2005d), [329] Hjellming et al. (2000), [330] Reis et al. (2012), [331] Russell et al. (2014b), [332] Brocksopp et al. (2002), [333] Rupen et al. (2002), [334]King et al. (2012a),[335] Hjellming et al. (1988), [336] Hjellming et al. (1998b), [337] Han & Hjellming (1992), [338] Abell & Margon (1979), [339] Blundell et al. (2001), [340] Fender et al. (2000a), [341] Chakrabarti et al. (2003), [342] Chakrabarti et al. (2005), [343] Gies et al. (2002), [344] Eikenberry et al. (1998), [345] Harmon et al. (1997), [346] Atoyan & Aharonian (1997), [347] Fender et al. (2002), [348] Fender et al. (1997a), [349] Fender & Pooley (1998), [350] Pooley & Fender (1997), [351] Rodríguez & Mirabel (1997), [352] Rodriguez & Mirabel (1998), [353] Rodriguez et al. (1995), [354] Mirabel & Rodríguez (1994), [355] Miller-Jones et al. (2005), [356] Foster et al. (1996), [357] Chaty et al. (1996), [358] Braes & Miley (1971), [359] Braes & Miley (1976), [360] Hjellming (1973), [361] Hjellming & Wade (1971b), [362] Tigelaar et al. (2004), [363] Stirling et al. (2001), [364] Fender et al. (2000b), [365] Kuulkers et al. (1999), [366] Miller-Jones et al. (2012), [367]Hog et al. (2000b), [368] Jain et al. (1999), [369] Bailyn et al. (1995b), [370] Maitra et al. (2005), [371] Voges et al. (1999), [372] Ueda et al. (1997), [373] Bradt & McClintock (1983), [374] Motch et al. (1998), [375] Samus et al. (1999), [376] Garnavich et al. (1999), [377] Kennea et al. (2012d), [378] Dhawan et al. (2000), [379] Okamura & Noguchi (1988), [380] Miller-Jones et al. (2009), [381] Kaplin et al. (1980), [382] Bradt et al. (1979), [383] Margon et al. (1978), [384] Kitamoto et al. (1990b), [385] della Valle et al. (1991), [386] Bailyn & Orosz (1995), [387] Krimm et al. (2009b), [388] Ponti et al. (2012), [389] Miller et al. (2006b), [390] Miller et al. (2008), [391] Miller et al. (2004), [392] Prat et al. (2009),[393] Zhang et al. (2015a), [394] Miller et al. (2015a), [395] Negoro et al. (2015b), [396] Kuulkers et al. (2015), [397] Yoshii et al. (2015), [398] Tachibana et al. (2014b), [399] Muno et al. (2005b), [400] Muno et al. (2005a), [401] Belanger et al. (2005), [402] Bower et al. (2005), [403] Giacconi et al. (1967), [404] Hjalmarsdotter et al. (2008), [405] Szostek & Zdziarski (2008), [406] Szostek et al. (2008), [407] Koljonen et al. (2010), [408] Watanabe et al. (1994), [409] Marti et al. (2001), [410] Mioduszewski et al. (2001), [411] Zdziarski et al. (2013), [412] Hanson et al. (2000), [413] Vilhu et al. (2009), [414] Oosterbroek et al. (1997), [415] Lucarelli et al. (2010), [416] Williams et al. (2010), [417] Casares et al. (2014), [418] Casares et al. (2012a), [418] Munar-Adrover et al. (2014), [419] Dzib et al. (2015) | |||||||||
| Source Name | Distanceb | b | Spectral | Referencesc | ||||
|---|---|---|---|---|---|---|---|---|
| (kpc) | () | () | (deg) | () | Type | (hr) | ||
| XTE J0421+560 | - | - | - | - | B0–2 | 465.84 | 92–94 | |
| GRO J0422+32 | 2.490.3 | 3.690.41a | 1.190.02 | 63.75.2 | 0.1160.08 | M2(+2/-1)V | 5.1 | 1,4,17–20,107 |
| 4U 0538641 | 48.12.2 | 6.950.33 | 2.30.3 | 69.650.56 | 0.5320.096 | B3V | 40.9 | 8–10,57 |
| 4U 0540697 | 502.3 | 10.911.41 | 0.8660.037 | 36.381.92 | 0.3430.220 | O7III | 93.8 | 2,7,9–11,55 |
| 1A 062000 | 1.060.12 | 6.600.25 | 3.10.04 | 510.9 | 0.0600.004 | K5V | 7.8 | 1,3,4 |
| GRS 100945 | 3.820.27 | 5.950.89a | 3.170.12 | 62.05.1 | 0.1370.015 | G5–K7V | 6.8 | 1,4,17,25,26 |
| XTE J1118+480 | 1.720.1 | 7.300.73a | 6.270.04 | 68.0–82.0 | 0.0240.009 | K5V | 4.1 | 1,4,52,58 |
| GS 1124684 | 5.890.26 | 5.991.14a | 3.010.15 | 54.0–65.0 | 0.1280.040 | K3–4V | 10.4 | 1,4,17,35,36 |
| IGR J113215311 | - | - | - | - | - | - | 76 | |
| MAXI J1305704 | - | - | 60.0–75.0 | - | - | 9.74 | 77 | |
| Swift J1357.20933 | 1.5–6.3 | - | - | - | M4.5V | 2.8 | 74,106 | |
| GS 135464 | 25.0–61.0 | 7.47a | 5.730.29 | 27.2–80.8 | 0.120.04 | G0–5III | 61.1 | 1,4,37,38 |
| 1A 152462 | 4.4 | - | - | - | - | - | - | 4,5 |
| Swift J1539.26227 | - | - | - | - | - | - | - | |
| MAXI J1543564 | - | - | - | - | - | - | 78 | |
| 4U 1543475 | 7.50.5 | 9.42.0 | 0.250.01 | 24.0–36.0 | 0.25–0.31 | A2V | 26.8 | 2,4,12,13,24 |
| XTE J1550564 | 4.40.5 | 10.392.26a | 7.650.38 | 57.7–77.1 | 0.031–0.037 | K31III | 37.0 | 1,4,53,108 |
| 4U 1630472 | - | - | - | - | - | - | 4 | |
| XTE J1637498 | - | - | - | - | - | - | 100,119 | |
| XTE J1650500 | 2.60.7 | 4.722.16a | 2.730.56 | 75.25.9 | 0.0–0.5 | G5–K4III | 7.7 | 1,4,54,59 |
| XTE J1652453 | - | - | - | - | - | - | - | |
| GRO J165540 | 3.20.5 | 5.40.3 | 2.730.09 | 69.03.0 | 0.380.05 | F6III | 62.9 | 1,4,21–23 |
| MAXI J1659152 | 1.6–8.0 | - | - | 65.0–80.0 | - | M2–5V | 2.414 | 73,109,110 |
| GX 3394 | 8.02.0 | - | 5.80.5 | - | 0.08 | - | 42.1 | 4,45,46,111,112 |
| H 1705250 | 8.62.1 | 5.36–12.48a | 4.860.13 | 48.0–80.0 | 0.0–0.053 | K52V | 12.5 | 4,39,44,47–49 |
| IGR J170913624 | - | - | - | - | - | - | 88 | |
| IGR J170983628 | - | - | - | - | - | - | 87 | |
| SAX J1711.63808 | - | - | - | - | - | - | 4 | |
| Swift J1713.44219 | - | - | - | - | - | - | 80,114 | |
| XMMSL1J171900.4353217 | - | - | - | - | - | - | - | |
| XTE J1719291 | - | - | - | - | K0V or later | - | 101,102 | |
| GRS 1716249 | 2.40.4 | - | - | - | - | K (or later) | 14.7 | 4,27,28,55 |
| XTE J1720318 | - | - | - | - | - | - | 4,98 | |
| XTE J1727476 | - | - | - | - | - | - | 4,99 | |
| IGR J172852922 | - | - | - | - | - | - | 85 | |
| GRS 1730312 | - | - | - | - | - | - | 4,7 | |
| KS 1732273 | - | - | - | - | - | - | 4 | |
| IGR J173793747 | - | - | - | - | - | - | 119 | |
| GRS 173731 | - | - | - | - | - | - | 4,7 | |
| GRS 1739278 | - | - | - | - | B,G or K | - | 4,7,29 | |
| 1E 1740.72942 | - | - | - | - | - | 305.52 | 4,6,70 | |
| Swift J174510.8262411 | - | - | - | - | A0 or later | 80,82 | ||
| IGR J174542919 | - | - | - | - | - | - | 86,89,90 | |
| 1A 1742289 | - | - | - | - | - | - | 4,62 | |
| CXOGC J174540.0290031 | - | - | - | - | - | 7.9 | 121–123 | |
| H 1743322 | - | - | - | - | - | - | 115 | |
| XTE J1748288 | - | - | - | - | - | - | 4 | |
| IGR J174972821 | - | - | - | - | B or K | - | 84 | |
| SLX 1746331 | - | - | - | - | - | - | 83 | |
| XTE J1752223 | 3.50.4 | 9.60.9 | - | - | - | - | - | 71 |
| Swift J1753.50127 | - | - | - | - | - | 3.2 | 81 | |
| XTE J1755324 | - | - | - | - | - | - | 4 | |
| H 1755338 | 4.0–9.0 | - | - | - | - | - | 4.4 | 63,117,118 |
| GRS 1758258 | - | - | - | - | K0III | 442.8 | 4,30–32,70 | |
| XTE J1812182 | - | - | - | - | - | - | 4,103 | |
| IGR J181751530 | - | - | - | - | - | - | - | |
| XTE J1817330 | - | - | - | - | - | - | 4,105 | |
| XTE J1818245 | 2.8–4.3 | - | - | - | - | - | - | 4,75 |
| SAX J1819.32525 | 6.40.6 | 2.740.12 | 0.450.04 | B9III | 67.6 | 1,51,113,120 | ||
| MAXI J1836194 | - | - | 4.0–15.0 | - | - | 4.9 | 79 | |
| Swift J1842.51124 | - | - | - | - | - | - | 80 | |
| EXO 1846031 | - | - | - | - | - | - | 4,7 | |
| IGR J18539+0727 | - | - | - | - | - | - | - | |
| XTE J1856+053 | - | - | - | - | - | - | 4,104 | |
| XTE J1859+226 | 83 | 10.834.67a | 4.50.6 | 603 | 0.0–0.5 | K5–7V | 6.6 | 1,4,17,60,61 |
| XTE J1901+014 | - | - | - | - | - | - | 96 | |
| XTE J1908+094 | 3.0–10.0 | - | - | - | - | A–K | - | 97 |
| Swift J1910.20546 | - | - | - | - | - | - | 80 | |
| SS 433 | 5.50.2 | - | - | - | - | 314.4 | 65,66–69 | |
| GRS 1915+105 | 9.53.0 | 70.02.0 | 0.0580.033 | K0–7III | 739 | 1,4,33,34,50,116 | ||
| 4U 1956+350 | 1.860.12 | 14.810.98 | 0.2510.007 | 27.060.76 | 1.2940.154 | O9.7Iab | 134.4 | 2,4,14–16,56 |
| 4U 1957+115 | - | - | - | - | - | 9.33 | 4,7,55,64,91 | |
| GS 2000+251 | 2.70.7 | 8.371.30a | 5.010.12 | 55.0–65.0 | 0.0420.012 | K3–6V | 8.3 | 1,4,39–41 |
| XTE J2012+381 | - | - | - | - | - | - | 95 | |
| GS 2023+338 | 2.390.14 | 7.150.35a | 6.080.06 | 80.15.1 | 0.0600.005 | K0IV | 155.3 | 1,4,42–44 |
| 4U 2030+40 | 6.7–9.9 | - | WN4/5 or WN 6/7 | 4.8 | 124–127 | |||
| MWC 656 | 2.60.6 | 3.8–6.9 | - | B1.5-2 III | 1448.9 | 128–130 | ||
| NOTE 1.– This table is also available in machine readable format online at the Astrophysical Journal and on the WATCHDOG website - http://astro.physics.ualberta.ca/WATCHDOG/. | ||||||||
| NOTE 2. – All error quantities are quoted to the 1 confidence level. | ||||||||
| a has been calculated based on improved measurements of the orbital parameters of the system. For details per source see the individual source sections. | ||||||||
| b When no acceptable estimates for distance or BH mass are available, kpc is assumed and the BH mass is sampled from the Ozel mass distribution (Ozel et al., 2010). | ||||||||
| cReferences. — [1] Kreidberg et al. (2012), [2] Ozel et al. (2010), [3] Cantrell et al. (2010), [4] Liu et al. (2007), [5] van Paradijs & Verbunt (1984), [6] Marti et al. (2010), [7] McClintock & Remillard (2006), [8] Orosz et al. (2014), [9] Cowley (1992), [10] Orosz et al. (2009), [11] Barret et al. (1996a), [12] Orosz (2003), [13] Orosz et al. (1998b), [14] Orosz et al. (2011a), [15] Reid et al. (2011), [16] Caballero-Nieves et al. (2009), [17] Hynes (2005), [18] Filippenko et al. (1995), [19] Harlaftis et al. (1999), [20] Webb et al. (2000), [21] Beer & Podsiadlowski (2002), [22] Hjellming & Rupen (1995), [23] Shahbaz et al. (1999), [24] Orosz et al. (2002), [25] Filippenko et al. (1999), [26] Shahbaz et al. (1996b), [27] della Valle et al. (1994), [28] Masetti et al. (1996), [29] Marti et al. (1997), [30] Marti et al. (1998), [31] Eikenberry et al. (2001), [32] Rothstein et al. (2002), [33] Greiner et al. (2001a), [34] Harlaftis & Greiner (2004), [35] Orosz et al. (1996), [36] Casares et al. (1997), [37] Casares et al. (2009), [38] Casares et al. (2004), [39] Barret et al. (1996a), [40] Harlaftis et al. (1996), [41] Casares et al. (1995a), [42] Miller-Jones et al. (2009), [43] Casares & Charles (1994), [44] Charles & Coe (2006), [45] Hynes et al. (2003), [46] Shaposhnikov & Titarchuk (2009), [47] Martin et al. (1995), [48] Filippenko et al. (1997), [49] Harlaftis et al. (1997),[50] Neil et al. (2007), [51] Orosz et al. (2001), [52] Gelino et al. (2006), [53] Orosz et al. (2011b), [54] Homan et al. (2006b), [55] Remillard & McClintock (2006), [56] Gies & Bolton (1982), [57] Cowley et al. (1983), [58] Gonzalez Hernandez et al. (2008), [59] Orosz et al. (2004), [60] Corral-Santana et al. (2011), [61] Jonker et al. (2004), [62] Maeda et al. (1996), [63] Mason et al. (1985), [64] Thorstensen (1987), [65] Crampton & Hutchings (1987), [66] Blundell & Bowler (2004), [67] Margon & Anderson (1989), [68] Fabrika & Bychkova (1990), [69] Gies et al. (2002), [70] Smith et al. (2002a), [71] Shaposhnikov et al. (2010), [72] Shaposhnikov & Titarchuk (2009), [73] Kuulkers et al. (2013), [74] Corral-Santana et al. (2013), [75] Cadolle Bel et al. (2009), [76] Sguera et al. (2007), [77] Shidatsu et al. (2013), [78] Stiele et al. (2012), [79] Russell et al. (2014b), [80] Krimm et al. (2013b), [81] Zurita et al. (2008), [82] Muñoz-Darias et al. (2013), [83] Motch et al. (1998), [84]Paizis et al. (2007a), [85] Sidoli et al. (2011), [86] Chenevez et al. (2014a), [87] Steeghs et al. (2005a), [88] Liu et al. (2006), [89] Tendulkar et al. (2014), [90] Chenevez et al. (2014b), [91] Gomez et al. (2015), [92] Barsukova et al. (2005), [93] Robinson et al. (2002), [94] Bartlett et al. (2013), [95] Hynes et al. (1999), [96] Karasev et al. (2007), [97] Chaty et al. (2006), [98] Brocksopp et al. (2005), [99] Maitra et al. (2005), [100] Starling et al. (2008), [101] Armas-Padilla et al. (2011), [102] Greiner et al. (2008), [103] Cackett et al. (2006), [104] Sala et al. (2008), [105] Torres et al. (2006), [106] Shahbaz et al. (2013), [107] Gelino & Harrison (2003), [108] Orosz et al. (2002), [109] Miller-Jones et al. (2011b), [110] Kong (2012), [111] Hynes et al. (2004), [112] Zdziarski et al. (2004), [113] MacDonald et al. (2011), [114] Krimm et al. (2009b), [115] Corbel et al. (2005), [116] Reid et al. (2014), [117] White et al. (1984), [118] Bradt & McClintock (1983), [119] Curran et al. (2011a),[120] MacDonald et al. (2014),[121] Muno et al. (2005b), [122] Muno et al. (2005a), [123] Bower et al. (2005), [124] van Kerkwijk et al. (1996), [125] Predehl et al. (2000), [126] Ling et al. (2009), [127] Zdziarski et al. (2013),[128] Williams et al. (2010), [129] Casares et al. (2014), [130] Casares et al. (2012a) | ||||||||
| Source Name | a | a | Outburst | Literatureb | Algorithm b | Instrument y | Referencesz |
|---|---|---|---|---|---|---|---|
| ID | Class | Class | Detection | ||||
| XTEJ0421+560 | 50885.0 | 50934.0 | 1998 | - | H | ASM,BATSE,EPIC,HEXTE,NFI,PCA | 140–143 |
| GROJ0422+32 | - | - | 1992 | H | - | BATSE | 242,271–274 |
| - | - | 1993a | - | - | GIS,PSPC,SIS | 270,272 | |
| - | - | 1993b | - | - | GIS,PSPC,SIS | 270,272 | |
| 4U0538641 | - | - | 1971–2015 | - | - | A-2,ASM,BAT,GSC,HEXTE,LAC,ME,NFI | 296–303,344,345 |
| SSS,UHURU,PCA | |||||||
| 4U0540697 | - | - | 1971–2015 | - | - | A-2,ASM,BAT,GSC,HEXTE,LAC,ME,NFI | 296–303, 344,345 |
| SSS,UHURU,PCA | |||||||
| 1A 062000 | - | - | 1917 | - | - | HCO | 281 |
| - | - | 1975 | S | - | SSI | 282,395 | |
| GRS 100945 | - | - | 1993 | - | - | BATSE,HEXE,TTM,WATCH | 265-267 |
| XTEJ1118+480c | 51538.0 | 51740.0 | 1999/2000 | H | H | ASM,Chandra, HEXTE,NFI,PCA | 144–147,260,382-384 |
| 53381.0 | 53386.0 | 2004/2005 | H | - | ASM,BAT,HEXTE,PCA | 148,149 | |
| GS 1124684 | - | - | 1992 | S | - | GINGA/ASM,WATCH | 244,396 |
| IGR J113215311d | - | - | 2005 | - | - | ISGRI | 231,232 |
| MAXIJ1305704 | 56009.5 | 56190.0 | 2012 | S | I | BAT,HXD,GSC,XIS,XRT | 84,85 |
| SwiftJ1357.20933 | 55576.5 | 55653.0 | 2011 | H | H | BAT,EPIC,GSC,PCA,RGS,XRT | 122,126,127 |
| GS135464 | - | - | 1967 | S | - | Skylark | 74,75,242,257 |
| - | - | 1972 | H | - | MIT | 74,75,242,258 | |
| - | - | 1987 | S | - | GINGA/ASM,LAC | 74,75,242 | |
| 50714.0 | 50870.0 | 1997/1998 | H | H | ASM,BATSE,GINGA/ASM,HEXTE,PCA | 28,242,259 | |
| - | - | 2015x | H | - | BAT,GSC,XRT | 421–424,495 | |
| 1A 152462 | - | - | 1974 | S | - | Ariel V/ASM,SSI | 242,278 |
| - | - | 1990 | H | - | SIGMA | 242,279,280 | |
| SwiftJ1539.26227 | 54792.0 | 54966.0 | 2008/2009 | S | S | ASM,BAT,HEXTE,PCA,XRT | 121,122 |
| MAXIJ1543564e | 55653.5 | 55832.5 | 2011 | S | S | BAT,GSC,PCA,XRT | 86 |
| 4U1543475 | - | - | 1971 | S | - | UHURU | 1,242 |
| - | - | 1983/1984 | S | - | -Tenma | 2,242 | |
| - | - | 1992 | H | - | BATSE | 3,242 | |
| 52435.0 | 52569.0 | 2002 | S | S | ASM,EPIC,HEXTE,PCA | 4,242 | |
| XTEJ1550564 | 51062.0 | 51316.0 | 1998/1999 | S | S | ASM,BATSE,HEXTE,PCA | 150–152,385–387 |
| 51597.0 | 51719.0 | 2000 | S | S | ASM,Chandra,HEXTE,PCA | 153–156 | |
| 51934.0 | 51986.0 | 2001 | H | H | ASM,Chandra,HEXTE,PCA | 157 | |
| 52261.0 | 52312.0 | 2001/2002 | H | H | ASM,HEXTE,PCA | 158,388 | |
| 52725.0 | 52775.0 | 2003 | H | H | ASM,HEXTE,ISGRI,JEM-X,PCA | 159,160 | |
| Continued on Next Page… | |||||||
| Table 4 – Continued | |||||||
|---|---|---|---|---|---|---|---|
| Source Name | a | a | Outburst | Literatureb | Algorithm b | Instrument y | Referencesz |
| ID | Class | Class | Detection | ||||
| 4U1630472 | - | - | 1969 | - | - | XC | 5 |
| - | - | 1970/1971 | - | - | SSI,UHURU,XC | 5,6 | |
| - | - | 1972 | - | - | SSI,UHURU,XC | 5,6 | |
| - | - | 1974 | - | - | SSI,UHURU,XC | 5,6 | |
| - | - | 1976 | - | - | SSI,UHURU,XC | 5,6 | |
| - | - | 1977 | - | - | A-2,LASS,SSI | 7 | |
| - | - | 1978 | - | - | LASS | 7 | |
| - | - | 1979 | - | - | GIS,HRI,LAC,PSPC,SSS | 8,10 | |
| - | - | 1984 | S | - | ME,Tenma | 9 | |
| - | - | 1987 | - | - | GINGA/ASM,LAC | 7 | |
| - | - | 1988 | - | - | GINGA/ASM,GIS,HRI,LAC | 7,8 | |
| - | - | 1992 | - | - | PSPC,SSS | 10 | |
| - | - | 1994 | - | - | GIS,HRI,LAC | 8 | |
| 50134.0 | 50333.0 | 1996 | - | S | ASM,HEXTE,PCA | 7,19,338 | |
| 50840.0 | 51079.0 | 1998 | S | S | ASM,BATSE,HEXTE,NFI,PCA,PSPC | 11–13,19,38,337 | |
| 51221.0 | 51396.0 | 1999 | - | S | ASM,HEXTE,PCA | 11,19 | |
| 51842.0 | 52075.0 | 2000/2001 | - | S | ASM,HEXTE,PCA | 19 | |
| 52514.0 | 53334.0 | 2002-2004 | S | S | ASM,HEXTE,ISGRI,,PCA | 14,19 | |
| 53700.0 | 53876.0 | 2005/2006 | S | S | ASM,BAT,HEXTE,PCA | 15 | |
| 54453.0 | 54652.0 | 2007/2008 | - | S | ASM,BAT,HEXTE,PCA | 16 | |
| 55178.0 | 55429.0 | 2009/2010 | S | S | ASM,BAT,GSC,PCA | 17 | |
| 55900.0 | 56628.5 | 2011–2013 | S | S | BAT,Chandra,EPIC,GSC,PCA | 18,20,354 | |
| 57036.0 | 57156.0 | 2015w | - | S | BAT,GSC,ISGRI,/JEM-X | 409,411 | |
| XTEJ1637498f | 54703.0 | 54717.0 | 2008 | - | - | BAT,HEXTE,PCA,XRT | 203,204 |
| XTEJ1650500g | 52149.0 | 52366.0 | 2001/2002 | S | S | ASM,Chandra,HEXTE,PCA | 161–165 |
| XTEJ1652453 | 55000.0 | 55158.0 | 2009 | S | S | ASM,BAT,EPIC,HEXTE,PCA,XRT | 166,167 |
| GROJ165540 | - | - | 1994 | S | - | BATSE,GIS,OSSE,WATCH | 21 |
| 50184.0 | 50690.0 | 1996/1997 | S | S | ASM,HEXTE,PCA | 23,391,393 | |
| 53415.0 | 53654.0 | 2005 | S | S | ASM,BAT,HEXTE,ISGRI,PCA,XRT | 22,389,390,392 | |
| 414–417 | |||||||
| MAXIJ1659152 | 55456.5 | 55614.0 | 2010/2011 | S | S | ASM,BAT,EPIC,GSC,ISGRI | 87,88,89 |
| PCA,RGS,XRT | |||||||
| GX3394 | - | - | 1973 | S | - | MIT,VELA5B | 29,35 |
| - | - | 1981 | S | - | HAKUCHO,ME | 30 | |
| - | - | 1988 | S | - | GINGA/ASM,LAC | 31,35 | |
| - | - | 1990 | S | - | GINGA/ASM,SIGMA | 33,35 | |
| - | - | 1991 | S | - | BATSE,GINGA/ASM,OSSE,SIGMA,WATCH | 32–35 | |
| - | - | 1992 | S | - | BATSE,SIGMA | 32–34 | |
| - | - | 1993/1994 | S | - | BATSE | 33,34 | |
| - | - | 1994 | H | - | BATSE,SIGMA | 34,35 | |
| - | - | 1995a | H | - | BATSE | 34,35 | |
| - | - | 1995b | H | - | BATSE | 34,35 | |
| 50259.0 | 51298.0 | 1996–1999 | S | S | ASM,HEXTE,BATSE,PCA | 34–37 | |
| 52350.0 | 52750.0 | 2002/2003 | S | S | ASM,HEXTE,PCA | 50,300 | |
| 53054.0 | 53515.0 | 2004/2005 | S | S | ASM,BAT,HEXTE,ISGRI,PCA | 39,300 | |
| 53751.0 | 53876.0 | 2006 | H | H | ASM,BAT,HEXTE,PCA | 40 | |
| 54053.0 | 54391.0 | 2006/2007 | S | S | ASM,BAT,HEXTE,PCA | 40,41,300 | |
| 54624.0 | 54748.0 | 2008 | H | H | ASM,BAT,HEXTE,PCA | 40 | |
| 54875.0 | 55024.0 | 2009 | H | H | ASM,BAT,HEXTE,PCA | 40 | |
| 55182.5 | 55665.0 | 2009–2011 | S | S | ASM,BAT,GSC,PCA | 42 | |
| 56505.5 | 56608.0 | 2013 | H | H | BAT,GSC,XRT | 43,399–402 | |
| 56936.0 | 57156.0 | 2014/2015w | S | S | BAT,GSC,XRT | 225,403,410,413,496 | |
| Continued on Next Page… | |||||||
| Table 4 – Continued | |||||||
|---|---|---|---|---|---|---|---|
| Source Name | a | a | Outburst | Literatureb | Algorithm b | Instrument y | Referencesz |
| ID | Class | Class | Detection | ||||
| H 1705250 | - | - | 1977 | - | - | A-3, Ariel V/ASM,SSI | 233–236 |
| IGRJ170913624h | - | - | 1994 | - | - | TTM | 65 |
| - | - | 1996 | - | - | ISGRI,WFC | 66 | |
| - | - | 2001 | - | - | ISGRI,WFC | 66 | |
| - | - | 2003 | S | - | HEXTE,ISGRI,JEM-X,PCA | 67,68 | |
| 54267.0 | 54395.0 | 2007 | S | - | BAT,ISGRI,JEM-X,PCA,XRT | 73 | |
| 55590.0 | 56412.0 | 2011–2013 | S | S | ASM,BAT,ISGRI, JEM-X,PCA,XRT | 69,70 | |
| IGRJ170983628i | - | - | 2005–2007 | S | - | BAT,EPIC,ISGRI,PCA,RGS,XRT | 226,227 |
| - | - | 2009 | - | - | ISGRI | 418 | |
| SAXJ1711.63808 | 51927.0 | 52066.0 | 2001 | H | H | ASM,EPIC,HEXTE,NFI,PCA,RGS,WFC | 93 |
| Swift J1713.44219j | 55142.0 | 55159.0 | 2009 | - | - | BAT,HEXTE,ISGRI,PCA,XRT | 122,398 |
| XMMSL1J171900.4353217k | 53166.0 | 53291.0 | 2004 | - | - | PCA | - |
| 53421.0 | 53580.0 | 2005 | - | - | BAT,ISGRI,PCA | - | |
| 53643.0 | 53779.0 | 2005/2006 | - | - | BAT,ISGRI,PCA | - | |
| 53853.0 | 54013.0 | 2006 | - | - | BAT,ISGRI,PCA | - | |
| 54025.0 | 54144.0 | 2006/2007 | - | - | BAT,ISGRI,PCA | - | |
| 54157.0 | 54285.0 | 2007a | - | H | BAT,ISGRI,PCA | - | |
| 54312.0 | 54349.0 | 2007b | - | - | BAT,ISGRI,PCA | - | |
| 54363.0 | 54503.0 | 2007/2008 | - | - | BAT,ISGRI,PCA | - | |
| 54517.0 | 54642.0 | 2008a | - | - | BAT,ISGRI,PCA | - | |
| 54651.0 | 54714.0 | 2008b | - | - | BAT,ISGRI,PCA | - | |
| 54728.0 | 54969.0 | 2008/2009 | - | H | BAT,ISGRI,PCA | - | |
| 54990.0 | 55037.0 | 2009 | - | - | BAT,PCA | - | |
| 55059.0 | 55463.0 | 2009/2010 | - | H | BAT,EPIC,ISGRI,PCA,XRT | 132–136,346 | |
| 55477.0 | 55613.0 | 2010/2011 | - | - | BAT,ISGRI,PCA | - | |
| 55628.0 | 55699.0 | 2011a | - | - | BAT,ISGRI,PCA | - | |
| 55718.0 | 55789.0 | 2011b | - | - | BAT,ISGRI,PCA | - | |
| XTEJ1719291l | - | - | 2008 | - | - | Chandra,EPIC,PCA,XRT | 205–209 |
| GRS 1716249 | - | - | 1993 | H | - | BATSE,SIGMA,TTM | 242,263,264 |
| - | - | 1995 | H | - | BATSE,TTM | 394 | |
| XTEJ1720318 | 52644.0 | 52832.0 | 2003 | S | S | ASM,EPIC,HEXTE,ISGRI,JEM-X,PCA | 168,169 |
| XTEJ1727476 | 53639.0 | 53692.0 | 2005 | S | S | ASM,HEXTE,ISGRI,JEM-X,PCA,XRT | 170–173 |
| IGRJ172852922 | 52861.0 | 52941.0 | 2003 | - | - | ASM,HEXTE,ISGRI,JEM-X,PCA | 71 |
| 55426.0 | 55513.0 | 2010 | H | H | ASM,BAT,EPIC,ISGRI,PCA | 72 | |
| GRS 1730312 | - | - | 1994 | S | - | SIGMA,TTM | 261,262 |
| KS 1732273 | - | - | 1988 | S | - | LAC | 268,269 |
| IGRJ173793747m | - | - | 2004 | - | - | ISGRI,PCA | 76 |
| 54708.0 | 54728.0 | 2008 | - | H | BAT,ISGRI,PCA,XRT | 76,77,78 | |
| GRS173731 | 50497.0 | 50597.0 | 1997 | H | H | ASM,GIS,HEXTE,PCA,SIGMA,WFC | 24,242,256,347–349 |
| GRS1739278 | 50136.0 | 50387.0 | 1996 | S | S | ASM,HEXTE,ROSAT/HRI,PCA,SIGMA,TTM | 25,26,350 |
| 56725.0 | 57168.0 | 2014/2015 | - | S | BAT,JEM-X,ISGRI | 27,404,405 | |
| 1E1740.72942 | - | - | 1984–2015 | - | - | ART-P,ASM,BAT,HEXE,HEXTE,IPC | 284–295 |
| ISGRI,JEM-X,NuSTAR,OSSE,PCA,PSPC | |||||||
| SIGMA,TTM | |||||||
| SwiftJ174510.8262411 | 56178.0 | 56463.0 | 2012/2013 | H | H | BAT,ISGRI,JEM-X,XRT | 122,123,409 |
| IGRJ174542919n | 56941.0 | 56960.0 | 2014 | - | - | ISGRI,JEM-X | 406–408 |
| 1A 1742289 | - | - | 1975 | - | - | ANS,MSSL,RMC,PCS | 276,277 |
| Continued on Next Page… | |||||||
| Table 4 – Continued | |||||||
|---|---|---|---|---|---|---|---|
| Source Name | a | a | Outburst | Literatureb | Algorithm b | Instrument y | Referencesz |
| ID | Class | Class | Detection | ||||
| CXOGC J174540.0290031 | - | - | 2004 | - | - | EPIC,Chandra | 497,498 |
| H1743322 | - | - | 1977 | - | - | A-4 | 58,59 |
| - | - | 1984 | - | - | ME | 44 | |
| - | - | 1996 | - | - | TTM | 45 | |
| 52713.0 | 52945.0 | 2003 | S | S | ASM,Chandra,HEXTE,ISGRI,JEM-X,PCA | 46–50 | |
| 53182.0 | 53307.0 | 2004 | S | S | ASM.Chandra,HEXTE,ISGRI,JEM-X,PCA | 51 | |
| 53575.0 | 53654.0 | 2005 | S | S | ASM,BAT,Chandra,HEXTE,ISGRI,JEM-X,PCA | 51 | |
| 54446.0 | 54513.0 | 2007/2008 | S | S | ASM,BAT,Chandra,HEXTE,ISGRI,JEM-X,PCA,XRT | 55,56,351 | |
| 54714.0 | 54813.0 | 2008 | H | H | ASM,BAT,HEXTE,ISGRI,JEM-X,PCA,XRT | 52,53 | |
| 54953.0 | 55053.0 | 2009 | S | S | ASM,BAT,HEXTE,ISGRI,JEM-X,PCA | 53,54,57 | |
| 55161.5 | 55248.0 | 2009/2010 | - | H | ASM,BAT,GSC,ISGRI,JEM-X,PCA | 56 | |
| 55387.5 | 55488.0 | 2010 | S | S | ASM,BAT,GSC,HEXTE,ISGRI,JEM-X,PCA | 56,60,61 | |
| 55536.5 | 55800.5 | 2010/2011 | S | I | ASM,BAT,GSC,ISGRI,JEM-X,PCA | 56,61 | |
| 55912.0 | 55988.0 | 2011/2012 | - | H | BAT,GSC,ISGRI,JEM-X | 62 | |
| 56185.0 | 56306.5 | 2012/2013 | - | H | BAT,GSC,GSO,HXD,ISGRI,JEM-X,XIS | 63,406 | |
| 56489.0 | 56563.0 | 2013 | - | I | BAT,GSC,ISGRI,JEM-X | 64 | |
| 56903.0 | 57032.5 | 2014/2015 | - | H | BAT,GSC,ISGRI,JEM-X | 407 | |
| - | - | 2015x | - | - | BAT,Chandra,GSC,XRT | 419,420 | |
| XTEJ1748288 | 50961.0 | 51038.0 | 1998 | S | H | ASM,BATSE,HEXTE,PCA | 137,283,352 |
| IGRJ174972821 | 53963.0 | 54061.0 | 2006 | H | H | ASM,BAT,Chandra,HEXTE,HXD,ISGRI | 79–81 |
| JEM-X,PCA,XIS,XRT | |||||||
| SLX1746331o | - | - | 1985 | - | - | ROSAT/XRT | 397 |
| - | - | 1990 | - | - | SpaceLab2 | 112 | |
| 52713.0 | 52967.0 | 2003 | S | S | ASM,HEXTE,ISGRI,JEM-X,PCA,PSPC | 113–116 | |
| 54377.0 | 54591.0 | 2007/2008 | S | S | ASM,HEXTE,ISGRI,JEM-X,PCA,XRT | 117–119 | |
| 55537.0 | 55586.5 | 2010/2011 | S | - | ASM,GSC,ISGRI,JEM-X | 120 | |
| XTEJ1752223p | 55091.0 | 55423.0 | 2009/2010 | S | S | ASM,BAT,EPIC, GSC,HEXTE,ISGRI,JEM-X | 174–177,353 |
| PCA,RGS,XIS | |||||||
| SwiftJ1753.50127 | - | - | 2005-2015 | - | - | ASM,BAT,EPIC,GSC,HEXTE,ISGRI | 213–219,412 |
| JEM-X,PCA,RGS,XRT | |||||||
| XTEJ1755324 | 50637.0 | 50761.0 | 1997 | S | S | ASM,HEXTE,PCA,SIGMA | 138,139 |
| H 1755338 | - | - | 1970–1993 | - | - | CMA,EPIC,GSPC,ME,TTM | 333–336 |
| GRS1758258 | - | - | 1990–2015 | - | - | ASM,BAT,Chandra,GIS,ISGRI,JEM-X | 285,293,327–332 |
| PCA,PSPC,SIGMA | |||||||
| XTEJ1812182 | 52656.0 | 52710.0 | 2003 | - | H | ASM,EPIC | 178 |
| 54699.0 | 54758.0 | 2008 | - | S | ASM,BAT,PCA,XRT | 179,180 | |
| IGRJ181751530q | 54328.0 | 54361.0 | 2007 | - | - | ASM,BAT,ISGRI,PCA | 222–224 |
| XTEJ1817330 | 53744.0 | 53996.0 | 2006 | S | S | ASM,BAT,EPIC,HEXTE,ISGRI,PCA | 181–184 |
| RGS,XRT | |||||||
| XTEJ1818245 | 53575.0 | 53700.0 | 2005 | S | S | ASM,BAT,HEXTE,ISGRI,JEM-X | 185,186 |
| PCA,XRT | |||||||
| Continued on Next Page… | |||||||
| Table 4 – Continued | |||||||
|---|---|---|---|---|---|---|---|
| Source Name | a | a | Outburst | Literatureb | Algorithm b | Instrument y | Referencesz |
| ID | Class | Class | Detection | ||||
| SAXJ1819.32525r | - | - | 1978 | - | - | SAI | 408 |
| 51214.0 | 51605.0 | 1999/2000 | - | I | ASM,HEXTE,NFI,PCA,WFC | 94–97,104,105 | |
| 51615.0 | 51636.0 | 2000a | - | - | ASM,PCA | - | |
| 51645.0 | 51697.0 | 2000b | - | - | ASM,PCA | - | |
| 51743.0 | 51949.0 | 2000/2001 | - | - | ASM,PCA | 98,99 | |
| 51960.0 | 52560.0 | 2001/2002 | - | - | ASM,HEXTE,PCA | 98,99 | |
| 52680.0 | 52761.0 | 2003 | - | - | ASM,PCA | - | |
| 52776.0 | 53147.0 | 2003/2004 | H | - | ASM,HEXTE,PCA | 100–102 | |
| 53189.0 | 53207.0 | 2004 | - | - | ASM,HEXTE,PCA | 103 | |
| 53218.0 | 53589.0 | 2004/2005 | - | - | ASM,BAT,HEXTE,PCA | - | |
| 53652.0 | 53864.0 | 2005/2006 | - | H | ASM,BAT,PCA | - | |
| 53878.0 | 54222.0 | 2006/2007 | - | H | ASM,BAT,PCA | - | |
| 54232.0 | 54255.0 | 2007a | - | - | ASM,BAT,PCA,XRT | 106 | |
| 54292.0 | 54347.0 | 2007b | - | - | ASM,BAT,PCA | - | |
| 54356.0 | 54369.0 | 2007c | - | - | ASM,BAT,PCA | - | |
| 54518.0 | 54584.0 | 2008a | - | H | ASM,BAT,PCA | - | |
| 54598.0 | 54682.0 | 2008b | - | - | ASM,BAT,PCA | - | |
| 54691.0 | 54942.0 | 2008/2009 | - | H | ASM,BAT,PCA,XRT | 107 | |
| 54951.0 | 55279.0 | 2009/2010 | - | I | ASM,BAT,GSC,PCA,XRT | 108–111 | |
| 55582.0 | 55719.0 | 2011a | - | - | ASM,BAT,GSC,PCA | - | |
| 55754.0 | 55769.0 | 2011b | - | - | ASM,BAT,GSC,PCA | - | |
| 55783.0 | 55846.0 | 2011c | - | - | ASM,BAT,GSC,PCA | - | |
| 56008.5 | 56014.5 | 2012 | - | - | BAT,GSC | - | |
| 56365.5 | 56391.5 | 2013 | - | - | BAT,GSC | - | |
| 56657.5 | 56810.0 | 2013/2014 | - | S | BAT,GSC | 493,494 | |
| - | - | 2015x | - | - | BAT,GSC,XRT | 491,492 | |
| MAXIJ1836194 | 55793.5 | 56154.5 | 2011/2012 | H | H | ASM,BAT,GSC,HXD,ISGRI,JEM-X,PCA | 90–92 |
| XIS,XRT | |||||||
| SwiftJ1842.51124s | 54630.0 | 54857.0 | 2008/2009 | S | S | ASM,BAT,HEXTE,PCA,XRT | 122,124,125 |
| - | - | 2010 | - | - | ASM,BAT | 122 | |
| EXO 1846031 | - | - | 1985 | S | - | CMA,GSPC,ME | 275 |
| IGRJ18539+0727t | - | - | 2003 | H | - | HEXTE,ISGRI,PCA | 220,221 |
| XTEJ1856+053u | 50190.0 | 50216.0 | 1996a | S | S | ASM,PCA | 83,187,188 |
| 50311.0 | 50410.0 | 1996b | S | S | ASM,BATSE,PCA | 83,187–190 | |
| 54111.0 | 54312.0 | 2007 | S | S | ASM,BAT,EPIC,HEXTE,PCA,RGS,XRT | 83,188 | |
| 54926.0 | 54950.0 | 2009 | - | I | ASM,BAT,PCA | - | |
| - | - | 2015a | H | - | GSC,XRT | 228–230 | |
| - | - | 2015b | S | - | GSC | 82 | |
| XTEJ1859+226 | 51437.0 | 51661.0 | 1999/2000 | S | S | ASM,BATSE,Chandra,HEXTE,NFI,PCA | 191–193,355 |
| XTEJ1901+014v | - | - | 1997 | - | - | ASM,ISGRI,PCA,PSPC | 210,211 |
| - | - | 2002 | - | - | ASM,ISGRI,PCA,PSPC | 210,211 | |
| - | - | 2006 | - | - | BAT,EPIC | 211,212 | |
| - | - | 2010 | - | - | BAT | 212 | |
| XTEJ1908+094 | 52327.0 | 52750.0 | 2002/2003 | S | S | ASM,Chandra,HEXTE,NFI,PCA | 194–196 |
| 56581.0 | 56780.0 | 2013/2014 | I | I | BAT,GSC,XRT | 197–200 | |
| SwiftJ1910.20546 | 56060.0 | 56329.5 | 2012/2013 | S | S | BAT,EPIC,GSC,ISGRI,XRT | 122,128–131 |
| SS433 | - | - | 1978-2015 | - | - | A-2,ASM,ArielVI,BAT,Chandra,CMA | 339–343 |
| GSCGSPC,LAC,ME,MPC,PCA,SIS | 356–364 | ||||||
| SSI,SSS,Tenma,UHURU | 405 | ||||||
| Continued on Next Page… | |||||||
| Table 4 – Continued | |||||||
|---|---|---|---|---|---|---|---|
| Source Name | a | a | Outburst | Literatureb | Algorithm b | Instrument y | Referencesz |
| ID | Class | Class | Detection | ||||
| GRS 1915+105 | - | - | 1992–2015 | - | - | ASM,BAT,BATSE,Chandra,GSC,IXAE | 245–255 |
| PCA,PSPC,SIGMA,WATCH | 365,366 | ||||||
| 4U1956+350 | - | - | 1971–2015 | - | - | A-2,A-4,Ariel V/ASM,ASM,BAT,BATSE | 310–326 |
| BBXRT,CMA,GBM,GCXSE,GIS,GSC,GPSC,HEXE | 369–379 | ||||||
| HEXTE,HRGRS,HSEM,LAC,LE | |||||||
| ME,OSSE,PCA,SIS,Tenma,UHURU,VELA5B | |||||||
| 4U1957+115 | - | - | 1973–2015 | - | - | A-2,ASM,BAT,Chandra,CMA,EPIC,GIS | 304–309 |
| GSC,GSPC,HEXTE,LAC,LE,ME,PCA,PSPC | 367,368 | ||||||
| RGS,SIS,UHURU,XRT | |||||||
| GS 2000+251 | - | - | 1988 | - | - | GINGA/ASM | 243 |
| XTEJ2012+381 | 50940.0 | 51141.0 | 1998 | S | S | ASM,HEXTE,NFI,PCA | 201,202 |
| GS 2023+338 | - | - | 1938 | - | - | SO | 237 |
| - | - | 1956 | - | - | SO | 237 | |
| - | - | 1989 | H | - | GINGA/ASM,LAC | 237–242 | |
| - | - | 2015x | - | - | BAT,GSC,ISGRI,JEM-X,NuSTAR,XRT | 425–490 | |
| 4U2030+40 | - | - | 1967–2015 | - | - | ASM,BAT,BATSE,GSC,HEXTE,ISGRI,JEM-X,SPI,PCA | 499-502 |
| NOTE 1.– This table is also available in machine readable format online at the Astrophysical Journal and on the WATCHDOG website - http://astro.physics.ualberta.ca/WATCHDOG/. | |||||||
| aThe begin and end times of each outburst in MJD as calculated via the algorithm. | |||||||
| bOutburst classification via the algorithm or spectral and/or timing analysis found in the literature (where available). S - Successful, H- Hard-only, I - Indetermined. | |||||||
| cWhile the algorithm does detect part of the 2004/2005 outburst with RXTE/ASM, there is an insufficient amount of data to classify it. | |||||||
| dDue to the short variability exhibited by this source (see Section II for detail) the algorithm was unable to catch the 2005 outburst. | |||||||
| eThe algorithm also detects this source in 2012 and 2014, both of which are above the detection threshold and minimum data requirement. However, the fact that we only detect them with MAXI and they are not found in the literature points to the conclusion that they are most likely artificial features and therefore are not included in our analysis. | |||||||
| fWhile the algorithm does detect activity in this source in 2008, their is not enough data available to classify it. | |||||||
| gIt is important to note that in addition to the outburst in 2001, the algorithm has also caught four flare-like events in the harder (4 keV) MAXI bands between 2010–2011 and 2014–2015. These features have been proven to be due to contamination by the close by source GX 3394, which was bright during this period, and therefore are ignored. | |||||||
| hData from the INTEGRAL bulge scan has only been available as of February of 2005 and as a result the algorithm has only caught the 2007 and 2011 outbursts of this source. The 2007 outburst could not be classified as only Swift/BAT data is available. | |||||||
| iWhile the algorithm detects minimal activity in this source in 2005 with BAT,PCA and ISGRI, the detections did not meet our minimum data requirement and therefore are not included in our analysis. In addition, while the algorithm also detects the source in 2011, this detection is due to contamination from the nearby active source IGRJ170913624, and therefore the detection is disregarded. | |||||||
| jWhile the algorithm was able to detect activity in this source in 2009 with BAT,HEXTE and PCA, there is not enough data to classify it. | |||||||
| kThere is a record of only one outburst from this source in the literature in 2009/2010. The algorithm significantly detects this source on 16 separate occasions (mostly in archival RXTE/PCA data). However, only three of these outbursts can be classified due to the lack of available data across multiple telescopes. | |||||||
| lArmas-Padilla et al. (2011) estimate that XTE J1719291 would have had a 2–10 keV peak luminosity of during its 2008 outburst, therefore classifying the system as a VFXT. As this luminosity is below the detection limit of the ASMs and scanning surveys used in this study, the algorithm did not detect this outburst. | |||||||
| mWhile the algorithm was able to detect the 2004 and 2008 outbursts of this source, it was unable to classify the former as the only data available at that time was from the RXTE/PCA. | |||||||
| nWhile the algorithm does detect the 2014 activity in this source, the source is only detected in the JEM-X 3–10 and ISGRI 40–100 bands and the detections are below the minimum data requirement, making classification impossible. | |||||||
| oWhile the algorithm does detect the 2010/2011 activity reported by MAXI, their is not enough available data to classify it. In addition, the algorithm also detects activity in the source between 2014–2014. However, as this flare activity-like is only detected in the MAXI 4-20 keV band, it is considered artificial and not included in our analysis. | |||||||
| pIn addition to the outburst in 2009/2010, the algorithm has caught 5 flare-like events with MAXI between 2011–2015. While all are above our detection threshold and minimum data requirement, they are only detected with MAXI data in the 4–20 keV band, and are not mentioned at all in the literature. Therefore they are assumed to be artificial features. | |||||||
| qWhile the algorithm detects this source in 2007, there is only a significant amount of data available in RXTE/PCA and therefore the outburst could not be classified. | |||||||
| rIn additional to the 9 recorded outbursts in the literature, the algorithm also detects 13 separate flare-like events (mainly using RXTE/PCA), each of which are above the detection threshold and minimum data requirement. Given the number of MAXI detections and the high sensitivity of RXTE/PCA (when compared with the 5 other instruments we make use of), all 13 are treated as real features and included in our analysis. However, only 8 can be classified due to the lack of available data in multiple telescopes. | |||||||
| sIn addition to the discovery outburst, this source also underwent a later, very weak outburst in February of 2010. This activity was not detected by our algorithm. Their doesn’t exist any significant discussion/analysis of the 2010 outburst in the literature. | |||||||
| tThe algorithm was unable to detect IGR J18539+0727 in 2003 as data from the INTEGRAL bulge scan has only been available as of February of 2005. | |||||||
| uThe 2015 outburst was to faint to be detected by the ASMs and therefore was not detected by our algorithm. | |||||||
| vDue to its fast variability (see Section II), the algorithm was unable to detect any of the known activity in this source. | |||||||
| Continued on Next Page… | |||||||
| Table 4 – Continued | |||||||
|---|---|---|---|---|---|---|---|
| Source Name | a | a | Outburst | Literatureb | Algorithm b | Instrument y | Referencesz |
| ID | Class | Class | Detection | ||||
| wThese outbursts were in progress as of May 14, 2015 (the cut-off date for our analysis). | |||||||
| xThese outbursts began after May 14, 2015, and therefore are not included in our analysis. | |||||||
| yList of instruments which have detected the outburst. Bold indicates instrument(s) which have been detected above the detection threshold by the algorithm. A-2-Cosmic X-ray Experiment (CXE) involving six separate proportional counters aboard the High Energy Astronomy Observatory (HEAO) 1, A-3 - Modulation Colliamtor (MC) aboard HEAO 1, A-4 - Hard X-Ray/Low Energy Gamma Ray Experiment aboard HEAO 1, ANS - medium energy detector aboard the Astronomical Netherlands Satellite (ANS), ART-P - ART-P telescope aboard GRANAT, ASM - All-Sky Monitor aboard Rossi X-Ray Timing Explorer (RXTE), Ariel V/ASM - ASM aboard Ariel V Satellite, ArielVI - two Proportional Counters aboard the Ariel VI Satellite, BAT-Burst Alert Telescope aboard Swift X-Ray Observatory, BATSE - Burst And Transient Source Experiment aboard Compton Gamma-Ray Observatory (CGRO), BBXRT - Broad-Band X-ray Telescope, Chandra - Chandra X-Ray Observatory, CMA - Channel Electron Multiplier detector aboard European X-Ray Observatory Satellite (EXOSAT), EPIC - European Photon Imaging Camera aboard XMM-Newton, GBM - Gamma-Ray Burst Monitor aboard the Fermi Gamma-Ray Space Telescope, GCXSE - Cosmic X-Ray Spectroscopy Experiment aboard Orbiting Solar Observatory (OSO) 8, GINGA/ASM - ASM aboard GINGA satellite, GIS-Gas Imaging Spectrometer aboard Advanced Satellite for Cosmology and Astrophysics (ASCA), GSC - Gas-Slit Camera aboard Monitor of All-Sky Image (MAXI) telescope, GSO - GSO scintillators aboard Suzaku, GSPC- Gas Scintillation Proportional Counter aboard EXOSAT, HAKUCHO - X-Ray detectors aboard the HAKUCHO (CORSA-5b) Satellite, HCO - Photographic Plates Collection at the Harvard College Observatory,HEXE - High Energy X-Ray Experiment aboard the MIr-Kvant Observatory, HEXTE - High Energy X-Ray Timing Experiment aboard RXTE, HRI - High Resolution Imager aboard the Einstein Observatory, HSEM - High Speed Event Monitor aboard the Small Astronomy Satellite (SAS) 3, HRGRS - High Resolution Gamma-Ray Spectrometer aboard HEAO 3, HXD - Hard X-Ray Detector aboard Suzaku, IPC - Image Proportional Counter aboard the Einstein Observatory, ISGRI - Integral Soft Gamma-Ray Imager aboard International Gamma-Ray Astrophysical Observatory (INTEGRAL), IXAE - 3 Proportional Counter’s and 1 Sky Monintor (XSM) aboard the Indian X-ray Astronomy Experiment (IXAE), JEM-X - Two units aboard INTEGRAL, LAC - Large Area Proportional Counter aboard GINGA Satellite, LASS - Large Area Sky Survey Experiment (A-2) aboard HEAO 1, LE - Low Energy Instruments aboard EXOSAT, LECS - Low Energy Concentrator Spectrometer on BeppoSAX, ME - Medium Energy Proportional Counter aboard (EXOSAT), MECS - Medium Energy Concentrator Spectrometer on BeppoSAX, MIT - MIT Cosmic X-Ray Experiment aboard Orbiting Solar Observatory 7 (OSO 7), MPC - Monitor Proportional Counter aboard the Einstein Observatory, MSSL - Mullard Space Science Laboratory X-ray detector aboard the Copernicus Satellite, NFI - Narrow field Instruments aboard BeppoSAX, NuSTAR - Nuclear Spectroscopic Telescope Array, OSSE- Oriented Scintillation Spectrometer Experiment aboard CGRO, PCA - Proportional counter array aboard RXTE, PCS - High resolution proportional counter array aboard the Ariel V Satellite, PDS - Phoswich Detector System, PSPC - Position Sensitive Proportional Counter aboard ROentgen SATellite (ROSAT), RGS - Reflection Grating Spectrometer abaod XMM-Newton, ROSAT HRI - The high Resolution IMages aboard ROSAT, SIS - Solid-state Imaging Spectrometer aboard ASCA, ROSAT/XRT - X-ray Telescope aboard ROSAT, SAI - photographic plates at the Sternberg Astronomical Institute, SIGMA - hard X-ray and low-energy gamma-ray telescope aboard GRANAT, SO - Photographic plates at the Sonnenberg Observatory,SpaceLab2 - XRT aboard Space Lab 2 Satellite, SPI - Spectrometer for INTEGRAL, RMC - Rotation Modulation Collimator aboard the Ariel V Satellite, Skylark - X-Ray detectors aboard the Skylark rockets, SSI - Sky Survey Instrument aboard Ariel V Satellite, SSS - Solid State Spectrometer aboard the Einstein Observatory, Tenma - Proportional Counters aboard the Tenma (ASTRO B) Satellite, TTM - a coded mask imaging spectrometer / wide-angle camera aboard the MIr-Kvant Observatory UHURU - two proportional counters aboard UHURU Satellite, VELA5B - ASM aboard VELA 5B Satellite, WATCH - ASM aboard GRANAT Satellite, WFC - Wide Field Camera aboard BeppoSAX, XC - Scintillation X-ray Detector aboard Vela 5B Satellite, XIS - X-ray Imaging Spectrometer aboard Suzaku, XRT - X-Ray telescope aboard Swift | |||||||
| zReferences. — [1] Matilsky et al. (1972), [2] Kitamoto et al. (1984), [3] Harmon et al. (1992), [4] Park et al. (2004), [5] Priedhorsky (1986), [6] Jones et al. (1976), [7] Kuulkers et al. (1997a), [8] Parmar et al. (1997), [9] Parmar et al. (1986), [10] Parmar et al. (1995), [11] Trudolyubov et al. (2001), [12] Tomsick & Kaaret (2000), [13] Oosterbroek et al. (1998), [14] Tomsick et al. (2005), [15] Tomsick (2005), [16] Kalemci et al. (2008), [17] Tomida et al. (2009), [18] Nakahira et al. (2011), [19] Abe et al. (2005), [20] Neilsen et al. (2014), [21] Zhang et al. (1997), [22] Brocksopp et al. (2006), [23] Sobczak et al. (1999), [24] Cui et al. (1997a), [25] Borozdin et al. (1998), [26] Borozdin & Trudolyubov (2000), [27] Krimm et al. (2014b), [28] Brocksopp et al. (2001), [29] Markert et al. (1973), [30] Motch et al. (1985), [31] Miyamoto et al. (1991), [32] Harmon et al. (1994b), [33] Trudolyubov et al. (1998), [34] Rubin et al. (1998), [35] Kong et al. (2002),[36] Belloni et al. (1999a), [37] Zdziarski et al. (2004), [38] Dieters et al. (2000), [39] Belloni et al. (2006), [40] Buxton et al. (2012), [41] Motta et al. (2009), [42] Debnath et al. (2013b),[43] Belloni et al. (2013), [44] Reynolds et al. (1999), [45] Emelyanov et al. (2000), [46] Capitanio et al. (2005), [47] Miller et al. (2006c), [48] Kalemci et al. (2006), [49] McClintock et al. (2009), [50] Homan et al. (2005), [51] Capitanio et al. (2006), [52] Capitanio et al. (2009a), [53] Motta et al. (2010), [54] Chen et al. (2010), [55] Capitanio et al. (2010), [56] Zhou et al. (2013), [57] Miller-Jones et al. (2012), [58] Doxsey et al. (1977), [59] Cooke et al. (1984), [60] Coriat et al. (2011), [61] Debnath et al. (2013a), [62] Negoro et al. (2012), [63] Shidatsu et al. (2012), [64] Nakahira et al. (2013), [65] Revnivtsev et al. (2003), [66] in’t Zand et al. (2003), [67] Lutovinov & Revnivtsev (2003), [68] Capitanio et al. (2006), [69] Capitanio et al. (2012), [70] Altamirano et al. (2011c), [71] Barlow et al. (2005), [72] Sidoli et al. (2011), [73] Capitanio et al. (2009b), [74] Kitamoto et al. (1990b), [75] Makino (1987), [76] Markwardt et al. (2008b), [77] Shaw et al. (2008), [78] Krimm et al. (2008b), [79] Rodriguez et al. (2007), [80] Walter et al. (2007), [81] Paizis et al. (2009), [82] Negoro et al. (2015a), [83] Tanaka et al. (2014), [84] Morihana et al. (2013), [85] Shidatsu et al. (2013), [86] Stiele et al. (2012), [87] Yamaoka et al. (2012), [88] Kennea et al. (2011a), [89] Kuulkers et al. (2013), [90] Ferrigno et al. (2011), [91] Reis et al. (2012), [92] Russell et al. (2014a), [93] in’t Zand et al. (2002c), [94] in ’t Zand et al. (1999), [95] Markwardt et al. (1999b), [96] Wijnands & van der Klis (2000), [97] Hjellming et al. (2000), [98] Hjellming (2000), [99] Uemura et al. (2004), [100] Bailyn et al. (2003), [101] Rupen et al. (2003c), [102] Maitra & Bailyn (2006), [103] Swank (2004), [104] in’t Zand et al. (2000), [105] Revnivtsev et al. (2002), [106] Cackett & Miller (2007), [107] Yamaoka et al. (2008), [108] Yamaoka & Nakahira (2010), [109] Yamaoka et al. (2010b), [110] Yamaoka et al. (2010a), [111] Tachibana et al. (2014a), [112] Skinner et al. (1990), [113] Markwardt (2003b), [114] Remillard & Levine (2003), [115] Lutovinov et al. (2003a), [116] Homan & Wijnands (2003), [117] Markwardt & Swank (2007), [118] Kennea et al. (2007), [119] Kuulkers et al. (2008), [120] Ozawa et al. (2011), [121] Krimm et al. (2011b), [122] Krimm et al. (2013b), [123] Curran et al. (2014), [124] Markwardt et al. (2008a), [125] Krimm et al. (2008d), [126] Armas Padilla et al. (2013a), [127] Armas Padilla et al. (2013b), [128] Kimura et al. (2012), [129] Nakahira et al. (2012b), [130] Bodaghee et al. (2012), [131] Reis et al. (2013), [132] Read et al. (2010a), [133] Markwardt et al. (2010), [134] Read et al. (2010b), [135] Armas Padilla et al. (2010a), [136] Armas Padilla et al. (2010b), [137] Revnivtsev et al. (2000c), [138] Revnivtsev et al. (1998a), [139] Goldoni et al. (1999), [140] Belloni et al. (1999a), [141] Bartlett et al. (2013), [142] Frontera et al. (1998), [143] Simon et al. (2006), [144] Hynes et al. (2000b), [145] McClintock et al. (2001b), [146] Brocksopp et al. (2010b),[147] Frontera et al. (2001), [148] Brocksopp et al. (2010b), [149] Zurita et al. (2006), [150] Sobczak et al. (2000), [151] Remillard et al. (2002), [152] Kubota & Makishima (2004), [153] Rodriguez et al. (2004), [154] Kalemci et al. (2001), [155] Miller et al. (2001b) [156] Tomsick et al. (2001a), [157] Tomsick et al. (2001b),[158] Belloni et al. (2002),[159] Sturner & Shrader (2005), [160] Aref’ev et al. (2004), [161] Corbel et al. (2004), [162] Rossi et al. (2004), [163] Tomsick et al. (2004), [164] Homan et al. (2003a), [165] Kalemci et al. (2003), [166] Han et al. (2011), [167] Hiemstra et al. (2011), [168] Cadolle Bel et al. (2004), [169] Brocksopp et al. (2005), [170] Turler et al. (2005a), [171] Turler et al. (2005b), [172] Kong (2005), [173] Kennea et al. (2005), [174] Munoz-Darias et al. (2010), [175] Stiele et al. (2011), [176] Curran et al. (2011b), [177] Chun et al. (2013), [178] Cackett et al. (2006), [179] Markwardt et al. (2008d), [180] Torres et al. (2008b), [181] Sala et al. (2007), | |||||||
| Continued on Next Page… | |||||||
| Table 4 – Continued | |||||||
|---|---|---|---|---|---|---|---|
| Source Name | a | a | Outburst | Literatureb | Algorithm b | Instrument y | Referencesz |
| ID | Class | Class | Detection | ||||
| zReferences. (cont.) — [182] Sriram et al. (2013a), [183] Roy et al. (2011), [184] Gierlinski et al. (2009), [185] Cadolle Bel et al. (2009), [186] Zurita Heras et al. (2011),[187] Remillard (1999), [188] Sala et al. (2008), [189] Marshall et al. (1996), [190] Barret et al. (1996b), [191] Casella et al. (2004), [192] Farinelli et al. (2013), [193] Cui et al. (2000), [194] in’t Zand et al. (2002b), [195] Gogus et al. (2004), [196] Jonker et al. (2004), [197] Krimm et al. (2013c), [198] Krimm et al. (2013a), [199] Miller-Jones et al. (2013a), [200] Coriat et al. (2013b), [201] Vasiliev et al. (2000), [202] Campana et al. (2002), [203] Markwardt et al. (2008c), [204] Wijnands et al. (2008), [205] Armas-Padilla et al. (2011), [206] Degenaar et al. (2008a), [207] Markwardt & Swank (2008), [208] Degenaar et al. (2008b), [209] Degenaar & Wijnands (2008), [210] Karasev et al. (2007), [211] Karasev et al. (2008), [212] Krimm et al. (2010), [213] Cadolle Bel et al. (2007), [214] Soleri et al. (2012), [215] Shaw et al. (2013), [216] Mostafa et al. (2013), [217] Froning et al. (2014), [218] Zurita et al. (2008), [219] Miller et al. (2006a), [220] Lutovinov et al. (2003b), [221] Lutovinov & Revnivtsev (2003), [222] Paizis et al. (2007b). [223] Markwardt et al. (2007), [224] Cheung (2007), [225] Bernardini et al. (2015), [226] Grebenev et al. (2007), [227] Capitanio et al. (2009b), [228] Suzuki et al. (2015), [229] Sanna et al. (2015), [230] Rushton et al. (2015), [231] Krivonos et al. (2005), [232] Sguera et al. (2007), [233] Griffiths et al. (1978), [234] Watson et al. (1978), [235] Griffiths et al. (1977), [236] Kaluzienski & Holt (1977), [237] Richer (1987), [238] Zycki et al. (1999), [239] Kitamoto et al. (1989), [240] Han & Hjellming (1992), [241] Oosterbroek et al. (1997), [242] Brocksopp et al. (2004), [243] Tsunemi et al. (1989), [244] Kitamoto et al. (1992), [245] Greiner et al. (1996), [246] Castro-Tirado et al. (1994), [247] Paul et al. (1997), [248] Paul et al. (1998), [249] Harmon et al. (1994a), [250] Foster et al. (1996), [251] Belloni et al. (1997), [252] Fender et al. (1999b), [253] Mirabel & Rodríguez (1994), [254] Belloni & Altamirano (2013), [255] Neilsen et al. (2011), [256] Ueda et al. (1997), [257] Francey (1971), [258] Markert et al. (1979), [259] Revnivtsev et al. (2000a), [260] Revnivtsev et al. (2000b), [261] Borozdin et al. (1995), [262] Vargas et al. (1996), [263] Revnivtsev et al. (1998b), [264] van der Hooft et al. (1999b), [265] Lapshov et al. (1993), [266] Kaniovsky et al. (1993), [267] Filippenko et al. (1999), [268] Yamauchi & Koyama (1990), [269] Yamauchi & Nakamura (2004), [270] Shrader et al. (1997), [271] Sunyaev et al. (1994), [272] Callanan et al. (1995), [273] Shrader et al. (1994), [274] van der Hooft et al. (1999a), [275] Parmar et al. (1993), [276] Branduardi et al. (2001), [277] Eyles et al. (1975), [278] Kaluzienski et al. (1975), [279] Barret et al. (1992), [280] Barret et al. (1995), [281] Eachus et al. (1976), [282] Elvis et al. (1975), [283] Brocksopp et al. (2007), [284] Sunyaev et al. (1991a), [285] Sunyaev et al. (1991c), [286] Skinner et al. (1991), [287] Bazzano et al. (1992), [288] Cordier et al. (1993), [289] Churazov et al. (1993), [290] Cordier et al. (1994), [291] Jung et al. (1995), [292] Smith et al. (1997), [293] Main et al. (1999), [294] del Santo et al. (2004), [295] Natalucci et al. (2014), [296] Haardt et al. (2001), [297] Yao et al. (2005), [298] Wilms et al. (2001), [299] Smale & Boyd (2012), [300] Plant et al. (2014), [301] White & Marshall (1984), [302] Steiner et al. (2014), [303] Nowak et al. (2001), [304] Nowak & Wilms (1999), [305] Maitra et al. (2013), [306] Yaqoob et al. (1993), [307] Wijnands et al. (2002), [308] Ricci et al. (1995), [309] Nowak et al. (2008), [310] Grinberg et al. (2013), [311] Grinberg et al. (2014b), [312] Gierlinski et al. (2010), [313] Gierlinski et al. (1997), [314] Belloni & Hasinger (1990), [315] Tananbaum et al. (1972), [316] Gleissner et al. (2004), [317] Holt et al. (1979), [318] Ubertini et al. (1991a), [319] Ubertini et al. (1991b), [320] Wilms et al. (2006), [321] Miyamoto et al. (1992), [322] Zdziarski et al. (2002), [323] Pottschmidt et al. (2003), [324] Ling et al. (1983), [325] Barr & van der Woerd (1990), [326] Kitamoto et al. (1990a), [327] Smith et al. (2001), [328] Pottschmidt et al. (2006), [329] Mereghetti et al. (1997), [330] Smith et al. (1997), [331] Mereghetti et al. (1994), [332] Gilfanov et al. (1993), [333] White et al. (1988), [334] Kaaret et al. (2006), [335] Pan et al. (1995), [336] White et al. (1984), [337] Hjellming et al. (1999c), [338] Cui et al. (2000), [339] Nandi et al. (2005), [340] Brinkmann et al. (1989), [341] Brinkmann et al. (1991), [342] Grindlay et al. (1984), [343] Band (1989), [344] Treves et al. (1988), [345] Ebisawa et al. (1993), [346] Ishibashi et al. (2010), [347] Sunyaev et al. (1997), [348] Heise (1997), [349] Trudolyubov et al. (1997), [350] Greiner et al. (1997), [351] Jonker et al. (2010), [352] Harmon et al. (1998),[353] Reis et al. (2011), [354] Díaz Trigo et al. (2013), [355] Brocksopp et al. (2002), [356] Watson et al. (1986), [357] Marshall et al. (1979), [358] Ricketts et al. (1981), [359] Yuan et al. (1995), [360] Matsuoka et al. (1986), [361] Kotani et al. (1994), [362] Marshall et al. (2002), [363] Namiki et al. (2003), [364] Seward et al. (1986), [365] Greiner & Reid (1993), [366] Greiner et al. (1994), [367] Giacconi et al. (1974), [368] Singh et al. (1994), [369] Marshall et al. (1993), [370] Ebisawa et al. (1996), [371] Priedhorsky et al. (1983), [373] Nolan & Matteson (1983), [374] Nolan et al. (1983), [375] Dolan et al. (1979), [376] Doebereiner et al. (1989), [377] Ubertini et al. (1991b), [378] Miyamoto & Kitamoto (1989), [379] Ling et al. (1987), [380] Bailyn & Orosz (1995), [382] Remillard et al. (2000), [383] Wren & McKay (2000), [384] Uemura et al. (2000b), [385] Homan et al. (2001), [386] Cui et al. (1999), [387] Remillard et al. (1999a), [388] Swank et al. (2002), [389] Saito et al. (2006), [390] Shaposhnikov et al. (2007), [391] Remillard et al. (1999b), [392] Motta et al. (2012), [393] Tomsick et al. (1999), [394] Hjellming et al. (1996b), [395] Ricketts et al. (1975), [396] Ebisawa et al. (1994), [397] Motch et al. (1998), [398] (Krimm et al., 2009b), [399] Buxton et al. (2013b), [400] Pawar et al. (2013a), [401] Miller-Jones et al. (2013b), [402] Pawar et al. (2013b), [403] Yan et al. (2014), [404] Filippova et al. (2014b), [405] Krimm et al. (2014a), [406] Shidatsu et al. (2014), [407] Ducci et al. (2014), [408] Barsukova et al. (2014), [409] Kalemci et al. (2014), [405] Atapin et al. (2015), [406] Chenevez et al. (2014b), [407] Chenevez et al. (2014a), [408] Tendulkar et al. (2014), [409] Takagi et al. (2015), [410] Pawar et al. (2015), [411] Wang et al. (2015), [412] Yoshikawa et al. (2015), [413] Zhang et al. (2015b), [414] Cabellero Garcia et al. (2007), [415] Joinet et al. (2008), [416] Migliari et al. (2007), [417] Diaz Trigo et al. (2007), [418] Prat et al. (2009), [419] Zhang et al. (2015a), [420] Neilsen et al. (2015), [421] Miller et al. (2015a), [422] Miller et al. (2015b), [423] Russell & Lewis (2015), [424] Coriat et al. (2015), [425] Ambrosino et al. (2015), [426] Arkharov et al. (2015), [427] Balam & Graham (2015), [428] Beardmore et al. (2015), [429] Blay et al. (2015), [430] Broderick et al. (2015), [431] Caballero-Garcia et al. (2015b), [432] Caballero-Garcia et al. (2015a), [433] Carrasco et al. (2015), [434] Chen et al. (2015), [435] Domingo et al. (2015), [436] Ferrigno et al. (2015b), [437] Ferrigno et al. (2015a), [437] Gandhi et al. (2015a), [439] Gandhi et al. (2015b), [440] Garner et al. (2015), [441] Gazeas et al. (2015), [442] Hardy et al. (2015), [443] Hynes et al. (2015a), [444] Hynes et al. (2015b), [445] Itoh et al. (2015), [446] Jenke et al. (2015), [447] Kassim et al. (2015), [448] King et al. (2015), [449] Knigge et al. (2015a), [450] Knigge et al. (2015b), [451] Kuulkers et al. (2015), [452] Kuulkers (2015a), [453] Kuulkers (2015b), [454] Lipunov et al. (2015), [455] Martin-Carrillo et al. (2015b), [456] Martin-Carrillo et al. (2015a), [457] Mooley et al. (2015b), [458] Mooley et al. (2015a), [459] Motta et al. (2015b), [460] Motta et al. (2015c), [461] Motta et al. (2015a), [462] Munoz-Darias et al. (2015b), [463] Munoz-Darias et al. (2015a), [464] Negoro et al. (2015b), [465] Oates et al. (2015), [466] Panopoulou et al. (2015), [467] Prosvetov & Grebenev (2015), [468] Rodriguez et al. (2015), [469] Roques et al. (2015), [470] Scarpaci & Maitra (2015), [471] Scarpaci et al. (2015), [472] Segreto et al. (2015), [473] Shaw et al. (2015), [474] Sivakoff et al. (2015a), [475] Sivakoff et al. (2015b), [476] Sivakoff et al. (2015c), [477] Sonka et al. (2015), [478] Terndrup et al. (2015), [479] Tetarenko et al. (2015a), [480] Tetarenko et al. (2015b), [481] Tetarenko et al. (2015c), [482] Trushkin et al. (2015b), [483] Trushkin et al. (2015a), [484] Tsubono et al. (2015a), [485] Tsubono et al. (2015b), [486] Tudose et al. (2015), [487] Wagner et al. (2015), [488] Walton et al. (2015a), [489] Walton et al. (2015b), [490] Wiersema (2015), [491] Yoshii et al. (2015), [492] Altamirano et al. (2015), [493] Tachibana et al. (2014b), [494] Uemura et al. (2014), [495] Koljonen et al. (2015), [496] Yan et al. (2015), [497] Muno et al. (2005b), [498] Belanger et al. (2005),[499] Hjalmarsdotter et al. (2008), [500] Szostek & Zdziarski (2008), [501] Szostek et al. (2008), [502] Koljonen et al. (2010) | |||||||
| Source Name | Outburst | a | b | c | c | d | e | f | g | h | i |
|---|---|---|---|---|---|---|---|---|---|---|---|
| ID | (days) | ( erg) | ( erg/s) | () | ( erg/s) | ( erg/s) | (days) | (days) | (days) | (days) | |
| XTEJ0421+560 | 1998 | 50 | 5.2 1.2 | - | 4 | 0 | 4 | 42 | |||
| 4U0538641 | 1996-1999* | 1131 | 9830 130 | 127 | 867 | 123 | 14 | ||||
| 1999/2000* | 326 | 2904 64 | 123 | 117 | 56 | 30 | |||||
| 2000/2001* | 390 | 3658 86 | 281 | 41 | 44 | 24 | |||||
| 2001-2003* | 585 | 4850 98 | 263 | 92 | 224 | 6 | |||||
| 2003* | 255 | 2097 73 | - | 170 | 0 | 69 | 16 | ||||
| 2004-2011* | 2794 | 25110 240 | 56 | 2269 | 336 | 133 | |||||
| 2012-2015* | 1198 | 11330 230 | 211 | 197 | 672 | 118 | |||||
| 4U0540697 | 1996-2015* | 7064 | 53460 380 | 965 | 2436 | 3578 | 89 | ||||
| XTEJ1118+480 | 1999/2000 | 203 | 3.043 0.062 | - | 186 | 0 | 0 | 17 | |||
| MAXIJ1305704 | 2012* | 182 | 35.7 4.2 | - | 83 | 0 | 9 | 90 | |||
| SWIFTJ1357.20933 | 2011* | 78 | 3.85 0.78 | - | 24 | 0 | 0 | 54 | |||
| GS135464 | 1997/1998 | 157 | 1600 200 | - | 109 | 0 | 0 | 48 | |||
| SWIFTJ1539.26227 | 2008/2009 | 175 | 42.2 4.7 | 35 | 50 | 41 | 49 | ||||
| MAXIJ1543564 | 2011* | 175 | 30.3 3.4 | 30 | 1 | 34 | 110 | ||||
| 4U1543475 | 2002 | 135 | 2.45 0.11 | 20 | 37 | 5 | 73 | ||||
| XTEJ1550564 | 1998/1999 | 255 | 65.7 2.2 | 5 | 218 | 23 | 9 | ||||
| 2000 | 123 | 26.0 1.4 | 53 | 13 | 26 | 31 | |||||
| 2001* | 53 | 4.03 0.33 | - | 32 | 0 | 1 | 20 | ||||
| 2001/2002* | 52 | 7.99 0.64 | - | 33 | 0 | 0 | 19 | ||||
| 2003 | 51 | 8.44 0.48 | - | 29 | 0 | 0 | 22 | ||||
| 4U1630472 | 1996* | 200 | 67.5 6.9 | 116 | 33 | 6 | 45 | ||||
| 1998 | 240 | 56.1 7.0 | 33 | 10 | 57 | 140 | |||||
| 1999* | 176 | 58.4 6.8 | 13 | 50 | 26 | 87 | |||||
| 2000/2001* | 234 | 83.7 7.8 | 23 | 106 | 67 | 38 | |||||
| 2002-2004 | 821 | 487 22 | 6 | 653 | 123 | 39 | |||||
| 2005/2006* | 177 | 63.8 6.3 | 21 | 131 | 3 | 22 | |||||
| 2007/2008* | 200 | 29.1 3.3 | 4 | 152 | 12 | 32 | |||||
| 2009/2010 | 252 | 46.9 4.2 | 10 | 125 | 93 | 24 | |||||
| 2011-2013* | 729 | 499 23 | 152 | 155 | 340 | 82 | |||||
| 2015* | 125 | 69.1 8.3 | 21 | 74 | 9 | 21 | |||||
| XTEJ1650500 | 2001/2002 | 218 | 0.986 0.076 | 114 | 64 | 7 | 33 | ||||
| XTEJ1652453 | 2009* | 159 | 15.5 2.2 | 71 | 49 | 11 | 28 | ||||
| GROJ165540 | 1996/1997 | 507 | 190.5 4.7 | 28 | 441 | 9 | 29 | ||||
| 2005 | 240 | 2.03 0.23 | 38 | 186 | 6 | 10 | |||||
| MAXIJ1659152 | 2010/2011 | 159 | 31.9 4.4 | 7 | 29 | 114 | 9 | ||||
| GX3394 | 1996-1999* | 1040 | 893 25 | 489 | 291 | 163 | 97 | ||||
| 2002/2003 | 401 | 555 21 | 38 | 293 | 42 | 28 | |||||
| 2004/2005* | 462 | 251 11 | 144 | 235 | 33 | 50 | |||||
| 2006* | 126 | 34.5 5.0 | - | 98 | 0 | 0 | 28 | ||||
| 2006/2007 | 339 | 181.3 9.8 | 181 | 90 | 5 | 63 | |||||
| 2008* | 125 | 114 13 | - | 78 | 0 | 0 | 47 | ||||
| 2009* | 150 | 0.96 0.62 | - | 116 | 0 | 0 | 34 | ||||
| 2009-2011* | 484 | 349 12 | 110 | 215 | 84 | 75 | |||||
| 2013* | 104 | 59.1 5.3 | - | 42 | 0 | 0 | 62 | ||||
| 2014/2015* | 244 | 227 11 | 93 | 47 | 54 | 50 | |||||
| IGRJ170913624 | 2011-2013 | 823 | 86 10 | 8 | 117 | 154 | 544 | ||||
| SAXJ1711.63808 | 2001 | 140 | 27.2 3.8 | - | 65 | 0 | 0 | 75 | |||
| XMMSL1J171900.4353217 | 2007a | 129 | 0.286 0.050 | - | 107 | 0 | 0 | 22 | |||
| 2008/2009 | 242 | 0.526 0.072 | - | 218 | 0 | 0 | 24 | ||||
| 2009/2010 | 405 | 1.49 0.12 | - | 342 | 0 | 0 | 63 | ||||
| XTEJ1720318 | 2003 | 189 | 6.50 0.89 | 89 | 58 | 31 | 11 | ||||
| XTEJ1727476 | 2005* | 54 | 7.5 1.7 | 2 | 8 | 6 | 38 | ||||
| IGRJ172852922 | 2010 | 88 | 1.05 0.22 | - | 56 | 0 | 4 | 28 | |||
| IGRJ173793747 | 2008 | 21 | 0.181 0.064 | - | 10 | 0 | 0 | 11 | |||
| GRS173731 | 1997 | 101 | 25.1 3.0 | - | 40 | 0 | 1 | 60 | |||
| GRS1739278 | 1996 | 252 | 131.2 9.7 | 151 | 34 | 67 | 0 | ||||
| 2014/2015 | 431 | 9.17 0.92 | 190 | 164 | 45 | 32 | |||||
| 1E1740.72942 | 1996-2002* | 2390 | 303.6 9.8 | 2229 | 9 | 136 | 16 | ||||
| 2003/2004* | 400 | 29.0 3.0 | - | 373 | 0 | 0 | 27 | ||||
| 2005/2006* | 394 | 30.6 2.5 | - | 383 | 0 | 10 | 1 | ||||
| 2006/2007* | 393 | 29.0 2.5 | - | 322 | 0 | 59 | 12 | ||||
| 2007-2013* | 1954 | 114.1 3.7 | 370 | 10 | 1318 | 256 | |||||
| 2013 | 85 | 1.89 0.29 | - | 35 | 0 | 0 | 50 | ||||
| 2014/2015 | 446 | 10.53 0.71 | - | 392 | 0 | 3 | 51 | ||||
| SWIFTJ174510.8262411 | 2012/2013 | 286 | 15.9 1.7 | - | 205 | 0 | 0 | 81 | |||
| H1743322 | 2003 | 233 | 81.3 7.8 | 11 | 162 | 37 | 23 | ||||
| 2004 | 126 | 27.1 3.8 | 39 | 51 | 16 | 20 | |||||
| 2005 | 80 | 12.6 1.8 | 10 | 6 | 31 | 33 | |||||
| 2007/2008* | 68 | 15.4 3.1 | 34 | 18 | 3 | 13 | |||||
| 2008* | 100 | 22.6 3.0 | - | 56 | 0 | 1 | 43 | ||||
| 2009* | 101 | 48.3 5.3 | 33 | 5 | 20 | 43 | |||||
| 2009/2010 | 88 | 17.4 2.4 | - | 41 | 0 | 9 | 38 | ||||
| 2010* | 102 | 19.3 2.3 | 32 | 7 | 19 | 44 | |||||
| 2010/2011* | 265 | 28.7 3.1 | - | 43 | 0 | 11 | 211 | ||||
| 2011/2012* | 77 | 40.0 5.1 | - | 48 | 0 | 0 | 29 | ||||
| 2012/2013* | 122 | 69.1 8.7 | - | 42 | 0 | 0 | 80 | ||||
| 2013 | 75 | 16.3 2.3 | - | 47 | 0 | 3 | 25 | ||||
| 2014/2015* | 130 | 77.7 7.1 | - | 59 | 0 | 0 | 71 | ||||
| XTEJ1748288 | 1998 | 78 | 30.7 5.2 | - | 53 | 0 | 0 | 25 | |||
| IGRJ174972821 | 2006* | 99 | 3.65 0.65 | - | 43 | 0 | 0 | 56 | |||
| SLX1746331 | 2003 | 255 | 10.5 1.2 | 108 | 62 | 53 | 32 | ||||
| 2007/2008 | 215 | 7.5 1.0 | 48 | 162 | 0 | 5 | |||||
| XTEJ1752223 | 2009/2010* | 333 | 6.03 0.30 | 134 | 94 | 63 | 42 | ||||
| SWIFTJ1753.50127 | 2005-2015* | 3627 | 495 12 | - | 1026 | 0 | 2517 | 84 | |||
| XTEJ1755324 | 1997* | 125 | 25.7 3.8 | 50 | 32 | 17 | 26 | ||||
| GRS1758258 | 1996-2001* | 1875 | 249.9 8.6 | 503 | 23 | 1329 | 20 | ||||
| 2002-2015* | 4856 | 394.9 7.8 | 1570 | 78 | 3176 | 32 | |||||
| XTEJ1812182 | 2003 | 55 | 18.8 3.5 | - | 34 | 0 | 0 | 21 | |||
| 2008 | 60 | 2.64 0.55 | 4 | 39 | 3 | 14 | |||||
| XTEJ1817330 | 2006* | 253 | 2.47 0.44 | 90 | 110 | 21 | 32 | ||||
| XTEJ1818245 | 2005* | 126 | 2.73 0.26 | 1 | 57 | 19 | 49 | ||||
| SAXJ1819.32525 | 1999/2000* | 392 | 0.934 0.083 | 150 | 53 | 13 | 176 | ||||
| 2005/2006 | 213 | 0.243 0.021 | - | 193 | 0 | 0 | 20 | ||||
| 2006/2007* | 345 | 0.728 0.063 | - | 333 | 0 | 0 | 12 | ||||
| 2008 | 67 | 0.088 0.016 | - | 54 | 0 | 0 | 13 | ||||
| 2008/2009* | 252 | 0.707 0.071 | - | 224 | 0 | 0 | 28 | ||||
| 2009/2010 | 569 | 1.164 0.084 | 268 | 1 | 242 | 58 | |||||
| 2013/2014* | 154 | 32.3 2.2 | 10 | 4 | 101 | 39 | |||||
| MAXIJ1836194 | 2011/2012* | 362 | 72.8 7.5 | - | 353 | 0 | 0 | 9 | |||
| SWIFTJ1842.51124 | 2008/2009* | 228 | 18.8 2.1 | 70 | 26 | 40 | 92 | ||||
| XTEJ1856+053 | 1996a* | 27 | 3.9 1.1 | 2 | 8 | 10 | 7 | ||||
| 1996b* | 100 | 13.4 2.1 | 25 | 24 | 20 | 31 | |||||
| 2007 | 202 | 37.9 3.6 | 11 | 78 | 68 | 45 | |||||
| 2009 | 25 | 0.147 0.065 | - | 14 | 0 | 5 | 6 | ||||
| XTEJ1859+226 | 1999/2000 | 225 | 72.7 6.8 | 48 | 101 | 3 | 73 | ||||
| XTEJ1908+094 | 2002/2003* | 424 | 51.6 3.3 | 291 | 8 | 59 | 66 | ||||
| 2013/2014* | 200 | 82 10 | - | 121 | 0 | 5 | 74 | ||||
| SWIFTJ1910.20546 | 2012/2013* | 270 | 57.6 4.9 | 52 | 24 | 138 | 56 | ||||
| SS433 | 1996 | 147 | 6.68 0.56 | - | 59 | 0 | 0 | 88 | |||
| 1997 | 198 | 16.95 0.92 | - | 181 | 0 | 0 | 17 | ||||
| 1998a | 102 | 9.48 0.50 | - | 79 | 0 | 0 | 23 | ||||
| 1998b | 90 | 6.50 0.56 | - | 55 | 0 | 0 | 35 | ||||
| 1999/2000* | 565 | 51.1 1.4 | - | 504 | 0 | 0 | 61 | ||||
| 2001* | 302 | 34.0 1.6 | - | 260 | 0 | 0 | 42 | ||||
| 2002/2003 | 302 | 31.3 1.7 | - | 199 | 0 | 0 | 103 | ||||
| 2003 | 106 | 10.14 0.88 | - | 29 | 0 | 0 | 77 | ||||
| 2003/2004* | 431 | 44.8 2.0 | - | 365 | 0 | 0 | 66 | ||||
| 2005/2006* | 406 | 42.2 3.0 | - | 358 | 0 | 0 | 48 | ||||
| 2006-2015* | 3230 | 145.0 2.0 | 2733 | 26 | 423 | 48 | |||||
| GRS1915+105 | 1996-2015* | 7068 | 38200 210 | 2214 | 2707 | 2147 | 0 | ||||
| 4U1956+350 | 1996-2015 | 7069 | 1143.3 2.3 | 5409 | 615 | 1045 | 0 | ||||
| 4U1957+115 | 1996-2015* | 7020 | 952 16 | 598 | 5392 | 1022 | 8 | ||||
| XTEJ2012+381 | 1998* | 202 | 24.8 2.8 | 40 | 92 | 37 | 33 | ||||
| 4U2030+40 | 1996-2015* | 7069 | 8995 51 | 3034 | 1484 | 2319 | 232 | ||||
| NOTE 1.– This table is also available in machine readable format online at the Astrophysical Journal and on the WATCHDOG website - | |||||||||||
| http://astro.physics.ualberta.ca/WATCHDOG/. | |||||||||||
| NOTE 2. – “-” and or “-” and , indicate the minimum requirement of two different bands (one hard and one soft) for the spectral | |||||||||||
| modelling process has not been met. A “*” beside the outburst year marks those outbursts which contain day in which our spectral modelling algorithm has | |||||||||||
| failed. As such the peak luminosities quoted in these cases may not be accurate. | |||||||||||
| aIndicates the duration of the outburst in days. | |||||||||||
| bIndicates the total amount of energy released during outburst. | |||||||||||
| cIndicates the peak (bolometric) luminosity reached during outburst. | |||||||||||
| dIndicates the peak (bolometric) luminosity reached when the source was in the (HCS). | |||||||||||
| eIndicates the peak (bolometric) luminosity reached when the source was in the (SDS). | |||||||||||
| fIndicates the total time the source spends in the HCS measured in days. | |||||||||||
| gIndicates the total time the source spends in the SDS measured in days. | |||||||||||
| hIndicates the total time the source spends in transition between the HCS and the SDS measured in days. | |||||||||||
| iIndicates the total amount of time we do not have sufficient data to determine state of the source. | |||||||||||
| Source Name | Outburst | Stage | State(s) | a | a | b |
|---|---|---|---|---|---|---|
| ID | (MJD) | (MJD) | (days) | |||
| GX3394 | 1996-1999 | rise | - | 50259 | 50272 | 13 |
| rise | HCS | 50272 | 50612 | 340 | ||
| transition | HCS IMS HCS | 50612 | 50692 | 80 | ||
| rise | HCS | 50692 | 50711 | 19 | ||
| decline | HCS | 50711 | 50815 | 104 | ||
| transition | HCS SDS | 50815 | 50830 | 15 | ||
| decline | SDS | 50830 | 50921 | 91 | ||
| transition | SDS IMS SDS | 50921 | - | 1 | ||
| decline | SDS | 50922 | 51053 | 131 | ||
| transition | SDS IMS SDS | 51053 | - | 1 | ||
| decline | SDS | 51054 | 51123 | 69 | ||
| transition | SDS HCS | 51123 | 51189 | 66 | ||
| decline | HCS | 51189 | 51215 | 26 | ||
| decline | - | 51215 | 51299 | 84 | ||
| 2002/2003 | rise | - | 52350 | 52366 | 16 | |
| rise | HCS | 52366 | 52401 | 35 | ||
| transition | HCS SDS | 52401 | 52406 | 5 | ||
| rise | SDS | 52406 | 52467 | 61 | ||
| decline | SDS | 52467 | 52693 | 226 | ||
| transition | SDS IMS SDS | 52693 | 52695 | 2 | ||
| decline | SDS | 52695 | 52701 | 6 | ||
| transition | SDS HCS | 52701 | 52736 | 35 | ||
| decline | HCS | 52736 | 52739 | 3 | ||
| decline | - | 52739 | 52751 | 12 | ||
| 2004/2005 | rise | - | 53054 | 53068 | 14 | |
| rise | HCS | 53068 | 53199 | 131 | ||
| transition | HCS SDS | 53199 | 53232 | 33 | ||
| rise | SDS | 53232 | 53437 | 205 | ||
| decline | SDS | 53437 | 53467 | 30 | ||
| decline | HCS | 53467 | 53480 | 13 | ||
| decline | - | 53480 | 53516 | 36 | ||
| 2006 | rise | - | 53751 | 53767 | 16 | |
| rise | HCS | 53767 | 53805 | 38 | ||
| decline | HCS | 53805 | 53865 | 60 | ||
| decline | - | 53865 | 53877 | 12 | ||
| 2006/2007 | rise | - | 54053 | 54097 | 44 | |
| rise | HCS | 54097 | 54139 | 42 | ||
| transition | HCS SDS | 54139 | 54143 | 4 | ||
| rise | SDS | 54143 | 54233 | 90 | ||
| transition | SDS HCS | 54233 | - | 1 | ||
| rise | HCS | 54234 | 54346 | 112 | ||
| decline | HCS | 54346 | 54373 | 27 | ||
| decline | - | 54373 | 54392 | 19 | ||
| 2008 | rise | - | 54624 | 54652 | 28 | |
| rise | HCS | 54652 | 54677 | 25 | ||
| decline | HCS | 54677 | 54730 | 53 | ||
| decline | - | 54730 | 54749 | 19 | ||
| 2009 | rise | - | 54875 | 54891 | 16 | |
| rise | HCS | 54891 | 54929 | 38 | ||
| decline | HCS | 54929 | 55007 | 78 | ||
| decline | - | 55007 | 55025 | 18 | ||
| 2009-2011 | rise | - | 55182 | 55203 | 21 | |
| rise | HCS | 55203 | 55299 | 96 | ||
| transition | HCS SDS | 55299 | 55303 | 4 | ||
| rise | SDS | 55303 | 55518 | 215 | ||
| transition | SDS HCS | 55518 | 55598 | 80 | ||
| rise | HCS | 55598 | 55609 | 11 | ||
| decline | HCS | 55609 | 55612 | 3 | ||
| decline | - | 55612 | 55666 | 54 | ||
| 2013 | rise | - | 56505 | 56525 | 20 | |
| rise | HCS | 56525 | 56565 | 40 | ||
| decline | HCS | 56565 | 56567 | 2 | ||
| decline | - | 56567 | 56609 | 42 | ||
| 2014/2015 | rise | - | 56936 | 56957 | 21 | |
| rise | HCS | 56957 | 57043 | 86 | ||
| transition | HCS SDS | 57043 | 57047 | 4 | ||
| rise | SDS | 57047 | 57049 | 2 | ||
| transition | SDS IMS SDS | 57049 | - | 1 | ||
| rise | SDS | 57050 | 57079 | 29 | ||
| transition | SDS IMS SDS | 57079 | 57083 | 4 | ||
| rise | SDS | 57083 | 57088 | 5 | ||
| decline | SDS | 57088 | 57088 | 0 | ||
| transition | SDS HCS | 57088 | 57090 | 2 | ||
| decline | HCS | 57090 | 57094 | 4 | ||
| transition | HCS SDS | 57094 | 57121 | 27 | ||
| decline | SDS | 57121 | 57124 | 3 | ||
| transition | SDS IMS SDS | 57124 | 57133 | 9 | ||
| decline | SDS | 57133 | 57137 | 4 | ||
| decline | HCS | 57137 | 57140 | 3 | ||
| decline | SDS | 57140 | 57142 | 2 | ||
| transition | SDS IMS SDS | 57142 | 57145 | 3 | ||
| decline | SDS | 57145 | 57147 | 2 | ||
| transition | SDS IMS | 57147 | 57151 | 4 | ||
| decline | - | 57151 | 57156 | 5 | ||
| NOTE. – This is an excerpt of the full table. A portion is shown here for guidance | ||||||
| regarding its form and content. Table LABEL:table:statetransitions is published in its entirety (in machine | ||||||
| readable format) online at the Astrophysical Journal and the WATCHDOG website - | ||||||
| http://astro.physics.ualberta.ca/WATCHDOG/. | ||||||
| aThe start and end times of a particular stage in an outburst, given in MJD. | ||||||
| bDuration of the particular outburst stage in days. | ||||||
| Source Name | Outburst | Stage | State(s) | a | a | b |
|---|---|---|---|---|---|---|
| ID | (MJD) | (MJD) | (days) | |||
| 4U1956+350 | 1996-2015 | rise | HCS | 50087 | 50206 | 119 |
| transition | HCS IMS HCS | 50206 | 50226 | 20 | ||
| rise | HCS | 50226 | 50229 | 3 | ||
| transition | HCS SDS | 50229 | 50240 | 11 | ||
| rise | SDS | 50240 | 50249 | 9 | ||
| transition | SDS IMS SDS | 50249 | 50269 | 20 | ||
| rise | SDS | 50269 | 50303 | 34 | ||
| transition | SDS HCS | 50303 | 50322 | 19 | ||
| rise | HCS | 50322 | 51842 | 1520 | ||
| transition | HCS IMS HCS | 51842 | 51850 | 8 | ||
| rise | HCS | 51850 | 51853 | 3 | ||
| transition | HCS IMS HCS | 51853 | 51858 | 5 | ||
| rise | HCS | 51858 | 51902 | 44 | ||
| transition | HCS IMS HCS | 51902 | - | 1 | ||
| rise | HCS | 51903 | 51930 | 27 | ||
| transition | HCS IMS HCS | 51930 | 51934 | 4 | ||
| rise | HCS | 51934 | 51936 | 2 | ||
| transition | HCS IMS HCS | 51936 | 51944 | 8 | ||
| rise | HCS | 51944 | 52173 | 229 | ||
| transition | HCS IMS HCS | 52173 | 52208 | 35 | ||
| rise | HCS | 52208 | 52220 | 12 | ||
| transition | HCS IMS HCS | 52220 | 52229 | 9 | ||
| rise | HCS | 52229 | 52254 | 25 | ||
| transition | HCS IMS HCS | 52254 | 52320 | 66 | ||
| rise | HCS | 52320 | 52323 | 3 | ||
| transition | HCS IMS HCS | 52323 | 52330 | 7 | ||
| rise | HCS | 52330 | 52352 | 22 | ||
| transition | HCS SDS | 52352 | 52363 | 11 | ||
| rise | SDS | 52363 | 52405 | 42 | ||
| transition | SDS IMS SDS | 52405 | 52446 | 41 | ||
| rise | SDS | 52446 | 52538 | 92 | ||
| transition | SDS HCS | 52538 | 52542 | 4 | ||
| rise | HCS | 52542 | 52813 | 271 | ||
| transition | HCS IMS HCS | 52813 | 52851 | 38 | ||
| rise | HCS | 52851 | 53007 | 156 | ||
| transition | HCS IMS HCS | 53007 | 53024 | 17 | ||
| rise | HCS | 53024 | 53263 | 239 | ||
| transition | HCS IMS HCS | 53263 | 53287 | 24 | ||
| rise | HCS | 53287 | 53371 | 84 | ||
| transition | HCS IMS HCS | 53371 | 53388 | 17 | ||
| rise | HCS | 53388 | 53411 | 23 | ||
| transition | HCS IMS HCS | 53411 | 53413 | 2 | ||
| rise | HCS | 53413 | 53416 | 3 | ||
| transition | HCS IMS HCS | 53416 | - | 1 | ||
| rise | HCS | 53417 | 53463 | 46 | ||
| transition | HCS IMS HCS | 53463 | 53473 | 10 | ||
| rise | HCS | 53473 | 55382 | 1909 | ||
| transition | HCS SDS | 55382 | 55495 | 113 | ||
| rise | SDS | 55495 | 55498 | 3 | ||
| transition | SDS IMS SDS | 55498 | 55518 | 20 | ||
| rise | SDS | 55518 | 55520 | 2 | ||
| transition | SDS IMS SDS | 55520 | 55522 | 2 | ||
| rise | SDS | 55522 | 55531 | 9 | ||
| transition | SDS IMS SDS | 55531 | 55537 | 6 | ||
| rise | SDS | 55537 | 55568 | 31 | ||
| transition | SDS IMS SDS | 55568 | 55585 | 17 | ||
| rise | SDS | 55585 | - | 1 | ||
| transition | SDS IMS SDS | 55586 | 55593 | 7 | ||
| rise | SDS | 55593 | 55657 | 64 | ||
| transition | SDS HCS | 55657 | 55678 | 21 | ||
| rise | HCS | 55678 | 55717 | 39 | ||
| transition | HCS SDS | 55717 | 55801 | 84 | ||
| decline | SDS | 55801 | - | 1 | ||
| transition | SDS IMS SDS | 55802 | 55805 | 3 | ||
| decline | SDS | 55805 | - | 1 | ||
| transition | SDS IMS SDS | 55806 | 55813 | 7 | ||
| decline | SDS | 55813 | - | 1 | ||
| transition | SDS IMS SDS | 55814 | 55824 | 10 | ||
| decline | SDS | 55824 | 55880 | 56 | ||
| transition | SDS HCS | 55880 | 55892 | 12 | ||
| decline | HCS | 55892 | 56114 | 222 | ||
| transition | HCS IMS HCS | 56114 | 56131 | 17 | ||
| decline | HCS | 56131 | 56139 | 8 | ||
| transition | HCS IMS HCS | 56139 | - | 1 | ||
| decline | HCS | 56140 | 56148 | 8 | ||
| transition | HCS IMS HCS | 56148 | 56150 | 2 | ||
| decline | HCS | 56150 | 56152 | 2 | ||
| transition | HCS IMS HCS | 56152 | 56156 | 4 | ||
| decline | HCS | 56156 | 56159 | 3 | ||
| transition | HCS IMS HCS | 56159 | 56165 | 6 | ||
| decline | HCS | 56165 | 56167 | 2 | ||
| transition | HCS IMS HCS | 56167 | 56171 | 4 | ||
| decline | HCS | 56171 | 56208 | 37 | ||
| transition | HCS IMS HCS | 56208 | 56219 | 11 | ||
| decline | HCS | 56219 | 56221 | 2 | ||
| transition | HCS IMS HCS | 56221 | 56225 | 4 | ||
| decline | HCS | 56225 | 56229 | 4 | ||
| transition | HCS IMS HCS | 56229 | - | 1 | ||
| decline | HCS | 56230 | 56300 | 70 | ||
| transition | HCS IMS HCS | 56300 | 56302 | 2 | ||
| decline | HCS | 56302 | 56304 | 2 | ||
| transition | HCS IMS HCS | 56304 | 56351 | 47 | ||
| decline | HCS | 56351 | 56353 | 2 | ||
| transition | HCS IMS HCS | 56353 | 56355 | 2 | ||
| decline | HCS | 56355 | 56359 | 4 | ||
| transition | HCS IMS HCS | 56359 | 56366 | 7 | ||
| decline | HCS | 56366 | 56375 | 9 | ||
| transition | HCS IMS HCS | 56375 | - | 1 | ||
| decline | HCS | 56376 | 56390 | 14 | ||
| transition | HCS IMS HCS | 56390 | 56417 | 27 | ||
| decline | HCS | 56417 | 56432 | 15 | ||
| decline | SDS | 56432 | - | 1 | ||
| decline | HCS | 56433 | 56443 | 10 | ||
| transition | HCS IMS HCS | 56443 | - | 1 | ||
| decline | HCS | 56444 | 56460 | 16 | ||
| transition | HCS IMS HCS | 56460 | 56472 | 12 | ||
| decline | HCS | 56472 | 56501 | 29 | ||
| transition | HCS IMS HCS | 56501 | - | 1 | ||
| decline | HCS | 56502 | 56504 | 2 | ||
| transition | HCS IMS HCS | 56504 | - | 1 | ||
| decline | HCS | 56505 | 56511 | 6 | ||
| transition | HCS IMS HCS | 56511 | - | 1 | ||
| decline | HCS | 56512 | 56514 | 2 | ||
| transition | HCS IMS HCS | 56514 | 56526 | 12 | ||
| decline | HCS | 56526 | 56529 | 3 | ||
| transition | HCS IMS HCS | 56529 | - | 1 | ||
| decline | HCS | 56530 | 56533 | 3 | ||
| transition | HCS IMS HCS | 56533 | 56535 | 2 | ||
| decline | HCS | 56535 | 56563 | 28 | ||
| transition | HCS IMS HCS | 56563 | 56569 | 6 | ||
| decline | HCS | 56569 | 56571 | 2 | ||
| transition | HCS IMS HCS | 56571 | 56574 | 3 | ||
| decline | HCS | 56574 | 56585 | 11 | ||
| decline | SDS | 56585 | - | 1 | ||
| decline | HCS | 56586 | 56591 | 5 | ||
| decline | SDS | 56591 | 56594 | 3 | ||
| decline | HCS | 56594 | 56596 | 2 | ||
| decline | SDS | 56596 | - | 1 | ||
| decline | HCS | 56597 | 56636 | 39 | ||
| decline | SDS | 56636 | 56863 | 227 | ||
| decline | HCS | 56863 | 56879 | 16 | ||
| decline | SDS | 56879 | 56881 | 2 | ||
| decline | HCS | 56881 | 56883 | 2 | ||
| decline | SDS | 56883 | 56891 | 8 | ||
| decline | HCS | 56891 | 56906 | 15 | ||
| decline | SDS | 56906 | 56926 | 20 | ||
| decline | HCS | 56926 | 56933 | 7 | ||
| decline | SDS | 56933 | - | 1 | ||
| decline | HCS | 56934 | 56940 | 6 | ||
| decline | SDS | 56940 | 56945 | 5 | ||
| decline | HCS | 56945 | 56947 | 2 | ||
| transition | HCS IMS HCS | 56947 | - | 1 | ||
| decline | HCS | 56948 | 56955 | 7 | ||
| transition | HCS IMS HCS | 56955 | 56957 | 2 | ||
| decline | HCS | 56957 | 56963 | 6 | ||
| transition | HCS IMS HCS | 56963 | 56965 | 2 | ||
| decline | HCS | 56965 | 56970 | 5 | ||
| transition | HCS IMS HCS | 56970 | 57084 | 114 | ||
| decline | HCS | 57084 | 57086 | 2 | ||
| transition | HCS IMS | 57086 | 57156 | 70 | ||
| NOTE. – This is an excerpt of the full table. A portion is shown here for guidance | ||||||
| regarding its form and content. Table LABEL:table:statetransitions2 is published in its entirety (in machine | ||||||
| readable format) online at the Astrophysical Journal and the WATCHDOG website - | ||||||
| http://astro.physics.ualberta.ca/WATCHDOG/. | ||||||
| aThe start and end times of a particular stage in an outburst, given in MJD. | ||||||
| bDuration of the particular outburst stage in days. | ||||||
The luminosity functions of individual sources are presented in this appendix.