Antiferromagnetism and Hidden Order in Isoelectronic Doping of URu2Si2
Abstract
We present muon spin rotation (SR) and susceptibility measurements on single crystals of isoelectronically doped URu2-xTxSi2 (T = Fe, Os) for doping levels up to 50%. Zero Field (ZF) SR measurements show long-lived oscillations demonstrating that an antiferromagnetic state exists down to low doping levels for both Os and Fe dopants. The measurements further show an increase in the internal field with doping for both Fe and Os. Comparison of the local moment - hybridization crossover temperature from susceptibility measurements and our magnetic transition temperature shows that changes in hybridization, rather than solely chemical pressure, are important in driving the evolution of magnetic order with doping.
I Introduction
Heavy fermion systems frequently exhibit interesting electronic ground states arising from complex hybridization between conduction electrons and localized -electronsStewart1984 . Compounds containing uranium are particularly interesting as the Coulomb interaction, spin-orbit coupling, and 5f electron bandwidth are all of comparable energies, making exotic ground states possible Mydosh2011 . A notable example of such a ground state is the ‘Hidden Order’ (HO) arising in URu2Si2 below K that was first studied in 1985 Palstra1985 ; Schlabitz1986 . The order in this state is termed ‘Hidden’ as, despite more than two decades of study, the order parameter for the 17.5 K transition has not yet been conclusively identified Mydosh2011 .
Early neutron scattering studies indicated that this state was antiferromagnetic with a moment of 0.02-0.04 per uraniumBroholm1987 ; Isaacs1990 . However, other studies found unusual properties that could not be explained by simple antiferromagnetism, such as a gap opening up over a large portion of the Fermi surface indicated by specific heat Maple1986 and infrared spectroscopy Bonn1988 measurements. Furthermore, the measured antiferromagnetic moment is too small to explain the 0.2ln2 per f.u. entropy change across the transition determined from specific heat measurements Maple1986 .
Subsequent neutron scattering measurements conducted under applied hydrostatic pressure demonstrated a first-order transition into a large moment antiferromagnetic state (LMAF) with a moment of 0.4 Amitsuka1999 that occurs at a critical pressure of 0.5-0.8 Butch2010PRB . SR measurements under applied pressure have also confirmed this first-order transition to the LMAF state, and demonstrate no pressure-dependence of the internal fields from 0.5-1.5 Amato2004 . In addition, SR MacLaughlin1988 ; Luke1994 and NMR measurements Matsuda2001 show that the weak antiferromagnetic moment seen at ambient pressure can be explained by a small phase separated volume fraction of the pressure-induced antiferromagnetic state coexisting with the hidden order state. It is now widely accepted that this low moment antiferromagnetism is extrinsic to the hidden order state and is caused by inhomogeneous strain in measured crystals Amitsuka2007 .
The origin of the entropy change in URu2Si2 seen from heat capacity measurements has recently been explained by a gap opening in the spin excitation spectrum at the transition, and does not require the presence of weak antiferromagnetism Wiebe2007 . This gap is equivalent to the Fermi surface becoming gapped, and angle-resolved photo-emission spectroscopy (ARPES) measurements Syro2009 ; Chatterjee2013 indicate that this gap arises from hybridization of the conduction band with the uranium 5-electrons. Scanning tunneling microscopy (STM) measurements Schmidt2010 have lent support to this idea by observing a band splitting below the hidden order transition. However, these results have been disputed, with other STM researchers Syro2009 claiming that the hybridization gap opens well above and hence cannot explain the hidden order state. This leaves the importance of the hybridization gap as one of the many unanswered questions of URu2Si2.
Despite these significant advances in the understanding of HO a viable theory has not yet been accepted to explain this state, although numerous theories have been advanced over the years (See Ref. Mydosh2014 for a recent overview). In order to constrain such theories it is advantageous to further study the hidden order state through various experiment perturbations. One such perturbation that has been extensively applied to URu2Si2 is chemical doping. Previous studies have found that doping of the silicon site has only a weak effect on the electronic state which may be explained by a chemical pressure effectDhar1992 ; Park1994-1 , while doping of the uranium Ocko1997 ; Amitsuka2000 and ruthenium Amitsuka1988 ; Dalichaouch1990PB ; Dalichaouch1990PRB ; Park1994-2 sites cause much more dramatic changes in the behavior. This indicates that the electronic ground state depends much more strongly on - electron hybridization than it does on - hybridization Park1994-1 . However, U-site doping is complicated as there is competition between dilution of the magnetic U atom, changes in lattice parameters, and hybridization all occurring with doping. This makes Ru-site doping interesting to study as it is a potentially simpler avenue to explore the effect of changing hybridization on the magnetic states.
Rhodium and rhenium doping are two cases that have been well studied, both of which suppress the HO state before 5% doping. However, the ground states that emerge after the suppression are distinctly different. For Re doping the HO transition is suppressed by a 5% doping level, and above 7.5% doping a non-Fermi liquid ferromagnetic state emerges that persists up to high doping levels Butch2010 . By contrast, Rh suppresses HO by 2% doping at which point a LMAF state emerges, which is in turn suppressed by 4% doping Yokoyama2004 . Above this doping level no magnetically ordered state is observed Yokoyama2004 .
The Rh doped system has been a particularly valuable avenue to study the competition between the LMAF and HO states in the URu2Si2 system, as the doping allows the transition to be studied without the experimentally challenging aspects of applied external pressure. This has allowed productive studies of the high field behavior of the HO state (See Ref. Mydosh2011 and references therein), as well as proposed identification of universal parameters that cause the transition between the HO and LMAF states Yokoyama2004 .
Despite the potential insights gained by studying Re and Rh doping, the interpretation of results from both of these systems is made more difficult because these dopings change multiple potentially important parameters simultaneously. In particular, doping of Re or Rh will change the number of electrons in the system, the - hybridization, and the lattice constants of the system. In order to more easily understand the mechanisms behind the transitions between HO and other phases it is beneficial to have systems that change as few parameters as possible in order to isolate their effects. This makes the isoelectronic dopings, osmium and iron, interesting to study as one does not have to consider the effect of changing electron numbers in this system.
Fe doping of URu2Si2 has been studied for polycrystalline samples by Kanchanavatee et al. Kanchanavatee2011 . This work demonstrated that the full range of compositions URu2-xFexSi2 from x = 0 to 2 can be produced, and that doping results in a monotonic decrease of the lattice parameters with no evidence for a change of structure. Furthermore, the temperature-doping phase diagram measured by bulk probes (specific heat, magnetization, and resistivity) shows an increase in transition temperature as a function of doping up to a maximum of 40 K. This increase parallels that of the pure compound under pressure, which led the authors to hypothesize a transition from HO to LMAF at a doping level of and conclude that the effect of Fe doping on the system is fully explained by a chemical pressure effect Kanchanavatee2011 . However, the LMAF and HO states are largely indistinguishable to the bulk probes used in this study and the authors did not perform measurements with any microscopic probes that would allow the magnetic state to be identified, hence no firm conclusions could be drawn.
Very recently, a second study has been published on Fe doping using neutron diffraction on single crystals Das2015 . In this work, elastic neutron scattering allowed the authors to identify a crossover from HO to AF at a doping level of as would be expected from a chemical pressure argument. However, the moment of 0.8 per U that they observe is twice that seen in the pure material under pressure which indicates that chemical pressure is not the only factor governing the evolution of magnetism in this material. This discrepancy makes further study of Fe doping valuable to properly understand the HO to LMAF transition if it is to be used as an analogue of the pressure induced transition.
A cursory study of polycrystalline URu2-xOsxSi2 was first performed by Dalichaouch et al. in 1990 Dalichaouch1990PRB , and has been recently followed by a more detailed examination by Kanchanavatee et al. in 2014 Kanchanavatee2014 . These studies show that doping is possible up to with no change in the structure and only a small increase in the lattice constant compared to the large decrease seen for Fe doping. Accompanying this small expansion of the lattice, the transition temperature dramatically increases up to a maximum of 50 K by . From resistivity and specific heat measurements Kanchanavatee et al. hypothesize a transition out of the HO state at . However, this study again did not involve any microscopic probes of magnetism and hence the true evolution of the magnetic ground state of URu2-xOsxSi2 is still an open question.
In this paper we present the results of SR and susceptibility measurements on URu2-xTxSi2 (T = Fe, Os) single crystals for doping levels up to . Our measurements demonstrate that an antiferromagnetic state arises for both of these compounds at low doping levels and highlight the importance of hybridization to fully understand the evolution of magnetic order in this system.
II Experimental Methods
Samples measured in this study were single crystals grown by the Czochralski method at McMaster University from starting materials of depleted U, Ru(99.95%), Fe(99.99%), Os(99.8%), and Si(99.9999%). These growths were performed in a tri-arc furnace from a water-cooled copper hearth under Argon gettered at 900oC. After the growths, crystallinity was confirmed and sample alignment performed by Laue x-ray scattering measurements.
Magnetic susceptibility measurements were performed on cleaved plates of the crystals in a Quantum Design MPMS XL-3. These measurements provide a measure of the transition temperature from the paramagnetic state to hidden order or antiferromagnetism, however they cannot readily distinguish hidden order from antiferromagnetism.
SR is a sensitive microscopic magnetic probe that can distinguish antiferromagnetism from hidden order, but cannot readily distinguish hidden order from paramagnetism. In this technique, spin polarized positive muons are injected one at a time into a sample where they penetrate a few hundred m, rapidly thermalize, and stop at a Coulomb potential minima in the material. Once stopped, each muon spin precesses in the local magnetic field until it decays with average lifetime of 2.2 s and emits a positron preferentially in the direction of the muon spin at the time of decay. Detectors on either side of the sample register the decay of the positron and record the time interval between muon injection and decay. From many such events, a histogram of positron counts in both detectors, and , as a function of muon decay time is generated. Using these two histograms the asymmetry, , is defined as . This quantity gives a measure of how the muon polarization changes over time, and is limited by the physics of muon decay and instrumental factors to a maximum of about 0.3. The true maximum in any given experiment is determined from the total oscillating asymmetry seen after applying a small field transverse to the muon polarization in the paramagnetic regime.
In zero applied magnetic field, paramagnetic samples, where there is no static magnetism and the spin dynamics are very fast, will show a nearly time-independent asymmetry, with deviations from this caused by nuclear moments. The HO state will also have this signature, as there is no ordering of magnetic moments to produce a local magnetic field. By contrast, long-range ordered magnetic states such as antiferromagnetism will show an oscillating asymmetry where the frequency gives the strength of the internal field at the muon stopping site, provided this field is not parallel to the initial muon polarization. The ratio of the maximum amplitude of the oscillating asymmetry to the instrumental maximum gives the fraction of the sample that is in the magnetic state (the magnetic volume fraction). The amplitude of this oscillating signal damps down over time as a result of inhomogeneities and dynamics of the internal field.
Our SR measurements were performed on the M15 and M20 beam lines at TRIUMF laboratory in Vancouver. The LAMPF time-differential spectrometer was used, which provides a He-4 cryostat for temperatures between 2 and 300K and a time resolution of 0.2 ns in an ultra low background apparatus. This apparatus vetoes muons that miss the sample, ensuring that almost all of the measured positrons come from muons that stop in the sample. For these measurements the single crystals were cleaved into slices roughly 0.5mm thick along the c-axis which were then mounted in a mosaic covering 1-2 cm2 on thin mylar tape. The c-axes were coalligned facing the muon beam but no attempt was made to coalign the samples in the a-b plane. We fit our SR data using the SRfit software package musrfit .
III Results
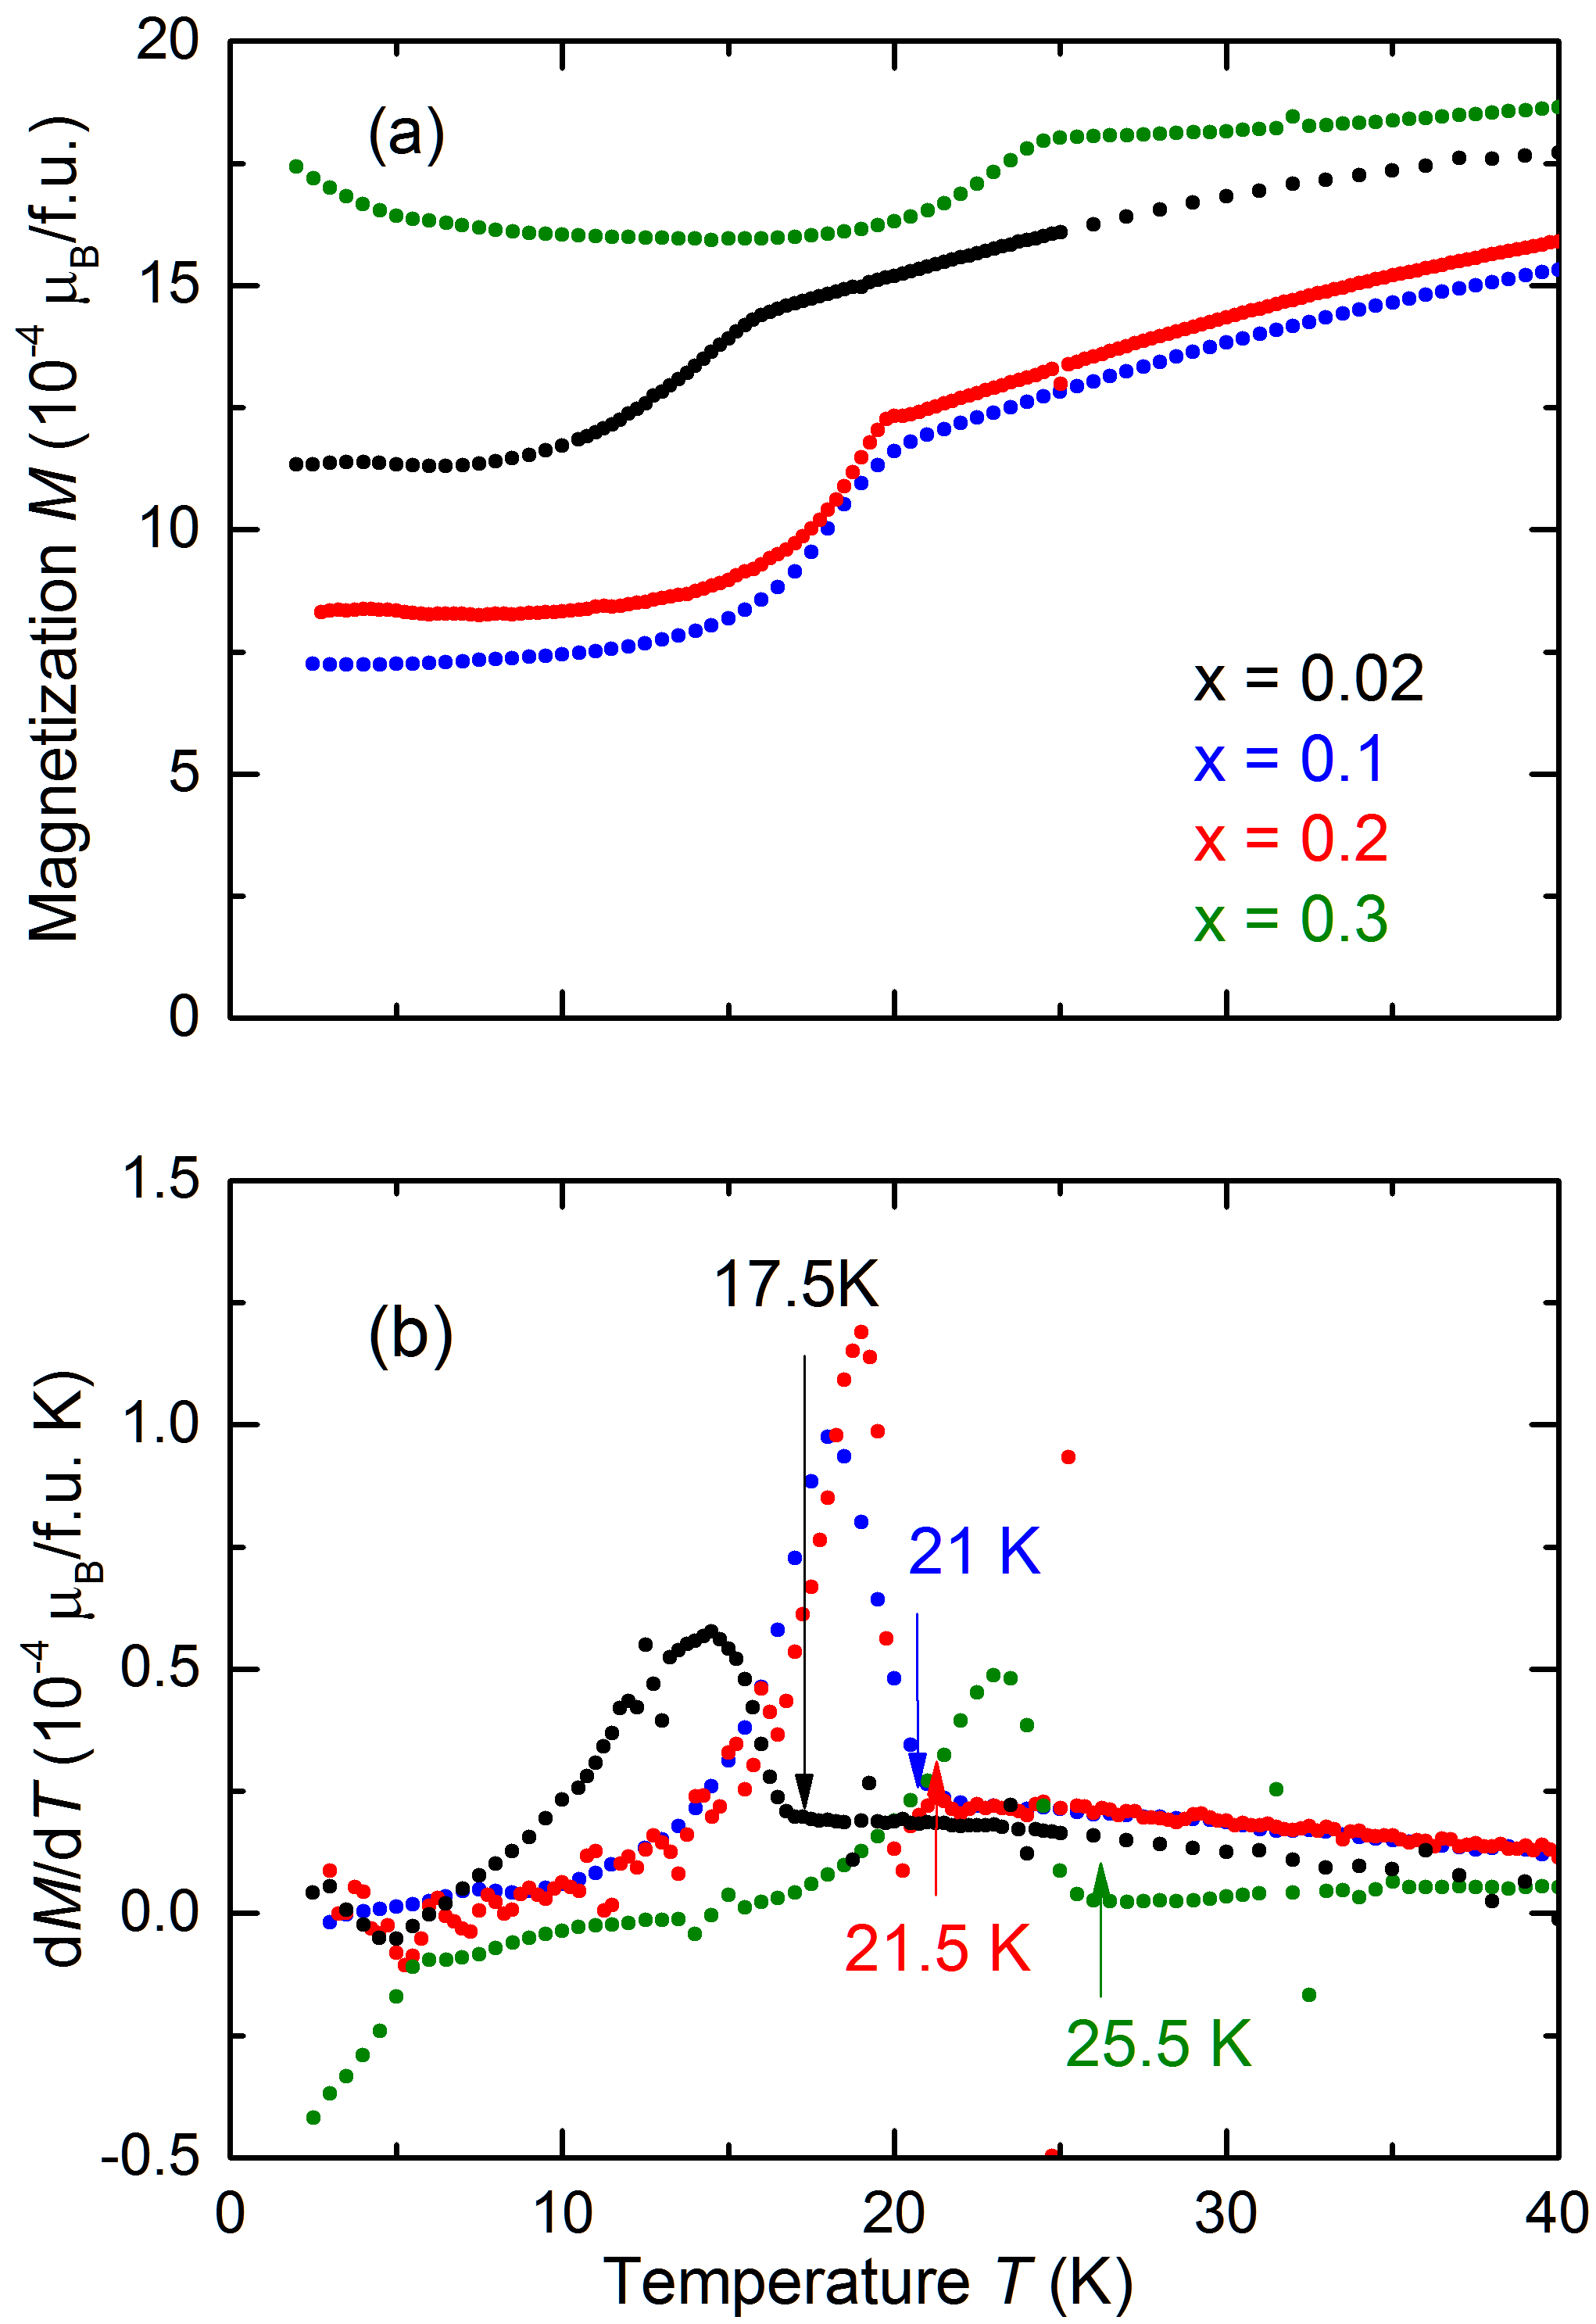
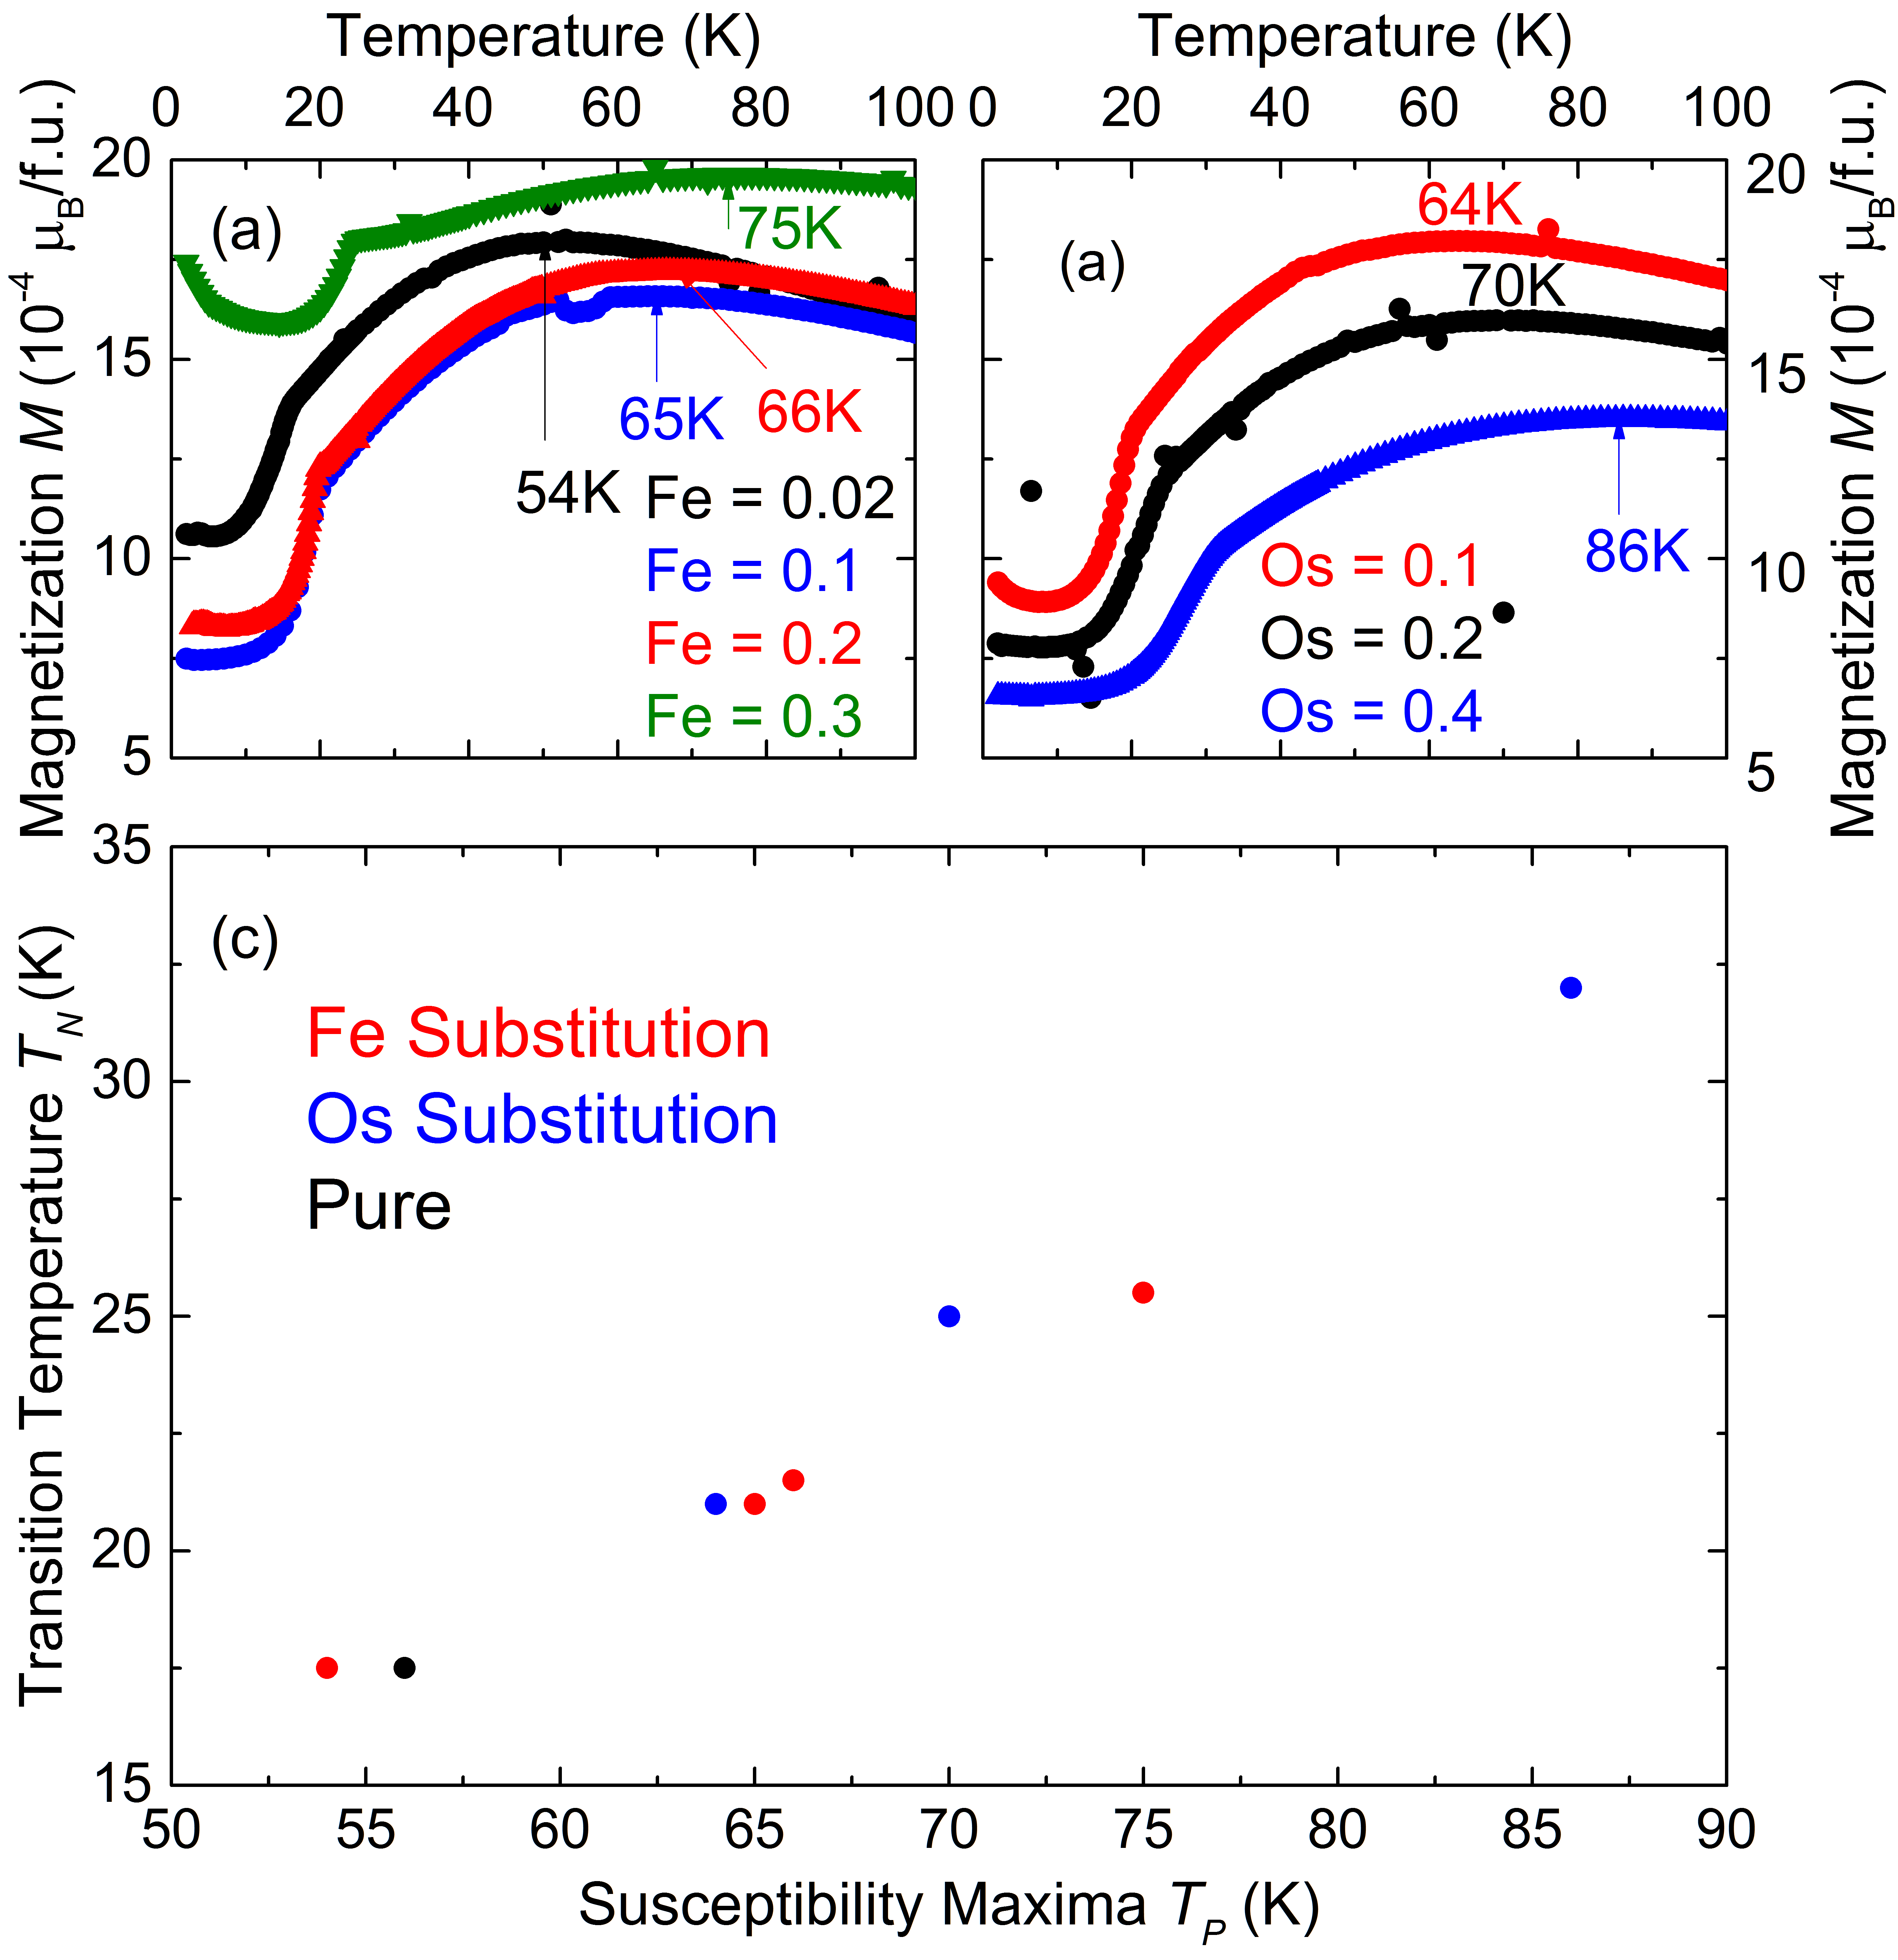
Figures 1 and 2 show the results of the magnetization measurements in a field of 0.1 T ( ) on the Fe and Os doped samples respectively. No significant differences were observed in any of these samples between field-cooled and zero field-cooled and hence only one set of measurements are shown. In these measurements a kink in the susceptibility indicates the transition into either the HO or LMAF states. The lower panels of these figures show plots of d/d to allow a more accurate determination of the temperature of this kink.
The measurements on the Fe doped samples show little change in the character of the transition with doping; the transition remains a relatively sharp peak in d/d up to higher dopings. The sharp peak is consistent with measurements on polycrystalline samples presented by Kanchanavatee et al. Kanchanavatee2011 . However, our measurements on single-crystal samples do not show evidence of the significant second peak seen in some of the polycrystalline samples in ref. Kanchanavatee2011 . This likely indicates that those features were spurious results arising from disorder in the polycrystalline samples, as was also proposed by Das et al. Das2015 . Additionally, our x = 0.3 sample shows a significant low temperature upturn in the magnetization as well as the highest overall magnetization. During the crystal growth of this sample, a small number of needle-like protrusions were noticed on the outside of the crystal, likely indicating some phase separation that would cause a paramagnetic background in the magnetization measurements, as observed. We attribute this to a lower than nominal silicon level in the melt arising from evaporation as silicon has the highest vapor pressure of the elements present Honig1962 and the growth for this doping was held at high temperature for a significantly longer period than the others.
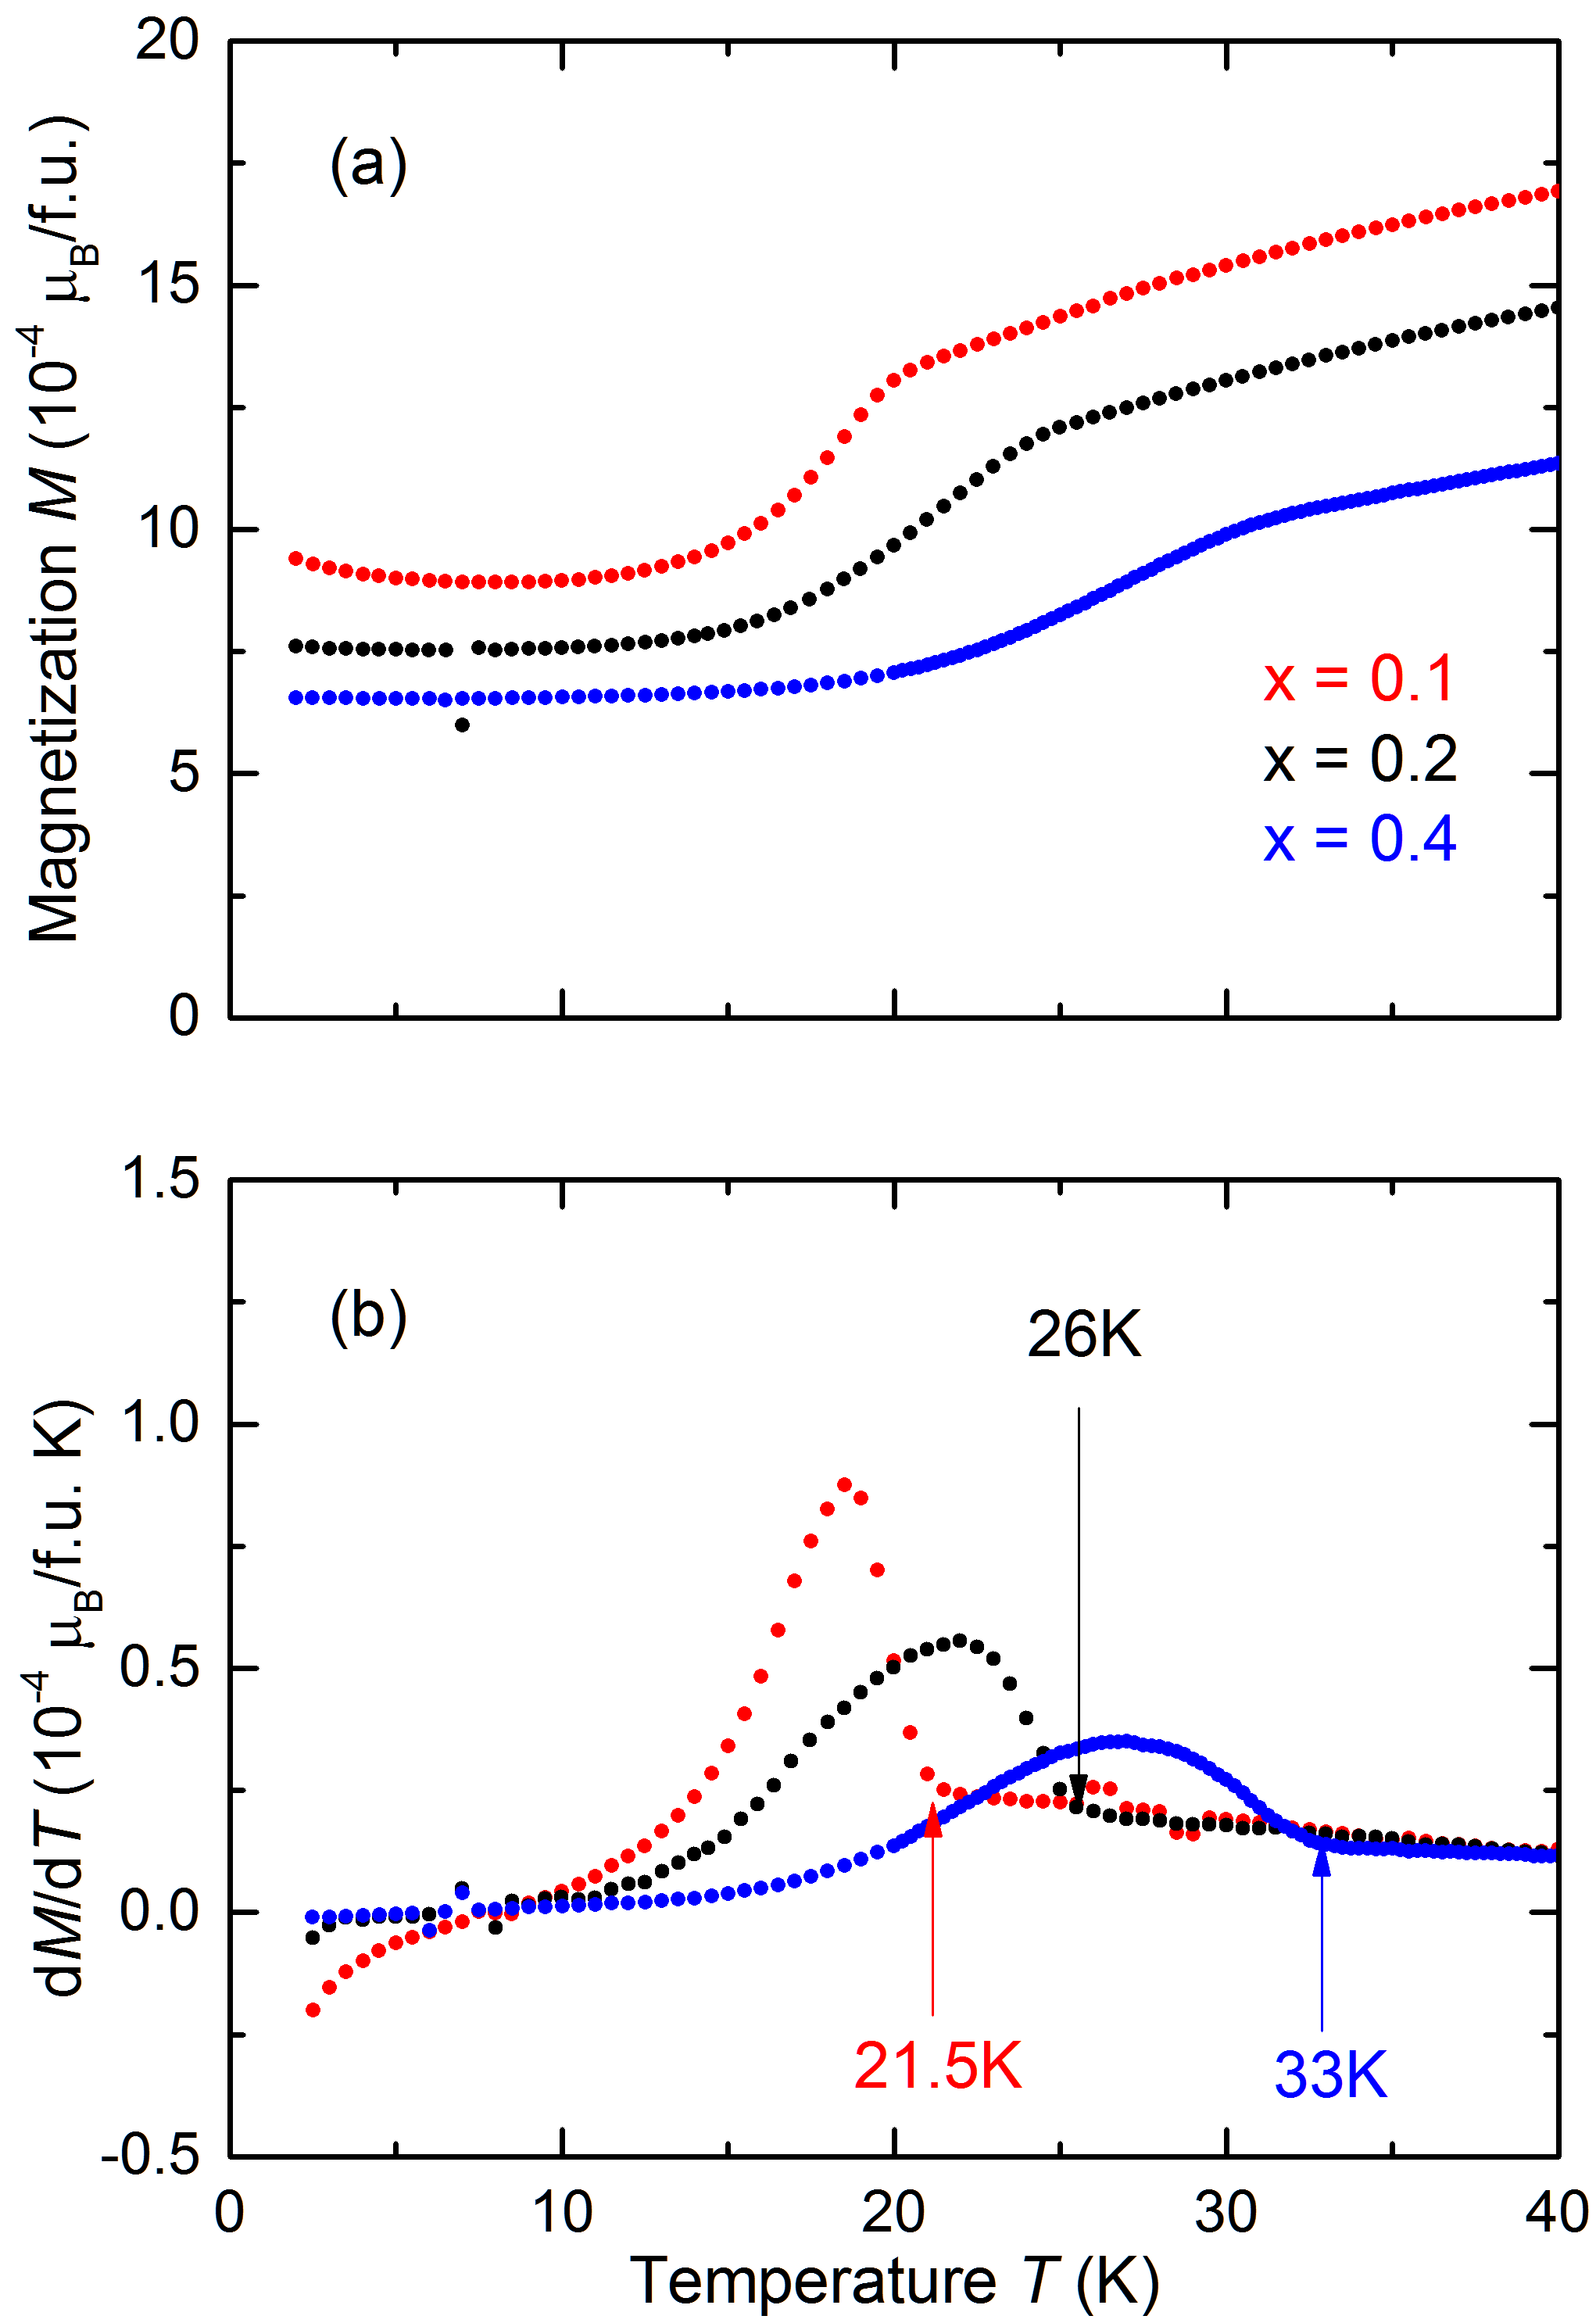
The measurements on our Os doped samples show a somewhat different evolution in the character of the transition with doping. Rather then staying as a sharp peak, the transition broadens significantly and shifts to higher temperature as the doping level increases. This is consistent with the broadened transition seen in polycrystalline samples at x = 0.3 and 0.4 Kanchanavatee2014 .
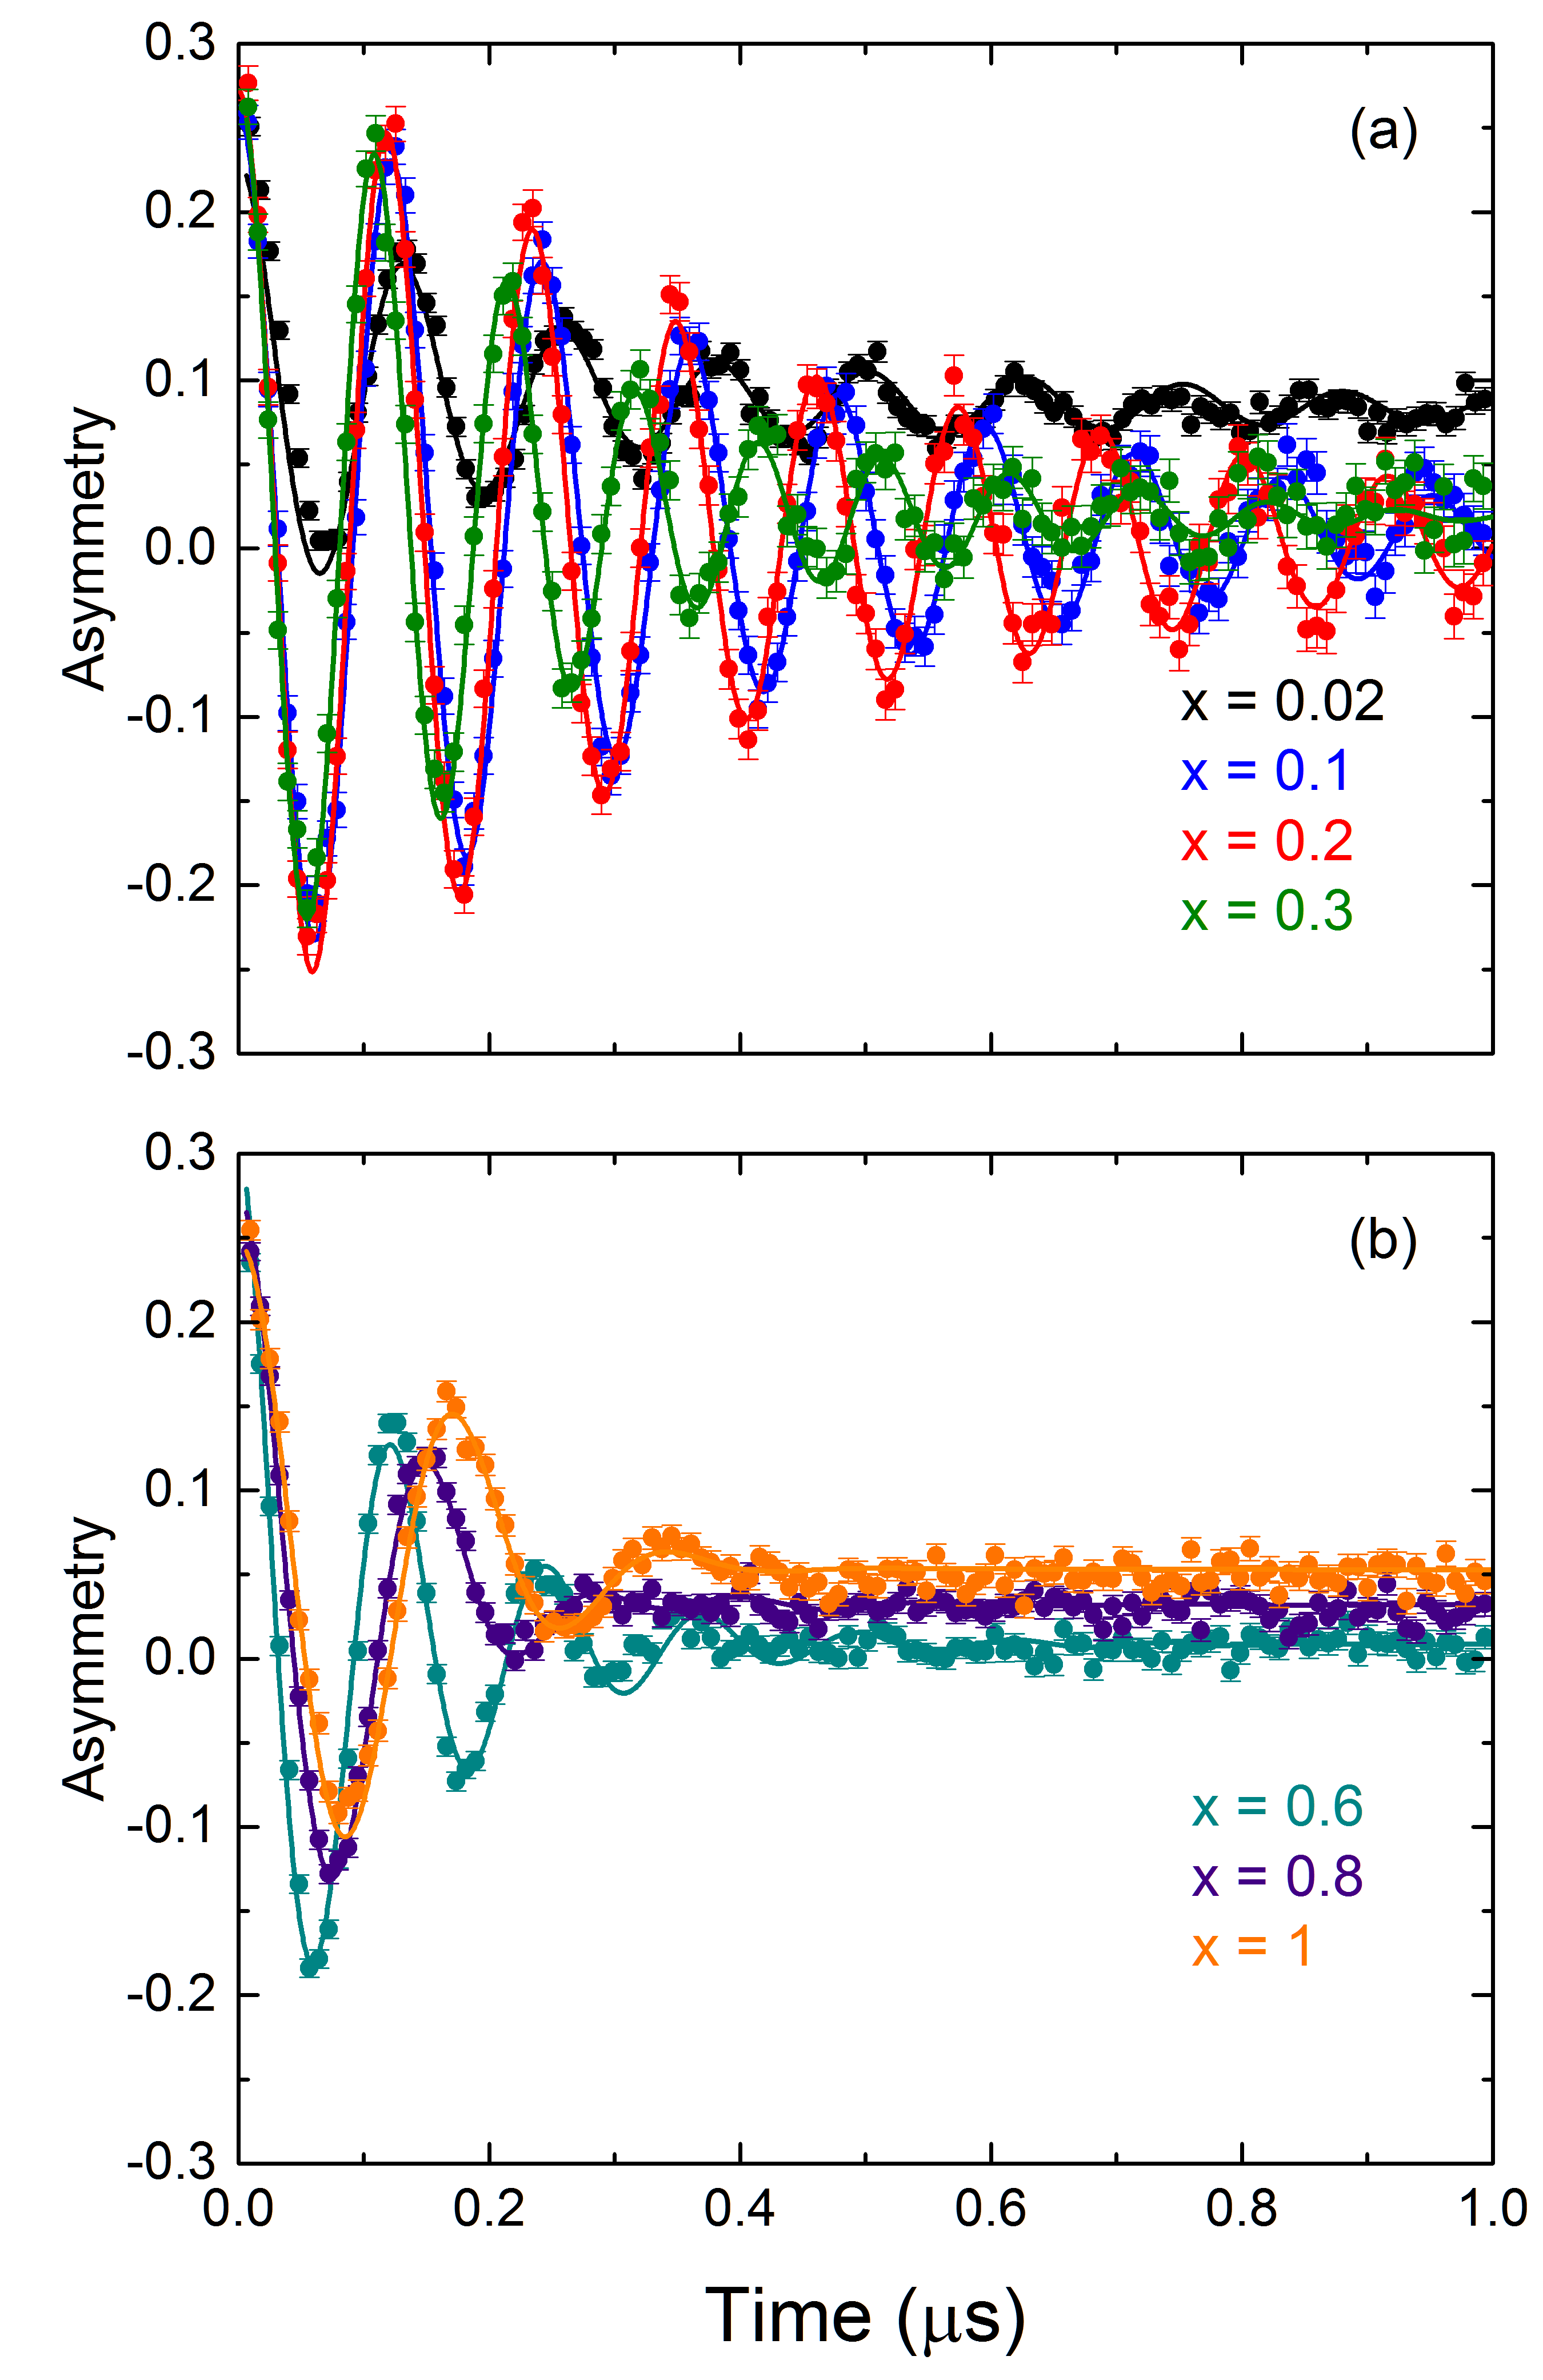
SR data for the Fe samples at 2 K measured with the muon spins initially perpendicular to the c-axis of the crystals in zero applied field (ZF) is shown in Fig. 3. Measurements in panel (b) were taken with higher statistics to better resolve the faster relaxing signal. This data exhibits clear oscillations for all samples, indicating that there is static magnetism with the field along the c-axis at the muon stopping site. The amplitude of the oscillations for the x = 0.02 sample is significantly lower than for the others and the asymmetry is shifted upwards by a non-relaxing component. This indicates that the magnetic volume fraction is lower in this sample.
We found that applying a small field parallel to the c-axis to any of these samples splits the observed internal field into two components separated by twice the applied field. This indicates that the magnetic order in these samples is antiferromagnetic. We also performed some measurements with the muon spins parallel to the c-axis that show no oscillations for the low doping samples, indicating that the internal field is only along the c-axis within the accuracy of our alignment. This is consistent with the antiferromagnetic phase seen in URu2Si2 under hydrostatic pressure Amitsuka1999 and by Das et al. in neutron scattering measurements on URu2-xFexSi2 Das2015 which has magnetic moments along the c-axis. However, it should be noted that while the direction of the internal field often matches the moment direction, this is not always the case and full comparison depends on knowledge of the muon stopping site which we do not have.
Despite the apparent similarity of this antiferromagnetic state to that of URu2Si2 under hydrostatic pressure, we found that the fitting of the ZF data at low doping was significantly improved with a two component fit compared to the single component fit used by Amato et al. for the pure compound Amato2004 . We therefore fit the data for x = 0.02-0.3 shown in Fig. 3 (a) using the equation,
| (1) |
In this model the ratio of the asymmetries of the two components was fixed to 0.5 for simplicity as fits with free asymmetry were found to refine to values near to 0.5. Addition of a second frequency for the higher dopings x = 0.6 to 1.0 did not improve the fits compared to the single component model given by the equation,
| (2) |
Therefore, Eq. 2 was used to fit the data in Fig. 3 (b). In these equations is the total asymmetry, is the larger internal field, = 135.538 MHz/T is the muon gyro-magnetic ratio, is the ratio between the internal fields at the two muon sites, is the magnetic volume fraction, and the are the relaxation rates. For each of the fits and were temperature independent parameters for each sample and the other parameters were allowed to vary with temperature.
The field ratio, , varies between samples with no obvious doping dependence as shown in Table 1. However, the relaxation rate also varies erratically from sample to sample, likely from differing amounts of disorder, and this will affect the fitting of a second frequency. Table 1 also shows the substantially larger single relaxation for the higher doped samples which obscures any possibility of fitting a second field to these data. We expect that a second frequency may still be present but increased disorder from growing crystals at high doping levels makes it impossible to distinguish.
| Doping | (s at 2K | (s at 2K | |
|---|---|---|---|
| 0.02 | 0.86 | 2.39 | 5.37 |
| 0.1 | 0.942 | 1.95 | 4.98 |
| 0.2 | 0.93 | 1.763 | 4.39 |
| 0.3 | 0.891 | 2.822 | 4.51 |
| 0.6 | - | 7.57 | - |
| 0.8 | - | 9.33 | - |
| 1 | - | 7.04 | - |
Figure 4 shows plots of the fit average internal field ( for the lower dopings) and magnetic fraction . In all samples the internal field smoothly decreases from a maximum at low temperature to zero at the transition, showing second order behavior. The magnetic fraction for all samples except for the x = 0.02 is mostly temperature independent up until the transition where a sharp fall off occurs. This fraction is close to 1 for the x = 0.1 - 0.3 samples and slightly lower for the higher dopings. In contrast to the others, the x = 0.02 sample shows a substantially reduced of 0.63 at 2 K. Furthermore, this sample shows different temperature dependence with a smooth continuous drop off in the magnetic fraction over the entire temperature range. This may indicate a continuous volume-wise transition out of the AF state as a function of temperature.
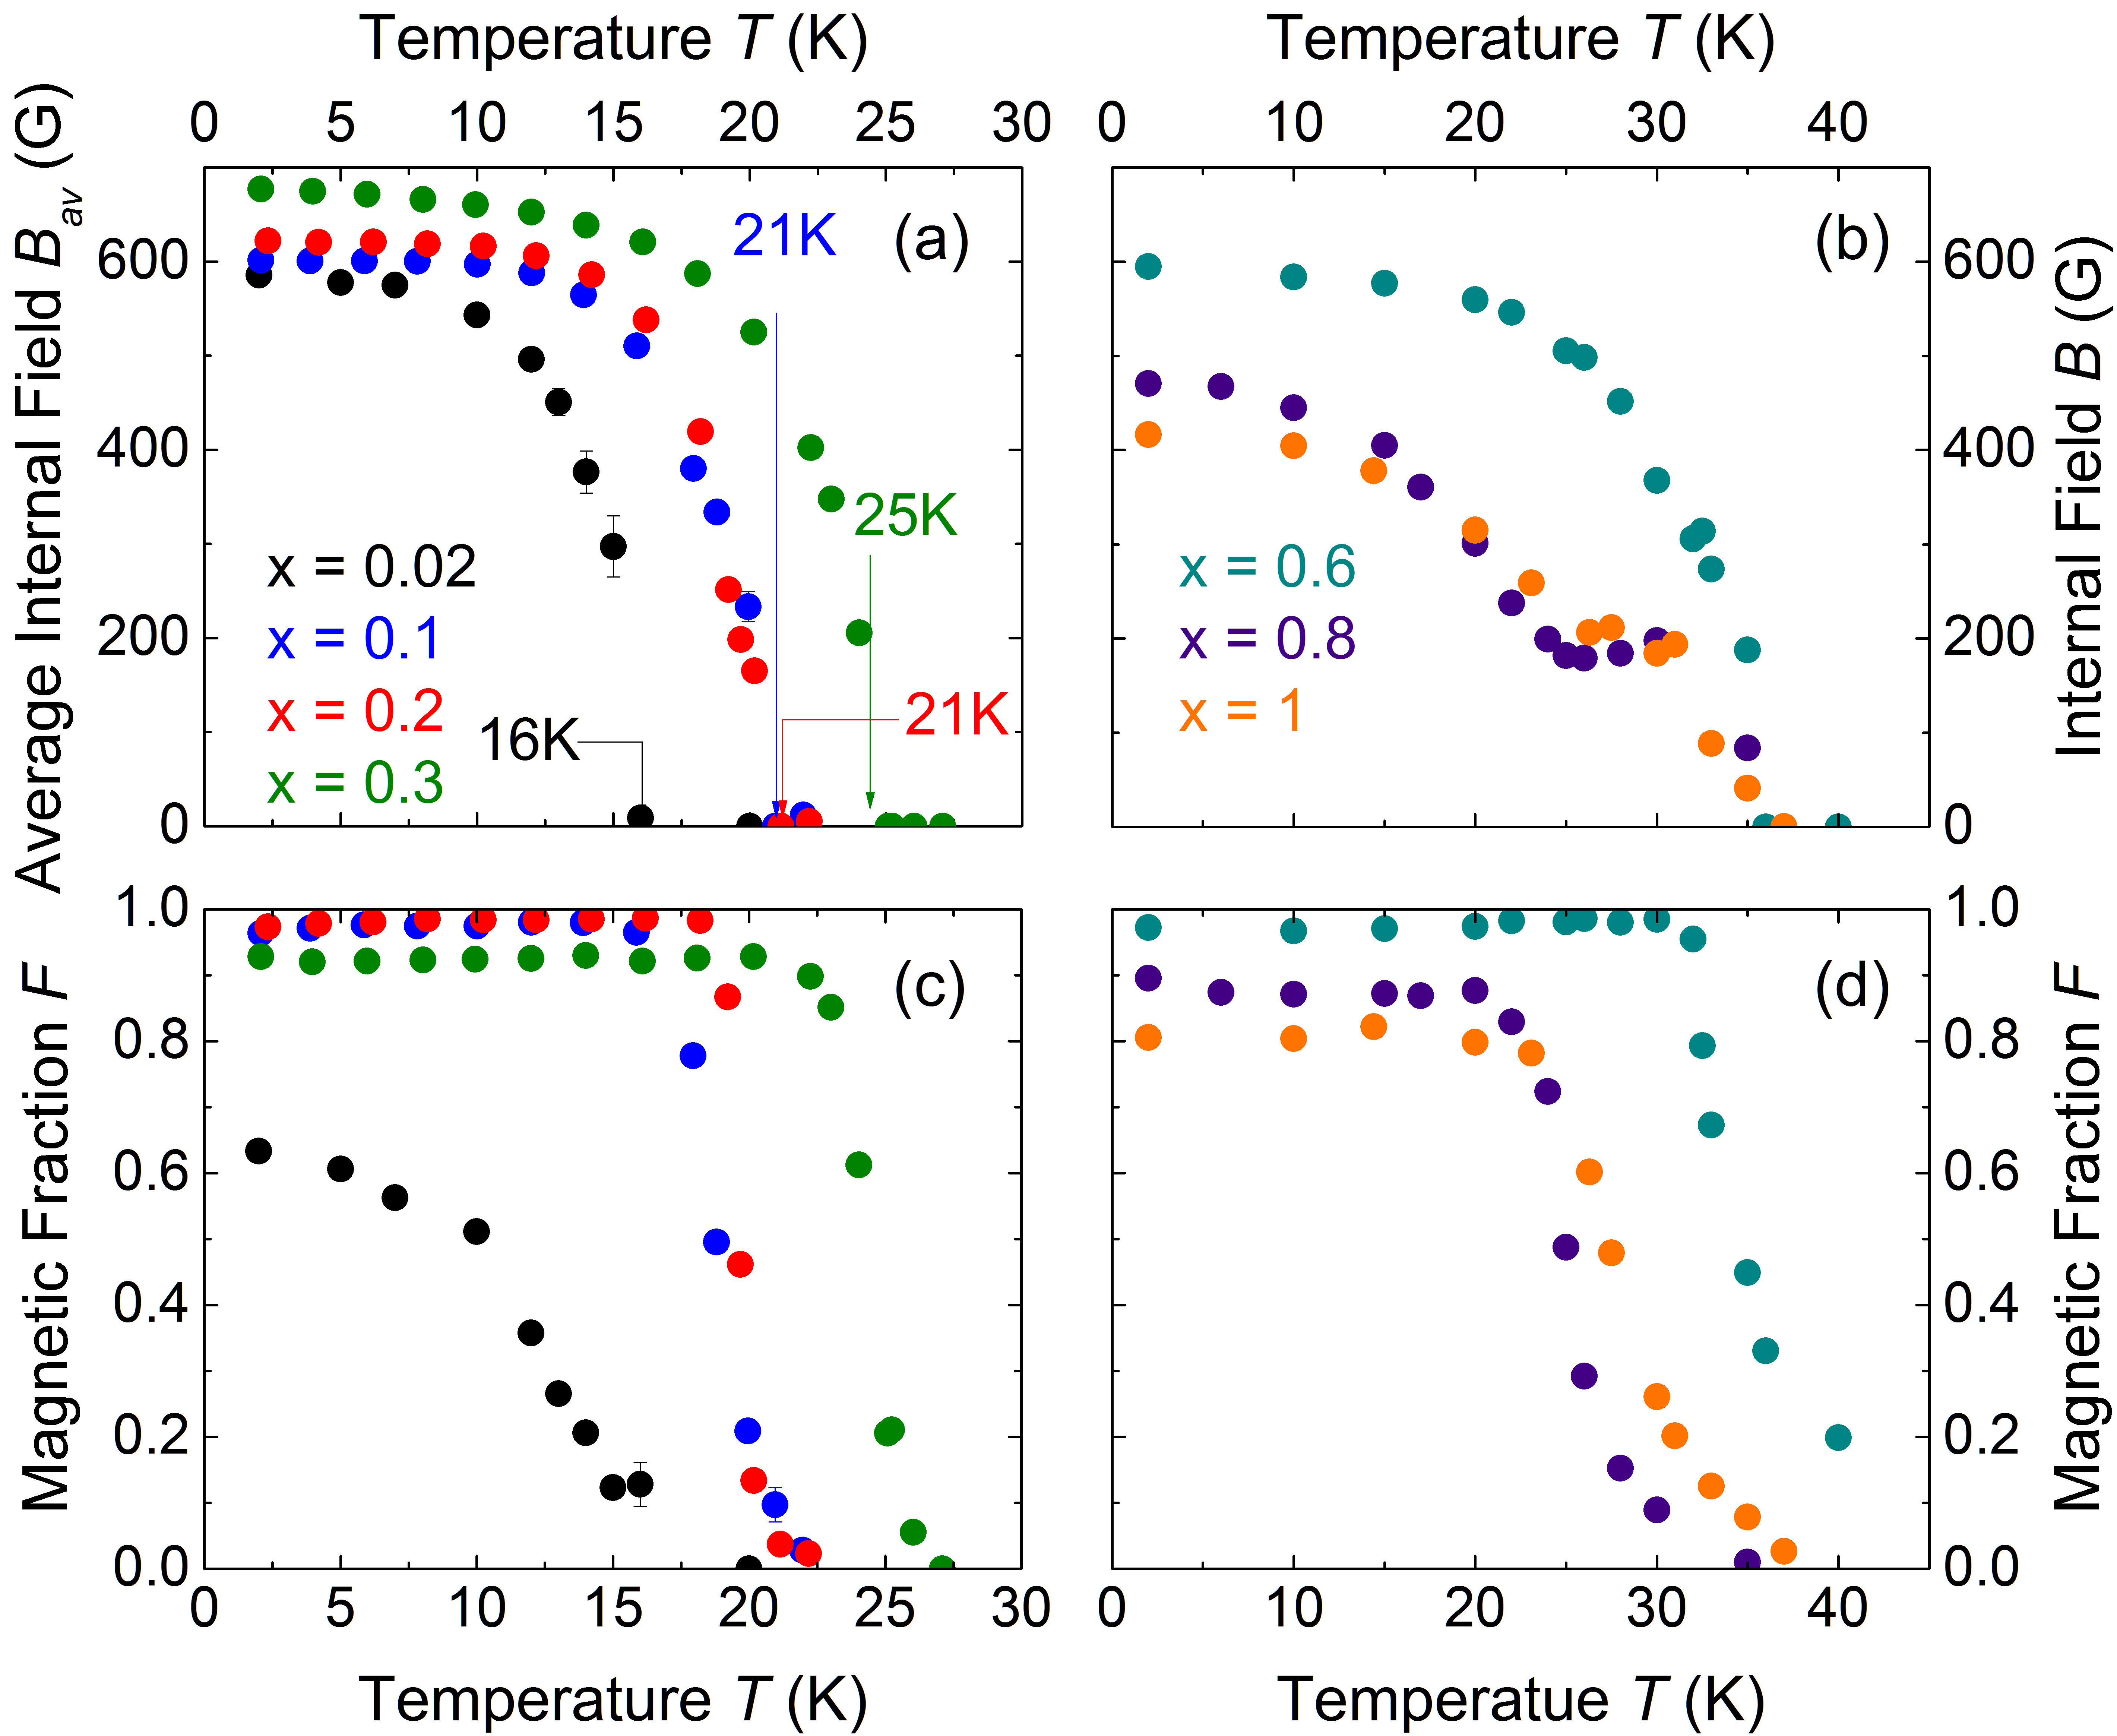
SR data collected at K in zero field with the muon spins initially perpendicular to the c-axis for the Os doped samples are shown in Fig. 5 (a). For these samples the data again shows clear oscillations indicating similar static order. However, there is no evidence for a second internal field component in these samples. Therefore, we fit the data using Eq. 2 and show the internal field and magnetic volume fraction in Fig. 5 (c) and (d). These plots show similar temperature dependence to the Fe doped samples again indicating a second order transition in all samples.
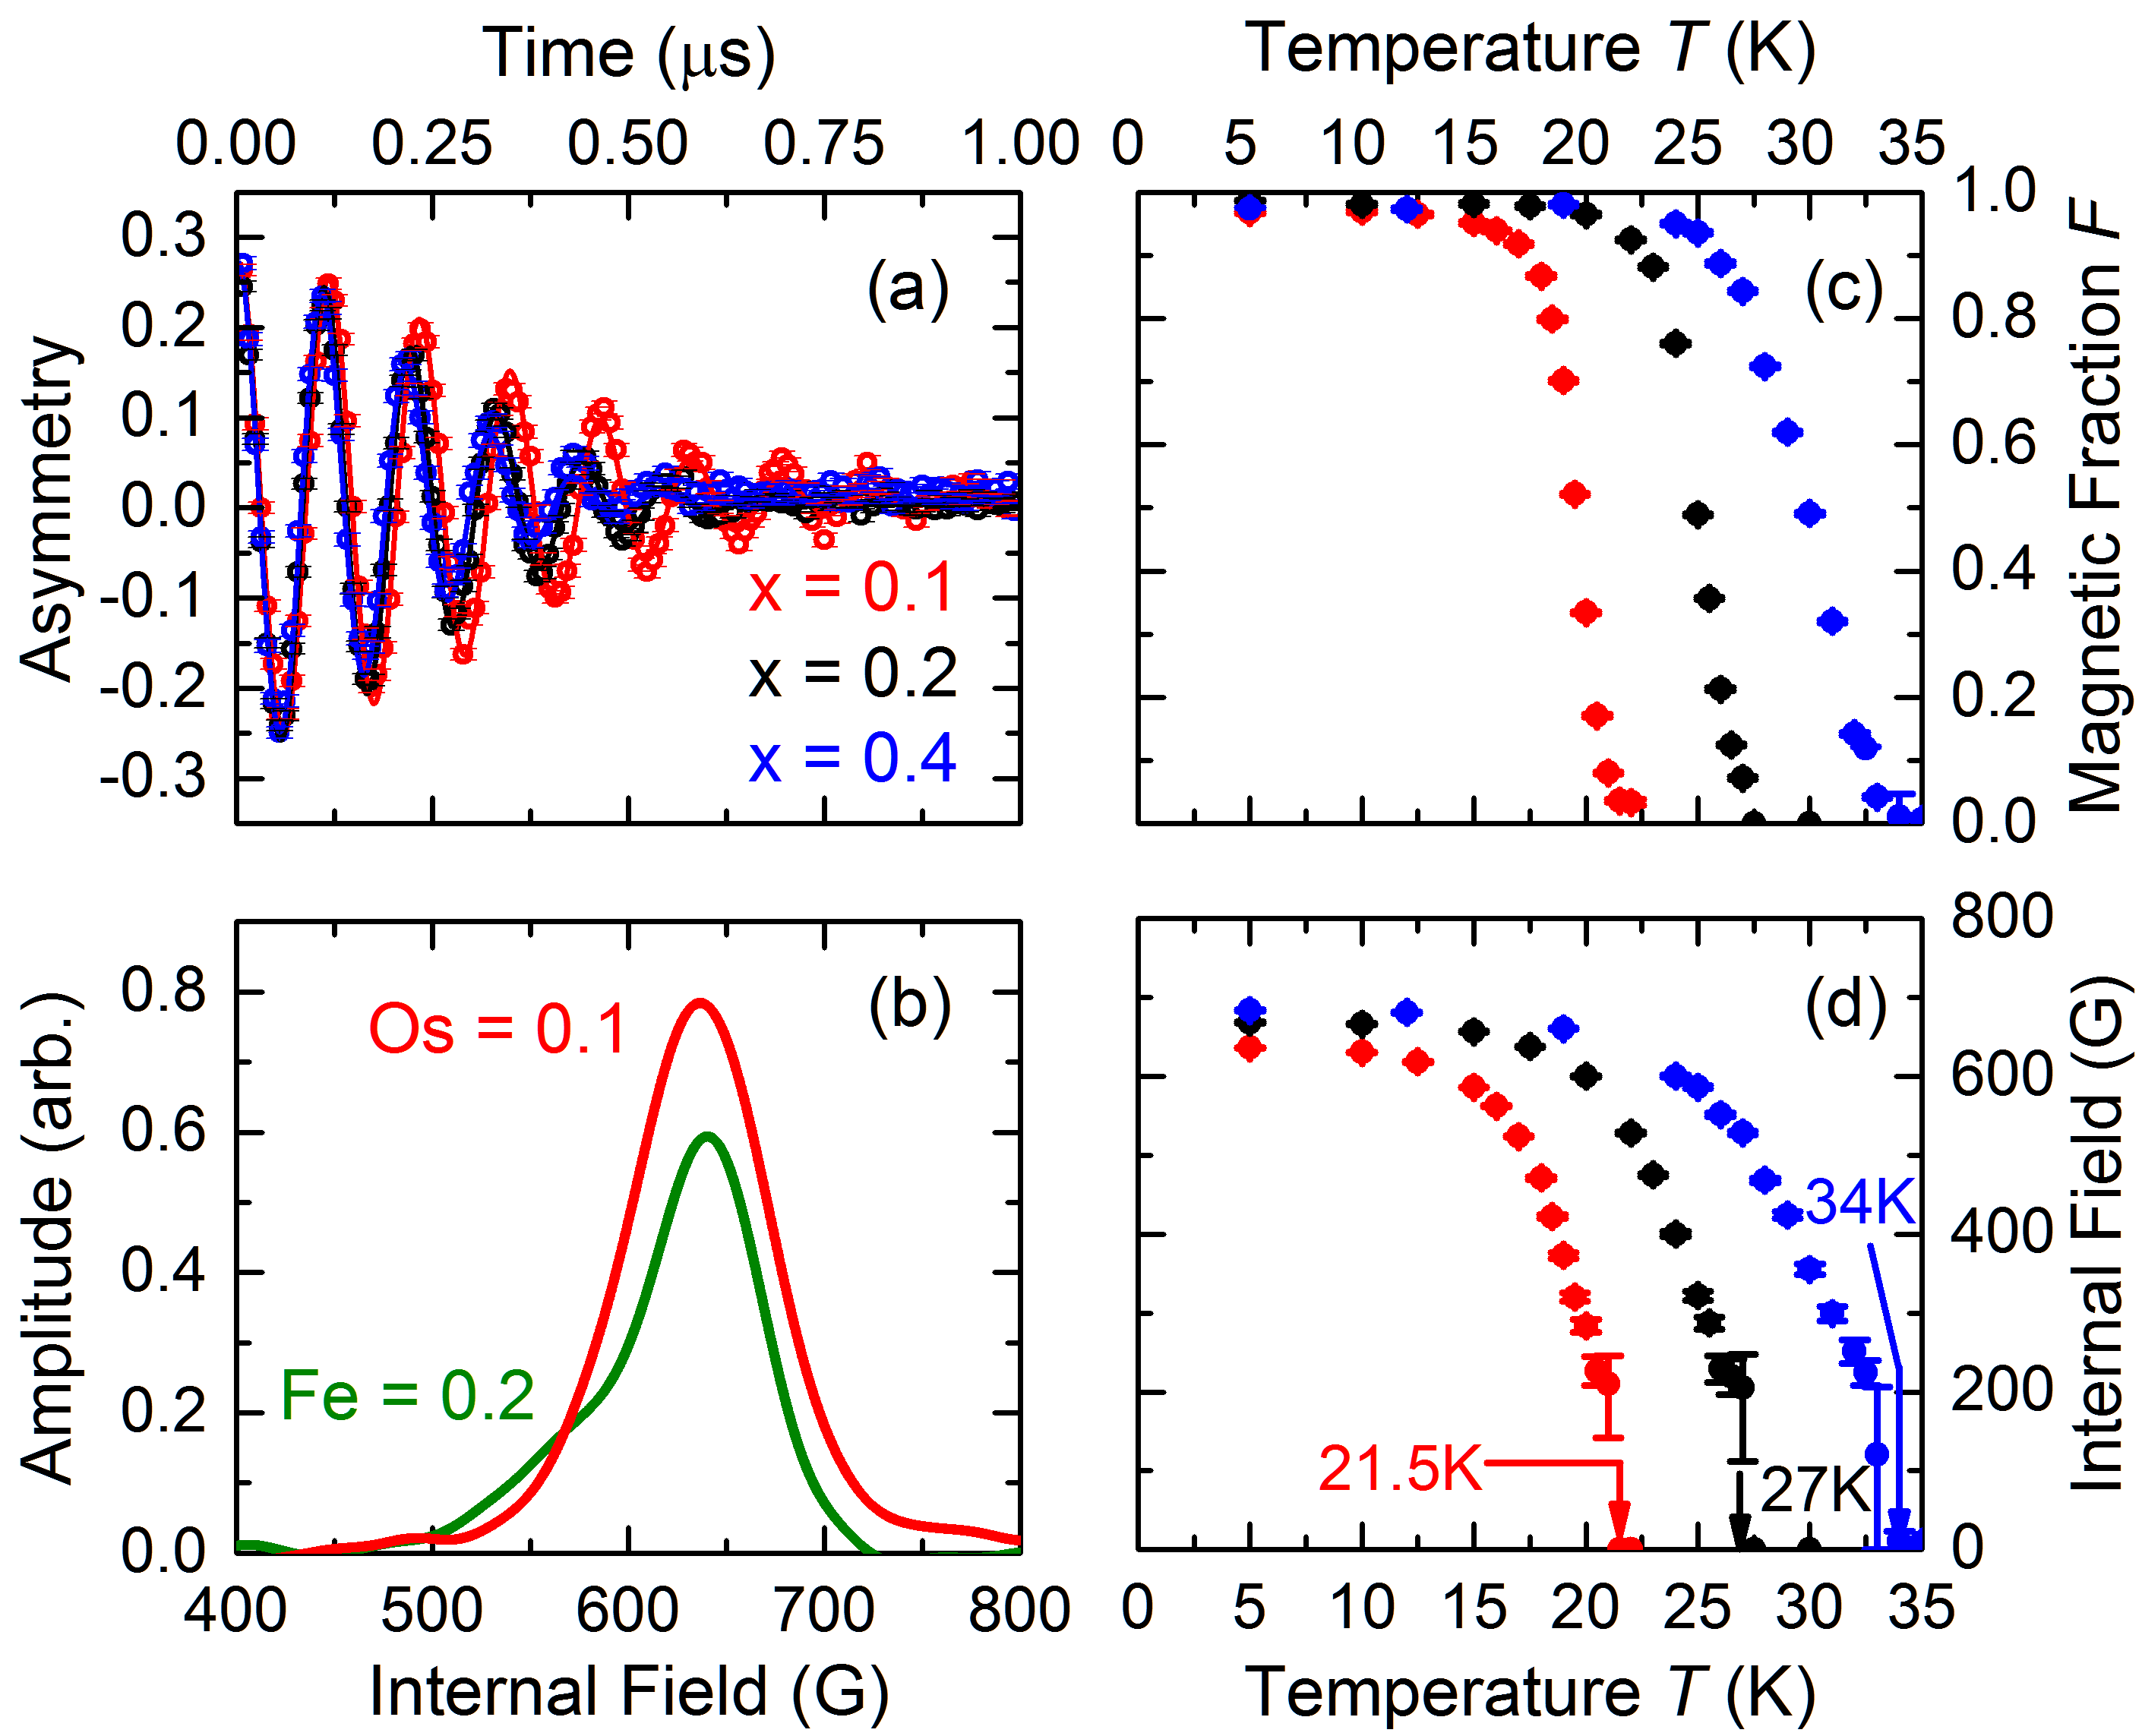
The comparison of two internal fields for Fe at low doping compared to one frequency in Os is illustrated by the Fourier transform in Fig. 5 (b). This plot shows that while two frequencies appear in the Fe sample, the overall linewidth is similar for the Os sample. This means that the appearance of a second field for Os samples could be masked by the larger linewidth. Similarly, Table 1 shows that the relaxation rate (linewidth) is much higher in the heavily doped Fe samples where two frequencies are not resolved. This is likely a result of chemical disorder in the samples and would explain why we cannot see two frequencies in these cases. A similar mechanism may explain the lack of a second field for the measurements under pressure done by Amato et al Amato2004 . In this case, the pressure was applied with an anvil cell using a transmitting medium that would be frozen at the relevant temperatures. This can cause non-uniformities in the applied pressure Yu2009 , which would introduce inhomogeneity in the samples, increasing the linewidth and masking the appearance of a second frequency. Furthermore, in any experiment with a pressure cell many muons are stopped outside the sample. This drops the signal to noise ratio of the data, further reducing the ability to resolve a possible second frequency. These explanations would allow for the magnetic state to be nearly identical in our Fe and Os samples as well as the pure URu2Si2 measured under pressure, despite the apparent differences in fitting.
The presence of a second internal field in any of these measurements indicates that the muons stop at two magnetically distinct sites at equivalent or near-equivalent Coulomb potential minima. The second magnetic site could either be explained by a more complex magnetic structure that breaks one of the symmetries of the underlying crystal lattice, or structural effects creating two muon sites. If this does appear only for doping, one possibility is that the Fe/Os atoms are being magnetically polarized and contributing to the moment seen by the muons. However, our measurements indicate that the relative volume fraction of the two magnetic sites is close to 50/50, which would not be expected if one of these was coming from the 1-15% doping. Furthermore, UFe2Si2 and UOs2Si2 are both non-magnetic so we would not expect Fe and Os polarization Szytula1988 ; Palstra1986 . Future detailed measurements of the temperature and doping dependence of the lattice parameters and structure symmetry would help clarify this issue.
IV Discussion
The fit parameters in Figure 4 and 5 show two important features. First, for most samples the low temperature magnetic volume fraction is close to one. This tells us that the magnetism we see must be attributed in each case to the bulk of the sample rather than a small impurity effect. The small non-magnetic volume that does appear could be attributed to muons stopping in parts of the sample holder rather than the sample itself or slight mis-alignment of the samples with respect to the incoming muon beam. In the heavily doped samples where the volume fraction appears somewhat reduced, a small signal also appears in measurements with the muon spin rotated parallel to the aligned c-axis. Misalignment would explain both the signal in the measurements and the reduced signal / volume fraction for as the measured asymmetry varies as where is the angle between the muon spins and the internal field.
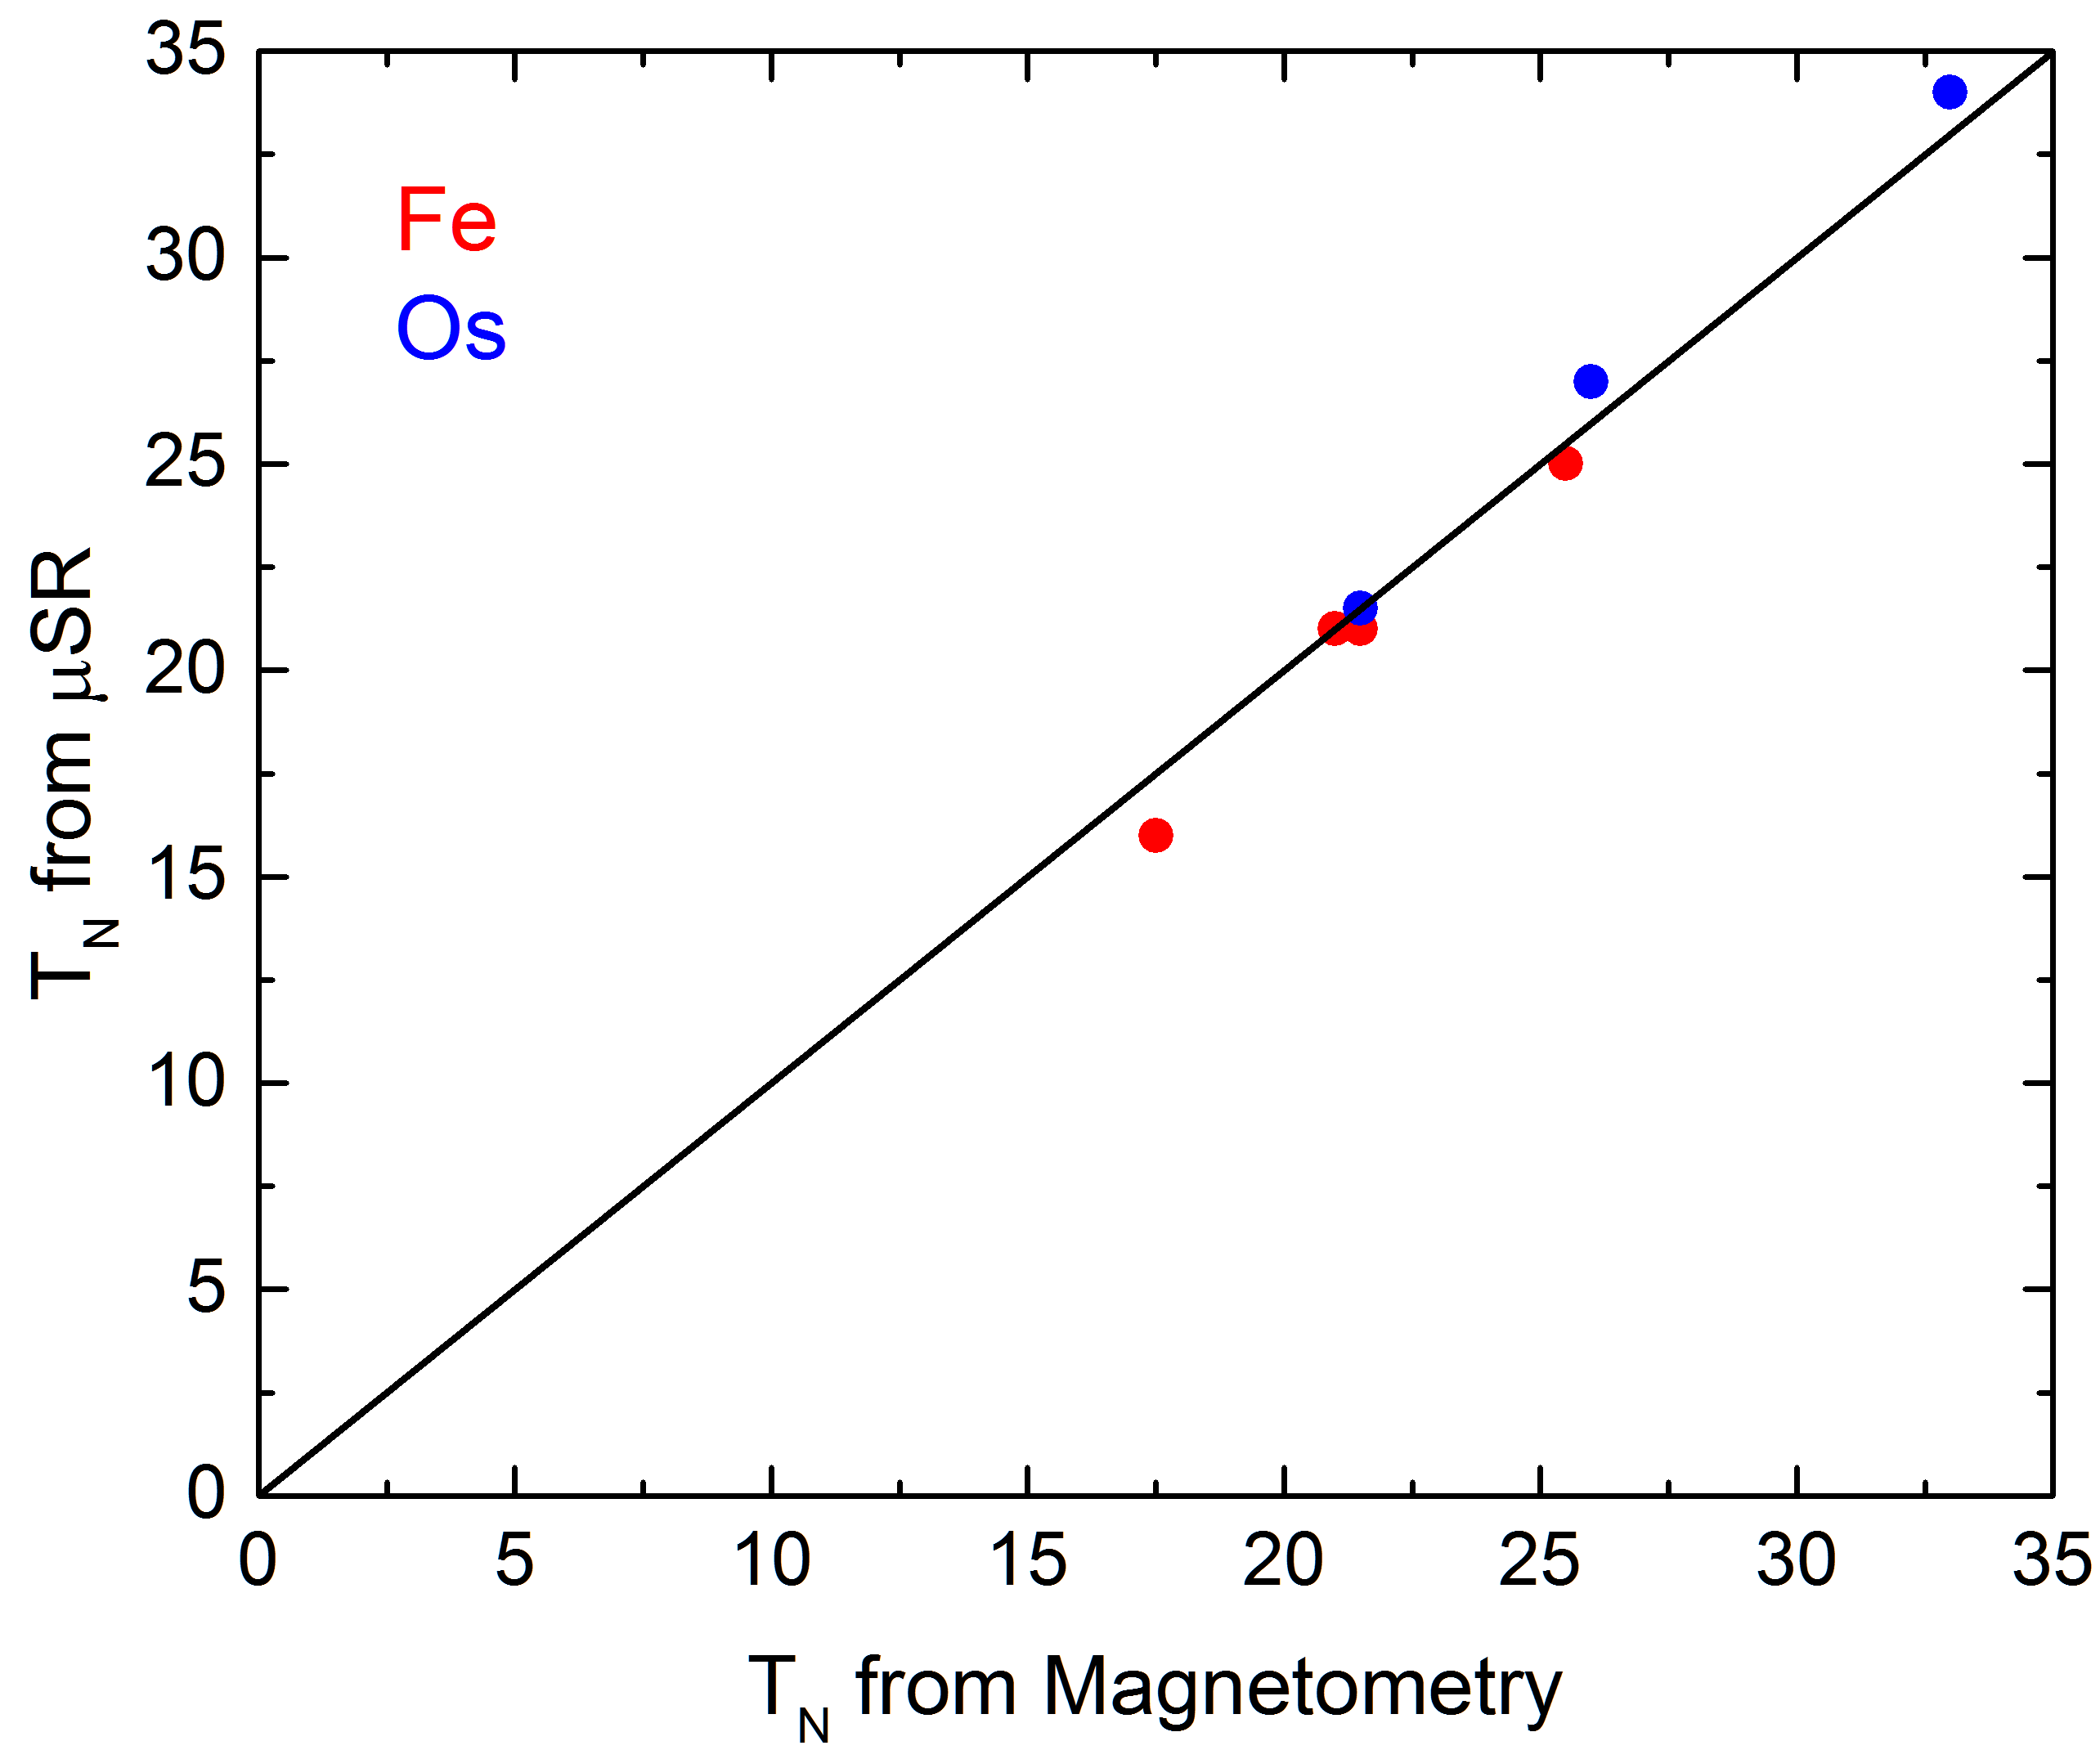
Second, with the exception of the x = 0.02 Fe doped sample, the internal field falls off smoothly as a function of temperature to zero at a transition temperature consistent with that shown by the magnetization measurements. This indicates that the system transitions directly from the magnetically ordered to paramagnetic (PM) states without the transition through HO that has been seen for intermediate pressures applied to URu2Si2 Amato2004 ; Hassinger2008 ; Bourdarot2014 ; Butch2010 . In the Fe = 0.02 sample the transition temperature from SR is 1.5 K lower than that measured by SQUID. This small discrepancy is unlikely to be caused by thermometry differences, as the same thermometry was used for SR measurements of all other samples where the transition temperatures appear more consistent as shown by Fig 6. Furthermore, the distinctly different temperature dependence in the magnetic volume fraction of this sample compared to the others leads us to believe that the magnetic state may not the same. One explanation for these discrepancies is if this sample is in a mixed HO/AF state below 17.5 K, with the volume fraction of the AF state decreasing up until 16 K leaving a pure HO state in a 1.5 K range between 16 and 17.5 K. In the pressure-temperature phase diagram of pure URu2Si2 there exists a small temperature range where decreasing temperature first causes a transition into hidden order and then to antiferromagnetism, so it would not be unexpected to find a similar region at low Fe dopings in our system. However, as the transitions measured by both techniques are reasonably broad, and the temperature discrepancy is small, it is not possible to draw firm conclusions about the existence of both HO and AF at different temperatures in this sample. Further measurements on this doping with other techniques, particularly those that show a direct signature of the HO state such as inelastic neutron scattering, which has been used to distinguish the two under pressure Butch2010 , will be required to clarify this issue.
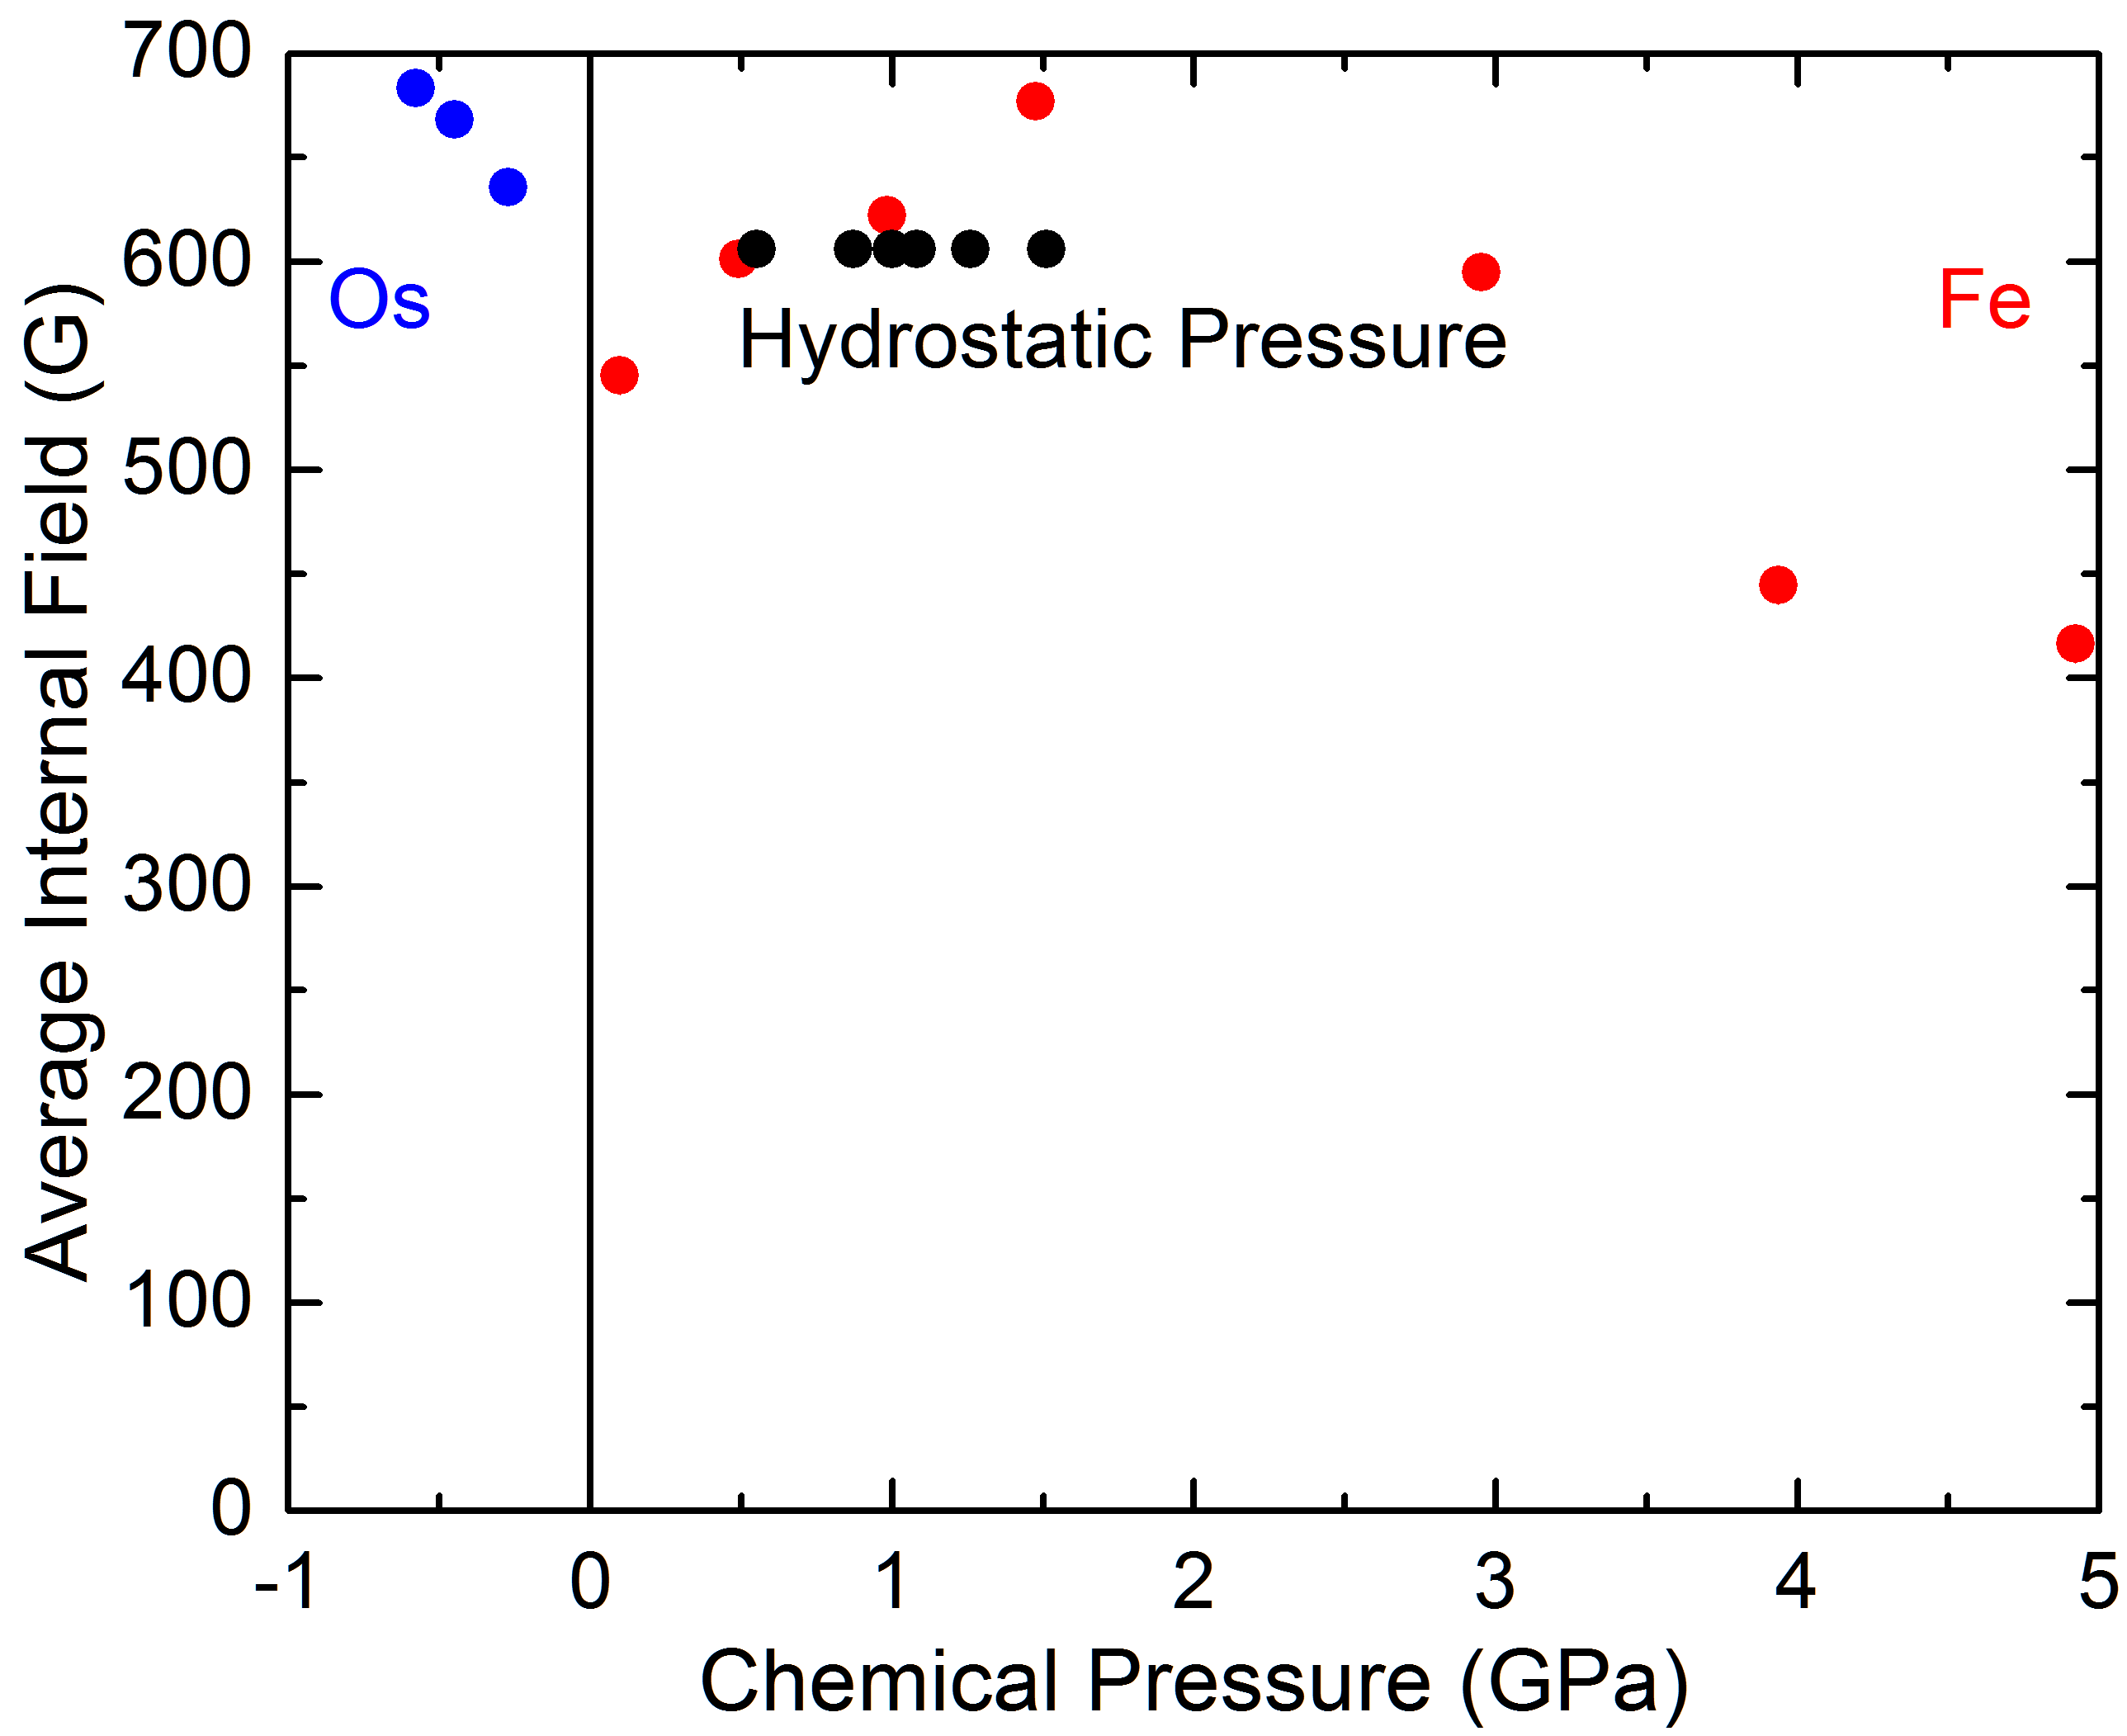
The overall behavior of the SR data presented in this work is similar to that seen in measurements on URu2Si2 under hydrostatic pressure Amato2004 . However, there are some notable differences. First, while the internal field measured at low temperature is comparable to that of Amato et al., our measured internal fields for both Os and Fe increase with doping, while the internal field above some critical pressure is constant for URu2Si2 under pressure Amato2004 . This difference in behavior is clearly demonstrated in Fig. 7 showing the low temperature internal fields measured for all samples in this study plotted as a function of chemical pressure along with the data from Amato et al. For this plot the effective chemical pressure, , was calculated using , where GPa-1 is the bulk modulus for pure URu2Si2 Kuwahara2003 , is the unit cell volume change from pure URu2Si2 taken from the crystallographic data in Refs Kanchanavatee2011 ; Kanchanavatee2014 using our nominal doping levels, and is the unit cell volume of pure URu2Si2. This figure also indicates that the appearance of magnetic order cannot be attributed to chemical pressure across this system as the Os doped samples show similar internal fields at effective chemical pressures that are negative and whose magnitude is significantly lower than that for Fe doping. The Fe sample also still shows magnetic order despite being at an effective chemical pressure less than a quarter of the pressure required to generate the LMAF in pure URu2Si2.
It has been proposed in the past that the transition between HO and LMAF is governed by the ratio as has been demonstrated for superconducting transitions in other f electron compounds Pfleiderer2009 , rather than uniform shrinking of the unit cell Yokoyama2005 ; Kanchanavatee2014 . While both Fe and Os doping do increase , the change is an order of magnitude smaller for Os doping than is seen for Fe doping or applied pressure. This indicates that the change in alone cannot explain the development of magnetic order.
Susceptibility data on the lower doped samples show a clear broad maximum at high temperatures, shown in Fig 8 (a) and (b). Such a maximum is expected for heavy fermion compounds and arises from the crossover from local-moment magnetism at high temperature to the heavy fermion state at low temperatures caused by the hybridization of the conduction electrons with the core -electrons Stewart1984 . Hence, the temperature of this crossover, , can be taken as a rough proxy for the strength of hybridization in these systems. Our data shows an increase in with doping for both Os and Fe, which suggests that hybridization between the U -electrons and the valence electrons increases with doping for both cases. Furthermore, Fig. 8 shows a similar linear correlation between and in both cases. This points to hybridization as the driving force behind the evolution of magnetic order in these systems. In contrast, measurements by others of as a function of pressure for pure URu2Si2 show a pressure-independent value of approximately 60K over a range where the magnetic transition temperature increases from 16 to 18.5K Nishioka2000 . This difference further emphasizes that the evolution of magnetism in our systems is not driven by chemical pressure alone.
Our results for Fe doping show some discrepancies with those reported recently by Das et al. using neutron scattering on crystals that should be similar to ours Das2015 . First, our internal fields increase with doping, while the results of Das et al. show either doping independence or a slight decrease with doping. Second, our measured internal field is roughly consistent with URu2Si2 under pressure, while Das et al. report a magnetic moment up to twice that measured for the LMAF in URu2Si2. Finally, we see similar magnetism down to low doping levels while Das et al. see weakening of the magnetism below x = 0.1.
The first discrepancy could be explained by slight changes to the muon stopping site with doping. If the muons systematically stop closer to the magnetic U atoms as the Fe doping increases, this would cause a small increase in our observed internal field even if the magnetic moments are constant or slightly decreasing. However, in a simplistic viewpoint the dopant Fe atoms should have electron orbitals with smaller spatial extent than the Ru, and hence one would expect the muon stopping sites to move closer to the Fe atoms and further from the magnetic U ions. This would cause a decrease in the measured internal field rather than an increase. Detailed numerical calculations of the likely muon stopping sites would be required to quantitatively determine the effect of the Fe doping. Another explanation for the doping dependence is Fe site magnetism contributing to the internal field, which could potentially be clarified with Mössbauer measurements that could directly measure the Fe magnetism.
The second discrepancy is difficult to reconcile. While SR cannot provide a numerical value of the magnetic moment without knowledge of the muon stopping site which we do not have, the comparison between the measured internal fields of samples with very similar structures should give a good idea of how the magnetic moment changes between these samples. Therefore, the Fe = 0.1 sample should be reasonably comparable to the pure compound under pressure and hence seeing a similar internal field here should indicate that the magnetic moments are the same. While the doping could change the muon stopping site somewhat between pure URu2Si2 and the Fe = 0.1 sample, the structure and lattice constants remain mostly the same and it seems unlikely that this would be a large enough effect to cut the measured internal field in half to make our results consistent with the magnetic moment measured by Das et al. One possibility is that there is signal intensity at the magnetic Bragg peak positions from multiple scattering that Das et al. may not have taken into account and would artificially inflate the calculated magnetic moments. Recent neutron diffraction on a number of the samples from this work utilize a different method of normalizing the data that reduces the effect of multiple scattering Williams2016 . These results find moments that are more consistent with the values obtained under pressure, possibly showing that incorrect normalization is the cause of our discrepancy with the work of Das et al.
The final discrepancy of our data showing magnetism down to lower doping levels may come down to slight variations in doping levels or internal strain between different crystals; however, the results are not entirely inconsistent. Das et al. report that there is some magnetic scattering still appearing in the lower doped samples, it is just substantially reduced. This could come from magnetic moments that are the same as those measured in higher doping samples, but with a reduced magnetic volume fraction, as the Bragg peak intensity cannot distinguish volume fraction from magnetic moment. A reduced volume fraction with similar magnetic moment would be qualitatively consistent with the results we show for our nominal Fe = 0.02 sample.
V Conclusion
In conclusion, we have presented SR measurements which demonstrate that URu2-xTxSi2 (T = Os, Fe) display antiferromagnetic order. This order persists down to low doping levels, with our Fe = 0.02 sample showing a lowered magnetic volume fraction that may indicate coexistence of HO and AF in this sample. Furthermore, the magnetic order persists down to Fe doping levels below that expected by a chemical pressure argument, and for Os dopings representing negative chemical pressure, which shows that the hidden order is very fragile and can easily be destroyed by even isoelectronic doping. These measurements, combined with the local moment - hybridization crossover temperature from susceptibility, demonstrate that magnetic order in isoelectronic doping is driven by changes in hybridization rather than purely structural changes.
VI Acknowledgments
We thank Dr. G.D. Morris, Dr. B.S. Hitti and Dr. D.J. Arseneau (TRIUMF) for their assistance with the SR measurements. Work at McMaster university was supported by the Natural Sciences and Engineering Research Council of Canada and the Canadian Foundation for Innovation. M.N.W acknowledges support from the Alexander Graham Bell Canada Graduate Scholarship program. T.J.W. acknowledges support from the Wigner Fellowship program at Oak Ridge National Laboratory. A.M.H acknowledges support from the Vanier Canada Graduate Scholarship program. G.M.L. acknowledges support from the Canadian Institute for Advanced Research. The Columbia University group acknowledges support from NSF DMR-1436095 (DMREF) and OISE-0968226 (PIRE), JAEA Reimei project, and Friends of Univ. of Tokyo Inc.
References
- (1)
- (2) G.R. Stewart. Reviews of Modern Physics 56, 755 (1984)
- (3) J.A. Mydosh and P.M. Oppeneer. Reviews of Modern Physics 83, 1301 (2011)
- (4) W. Schlabitz, J. Baumann, B. Pollit, U. Rauchschwalbe, H.M. Mayer, U. Ahlheim and C.D. Bredl. Zeitschrift für Physik B 62, 171 (1986)
- (5) T.T.M Palstra, A.A. Menovsky, J. van den Berg, A.J. Dirkmaat, P.H. Kes, G.J. Nieuwenhuys and J.A. Mydosh. Physical Review Letters 55, 2727 (1985)
- (6) C. Broholm, J.K. Kjems, W.J.L. Buyers, P. Matthews, T.T.M. Palstra, A.A. Menovsky and J.A. Mydosh. Physical Review Letters 58, 1467 (1987)
- (7) E.D. Isaacs, D.B. McWhan, R.N. Kleiman, D.J. Bishop, G.E. Ice, P. Zschack, B.D. Gaulin, T.E. Mason, J.D. Garrett and W.J.L. Buyers. Physical Review Letters 65, 3185 (1990)
- (8) M.B. Maple, J.W. Chen, Y. Dalichaouch, T. Kohara, C. Rossel, M.S. Torikachvili, M.W. McElfresh and J.D. Thompson. Physical Review Letters 56, 185 (1986)
- (9) D.A. Bonn, J.D. Garrett and T. Timusk. Physical Review Letters 61, 1305 (1988)
- (10) H. Amitsuka, M. Sato, N. Metoki, M. Yokoyama, K. Kuwahara, T. Sakakibara, H. Morimoto, S. Kawarazaki, Y. Miyako and J.A. Mydosh. Physical Review Letters 83, 5114 (1999)
- (11) N.P. Butch, J.R. Jeffries, S. Chi, J.B. Leão, J.W. Lynn and M.B. Maple. Physical Review B 82, 060408 (2010)
- (12) A. Amato, M.J. Graf, A. de Visser, H. Amitsuka, D. Andreica and A. Schenck. Journal of Physics: Condesned Matter 16, S4403 (2004)
- (13) D.E. MacLaughlin, D.W. Cooke, R.H. Heffner, R.L. Hutson, M.W. McElfresh, M.E. Schillaci, H.D. Rempp, J.L. Smith, J.O. Willis, E. Zirngiebl, C. Boekema, R.L. Lichti and J. Oostens. Physical Review B 37, 3153 (1988)
- (14) G.M. Luke, A. Keren, L.P. Le, Y.J. Uemura, W.D. Wu, D. Bonn, T. Taillefer, J.D. Garret and Y. Onuki. Hyperfine Interactions 85, 397 (1994)
- (15) K. Matsuda, Y. Kohori, T. Kohara, K. Kuwahara and H. Amitsuka. Physical Review Letteres 87, 087203 (2001)
- (16) H. Amitsuka, K. Matsuda, I. Kawasaki, K. Tenya, M. Yokoyama, C. Sekine, N. Tateiwa, T.C. Kobayashi, S. Kawarazaki and H. Yoshizawa. Journal of Magnetism and Magnetic Materials 310, 214 (2007)
- (17) C.R. Wiebe, J.A. Janik, G.J. MacDougall, G.M. Luke, J.D. Garrett, H.D. Zhou, Y.-J. Jo, L. Balicas, Y. Qiu, J.R.D. Copley, Z. Yamani and W.J.L. Buyers. Nature Physics 3, 96 (2007)
- (18) A.F. Santander-Syro, M. Klein, F.L. Boariu, A. Nuber, P. LeJay and F. Reinert. Nature Physics 5, 637 (2009)
- (19) S. Chatterjee, J. Trinckauf, T. Hänke, D.E. Shai, J.W. Harter, T.J. Williams, G.M. Luke, K.M. Shen and J. Geck. Physical Review Letters 110, 186401 (2013)
- (20) A.R. Schmidt, M.H. Hamidian, P. Wahlm F. Meier, A. Balatsky, J.D. Garret, T.J. Williams, G.M. Luke and J.C. Davis. Nature 465, 570 (2010)
- (21) J.A. Mydosh and P.M. Oppeneer. Philosophical Magazine 94, 3640 (2014)
- (22) S.K. Dhar, R.J. Begum, P. Raj, P. Suryanarayana, L.C. Gupta and R. Vijayaraghavan. Solid State Communications 83, 965 (1992)
- (23) J.-G. Park and B.R. Coles. Journal of Physics: Condensed Matter 6, 1425 (1994)
- (24) M. Ocko and J.-G. Park. Physica B 230-232, 71 (1997)
- (25) H. Amitsuka, K. Kuwahara, M. Yokoyama, K. Tenya, T. Sakakibara, M. Mihalik and A.A. Menovský. Physica B: Condensed Matter 281-282, 326 (2000)
- (26) H. Amitsuka, K. Hyomi, T. Nishioka, Y. Miyako and T. Suzuki. Journal of Magnetism and Magnetic Materials 76 & 77, 168 (1988)
- (27) Y. Dalichaouch, M.B. Maple, R.P. Guertin, M.V. Kuric, M.S. Torikachvili and A.L. Giorgi. Physica B 163, 113 (1990)
- (28) Y. Dalichaouch, M.B. Maple, J.W. Chen, T. Kohara, C. Rossel, M.S. Torikachvili and A.L. Giorgi. Physical Review B 41, 1829 (1990)
- (29) J.-G. Park. Journal of Physics: Condensed Matter 6, 3403 (1994)
- (30) N.P. Butch and M.B. Maple. Journal of Physics: Condensed Matter 22, 164204 (2010)
- (31) M. Yokoyama, H. Amitsuka, S. Itoh, I. Kawasaki, K. Tenya and H. Yoshizawa.Journal of the Physical Society of Japan 73, 545 (2004)
- (32) N. Kanchanavatee, M. Janoschek, R.E. Baumbach, J.J. Hamlin, D.A. Zocco, K. Huang and M.B. Maple. Physical Review B 84, 245122 (2011)
- (33) P. Das, N. Kanchanavatee, J.S. Helton, K. Huang, R.E. Baumbach, E.D. Bauer, B.D. White, V.W. Burnett, M.B. Maple, J. W. Lynn and M. Janoschek. Physical Review B 91, 085122 (2015)
- (34) N. Kanchanavatee, B.D. White, V.W. Burnett and M.B. Maple. Philosophical Magazine 94, 3681 (2014)
- (35) A. Suter and B.M. Wojek. Physics Procedia 30, 69 (2012)
- (36) R.E. Honig. RCA review 23, 567 (1962)
- (37) W. Yu, A.A. Aczel, T.J. Williams, S.L. Bud’ko, N. Ni, P.C. Canfield and G.M. Luke. Physical Review B 79, 020511(R) (2009)
- (38) A. Szytula, M. Slaski, B. Dunlap, Z. Sungaila and A. Umezawa. Journal of Magnetism and Magnetic Materials 75, 71 (1988)
- (39) T.T.M Palstra, A.A. Menovsky, G.J. Nieuwenhuys and J.A. Mydosh. Journal of Magnetism and Magnetic Materials 54-57, 435 (1986)
- (40) F. Bourdarot, S. Raymond and L.-P. Regnault. Philisophical Magazine 94, 3702 (2014)
- (41) E. Hassinger, G. Knebel, K. Izawa, P. Lejay, B. Salce and J. Flouquet. Physical Review B 77, 115117 (2008)
- (42) K. Kuwahara, H. Sagayama, K. Iwasa, M. Kohgi, S. Miyazaki, J. Nozaki, J. Nogami, M. Yokoyama, H. Amitsuka, H. Nakao and Y. Murakami. Acta Physica Polonica B 34, 4307 (2003)
- (43) C. Pfleiderer. Superconducting phases of f-electron compounds. Reviews of Modern Physics 81, 1551 (2009)
- (44) M. Yokoyama, H. Amitsuka, K. Tenya, K. Watanabe, S. Kawarazaki, H. Yoshizawa and J.A. Mydosh. Physical Review B 72, 214419 (2005)
- (45) T. Nishioka, H. Mukai, S. Nakamura, G. Motoyama, Y. Ushida and N.K. Sato. Journal of the Physical Society of Japan 69, 2415 (2000)
- (46) T.J. Williams et al., unpublished.