Toward a Comprehensive Model of Snow Crystal Growth:
4. Measurements of Diffusion-limited Growth at -15 C
Kenneth Libbrecht1, Christopher Miller2, Ryan Potter3,
Nina Budaeva1, Cameron Lemon3, Sarah Thomas3
1Department of Physics, California Institute of Technology
Pasadena, California 91125
2Department of Physics, University of North Carolina at Chapel Hill
Chapel Hill, North Carolina 27599
3Department of Physics, University of Cambridge
Cambridge, England CB3 0HE
(send correspondence to kgl@caltech.edu)
Abstract. We present measurements of the diffusion-limited growth of ice crystals from water vapor at different supersaturation levels in air at a temperature of -15 C. Starting with thin, c-axis ice needle crystals, the subsequent growth morphologies ranged from blocky structures on the needle tips (at low supersaturation) to thin faceted plates on the needle tips (at high supersaturation). We successfully modeled the experimental data, reproducing both growth rates and growth morphologies, using a cellular-automata method that yields faceted crystalline structures in diffusion-limited growth. From this quantitative analysis of well-controlled experimental measurements, we were able to extract information about the attachment coefficients governing ice growth under different circumstances. The results strongly support previous work indicating that the attachment coefficient on the prism surface is a function of the width of the prism facet. Including this behavior, we created a comprehensive model at -15 C that explains all the experimental data. To our knowledge, this is the first demonstration of a kinetic model that reproduces a range of diffusion-limited ice growth behaviors as a function of supersaturation.
1 Introduction
Our overarching goal in this series of investigations is to develop a comprehensive model of ice crystal growth from water vapor, one that can reproduce quantitative growth rates as well as growth morphologies over a broad range of circumstances. Although ice crystal formation has been studied extensively for many decades, our understanding of the physical effects governing growth behaviors at different temperatures and supersaturations remains rather poor [1, 2, 3, 4, 5, 6, 7]. For example, the complex dependence of ice growth morphology on temperature, exhibiting several transitions between plate-like and columnar structures [8, 9], remains essentially unexplained even at a qualitative level, although it was first reported over 75 years ago [1].
To address this problem, we have undertaken an experimental program designed to create small ice crystals with simple morphologies and measure their subsequent growth under carefully controlled conditions, to an extent and accuracy surpassing previous efforts [10, 11, 12, 13, 14]. We model the experimental data using a recently developed cellular-automata numerical method that can generate physically realistic faceted structures in diffusion-limited growth [15, 16, 17, 18, 19, 20]. The comparison between measured and modeled ice crystals then provides valuable information about the attachment kinetics governing ice growth from water vapor. From this information we hope to develop a detailed physical picture of the molecular structure and dynamics of the ice surface during solidification.
2 Ice Growth Measurements in a Dual Diffusion Chamber
The ice growth measurements described in this paper were obtained used the dual diffusion chamber described in [21]. The first of the two diffusion chambers was operated with a high water-vapor supersaturation in air, and in this chamber we grew electrically enhanced ice needles with tip radii ~100 nm and overall lengths of ~3 mm, with the needle axis along the c-axis of the ice crystal. The needle crystals were then transported to the second diffusion chamber, where the temperature and supersaturation were independently controlled, and the subsequent growth was recorded using optical microscopy. A linear temperature gradient in the second chamber ensured that convection currents were suppressed and that the supersaturation could be accurately modeled.
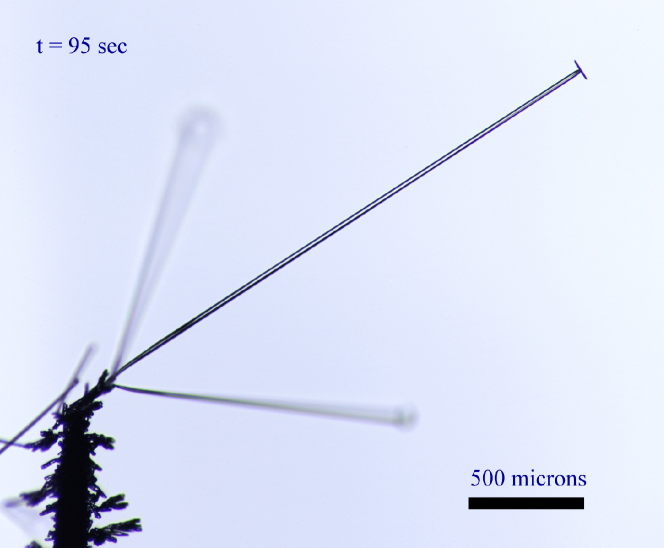
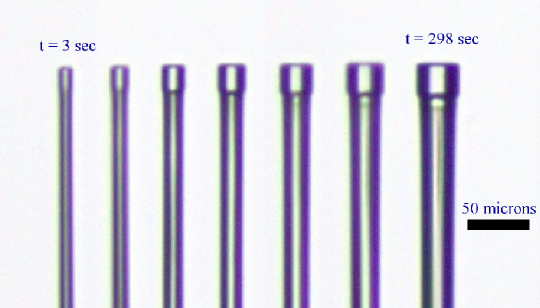
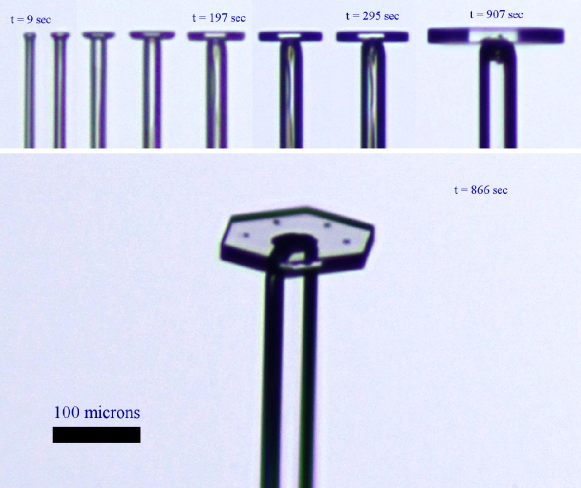
Immediately after an ice needle assembly was moved to the second diffusion chamber, the wire base holding the needles was rotated so a particular test needle was in focus in the microscope with the needle entirely in the focal plane, providing a side view of the subsequent ice growth, as shown in Figure 1. During this transport and focusing step, a thin, frost-covered, horizontal shutter plate was positioned just above the ice needles, reducing the supersaturation below the plate to near zero. Once the test needle was satisfactorily positioned (typically taking 10-20 seconds), the shutter was removed and growth measurements commenced. The supersaturation near the test crystal relaxed to steady state in a time of order seconds, where cm is the shutter size and msec is the diffusion constant for water vapor in air.
For all the measurements described below, the air temperature surrounding the ice needles was maintained at C, as determined by a small calibrated thermistor that was periodically placed at the center of the diffusion chamber, at the same location as the ice needles during their growth. The supersaturation was varied by changing the linear temperature gradient inside the diffusion chamber.
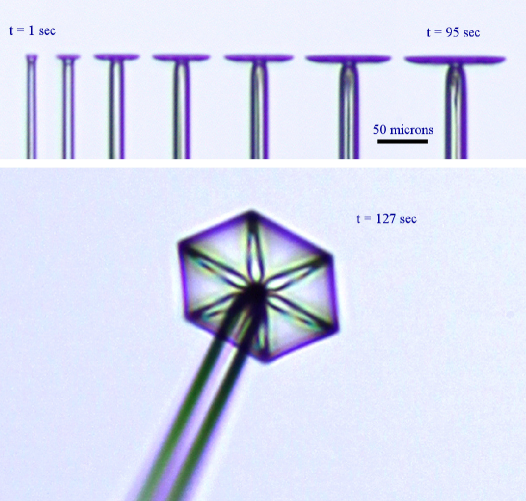
In a typical growth run at C (observing a single needle crystal), still photos were taken periodically to record the growth after the shutter was removed. For supersaturations percent surrounding the growing crystals, ice needles grew slowly into simple columnar structures. The morphology changed with increasing first to blocky structures on the needle tips, then to thick plates, and then to thin faceted hexagonal plates at percent, as shown in Figure 1. For percent, stellar dendrites and finally fernlike stellar dendrites appeared on the needle ends, as described in [21]. The work presented here is limited to percent, so the growth morphologies all exhibited faceted prism surfaces. The growth of these structures could be quantitatively modeled using a 2D cylindrically symmetric cellular automata code, as described in [18], thus avoiding the necessity of a full 3D code.
The radius of the plate (or block) at the end of an ice needle as a function of time, was extracted directly from the image data, as was the needle radius, measured at a position 100 m below the needle tip. (We did not distinguish the different “radii” of a projected hexagonal structure in our image data, thus limiting the absolute accuracy of our measurements of and to percent.) The height of the needle, was measured with respect to a “base reference” that consisted of one or more reference points in the frost cluster covering the wire substrate at the base of the thin ice needle (for example, see Figure 1). The quality and stability of the base references varied from run to run, and the frost cluster typically grew and changed with time during a run. As a result, our measurements of were subject to significant uncontrolled systematic errors, making them less accurate than our measurements of and
2.1 Supersaturation in the Diffusion Chamber
The temperatures of the top and bottom of the second diffusion chamber were defined by so (see [21] for the chamber dimensions). The thermal characteristics of the chamber walls were designed to produce an accurately linear temperature gradient within the chamber, as described in [21]. This allows us to use a plane-parallel approximation (moving the side walls out to infinity) to estimate the water-vapor supersaturation at the chamber center, where the test crystals were positioned. Solving the diffusion equation for temperature reproduces the linear temperature profile inside the chamber, with Similarly, solving the diffusion equation for water vapor density also yields a linear function with From these two solutions, the supersaturation at the center of the chamber is
and this expression gives the exact value for in the plane-parallel approximation (ignoring small changes in with temperature).
For small (where as defined above), we expand the above expression to obtain
and the value of ranges from 0.00282 C-2 at -1 C to 0.00314 at -10 C and 0.00332 at -20 C.
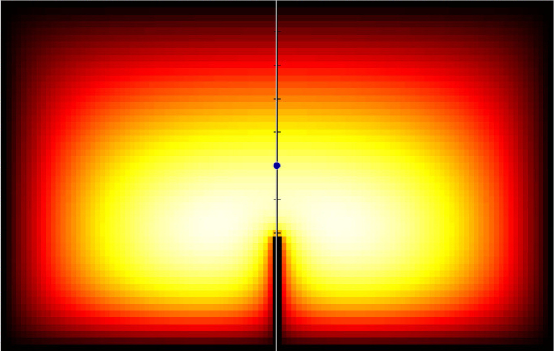
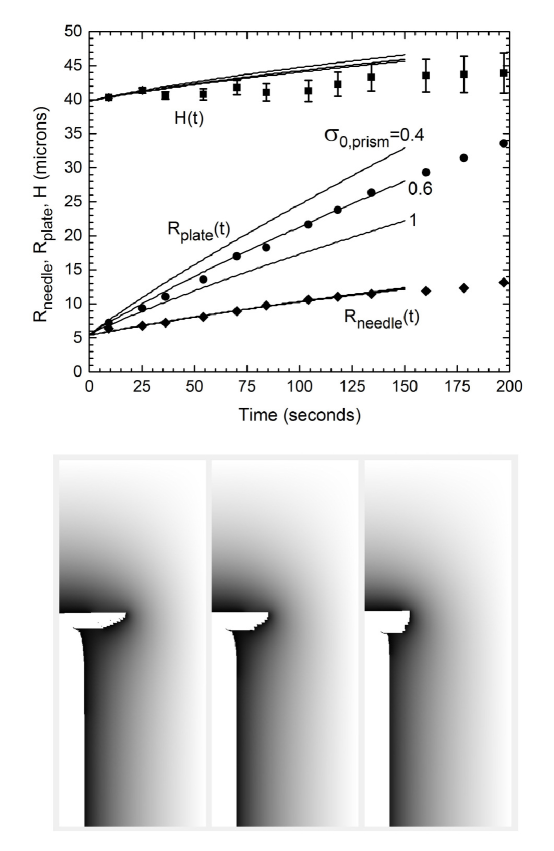
We improved upon the plane-parallel approximation by examining a range of computational models of the diffusion chamber under different conditions, with an example shown in Figure 2. In these models we solved the dual-diffusion problem (temperature and water-vapor density) numerically in three dimensions, performing a number of tests where we changed the positions of the chamber walls and examined effects of the post supporting the test crystals. We found that, over a broad range of conditions near C, the side walls reduced by a factor of approximately 0.8 compared to the plane-parallel approximation, and an ice-covered central stem further reduced by a factor of approximately 0.9. At C and small , these two factors together changed the supersaturation from the plane-parallel approximation of to a lower
3 Quantitative Growth Modeling
3.1 Measuring Supersaturation
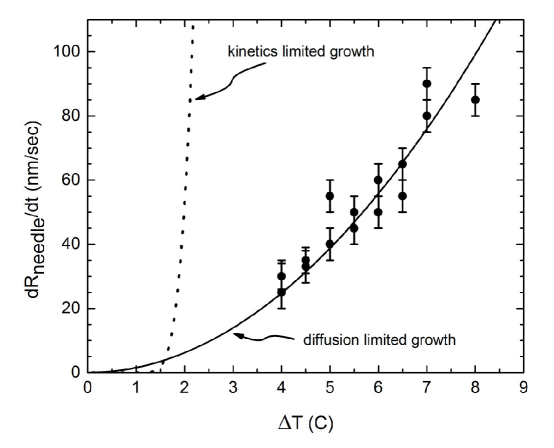
In all the measurements presented here, we found that the needle growth measured 100 m below the needle tip was a good indicator of the supersaturation surrounding the test crystals. Figure 3 shows measured at a time (near the beginning of a growth run) when m, as a function of the chamber defined above. A one-parameter quadratic fit yielded 1.55 nm/sec, and this curve is plotted along with the data in Figure 3. The dotted line in the figure shows a purely kinetics-limited growth model with where the kinetic coefficient of the prism surface is [22], m/sec [7], and . In this model we took from direct measurements of kinetics-limited growth [22]. The fact that the dotted curve lies far above the solid curve in Figure 3 indicates that the needle growth rate was primarily diffusion limited and was therefore independent of to a good approximation.
We can see that this result is expected by considering the growth of an infinitely long ice cylinder. Assuming a constant supersaturation on a cylindrical outer boundary located at an analytic solution of the diffusion equation gives the growth rate of the ice surface at as
where m (assuming growth at C in air at a pressure of one bar) and [18]. For the case the growth is limited primarily by diffusion, giving
Assuming from our chamber modeling calculations above, along with m, we then obtain
Equating this with the fit curve in Figure 3 yields or mm. While this is consistent with our expectation for a distant outer boundary, we cannot say much more because the true outer boundary in our experiment is more complex than a simple cylindrical surface. Unlike the spherical case, we cannot simply assume that the outer boundary is at infinity in the cylindrical case.
This analytical analysis shows that the growth rate was mainly diffusion-limited in our measurements, and was thus essentially independent of This statement relies on the condition , which was true for all the measurements presented here. Thus the diffusion-limited measurements shown in Figure 3 are consistent with, and expected from, the kinetics-limited growth measurements presented in [22].
4 Detailed Analysis of Test Crystals
We next look at in-depth analyses of three growth runs at different supersaturations. These three examples were typical of all our observations, although we chose the highest quality data sets to analyze further. Because each test crystal presented somewhat different initial conditions, we found that analyzing specific test cases was preferable to considering measurements averaged over many crystals.
4.1 High Supersaturation Thin Plates
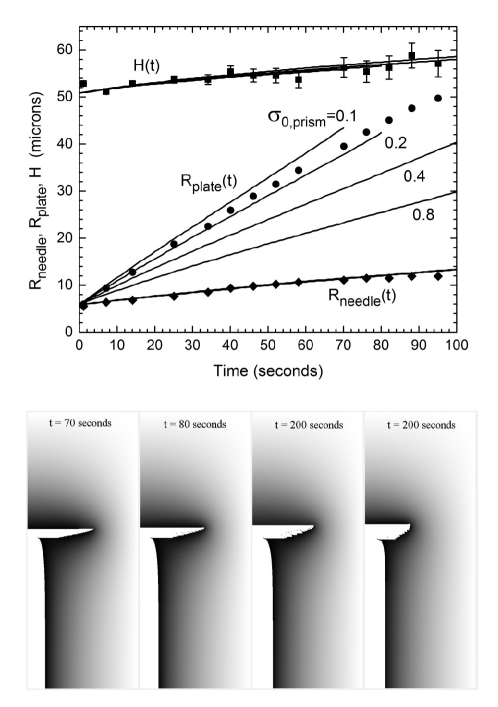
Our first measurement series, shown in Figure 4, shows a faceted, plate-like crystal growing on the end of an ice needle. It was taken with C, at a supersaturation level (equal to the supersaturation at this position if the crystal were absent) of percent. Figure 5 shows measurements of at a position 100 m below the needle tip, and extracted from the image data. Additional measurements with C yielded dendritic plate-like structures instead of faceted plates, as described in [21].
The origin of the time axis was set equal to the time when so the crystal morphology was that of a simple column at The point was typically determined from an extrapolation of data.
We modeled these data using the cylindrically symmetric cellular automata model described in [18], including the modification for surface diffusion described in [19]. The results of several model calculations are shown together with the experimental data in Figure 5. Typical model parameters included a boundary box with pixels = 72.5 m and pixels = 181 m, m (the initial needle height), C, [19], Gibbs-Thomson parameter nm [18], and surface diffusion lengths nm for both facets [23, 19, 24]. The models yielded and for comparison with data, plus the crystal morphology and supersaturation near the crystal surface.
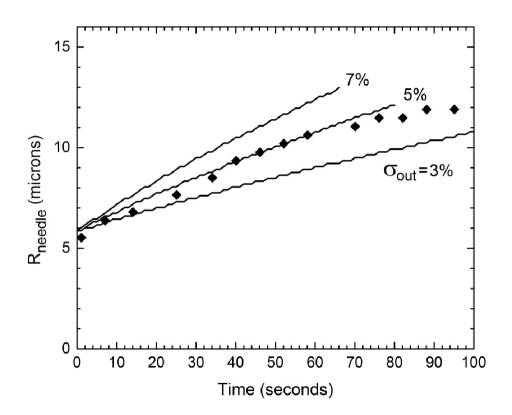
We first used the numerical models to verify that was sensitive to (the supersaturation at the outer boundary of the model box) and that was insensitive to other model parameters, including Figure 6 shows the same data as in Figure 5 along with several model crystals. As seen in the figure, fitting the data required a model supersaturation of percent. As expected from the above discussion, additional models (not shown) confirmed that was insensitive to other model parameters, including
The fact that the best fit percent is smaller than our estimated percent arises from the finite size of the model box, which was much smaller than any reasonable estimate for the outer boundary of the experimental system (for example the 36 mm described above). Using m and m gives which is smaller than the value above by a factor of 0.3, comparable to In other words, is smaller than because is the supersaturation far from the growing crystal, while gives the supersaturation quite close to the crystal. If the outer dimensions of the model space were orders of magnitude larger, we expect that the best fit would be much closer to To compensate for the small model size, we chose to fit the experimental data.
What this meant in practice is that we could use the data to accurately determine the correct in the models, because is quite sensitive to this parameter, while being insensitive to other model parameters. Therefore, for the discussion that follows, we adjusted to fit the data, and then did not change further. Because the needle growth was mainly limited by diffusion, the needle surface acted as a “witness surface” to accurately constrain in our models. We found this to be true over a broad range of experimental conditions, and this ended up being a quite beneficial feature of growing ice crystals on thin ice needles using our dual-chamber apparatus, as it allowed better quantitative analysis than would have been possible otherwise.
Having used to fix percent, we generated the four growth models in Figure 5 using [22] with (displaying here in percent), and similarly with percent and m. Note that the four curves for lie on top of one another in Figure 5, confirming that depends mainly on which was the same for these four models.
The values for and were taken from the measurements in [22], as was the parameterization for both facets. (This parameterization describes growth that is limited by 2D nucleation on atomically flat surfaces [7].) The data show, however, that needed to be near 0.15 percent, which is much smaller than the percent reported in [22]. These results quantify, for a specific parameterization of , that we must have to form a thin ice plate, as one would expect. The results also indicate for the edge of the plate-like crystal, which is consistent with the observation that the plate growth is no longer faceted if is slightly larger. The utility of these results becomes apparent when we compare different measurements in an attempt to form a global growth model, as we discuss below, after we first examine additional experimental data.
4.2 Low Supersaturation Blocky Columns
Our next set of data was taken at C, so the supersaturation surrounding the growing crystal was percent. Several example images are shown in Figure 7. In contrast to the high-supersaturation case described in the previous section, here we see a faceted block growing on the end of the ice needle. Additional measurements with C yielded basic columnar structures with some negative tapering (the tip wider than the base).
We modeled these data using the model parameters described above, except our best fit to was obtained with percent. Again we used and with and m. The results of these models are shown in Figure 8 along with the corresponding crystal morphologies.
We obtained a good fit to the data with percent, which is much higher than the high-sigma value of percent. And again, the percent model fits both the morphology and quantitative growth behavior of the crystal. Note that the parameterization includes an intrinsic supersaturation dependence, and the usual assumption for nucleation-limited growth is that is constant [22]. The meaning of a changing value is discussed below.
The models did not accurately reproduce the data in Figure 8, but we believe that the substantial systematic errors in our measurements (described above) could explain the discrepancy. The experimental uncertainties in our data are great enough that we could not obtain much useful information about using needle growth measurements. The change in , by contrast, is a robust result from these data.
4.3 Intermediate Supersaturation Thick Plates
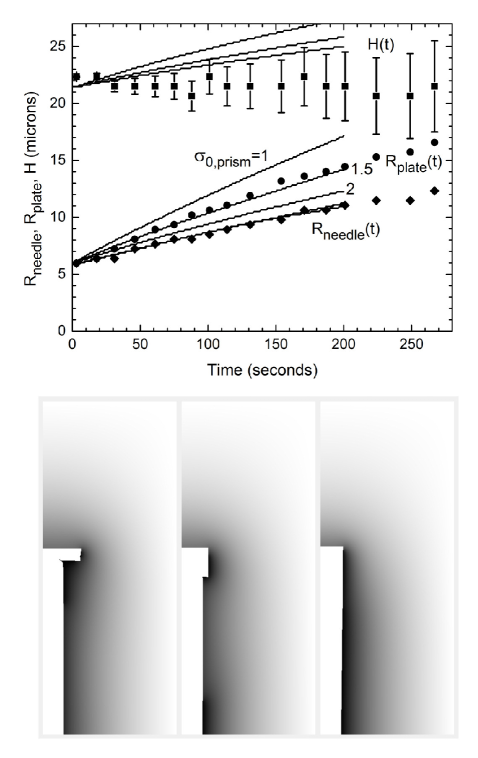
Finally, Figure 9 shows a run taken at C, with the corresponding supersaturation around the crystals percent. At this intermediate supersaturation we see a thick, faceted plate growing on the end of the ice needle, intermediate between the preceding high- and low- data sets, as one would expect. Measurements from this data set are shown in Figure 10 along with several growth models.
The three models shown in Figure 10 used and with , along with model parameters percent and m. As with the previous two example crystals, we found we could fit the crystal morphology and quantitative growth rates reasonably well with a fairly simple model, mainly adjusting to fit the data and then adjusting to fit the data. In all cases the model behavior was relatively insensitive to the other input parameters, provided these were sensibly chosen.
The model calculations showed that the plate thickness increased with time via growth of the top surface of the plate, with very little growth of the lower surface. This provided some insight into systematic errors in since we could use the plate thickness as an additional measurement of that did not include a far-away base reference. We found that the new data fit the model calculations quite well using while the data shown in Figure 10 did not match the models as well. This again suggested that the data presented here are likely consistent with the intrinsic value of percent presented in [22]. The relatively poor model fits to may arise entirely from systematic errors in our measurements of , as described above. Put another way, the measurements from the dual-chamber data presented here are not accurate enough to yield solid conclusions about In contrast, the and data are quite accurate, yielding robust conclusions from a careful examination of the data and growth models.
4.4 Model Comparisons
It is instructive to use the growth models to extract information about the supersaturation at the surface of the growing test crystals. For example, a model of the thin-plate crystal with percent (which fits the data quite well, as seen in Figure 5) indicates that percent on the edge of the plate, a value that is nearly constant in time (yielding the nearly constant seen in Figure 5). Similarly, the model of the blocky crystal with percent (shown in Figure 8) gives percent on the top edge of the block. Thus we see that the supersaturation at the prism surface of the fast-growing plate is not substantially higher than the supersaturation at the prism surface of the slow-growing block.
Changing the parameterization of does not significantly change this somewhat counter-intuitive result. Switching to models with a constant (independent of supersaturation), we find that a high is needed to reproduce the thin-plate data (both the morphology and growth rates), while a much lower is necessary to reproduce the blocky-crystal data. For both these parameterizations, we find that a large change in is responsible for the large change in morphology and growth rates; the supersaturation at the prism surface actually changes very little between these two cases.
This result strongly supports the hypothesis [25] that is a strong function of the width of the prism facet when approaches atomic dimensions, at least for ice growth from water vapor near -15 C. Other hypotheses are excluded by observations indicating that: 1) on a broad prism facet, the functional form (with constant ) fits low-pressure growth data over a broad range of growth conditions [25, 22], and 2) is about the same for the thin-plate and blocky column examples shown above. If we reject the hypothesis that depends on the width of the prism facet, there remains (in our opinion) no physically plausible way to explain all the data.
5 A Comprehensive Ice Growth Model
Allowing to vary with the width of the prism facet, we found it straightforward to devise a single ice growth model that reproduced all the data presented above. We added a single new parameter to our above parameterization of , changing it to with where is the new model parameter and is a surrogate for the width of the prism facet (here is the number of model pixels comprising the outermost prism facet, as described in [18]). We assumed percent from the measurements in [22].
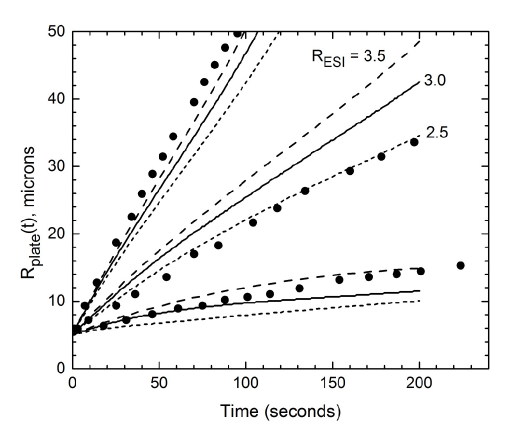
Applying this new model to the three data sets described above yields the result shown in Figure 11. These models use and percent, m, and As seen in the plot, adding the additional model parameter allows us to reproduce the morphological transition from blocky column to thin plate with increasing supersaturation. The morphologies of the models were similar to the best-fit constant- models shown above.
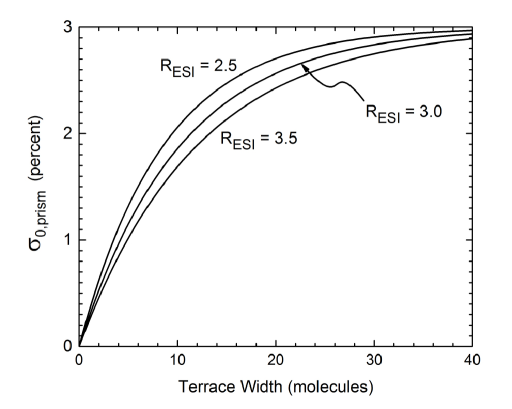
Figure 12 shows how depends on the width of the uppermost prism terrace in our model. Here we have converted the model parameter to using where nm is the size of a water molecule. (A discussion of this conversion is described in detail in [19]). This plot shows that is essentially equal to when the terrace width is greater than molecules. And for such broad terraces, we use the measured from [22]. But when becomes smaller, decreases until (and therefore when
We can only speculate as to why has the form shown in Figure 12; we have no detailed molecular model that would explain this behavior. However, there is also no molecular model at present that can explain the measured for large prism facets [22]. The latter derives from the change in the step energy of a prism facet with temperature [22], but step energies in ice have received little experimental and theoretical attention to date. We believe that molecular dynamics simulations could shed considerable light on why the step energies in ice behave as they do, but for now we do not understand this rather fundamental aspect of ice energetics.
6 Discussion
In summary, we have described a comprehensive model of ice growth from water vapor at -15 C that reproduces both morphologies and measured growth rates with reasonable fidelity over a range of supersaturations. In particular, our model nicely explains the observed morphological transition from blocky columns to thin plates growing on the ends of ice needle crystals. This transition is described as an edge-sharpening instability in the ice growth behavior, brought about by a sharp reduction in the nucleation barrier on a prism facet (parameterized by ) when the width of the facet approaches molecular dimensions.
Our quantitative computer modeling of carefully controlled growth measurements drove the development of this picture of ice growth dynamics. By comparing the above measurements with those described in [22], we found no viable alternative to the hypothesis that changes with the width of the prism terrace. Since the 2D nucleation model (defining from the molecular step energy of the ice surface via classical nucleation theory) fits the ice growth so well in [22], it was a modest conceptual step to model the change in as a change in as we did above.
To our knowledge, this is the first time a kinetic model of the diffusion-limited growth of ice has successfully reproduced measured growth behaviors over a range of supersaturations. We believe this is a significant step toward out ultimate goal of modeling ice growth behavior as a function of both temperature and supersaturation. The model parameters determined from these efforts (such as the molecular step energies on faceted ice surfaces) should lead to a better understanding of the surface structure and dynamics of ice crystals and ice crystallization.
We acknowledgement support from the Cambridge-Caltech Exchange Program, Caltech’s WAVE Fellows Program, and the SURF program at Caltech.
References
- [1] U. Nakaya. Snow Crystals. Harvard University Press: Cambridge, 1954.
- [2] B. J. Mason, G. W. Bryant, and A. P. Van den Heuvel. The growth habits and surface structure of ice crystals. Phil. Mag., 8:505–526, 1972.
- [3] D. Lamb and W. D. Scott. Linear growth rates of ice crystals grown from the vapor phase. J. Cryst. Growth, 12:21–31, 1972.
- [4] T. Kuroda and R. Lacmann. Growth kinetics of ice from the vapour phase and its growth forms. J. Cryst. Growth, 56:189–205, 1982.
- [5] W. Beckmann, R. Lacmann, and A. Blerfreund. Growth rates and habits of ice crystals grown from the vapor phase. J. Phys. Chem., 87:4142–4146, 1983.
- [6] Jon Nelson and Charles Knight. Snow crystal habit changes explained by layer nucleation. J. Atmos. Sci., 55:1452–1465, 1998.
- [7] K. G. Libbrecht. The physics of snow crystals. Rep. Prog. Phys., 68:855–895, 2005.
- [8] M. Bailey and J. Hallett. Growth rates and habits of ice crystals between -20c and -70c. J. Atmos. Sci., 61:514–544, 2004.
- [9] Matthew Bailey and John Hallett. A comprehensive habit diagram for atmospheric ice crystals: confirmation from the laboratory, airs ii, and other field studies. J. Atmos. Sci., 66:2888–2899, 2009.
- [10] Charles A. Knight. Ice growth from the vapor at -5 c. J. Atmos. Sci., 69:2031–2040, 2012.
- [11] Matthew Bailey and John Hallett. Ice crystal linear growth rates from -20 to -70c: Confirmation from wave cloud studies. J. Atmos. Sci., (69):390–402, 2012.
- [12] Minoru Maruyama. Roughening transition of prism faces of ice crystals grown from melt under pressure. J. Cryst. Growth, 275:598–605, 2005.
- [13] J. Nelson. Growth mechanisms to explain the primary and secondary habits of snow crystals. Phil. Mag., 81:2337–2373, 2001.
- [14] Toshio Kuroda and Takehiko Gonda. Rate determining processes of growth of ice crystals from the vapour phase - part ii: Investigation of surface kinetic processes. J. Meteor. Soc. Jap., 62:563–572, 1984.
- [15] C. A. Reiter. A local cellular model for snow crystal growth. Chaos, Solitons, and Fractals, 23:1111–1119, 2005.
- [16] Janko Gravner and David Griffeath. Modeling snow crystal growth ii: A mesoscopic lattice map with plausible dynamics. Physica D, 237:385–404, 2008.
- [17] Janko Gravner and David Griffeath. Modeling snow-crystal growth: A three-dimensional mesoscopic approach. Phys. Rev. E, 79:011601, Jan 2009.
- [18] Kenneth G. Libbrecht. Quantitative modeling of faceted ice crystal growth from water vapor using cellular automata. J. Computational Methods in Phys., (ID-174806), 2013.
- [19] Kenneth G. Libbrecht. Incorporating surface diffusion into a cellular automata model of ice growth from water vapor. arXiv:, (1509.08543), 2015.
- [20] James G. Kelly and Everett C. Boyer. Physical improvements to a mesoscopic cellular automaton model for three-dimensional snow crystal growth. arXiv:, (1308.4910), 2013.
- [21] Kenneth G. Libbrecht. A dual diffusion chamber for observing ice crystal growth on c-axis ice needles. arXiv:, (1405.1053), 2014.
- [22] Kenneth G. Libbrecht and Mark E. Rickerby. Measurements of surface attachment kinetics for faceted ice crystal growth. J. Crystal Growth, (377):1–8, 2013.
- [23] H. Asakawa, G. Sazaki, and et al. Roles of surface/volume diffusion in the growth kinetics of elementary spiral steps on ice basal facets grown from water vapor. Cryst. Growth and Design, (14):3210–3220, 2014.
- [24] Kenneth G. Libbrecht. The surface diffusion length of water molecules on faceted ice: A reanalysis of ‘roles of surface/volume diffusion in the growth kinetics of elementary spiral steps on ice fasal faces grown from water vapor’ by asakawa et al. arXiv:, (1509.06609), 2015.
- [25] K. G. Libbrecht. An edge-enhancing crystal growth instability caused by structure-dependent attachment kinetics. arXiv:, (1209.4932), 2012.