This is a preprint of a paper whose final and definite form will be published
in
Journal of Mathematical Analysis, ISSN: 2217-3412, Volume 7, Issue 1 (2016).
Optimal
control strategies for the spread
of Ebola in West Africa
Abstract.
The spread of Ebola virus in 2014 is unprecedented. The epidemic is still affecting West Africa, exacerbated by extraordinary socioeconomic disadvantages and health system inadequacies. With the aim of understanding, predicting, and control the propagation of the virus in the populations of affected countries, it is crucial to model the dynamics of the virus and study several strategies to control it. In this paper, we present a very simple mathematical model that describes quite well the spread of Ebola. Then, we discuss several strategies for the control of the propagation of this lethal virus into populations, in order to predict the impact of vaccine programmes, treatment, and the impact of educational campaigns.
Key words and phrases:
Population dynamics; Ebola; mathematical modeling; optimal control2010 Mathematics Subject Classification:
92D25, 92D30; 49-041. Introduction
The first Ebola outbreak took place in 1976 in Congo, close to Ebola river, from where the disease takes its name. Since August 2014, it is affecting several countries in west of Africa, mainly Guinea, Sierra Leone, and Liberia [1, 4, 17, 19, 31]. Nowadays, Ebola is one of the most deadliest pathogens for humans, due to the extremely rapid increase of the disease and the high mortality rate. Several authors consider the virus a health and humanitarian catastrophe of historic scope [4, 17].
In a first stage, Ebola virus is characterised by the sudden onset of fever, intense weakness, headache, fatigue, and muscle pain. This is followed by vomiting blood and passive behaviour. The second stage is characterised by diarrhea, rash, symptoms of impaired kidney and liver function, and both internal and external bleeding (bleeding from nose, mouth, eyes and anus) [20, 28, 30]. In a third/final stage, the symptoms are summarized in a loss of consciousness, seizures, massive internal bleeding, followed by death [7, 11, 16, 18]. Ebola spreads through human-to-human transmission via close and direct physical contact (through broken skin or mucous membranes) with infected bodily fluids. The most infectious fluids are blood, feces, and vomit secretions. However, all body fluids have the capacity to transmit the Ebola. The virus is also transmitted indirectly via exposure to objects or an environment contaminated with infected secretions. For all these reasons, health care workers practice strict infection prevention and control precautions when dealing with Ebola cases.
In epidemiology, mathematical models are a key tool for the understanding of the dynamics of infectious diseases and the impact of vaccination programmes. In fact, mathematics has an important role in the control of propagation of virus, allowing policymakers to predict the impact of particular vaccine programmes or to derive more efficient strategies based on mathematical insights—see [5, 10, 12, 14, 23, 26] and references therein. In particular, optimal control theory has become in last years a powerful mathematical tool that can assess the intervention of public health authorities. Indeed, the inclusion, in an epidemic model, of some practical control strategies, like vaccines, social distancing, or quarantine, provides a rational basis for policies, designed to control the spread of a virus [3, 27]. In this spirit, we focus our work on the investigation of effective strategies to control the spread of the Ebola virus by setting optimal control problems subject to a SIR epidemic model. Two practical control strategies are here considered: vaccines or educational campaigns and treatment. The SIR model, on which our optimal control studies are based, divides the population into three groups: the Susceptible (S), the Infected (I), and the Recovered (R) [8, 9, 32]. This model is simulated by Rachah and Torres in their study of the spread of the recent outbreak of Ebola virus [19].
The paper is organized as follows. In Section 2, we present a mathematical model that describes the dynamics of the propagation of the Ebola virus into a population. After the mathematical modelling, we use the obtained model to discuss it in Section 3 under several control strategies for the propagation of the virus. In these strategies, we use parameters estimated from recent statistical data based on the WHO (World Health Organization) report of the 2014 Ebola outbreak [31]. First, we study the case of control through a vaccination strategy (Section 3.2); secondly, we consider educational campaigns as a control, coupled with a treatment strategy (Section 3.3). Our results improve the recent investigations of [19], briefly summarized in Section 3.1. We end with Section 4 of discussion of results, and Section 5 of conclusions and future work.
2. Model formulation
In this section we present, mathematically, the dynamics of the population infected by the Ebola virus. The dynamics is described by a system of ordinary differential equations. This system is based on the common SIR (Susceptible–Infectious–Recovered) epidemic model, where the population is divided into three disjoint compartments: susceptible individuals , i.e., people who can catch the virus; infectious individuals , i.e., people who are infected by the virus and can transmit it; and recovered individuals , i.e., people who have recovered from the virus. The total population, assumed constant during the period of time under study, is given by . Ebola spreads through human-to-human transmission via contact. The transition between different states is described by the following two parameters: the infection rate and the recovered rate . The dynamics of the model is governed by the following system of differential equations:
| (2.1) |
The first equation of the system describes the population of the susceptible group, which reduces as the infected come into contact with them with a rate of infection . This means that the change in the population of susceptible is equal to the negative product of with and . The second equation describes the infectious group over time, knowing that the population of this group changes in two ways: (i) people leave the susceptible group and join the infected group, thus adding to the total population of infected a term ; (ii) people leave the infected group and join the recovered group, reducing the infected population by . The third equation describes the recovered population, which is based on the individuals recovered from the virus at a rate . This means that the recovered group is increased by multiplied by . The dynamical system (2.1) can be represented graphically as in Figure 1.

3. Optimal control strategies
Optimal control techniques are of great importance in developing optimal strategies to control various kind of diseases and epidemics [21, 22, 24, 25]. For instance, to address the challenges of obtaining an optimal vaccination strategy, one can use optimal control theory [5, 12]. In this section, we formulate three optimal control problems subject to the SIR model (2.1), with the aim to derive optimal strategies. For each strategy, we study a specific objective in order to minimize not only the number of infected individuals and the systemic costs of vaccination or treatment, but also to include educational campaigns within the control program. The integration of educational campaigns has a great importance in countries that don’t have the capacity to defend themselves against the virus. We compare the result of each strategy with the simulation results studied by Rachah and Torres in [19], the so called Strategy 1, which is briefly summarized in Section 3.1. Strategies 2 and are an improvement of Strategy 1, and are given in Sections 3.2 and 3.3, respectively. More precisely, Strategy 3 consists in the study of an educational campaign (about the virus) coupled with a treatment program. The comparison between the different strategies and the simulation results is given in Section 4.
For the numerical solutions of the optimal control problems, we have used the ACADO solver [2], which is based on a multiple shooting method, including automatic differentiation and based ultimately on the semidirect multiple shooting algorithm of Bock and Pitt [6]. The ACADO solver comes as a self-contained public domain software environment, written in C++, for automatic control and dynamic optimization.
3.1. Strategy 1
In this subsection, we recall briefly the strategy studied by Rachah and Torres in [19]. We will improve it later by studying other strategies in order to better control the propagation of the spread of Ebola into populations. In their study, Rachah and Torres [19] studied the SIR model with control, which is given by the following system of nonlinear differential equations:
| (3.1) |
The goal of the strategy is to reduce the infected individuals and the cost of vaccination. Precisely, the optimal control problem consists of minimizing the objective functional
| (3.2) |
subject to the model described by (3.1), where is the control variable, which represents the vaccination rate at time , and the parameters and denote, respectively, the weight on cost and the duration of the vaccination program. In our simulations we take , , , and days.
3.2. Strategy 2
Our goal in this strategy is to reduce the number of susceptible and infected individuals and simultaneously increase the number of recovered individuals. Precisely, our optimal control problem consists of minimizing the objective functional
| (3.3) |
subject to the model described by (3.1). The two first terms in the functional objective (3.3) represent benefit of and populations that we wish to reduce; and are positive constants to keep a balance in the size of and , respectively. In our simulations we used and . The third term represents the recovered individuals, which we wish to increase through vaccination ( is a positive constant, chosen in the simulations as ). In the quadratic term of (3.3), is a positive weight parameter associated with the control , and the square of the control variable reflects the severity of the side effects of the vaccination. In our numerical results we took . One has , where
is the admissible control set, with . Note that in this strategy, the control variable is the percentage of susceptible individuals being vaccinated per unit of time. Note also that in the equation , we have the term . Then, by minimizing the number of susceptible, the number of recovered (described by equation , which depends on ) is maximized (through vaccination). In the numerical simulations of model (2.1) and the strategy of the optimal control problem, Rachah and Torres [19] used the WHO data of the 2014 Ebola outbreak occurred in Guinea, in Sierra Leone, and in Liberia [1, 15]. In order to compare our improvement of the optimal control study with the previous results of [19], we use here the same parameters, that is, the same rate of infection , the same recovered rate , and the same initial values for the initial number of susceptible, infected, and recovered populations (at the beginning, 95% of population is susceptible and 5% is infected with Ebola).
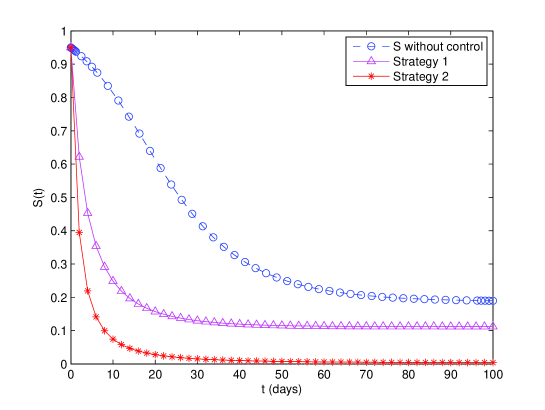
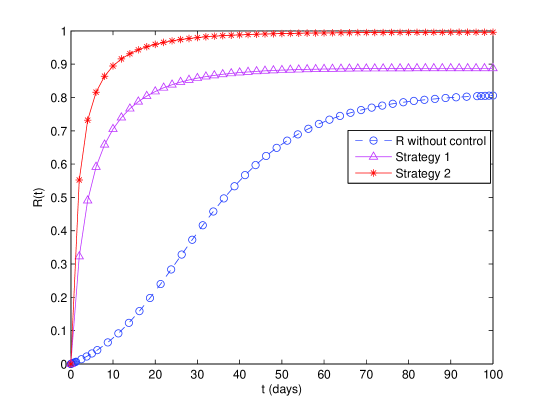
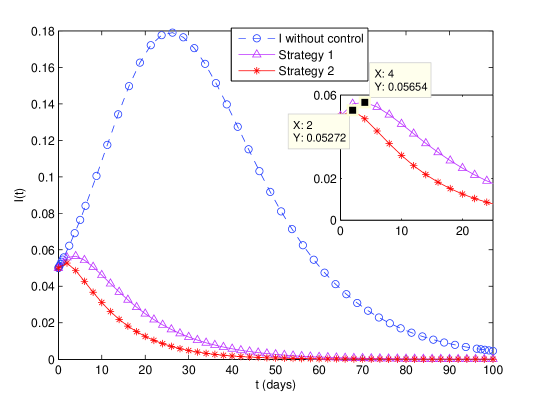
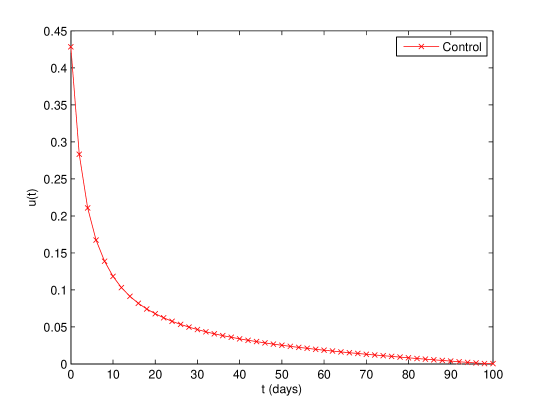
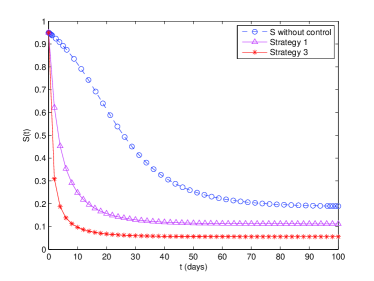
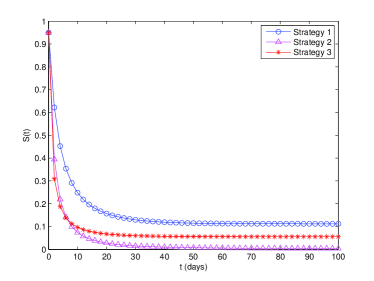
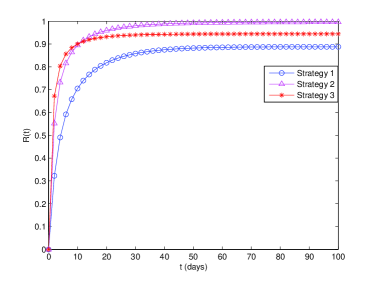
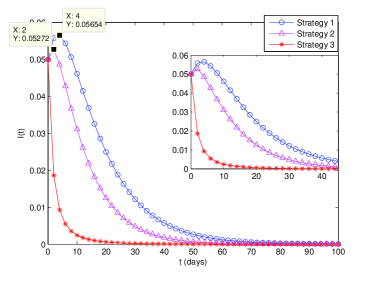
Figures 2, 3 and 4 show, respectively, the significant difference in the number of susceptible, recovered, and infected individuals with Strategy , Strategy , and without control. In Figure 2, we see that the number of susceptible , in case of optimal control under Strategy , decreases more rapidly during the vaccination campaign. It reaches 4% at the end of the campaign, in contrast with the 11% at the end of the campaign with Strategy , and against 19% in the absence of optimal control. Figure 3 shows that the number of recovered individuals increases rapidly. The number of recovered at the end of the optimal control vaccination period of Strategy 2 is 99.5%, instead of 88.7% in case of Strategy , and against 80.5% without control. In Figure 4, the time-dependent curve of infected individuals shows that the peak of the curve of infected individuals is less important in case of control with Strategy 2. In fact, the maximum value on the infected curve under optimal control is 5.2% in case of Strategy 2, instead of 5.6% in Strategy , against 17.9% without any control (see Figure 4). The other important effect of Strategy , which we can see in the same curve, is the period of infection, which is the less important. The value of the period of infection is days in case of Strategy , instead of days in case of Strategy , and against days without vaccination. This shows the efficiency of vaccination control with Strategy in controlling Ebola. Indeed, the fact that in Figure 4 the period of infection of Strategy 2 is shorter than the period of infection of Strategy 1 is important. Figure 5 gives a representation of the optimal control for Strategy .
3.3. Strategy 3
In this strategy we use the fact that individuals can acquire immunity against the virus either through educational campaigns or recovery after treatment for the virus. Our main idea is to study the effect of educational campaigns with a treatment in practical Ebola situations. The case of the French nurse cured of Ebola is a proof of the possibility of educational campaigns and treatment [29]. An educational campaign, in case of spread of Ebola, has great importance. In fact, Ebola virus spreads through human-to-human transmission, not only by close and direct physical contact with infected bodily fluids, but also via exposure to objects or contaminated environment. The most infectious fluids are blood, feces, and vomit secretions. However, all body fluids have the capacity to transmit the virus. Here, we intend to control the propagation of the Ebola virus by using two control variables in the SIR model, as follows:
| (3.4) |
where is the fraction of infective that is treated per unit of time, and is the fraction of susceptible individuals that is subject to an educational campaign per unit of time. Note that in Strategy 3 we study the scenario in which individuals can acquire immunity against the virus either through educational campaigns or recovery after treatment of the virus. The control (treatment) that appears in the equation is used as a treatment applied after infection. The French nurse cured (after infection), thanks to the treatment occurred in France, supports this idea. Our aim is to study the application of the same treatment (applied to the French nurse) in the countries suffering from Ebola. Then the control is the fraction of infected that is treated per unit of time. Comparing with the others strategies, we would like to prove that we can apply educational campaigns and medical treatment (similarly to the case of the French nurse) in the countries suffering from Ebola, which do not have the capacity to install a vaccination program to all population. Our goal here is to minimize simultaneously the total number of individuals that are infected, the cost of treatment, and the cost of educational campaigns to the population. The objective functional is now
| (3.5) |
subject to system (3.4), where , with representing treatment and educational campaigns. The Lebesgue measurable control set is defined as
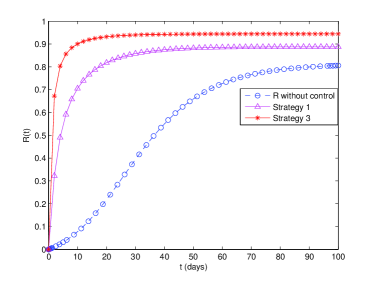
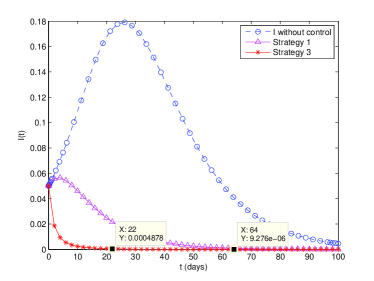
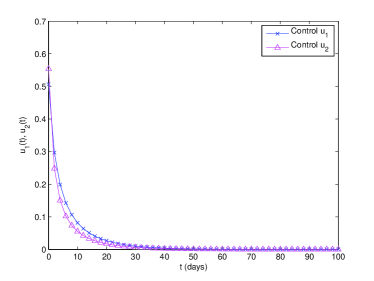
where and , and are weight parameters, which in the numerical simulations we took as , and . Here, we choose quadratic terms with respect to the controls in order to describe the nonlinear behaviour of the cost of implementing the educational campaigns and the treatments. The first term in the objective functional (3.5), , stands for the total number of individuals that are infected; the term represents the cost of treatment; while the term represents the cost associated with the educational campaigns. Figure 6 shows the time-dependent curve of susceptible individuals, , which decreases more rapidly in case of the optimal control with Strategy . It reaches 5% at the end of the campaign, instead of 11% at the end of the campaign in case of Strategy 1, and against 19% in the absence of optimal control. Figure 7 shows that the number of recovered individuals of Strategy increases rapidly until 94.4%, instead of 88.7% in case of Strategy , and against 80.5% without control. In Figure 8 we see the time-dependent curve of infected individuals , which decreases mostly. The other important effect of Strategy , which we can see in the same curve, is the period of infection, which is the less important. The value of the period of infection is days in case of Strategy , instead of days in case of Strategy , and against days without control. This shows the efficiency of the effect of educational campaigns in controlling Ebola virus with the treatment control program described in Strategy . Figure 9 gives a representation of the optimal control variables and for Strategy .
4. Discussion
We compare between the three strategies of Section 3, and we discuss the obtained results. Figures 10 and 11 represent, respectively, the time-dependent curve of susceptible and recovered individuals . What is most important in the comparison between the three curves, is the number of infected individuals that decreases more rapidly in case of Strategy (see Figure 12). Moreover, there isn’t any peak in case of Strategy . The results show the efficiency of an educational campaign in controlling Ebola virus when we couple it with the treatment control (as in Strategy ). We conclude that one can improve results by mixing vaccination and educational campaigns with treatment, which has a great importance in poor countries that do not have the capacity to defend themselves against the virus.
5. Conclusion
We improved the optimal control model discussed by Rachah and Torres in [19] (see also [13]), which provides a good description of the 2014 Ebola outbreak in West Africa. We discussed the integration of an educational campaign about the virus into the population. We have shown that the educational campaign has a great importance with the treatment program, mainly in countries who don’t have the capacity to defend themselves against the virus. As future work, we plan to include in our study other factors. For instance, we intend to include in the mathematical model a quarantine procedure.
Acknowledgments
This research was supported by the Institut de Mathématiques de Toulouse, France (Rachah); and by the Portuguese Foundation for Science and Technology (FCT), within CIDMA project UID/MAT/04106/2013 (Torres).
References
- [1] C. L. Althaus. Estimating the Reproduction Number of Ebola Virus (EBOV) During the 2014 Outbreak in West Africa. PLOS Currents Outbreaks, September 2, 2014. http://dx.doi.org/10.1371/currents.outbreaks.91afb5e0f279e7f29e7056095255b288
- [2] D. Ariens, B. Houska, H. J. Ferreau. ACADO Toolkit User’s Manual, Toolkit for Automatic Control and Dynamic Optimization, 2010. http://www.acadotoolkit.org
- [3] H. T. Banks, Carlos Castillo-Chavez. Bioterrorism. SIAM Frontiers In Applied Mathematics, 1987.
- [4] M. Barry, F. A. Traoré, F. B. Sako, D. O. Kpamy, E. I. Bah, M. Poncin, S. Keita, M. Cisse, A. Touré. Ebola outbreak in Conakry, Guinea: Epidemiological, clinical, and outcome features. Médecine et Maladies Infectieuses 44 (2014), no. 11–12, 491–494.
- [5] C. M. Berry. Vaccine control of avian influenza H5N1 in poultry: need for a positive marker. Journal Vaccines & Vaccin. ISSN:2157-7560, volume 4:168, Issue 1. 2013.
- [6] H. G. Bock, K. J. Pitt. A multiple shooting algorithm for direct solution of optimal control problems. Proc. 9th IFAC World Congress, Budapest. Pergamon Press, 243–247, 1984.
- [7] L. Borio et al. [Working Group on Civilian Biodefense; Corporate Author]. Hemorrhagic fever viruses as biological weapons: medical and public health management. Journal of the American Medical Association 287 (2002), no. 18, 2391–2405.
- [8] G. Chowell, J. M. Hayman, L. M. A. Bettencourt, C. Castillo-Chavez. Mathematical and Statistical Estimation Approaches in Epidemiology, Springer, Dordrecht, 2009.
- [9] G. Chowell, N. W. Hengartner, C. Castillo-Chavez, P. W. Fenimore, J. M. Hyman. The basic reproductive number of Ebola and the effects of public health measures: the cases of Congo and Uganda. Journal of Theoretical Biology 229 (2004), no. 1, 119–126.
- [10] R. Denysiuk, C. J. Silva, D. F. M. Torres. Multiobjective approach to optimal control for a tuberculosis model. Optim. Methods Softw. 30 (2015), no. 5, 893–910. arXiv:1412.0528
- [11] S. F. Dowell, R. Mukunu, T. G. Ksiazek, A. S. Khan, P. E. Rollin, C. J. Peters. Transmission of Ebola hemorrhagic fever: a study of risk factors in family members, Kikwit, Democratic Republic of the Congo, 1995. Commission de Lutte contre les Epidémies à Kikwit. J. Infect. Dis. 179 (1999), Suppl. 1, S87–S91.
- [12] S. Gao, Z. Teng, Juan J. Nieto, A. Torres. Analysis of an SIR epidemic model with pulse vaccination and distributed time delay. Journal of Biomedicine and Biotechnology, Vol. 2007, Article ID 64870.
- [13] D. Hincapié-Palacio, J. Ospina, D. F. M. Torres. Approximated analytical solution to an Ebola optimal control problem. Int. J. Comput. Methods Eng. Sci. Mech., in press. arXiv:1512.02843
- [14] E. Jung, S. Iwami, Y. Takeuchi, Tae-Chang Jo. Optimal control strategy for prevention of avian influenza pandemic. Journal of Theoretical Biology 260 (2009), 220–229.
- [15] V. Kaurov. Modeling a Pandemic like Ebola with the Wolfram Language. Technical Communication & Strategy, November 4, 2014.
- [16] J. Legrand, R. F. Grais, P. Y. Boelle, A. J. Valleron, A. Flahault. Understanding the dynamics of Ebola epidemics. Epidemiol. Infect. 135 (2007), no. 4, 610–621.
- [17] J. A. Lewnard, M. L. Ndeffo Mbah, J. A. Alfaro-Murillo, F. L. Altice, L. Bawo, T. G. Nyenswah, A. P. Galvani. Dynamics and control of Ebola virus transmission in Montserrado, Liberia: a mathematical modelling analysis. The Lancet Infectious Diseases 14 (2014), no. 12, 1189–1195.
- [18] C. J. Peters, J. W. LeDuc. An introduction to Ebola: the virus and the disease. Journal of Infectious Diseases 179 (Suppl. 1), 1999.
- [19] A. Rachah, D. F. M. Torres. Mathematical modelling, simulation and optimal control of the 2014 Ebola outbreak in West Africa. Discrete Dyn. Nat. Soc. 2015 (2015), Art. ID 842792. arXiv:1503.07396
- [20] Report of an International Commission. Ebola haemorrhagic fever in Zaire, 1976. Bull. World Health Organ. 56 (1978), no. 2, 271–293.
- [21] H. S. Rodrigues, M. T. T. Monteiro, D. F. M. Torres. Dynamics of dengue epidemics when using optimal control. Math. Comput. Modelling 52 (2010), no. 9-10, 1667–1673. arXiv:1006.4392
- [22] H. S. Rodrigues, M. T. T. Monteiro, D. F. M. Torres. Vaccination models and optimal control strategies to dengue. Math. Biosci. 247 (2014), 1–12. arXiv:1310.4387
- [23] H. S. Rodrigues, M. T. T. Monteiro, D. F. M. Torres. Seasonality effects on Dengue: basic reproduction number, sensitivity analysis and optimal control. Math. Meth. Appl. Sci., in press. DOI:10.1002/mma.3319 arXiv:1409.3928
- [24] P. Rodrigues, C. J. Silva, D. F. M. Torres. Cost-effectiveness analysis of optimal control measures for tuberculosis. Bull. Math. Biol. 76 (2014), no. 10, 2627–2645. arXiv:1409.3496
- [25] C. J. Silva, D. F. M. Torres. Optimal control for a tuberculosis model with reinfection and post-exposure interventions. Math. Biosci. 244 (2013), no. 2, 154–164. arXiv:1305.2145
- [26] C. J. Silva, D. F. M. Torres. A TB-HIV/AIDS coinfection model and optimal control treatment. Discrete Contin. Dyn. Syst. 35 (2015), no. 9, 4639–4663. arXiv:1501.03322
- [27] J. M. Tchuenche, S. A. Khamis, F. B. Agusto, S. C. Mpeshe. Optimal control and sensitivity analysis of an influenza model with treatment and vaccination. Acta Biotheoretica 59 (2011), no. 1, 1–28.
- [28] Uganda Ministry of Health. An outbreak of Ebola in Uganda. Trop. Med. Int. Health. 7 (2002), no. 12, 1068–1075.
- [29] A. J. Valleron, D. Schwartz, M. Goldberg, R. Salamon. Collectif Lépidémiologie humaine, Conditions de son développement en France, et rôle des mathématiques. Institut de France Académie des Sciences, Vol. 462, 2006.
- [30] WHO, Report of an International Study Team. Ebola haemorrhagic fever in Sudan 1976. Bull. World Health Organ. 56 (1978), no. 2, 247–270.
- [31] WHO, World Health Organization. Ebola response roadmap – Situation report update. http://www.who.int/csr/disease/ebola/situation-reports/en
- [32] D. Zeng, H. Chen, C. Castillo-Chavez, W. B. Lober, M. Thurmond. Infectious Disease Informatics and Biosurveillance. Integrated Series in Information Systems, Vol. 27, Springer, New York, 2011.