1\Yearpublication2014\Yearsubmission2014\Month0\Volume999\Issue0\DOIasna.201400000
XXXX
Gaia
Abstract
A review of the Gaia mission and its science performance after one year of operations will be presented, and the contribution to reconstructing the history of the Milky Way will be outlined.
keywords:
Surveys – astrometry – Galaxy:general1 Introduction
Gaia is an ESA cornerstone mission building on the Hipparcos heritage (Perryman et al. 1997; van Leeuwen 2007). As stated in “Gaia - Composition, Formation and Evolution of the Galaxy: Concept and Technology Study Report111Gaia Science Advisory Group, ESA-SCI 2000-4, (2000): The primary objective of Gaia is the Galaxy: to observe the physical characteristics, kinematics and distribution of stars over a large fraction of its volume, with the goal of achieving a full understanding of the MW dynamics and structure, and consequently its formation and history.
The satellite and payload were commissioned to the industry (Airbus Defence & Space), the management, launch and operations are performed by the European Space Agency (ESA), and the data processing is entrusted to a Pan-European cooperation represented by the Data Processing and Analysis Consortium (DPAC) which includes about 450 scientists from more than 20 countries.
Gaia was launched on 19 December 2013 from Kourou (French Guiana) with a Soyuz-Fregat rocket, and was put on a Lissajous orbit around L2, 1.5 million km away from the Sun, for an expected 5yr lifetime of operations. It will perform an all sky survey complete to G20.7, corresponding to V 20-22 mag for blue and red objects respectively, obtaining astrometric data with micro arcsec (as) accuracy for more than 109 objects, as well as optical spectrophotometry for most of them, and medium resolution spectroscopy at the Ca II triplet (847-870 nm) for several million objects brighter than 16th mag.
Gaia data have no proprietary rights, they will be released at planned intervals after proper validation. The final Catalogue is foreseen for 2022, but there will be intermediate data releases. The first one is scheduled for summer 2016, and will contain positions and white-light photometry for single stars from 90% of the sky, data from the Ecliptic Pole regions that were scanned more often during commissioning, and proper motions for the about hundred thousand Hipparcos stars. It is presently under evaluation whether to deliver positions, parallaxes and proper motions for a fraction of the 2.5 million Tycho-2 stars (Høg et al. 2000). These astrometric data will be obtained by combining the positions from the Tycho-2 Catalogue with the first year of Gaia data for a joint Tycho-Gaia astrometric solution (TGAS, Michalik et al. 2015; see also the Gaia webpage222http://www.cosmos.esa.int/web/gaia/news_20150807.). Thanks to the 24 yr time baseline, these data will have sub-mas accuracy. The second data release is currently planned for early 2017, to deliver radial velocities for bright stars, two-band photometry, and full astrometric data where available. Two more data releases are planned around 2018-19. Each release updates the previous ones and contains significant new additions. Science alerts (e.g. SNe) data are released immediately after validation.
Gaia represents a huge improvement with respect to Hipparcos: the detection limit is extended by 8 magnitudes, the number of sources is 104 times larger and includes objects unobservable by Hipparcos such as galaxies and quasars, and the astrometric accuracy is a factor 100 better (see Table 1 and the Gaia webpage333http://www.cosmos.esa.int/web/gaia. for more details.).
| Hipparcos | Gaia | |
|---|---|---|
| Magnitude limit | Vlim = 12 | Vlim 20-22 |
| N. of objects | 1.2105 | 109 |
| Quasars | none | 5105 |
| Galaxies | none | 106-107 |
| Astrom. accuracy | 1 mas | 5-14as at V12 |
| 20-30as at V=15, | ||
| 400-600as at V=20 | ||
| Broad-band phot. | 2 (B,V) | 3 (to Vlim) |
| + 1 (to V=16) | ||
| Spectrophtometry | none | 2 bands (B/R) to Vlim |
| Spectroscopy | none | 1-15 km/s to V=16 |
| Obs. programme | pre-selected | all-sky complete |
| targets | and unbiased |
2 Technicalities in a nutshell
2.1 Satellite
The satellite spins around its axis, which is oriented 45-deg away from the Sun, with a period of 6 hr, and the spin axis has a precession motion around the solar direction with a period of 63 days. The combination of these two motions results in a quasi-regular time-sampling that allows to scan the entire sky on average 70 times over the 5 yr mission lifetime, with as much as 200 transits in a 10-deg strip around ecliptic latitudes 45deg, and as little as 50 transits in other areas of the sky.
2.2 Payload
Global (wide field) astrometry requires repeated observation of the same area of the sky from two lines of sight separated by a suitable and very stable angle (Basic Angle, BA), producing two fields of view which get combined on the focal plane. Gaia can then make relative measurements among the stars simultaneously visible in the combined field of view. To this purpose, the payload is a toroidal structure holding two primary 1.45m0.50m rectangular mirrors (field of view FoV = 1.7-deg0.6-deg) whose lines of sight are separated by a BA angle of 106.5-deg. The BA needs to be stable to an extremely high degree to ensure Gaia’s expected astrometric accuracy444For the measurement of stellar parallaxes down to 10 as accuracy, the requirement for the BA stability would be 1 part in 31010 (van Leeuwen 2007).. Therefore a BA monitoring system is hosted on the payload, along with all the optical components which allow to combine the FoVs of the two mirrors on the focal plane. The toroidal structure hosts also the prisms for the low resolution spectrophotometry, the radial velocity spectrometer (RVS) and the array of CCD detectors on the focal plane.
2.3 Focal Plane
The focal plane contains several arrays of 4.5K2.0K CCDs: i) the sky mapper (SM), 27 CCDs for detection and confirmation of source transit; ii) the astrometric field (AF), 97 CCDs corresponding to 4040 arcmin on the sky, for astrometric measurements and white light (G-band, 330-1050 nm) photometry; iii) the blue (BP) and red (RP) photometers, 27 CCDs for low resolution (R100) slitless prism spectro-photometry in the ranges 330-680 nm and 640-1050 nm, respectively. From the spectra the integrated GBP and GRP magnitudes (and colour) are derived. iv) the radial velocity spectrometer (RVS), 34 CCDs for slitless spectroscopy at the Ca II triplet (845-872 nm) with R11,500.
Measurements are made in time-delayed-integration mode, reading the CCDs at the same speed as the sources trail across the focal plane, i.e. 60 arcsec/sec, corresponding to a crossing/reading time of 4.4 sec per CCD.
3 Science Performance
The commissioning phase was completed on 18 July 2014. The overall performance was assessed to be very good, and the detection efficiency was improved so as to extend the bright end to G0 mag through detection algorithm improvements and employment of a special observing mode. The faint limit was also extended down to G=20.7 mag. However, a few problems were identified: stray light (mostly due to scattering from filaments on sun-shield edges), contamination (thin ice layer on optics), some larger than expected variations of the BA. These effects can be mitigated (e.g. by periodic de-contamination campaigns) or modelled, and actions have been taken to this purpose. A performance reassessment was made after careful analysis of the commissionig data, and the updated characteristics as of March 2015 are summarized in the following sub-sections555See http://www.cosmos.esa.int/web/gaia/science-performance for more details..
3.1 Astrometry
Astrometric errors are dominated by photon statistics. The end-of-mission astrometric performance estimated by de Bruijne (2015) is summarized in Table 2. The range of values for the stars brighter than 12th mag is mostly due to bright-star observing conditions (e.g. TDI gates, onboard mag-estimation errors, etc.). We remind that the standard errors on position and proper motion are about 0.74 and 0.53 of those on parallax, respectively.
| V[mag] | B1V | G2V | M6V |
|---|---|---|---|
| 12 | 5-14 | 5-14 | 10 |
| 15 | 26 | 24 | 9 |
| 20 | 600 | 540 | 130 |
Gaia’s first observations of gravitational lensed images of two QSOs, Q2237+030 (Einstein Cross) and HE0435-1223666See http://www.cosmos.esa.int/web/gaia/iow20150409, Gaia image of the week 9 April 2015., provide an example of the excellent astrometric quality obtained already with preliminary data and reduction process: the two QSOs are located at z=1.7 and the lensed images have V 17-19 mag. Even with a very small number of observations the accuracy of the absolute position for each of the Einstein Cross images is 50 mas, and slightly better for HE0435-1223 for which more observations are available. These positions were obtained from the Initial Data Treatment in a routine mode, with a very preliminary attitude determination. By end-2015 nine new observations of Q2237+030 and sixteen of HE0435-1223 will be obtained, and a much better accuracy will be achieved thanks also to the use of the improved attitude determination.
3.2 Photometry
Gaia photometry includes the integrated white-light (G-band) from the AF, and the BP/RP prism spectra from which the GBP and GRP integrated magnitudes are derived. The expected end-of-mission errors are shown in Table 3 (for the relations between the G magnitudes and other photometric systems see Jordi et al. 2010).
For about 28 days in July 2014 Gaia scanned continuously a 1-deg area at the North and South Ecliptic Poles, collecting a large number of measurements for several hundreds RR Lyraes and Cepheids in the Large Magellanic Cloud, a good fraction of which were new discoveries. The light curves of the RR Lyraes in the range 18.5-19.5 mag, and of the Cepheids in the range 18-19 mag, are presented in the 5 March and 28 May 2015 “Gaia image of the week” section777See http://www.cosmos.esa.int/web/gaia/iow20150305 and http://www.cosmos.esa.int/web/gaia/iow20150528, respectively., and show the excellent photometric quality obtained even at the faint end of the dynamic range.
Astrophysical parameters can be derived using BP/RP spectral energy distributions, sometimes in combination with astrometric and spectroscopic data. Preliminary simulations by Bailer-Jones et al. (2013) on F, G, K, M dwarfs and giants for a wide range of metallicites and interstellar extinctions indicate the following internal accuracy (rms residuals) of astrophysical parameter estimates, to be reassessed on real data: at magnitude G=15 (i.e. V15-17 depending on the source colour) the temperature can be derived to 100 K, the extinction AV to 0.1 mag, the gravity to 0.25 dex and the metallicity to 0.2 dex. The accuracy is a strong function of the parameters themselves, and may vary by a factor of more than two up or down over this parameter range.
| G[mag] | B1V | G2V | M6V |
|---|---|---|---|
| 15 | 1/4/4 | 1/4/4 | 1/7/4 |
| 18 | 2/8/19 | 2/13/11 | 2/89/6 |
| 20 | 6/51/110 | 6/80/59 | 6/490/24 |
3.3 Spectroscopy
The RVS provides the third component of the space velocity for sources down to about 16th magnitude. Radial velocities are the main product of the RVS, with typical end-of-mission errors of 1 (15) km/sec at V7.5 (11.3) for a B1V star, at V12.3 (15.2) for a G2V star, and at V12.8 (15.7) for a K1III metal-poor star. For sources brighter than 12 mag the RVS spectra will provide information also on rotation and chemistry, and combined with the prism BP/RP spectra will allow us to obtain more detailed and accurate astrophysical parameters.
An example of the first RVS data obtained by Gaia is shown in the “Gaia image of the week” on 26 January 2015888See http://www.cosmos.esa.int/web/gaia/iow20150126., where high signal-to-noise spectra of three bright hot stars show very well defined features, in particular diffuse interstellar bands which, in combination with the Gaia parallaxes, will allow the construction of an unprecedented 3D map of the interstellar medium.
4 Science products
Gaia will provide a complete census of all Galactic stellar populations, as
well as extragalactic sources, down to 20th magnitude.
This wealth of data will have a major impact in several areas of astronomy
and astrophysics, e.g.:
Galactic studies: spatial and dynamical structure, formation and chemical history
of all MW components. Based on the Besançon Galaxy model (Robin et al. 2012)
Gaia will observe about 9108 stars in the disk(s), 2107 in the spheroid
and 1.7108 in the bulge.
Proper motions will allow typical tracers such as K-M giants to map the kinematic
characteristics of the bulge to about 2.5 kms-1, of the thin disk to about 1-2 kms-1
as far as 10 kpc, of the thick disk to 5 kms-1 as far as 15 kpc, and of
the halo to better than 1 (5) kms-1 as far as 10 (30) kpc.
Also horizontal branch (A5) stars will be able to characterize these MW components with
an accuracy 5 up to 100 times better than their typical velocity dispersion.
Blue/red supergiants and Cepheids will characterize the spiral arms to 0.2-2.0 kms-1
as far as 10 kpc. All the open clusters will be observed with a large enough number of
stars to derive very accurate mean distances, and for the stars brighter than 16th mag
the astrophysical parameters will be estimated.
Cosmic Distance scale: Gaia is expected to observe a large number of standard
candles in the Galaxy, e.g. RR Lyrae stars (as many as 4104 in the bulge and
7104 in the halo) with 1 (5)% accuracy within 2 (4) kpc, and Cepheids
(2-9103 - Eyer & Cuypers, 2000; Windmark et al. 2011) with 1% accuracy for
about 1/3 of the total sample and 5% accuracy for the entire sample. This will provide
the first trigonometric calibration of local candles for a reliable and accurate
definition of the cosmological distance scale;
Stellar Physics: accurate distances will be particularly useful as a check of the
asteroseismic scaling laws, and with the additional help from photometry and astrophysical
parameters will provide a powerful benchmark for a better understanding of stellar structure and
evolution modelling;
Several other areas will greatly benefit from Gaia’s data: Solar System Objects
(a few 105), exoplanets (a few 104), fundamental physics
(general relativity experiments), gravitational lensing events (a few 102),
brightest stellar populations in nearby (LG) galaxies, supernovae and burst sources
(a few 104), galaxies (106 - 107) and QSOs (a few 105), definition
of the International Celestial Reference Frame (ICRF).
5 Stellar systems as observed by Gaia
As an example, it is interesting to see how Gaia is expected to improve our understanding of stellar systems such as globular clusters (GC) in the Milky Way, and dwarf spheroidal (dsph) galaxies in the Local Group. These two cases have been simulated using the most recent information on Gaia performance and are presented in the following.
5.1 Globular clusters in the MW
A full 3-D synthetic GC at dynamical equilibrium, with assumed absolute integrated magnitude of MV=-7.6, was costructed by Pancino et al. (2013). Magnitudes were assigned to all stars from appropriate 12-gyr old and metal-poor stellar models, and a typical velocity dispersion of 10 kms-1 was applied. The cluster was placed at the distances of 5 and 10 kpc in different positions on the sky, and reddening and contamination by field stars were added according to the Besançon Galactic model. A systemic proper motion of 5000 as/yr was assumed in both RA and DEC, corresponding to 118.5 and 237 kms-1 at 5 and 10 kpc distance, respectively.
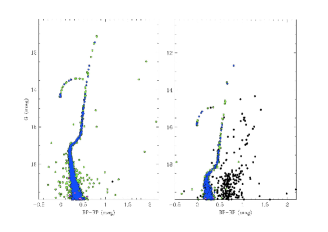
Figure 2 in Pancino et al. (2013) shows how the cluster colour-magnitude diagram looks like at 10 kpc (full sample). For completeness we show here in Figure 1 the clean colour-magnitude diagrams at 5 and 10 kpc, after statistical field decontamination and deblending simulating Gaia observations and data processing, which retain only the well measured member stars brighter than 20th mag (16838 stars at 5 kpc and 3513 stars at 10 kpc).
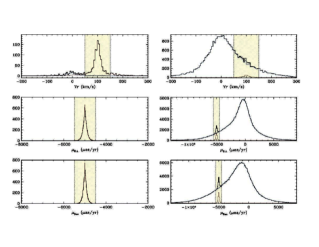
Astrometric measures were derived for these stars, and end-of-mission errors from de Bruijne et al. (2015) were associated to these measures. The results of this simulation are presented in Table 4 and shown in Figure 2, where one can see that even at 10 kpc the cluster membership can be clearly disentangled and identified over a heavy background, and astrometric measures can be obtained with high accuracy and precision.
| D = 5 kpc (200as) | D = 10 kpc (100as) |
|---|---|
| N. stars=16838 | N. stars=3513 |
| pm(RA)=4998.70.8 as/yr | pm(RA)=49933 as/yr |
| pm(DEC)=5000.20.7 as/yr | pm(DEC)=49943 as/yr |
| = 199.70.7 as | = 101.21.4 as |
| D = 5.0070.007 kpc | D = 9.9970.017 kpc |
About 55% of the Galactic globular clusters, i.e. 90 objects, are located within 10 kpc from the Sun (Harris 1996, 2010 edition), and this simulation shows how important Gaia contribution will be in tracing and understanding the formation and evolution history of this Galactic component.
5.2 The Draco dwarf spheroidal galaxy
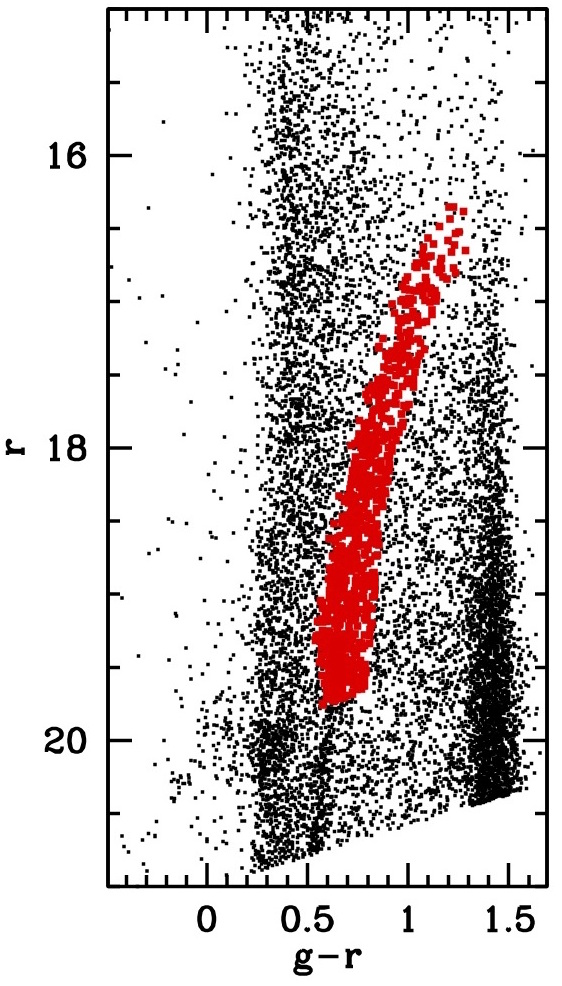
Using the CFHT photometric data by Segall et al. (2007) of a 2-deg2-deg area centered on the Draco dwarf galaxy (MV=-9.0 mag, distance 93 kpc, central surface brightness of 25.0 mag/arcsec2), we selected 750 red giant branch (RGB) stars with V20 mag as bona fide members after statistical field decontamination (see Fig. 3).
With a similar procedure as the one applied to GCs (Sect. 5.1),
to each of these 750 stars we associated: i) a realistic systemic tangential motion, borrowed
from the study of Draco proper motions using HST-ACS images by Pryor et al. (2015);
ii) a realistic isotropic velocity dispersion of 9.1 kms-1 (McConnachie, 2012);
and iii) Gaia’s observational errors from de Bruijne et al. (2015).
With these input data and assumptions, and using a simple gaussian model, we obtained
a Maximum Likelihood estimate of the systemic proper motion and velocity dispersion
from the simulated Gaia measurements. By varying the integrated magnitude of the system from
MV=-9.0 mag to -6.5 and -4.3 the number of member RGB stars decreases to 75 and 10,
respectively, and the simulation was performed also on these cases.
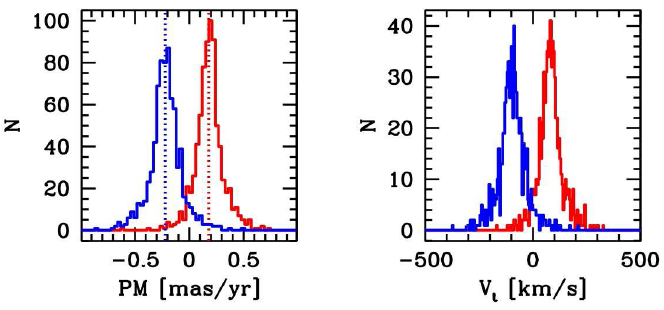
The resulting proper motions are presented in Table 5 columns 2-3 and shown
in Fig. 4.
The velocity dispersion -vel is estimated as 21.05.4as/yr
in the 750 star case, corresponding to 9.22.4 kms-1, which recovers very well the
input value of 9.1 kms-1. The test cases with 75 and 10 stars have too few stars to
produce reliable estimates of the velocity dispersion. On the other hand,
the systemic motion is reliably measured in all the cases. This
can be fully appreciated by comparing the results of these simulations with Pryor et al.’s (2015)
results, i.e. pm(RA)=17763 as/yr and pm(DEC)=-22163 as/yr, which
show that the Gaia end-of-mission astrometry is expected to perform about
20 times better than the state of the art HST astrometry using 750 stars, and still
two times better using as few as 10 stars.
In any case, the synergy with the HST and many of the present and future surveys, especially the high-resolution spectroscopic ones, will be very important: none of them will provide all-sky coverage, but all will contribute to complement and extend the scientific potential of the Gaia data.
| N. stars/MV | pm(RA) | pm(DEC) | -vel |
|---|---|---|---|
| 750/-9.0 | 1753.3 | -2173.1 | 21.05.4 |
| 75/-6.5 | 17211.9 | -2179.3 | 42.015.6 |
| 10/-4.3 | 18030 | -18530 | — |
Acknowledgements.
This work is supported by the Istituto Nazionale di Astrofisica (INAF), and by the Agenzia Spaziale Italiana (ASI) through the grant 2014-025-R.0. CC gratefully acknowledges the support from the Wilhelm und Else Heraeus Foundation.References
- [1] Bailer-Jones, C.A.L., Andrae, R., Arcay, B., et al. 2013, A&A, 559, 74
- [2] de Bruijne, J.H.J., Ryg, K.L.J., & Antoja, T. 2015, arXiv:150200791
- [3] Eyer, L. & Cuypers, J. 2000, Astron. Soc. Pac. Conf. Ser., 203, 71
- [4] Harris, W.E. 1996, AJ, 112, 1487
- [5] Høg, E., Fabricius, C., Makarov, V.V., et al. 2000, A&A, 355, L27
- [6] Jordi, C., Gebran, M., Carrasco, J.M., et al. 2010, A&A, 523, 48
- [7] McConnachie, A.W. 2012, AJ, 144, 4
- [8] Michalik, D., Lindegren, L., & Hobbs, D. 2015, A&A, 574, 115
- [9] Pancino, E., Bellazzini, M., & Marinoni, S. 2013, Mem. S.A.It., 84, 83
- [10] Perryman, M.A.C., Lindegren, L., Kovalevsky, J., et al. 1997, A&A, 323, L49
- [11] Pryor, C., Piatek, S. & Olszewski, E.W. 2015, AJ, 149, 42
- [12] Robin, A.C., Luri, X., Reylé, C., Isasi, Y., et al. 2012, arXiv:1202.0132
- [13] Segall, M., Ibata, R., Irwin, M.J., et al. 2007, MNRAS, 375, 831
- [14] van Leeuwen, F. 2007, Ap&SS Lib., Dordrecht:Springer, Vol. 350
- [15] Windmark, F., Lindegren, L., & Hobbs, D. 2011, A&A, 530, 76