Dynamics of nuclear spin polarization induced and detected by coherently precessing electron spins in fluorine-doped ZnSe
Abstract
We study the dynamics of optically-induced nuclear spin polarization in a fluorine-doped ZnSe epilayer via time-resolved Kerr rotation. The nuclear polarization in the vicinity of a fluorine donor is induced by interaction with coherently precessing electron spins in a magnetic field applied in the Voigt geometry. It is detected by nuclei-induced changes in the electron spin coherence signal. This all-optical technique allows us to measure the longitudinal spin relaxation time of the isotope in a magnetic field range from 10 to 130 mT under illumination. We combine the optical technique with radio frequency methods to address the coherent spin dynamics of the nuclei and measure Rabi oscillations, Ramsey fringes and the nuclear spin echo. The inhomogeneous spin dephasing time and the spin coherence time of the isotope are measured. While the time is on the order of several milliseconds, the time is several hundred microseconds. The experimentally determined condition verifies the validity of the classical model of nuclear spin cooling for describing the optically-induced nuclear spin polarization.
pacs:
76.60.-k, 76.70.Hb, 78.47.D-, 78.66.HfThe spin of a donor-bound electron in fluorine-doped ZnSe represents a promising system for quantum information technologies. So far emission of indistinguishable single photons Sanaka et al. (2009), photon entanglement Sanaka et al. (2012) and optical control of single electron spins De Greve et al. (2010); Kim et al. (2012); Sleiter et al. (2013) were achieved. Studies of the electron spin dynamics of an ensemble of donor-bound electrons demonstrated a spin dephasing time of and a longitudinal spin relaxation time of Greilich et al. (2012); Heisterkamp et al. (2015a). At low temperatures the hyperfine interaction with nuclear spins is the main mechanism limiting the electron spin coherence. ZnSe is a particularly attractive material due to the low natural abundance of isotopes with nonzero nuclear spins ( 67Zn () and 77Se ()) and the possibility to purify it isotopically such that it does not contain nonzero nuclear spins. However, this approach is technologically demanding. Alternatively, one may search for effects where the polarization of nuclear spins provides favorable conditions for a long-lived electron spin coherence. For example, the nuclear frequency focusing effect of the electron spin coherence in singly-charged quantum dots reduces the electron spin dephasing by driving the precessing ensemble towards a single mode collective motion Greilich et al. (2007). In order to understand the underlying mechanisms comprehensive information on the polarization and relaxation dynamics of the nuclei interacting with the electrons driven by periodic laser excitation is required.
We recently demonstrated a spatially inhomogeneous nuclear spin polarization induced in the vicinity of the fluorine donor in a picosecond pump-probe Kerr rotation (KR) experiment on a fluorine-doped ZnSe epilayer Heisterkamp et al. (2015b). The nuclear spin polarization occurs under excitation with a helicity modulated pump beam, for which the induced average electron spin polarization is expected to be zero. The classical model of nuclear spin cooling was used to explain the induced nuclear spin polarization Fleisher and Merkulov (1984). It implies that the nuclear spin system can be described using the spin temperature approach, which requires that the longitudinal spin relaxation time is much longer than the spin coherence time : . To validate this condition these nuclear relaxation times need to be measured under the conditions of the pump-probe experiment.
The feasibility of such measurements has been demonstrated in Refs. Sanada et al. (2006); Kondo et al. (2008) on QWs under optical excitation with a constant circular polarization. Similar to these studies we combine the time-resolved Kerr rotation (TRKR) measurements with radio frequency (RF) techniques to study the coherent spin dynamics of the nuclei, but we perform our studies under helicity modulated excitation. Furthermore, we present an all-optical technique (see also Ref. Zhukov et al. (2014)) employing TRKR in the resonant spin amplification (RSA) regime Kikkawa and Awschalom (1998) to also measure the time. We use these two methods to perform a complete study of the dynamics of the isotope, whose polarization was studied in Ref. Heisterkamp et al. (2015b), under the conditions of the TRKR experiment and measure the nuclear spin relaxation time , the inhomogeneous spin dephasing time and the spin coherence time . From the results we conclude that the spin temperature approach is valid under these experimental conditions.
We employ a pump-probe scheme to measure TRKR using a mode-locked Ti:Sapphire laser with a pulse duration of at a repetition rate of . The circularly polarized pump beam excites the sample along the growth axis and the KR of the linearly polarized probe beam is measured with a balanced photoreceiver connected to a lock-in amplifier. The pump beam is helicity-modulated by an electro-optical modulator with the frequency varied from 50 up to 1050 kHz. We conduct all measurements at a fixed small negative time delay of the probe pulses with respect to the pump pulses and scan the magnetic field, i.e., use the RSA regime Kikkawa and Awschalom (1998); Yugova et al. (2012). The probe beam is kept unmodulated. Both beams have a diameter of about on the sample. The pump power is kept constant at and the probe power at for all measurements.
We measure the nuclear spin polarization by its influence on the Larmor precession frequency of the donor-bound electron spins in a fluorine-doped ZnSe epilayer with a dopant concentration of about . The sample was grown by molecular-beam epitaxy on -oriented GaAs substrate. For details about the optical properties and electron spin coherence in this sample we refer to Ref. Greilich et al. (2012) (Sample C). We use a degenerate pump-probe scheme and resonantly excite the donor-bound heavy hole exciton () at . To obtain the required photon energy the laser photon energy is doubled by a beta barium borate (BBO) crystal. The sample is placed in an optical cryostat with a superconducting split coil solenoid with the magnetic field oriented perpendicular to the optical axis and the structure growth axis. The sample temperature is fixed at about .
A RF coil near the sample surface allows us to apply in addition RF fields with variable frequency from to . The axis of the coil is oriented along the optical axis. Thus, the oscillating magnetic field is oriented along the optical axis and perpendicular to the external magnetic field. A delay generator allows us to apply well-defined and exactly timed sequences of RF pulses to perform experiments on the nuclear spin coherence.
For the measurements we use a TTL multiplexer (average propagation delay: ) in combination with two arbitrary function generators to quickly switch (with a rise time of 8 ns). The signal is continuously demodulated by two lock-in amplifiers, each locked permanently on one of the two modulation frequencies. Their signals are recorded by a fast digitizer card. The time resolution of this setup is given by the digitizer card and the lock-in amplifier, which is the limiting factor here and demodulates the signal at a time constant of .
The nuclear spin relaxation time is measured using an all-optical approach based on fast switching between two different modulation frequencies and . The first modulation frequency is close to the optically-induced nuclear magnetic resonance (NMR) at the particular magnetic field, while the second one is set to , where the NMR can be reached only at a stronger magnetic field.
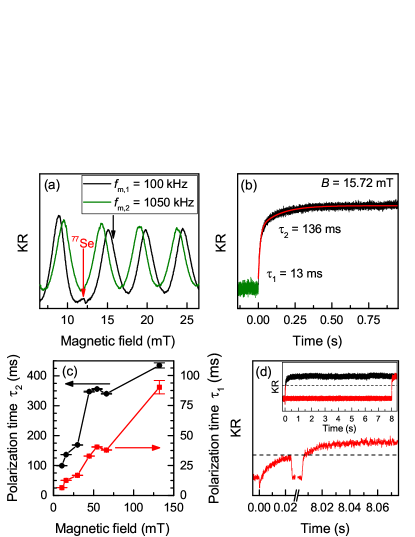
Figure 1(a) shows two RSA spectra measured at modulation frequencies of (black line) and (green line), respectively. The magnetic field is varied which, in turn, leads to a change of the electron spin Larmor precession frequency, so that the spins precess either in phase or out of phase with the laser repetition frequency and the RSA signal exhibits characteristic periodic peaks in dependence on the magnetic field perpendicular to the optical axis (Voigt geometry) Yugova et al. (2012). Due to optically-induced, inhomogeneous nuclear polarization (see Ref. Heisterkamp et al. (2015b) for details) the effective field which determines the electron spin precession depends on the modulation frequency. Thus, the RSA peaks at different modulation frequencies are shifted relative to each other. The red arrow marks the position of the optically induced NMR of the 77Se isotope at . The black arrow marks the magnetic field position () for the measurement of the time. Figure 1(b) illustrates the change of the KR signal when the modulation frequency is switched from to . The green line represents the KR signal at . The black line shows the transient of the KR signal after switching to . By measuring the KR signal at a fixed magnetic field one detects the shift of the RSA peak from its position at to its position at . The KR signal increases and saturates in less than a second. The rise of the KR signal is fitted with a double exponential function yielding rise times of and . We interpret these components as the minimal and maximal polarization time of the repolarization process with a stretched exponent. We tentatively assign the fastest polarization time to the strongly polarized nuclei near the center of the donors which are exposed to the strongest Knight field and are most sensitive to a change of modulation frequency. On the other hand, the longest polarization time should result from the weaker polarized nuclei located farthest from the donors. These nuclei interact with a much weaker Knight field, so here the repolarization process occurs at a longer timescale.
Figure 1(c) shows these polarization times in dependence on the magnetic field. For these measurements is adjusted correspondingly to stay close to the optically-induced NMR at higher fields. The red squares represent the minimal polarization time (right axis), while the black circles shows the maximal polarization time (left axis). Both components increase with magnetic field, which we tentatively assign to the increasing difference of the electron and the nuclear Zeeman splitting. We conclude that the time to polarize the nuclei is on the order of several tens of milliseconds (fastest) or several hundreds of milliseconds (longest) in the magnetic field range from to .
Note that all these measurements are conducted under illumination. A lower limit for the nuclear spin relaxation time in darkness without illumination can be estimated from the measurement shown in Fig. 1(d). Here the switching of is combined with a shutter, which simultaneously blocks the pump and the probe beam. While the black line shows the continuous transient of the KR signal upon switching from to modulation at , the red line is measured with an additional dark time of . The shutter is closed at about after the modulation frequency has been switched and reopened at about . Closing the shutter slows down the nuclear spin relaxation process, since it prevents a repolarization or depolarization due to spin flip-flops with spin polarized electrons Korenev (2007). The amplitudes of the KR signals before and after this dark time are nearly the same. Thus, we conclude that exceeds several tens of seconds.
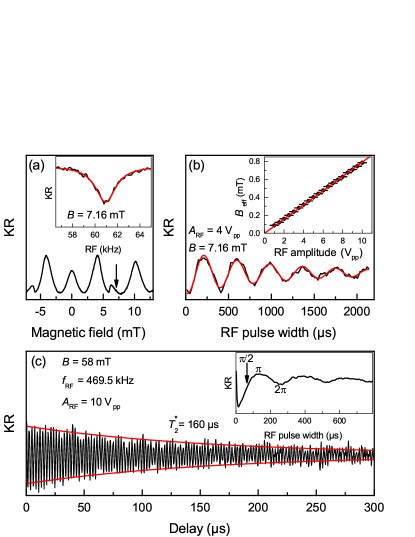
Now we turn to measurements based on coherent manipulation of the nuclear spins with RF fields. The small peaks in the RSA spectrum at about , shown in Fig. 2(a), are caused by the NMR induced by helicity modulation of the pump with . In order to coherently control the nuclear spins one needs to determine the nuclear magnetic resonance frequency at fixed external magnetic field. The inset shows an RF sweep with a peak-to-peak amplitude of () to determine . The measurement is performed at (see arrow), where the KR signal is sensitive to the RF excitation of the nuclei. This RF excitation depolarizes the nuclei and thereby reduces the Overhauser field component along the external field (), if its frequency is at or close to in the external magnetic field, so that the optically-induced NMR vanishes and the KR signal exhibits a dip around . The red line is a Lorentzian fit used to determine the NMR frequency .
We switch from this continuous-wave (CW) RF excitation to RF pulses of well-defined width to investigate the coherent properties of the nuclear spins. Figure 2(b) shows how the amplitude of the measured KR signal depends on the width of the RF pulses at resonant excitation of the NMR. We observe oscillations, which we interpret as Rabi oscillations, caused by the rotation of the nuclear spins around the effective magnetic field produced by the RF coil Rabi (1937); Rabi et al. (1938, 1939). The red line is a fit with an exponentially damped oscillation which yields the Rabi frequency . This frequency can be used to calculate the effective induced magnetic field at a given RF voltage using the relation , where the gyromagnetic ratio for the isotope (see Ref. Harris et al. (2002)) is used in . For the curve in Fig. 2(b) this yields . The inset of Fig. 2(b) shows the effective magnetic field in dependence on the RF amplitude. We obtain .
The inset in Fig. 2(c) shows a Rabi oscillation measurement at , and . It is used to determine the RF pulse width of a pulse. Using two pulses with a controllable delay between them allows one to measure Ramsey fringes and thereby determine the inhomogeneous spin dephasing time of the nuclear spins Ramsey (1949, 1950, 1995). Figure 2(c) demonstrates such a measurement. The first pulse creates a coherent superposition of the nuclear spins between the ground state and the excited state (both defined with respect to the constant external magnetic field) on the equator of the Bloch sphere Bloch (1946). The spins then precess in the equatorial plane, whereat the precession frequency is given by the Zeeman splitting of the nuclear spins. Due to this precession the nuclear spins acquire a relative phase with respect to the second pulse, so that this pulse will rotate the spins either to the or the state. The KR signal as a function of the delay , in turn, displays oscillations due to this periodic change between and . The red line in Fig. 2(c) shows the envelope of a fit with an exponentially damped oscillation which yields . At this time the nuclei run out of phase in their coherent precession.
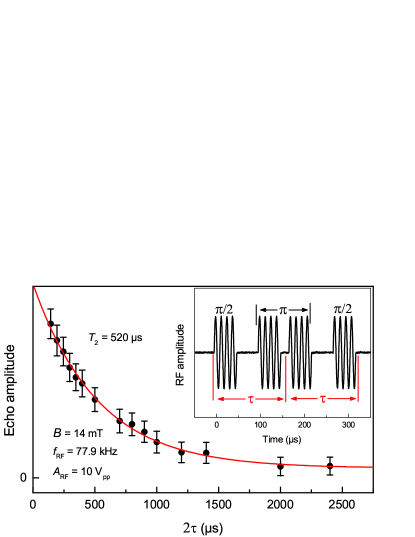
To determine the nuclear spin coherence time one needs to apply an additional pulse in between the two pulses used for the Ramsey method. The pulse applied after a time inverts the orientation of the spins which then rephase during the subsequent, second interval . This leads to a Hahn echo (nuclear spin echo) Hahn (1950) at the time when the dephasing of the spins due to ensemble inhomogeneities is completely compensated due to inversion of the system at . The decay of the echo amplitude which is determined at approximately yields the time. Figure 3 demonstrates such a measurement at and . The echo amplitude in dependence on the total time delay () between the pulses is best fitted with an exponential decay. This fit yields . The inset shows the used pulse sequence . The pulse is constructed of two pulses of approximately length (4 cycles at ) in accordance with a Rabi oscillations measurement under the same conditions.
The evaluated times of the coherent nuclear spin dynamics in ZnSe:F under the conditions of the pump-probe experiment are in reasonable agreement with data for quantum dots, where the carriers are strongly localized. Our results for the spin dephasing time and the spin coherence time have a similar order of magnitude as those reported for QWs Sanada et al. (2006) ( and and a single QD Makhonin et al. (2011) ( and ). Note that in GaAs all nuclei have nonzero spin and the quadrupole interaction between the nuclei plays an important role in this system Chekhovich et al. (2014).
To summarize, we have demonstrated that the nuclear spin relaxation processes can be detected all-optically under the conditions of the TRKR experiment. We employ the advances of optical detection, such as high sensitivity and spectral selectivity Sanada et al. (2006). We selectively study the spin dynamics of the nuclei in the vicinity of the fluorine donors, where a spatially inhomogeneous nuclear spin polarization is established under pulsed laser excitation. The detection by coherently precessing electrons instead of the polarization of the luminescence, as commonly used in measurements of the Hanle effect, allows one to select a single kind of isotope, since one can work at higher magnetic fields, where the Larmor precession frequencies of different isotopes split up. Furthermore, the detection by coherently precessing electrons can be used to measure the effect of nuclear fields on an ensemble of electron spins, where one cannot resolve the Zeeman splitting in the nuclear Overhauser field Overhauser (1953) spectrally, e.g., as in the case of single dot spectroscopy Makhonin et al. (2011); Chekhovich et al. (2013a, b).
We study the nuclear spin dynamics of the isotope in fluorine-doped ZnSe under the same experimental conditions as in Ref. [Heisterkamp et al., 2015b]. The fastest nuclear spin relaxation time or fastest polarization time under these conditions is found to be in the range from to at magnetic fields varied from to , while the longest polarization time is in the range from to . The nuclear spin coherence time is given by , so that the condition is valid. Therefore, the spin temperature of the nuclei is established with the time , which occurs much faster than the energy transfer to the lattice with the time. Thus, the nuclear spin polarization can be explained using the classical model of nuclear spin cooling. At this condition the nuclear spin temperature can be much lower than the lattice temperature.
Acknowledgments We acknowledge the financial support by the Deutsche Forschungsgemeinschaft in the frame of the ICRC TRR 160, the Volkswagen Stiftung (Project No. 88360/90080) and the Russian Science Foundation (Grant No. 14-42-00015). T.K. acknowledges financial support of the Project SPANGL4Q of the Future and Emerging Technologies (FET) programme within the Seventh Framework Programme for Research of the European Commission, under FET-Open Grant No. FP7-284743. We thank V. L. Korenev for helpful discussions.
References
- Sanaka et al. (2009) K. Sanaka, A. Pawlis, T. D. Ladd, K. Lischka, and Y. Yamamoto, Phys. Rev. Lett. 103, 053601 (2009).
- Sanaka et al. (2012) K. Sanaka, A. Pawlis, T. D. Ladd, D. J. Sleiter, K. Lischka, and Y. Yamamoto, Nano Lett. 12, 4611 (2012).
- De Greve et al. (2010) K. De Greve, S. M. Clark, D. Sleiter, K. Sanaka, T. D. Ladd, M. Panfilova, A. Pawlis, K. Lischka, and Y. Yamamoto, Applied Physics Letters 97 (2010).
- Kim et al. (2012) Y. M. Kim, D. Sleiter, K. Sanaka, Y. Yamamoto, J. Meijer, K. Lischka, and A. Pawlis, Phys. Rev. B 85, 085302 (2012).
- Sleiter et al. (2013) D. J. Sleiter, K. Sanaka, Y. M. Kim, K. Lischka, A. Pawlis, and Y. Yamamoto, Nano Lett. 13, 116 (2013).
- Greilich et al. (2012) A. Greilich, A. Pawlis, F. Liu, O. A. Yugov, D. R. Yakovlev, K. Lischka, Y. Yamamoto, and M. Bayer, Phys. Rev. B 85, 121303 (2012).
- Heisterkamp et al. (2015a) F. Heisterkamp, E. A. Zhukov, A. Greilich, D. R. Yakovlev, V. L. Korenev, A. Pawlis, and M. Bayer, Phys. Rev. B 91, 235432 (2015a).
- Greilich et al. (2007) A. Greilich, A. Shabaev, D. R. Yakovlev, A. L. Efros, I. A. Yugova, D. Reuter, A. D. Wieck, and M. Bayer, Science 317, 1896 (2007).
- Heisterkamp et al. (2015b) F. Heisterkamp, A. Greilich, E. A. Zhukov, E. Kirstein, T. Kazimierczuk, V. L. Korenev, I. A. Yugova, D. R. Yakovlev, A. Pawlis, and M. Bayer, Phys. Rev. B 92, 245441 (2015b).
- Fleisher and Merkulov (1984) V. G. Fleisher and I. A. Merkulov, in Optical Orientation, Modern Problems in Condensed Matter Sciences, edited by F. Meier and B. Zakharchenya (North-Holland, Amsterdam, 1984) Chap. 5.
- Sanada et al. (2006) H. Sanada, Y. Kondo, S. Matsuzaka, K. Morita, C. Y. Hu, Y. Ohno, and H. Ohno, Phys. Rev. Lett. 96, 067602 (2006).
- Kondo et al. (2008) Y. Kondo, M. Ono, S. Matsuzaka, K. Morita, H. Sanada, Y. Ohno, and H. Ohno, Phys. Rev. Lett. 101, 207601 (2008).
- Zhukov et al. (2014) E. A. Zhukov, A. Greilich, D. R. Yakovlev, K. V. Kavokin, I. A. Yugova, O. A. Yugov, D. Suter, G. Karczewski, T. Wojtowicz, J. Kossut, V. V. Petrov, Y. K. Dolgikh, A. Pawlis, and M. Bayer, Phys. Rev. B 90, 085311 (2014).
- Kikkawa and Awschalom (1998) J. M. Kikkawa and D. D. Awschalom, Phys. Rev. Lett. 80, 4313 (1998).
- Yugova et al. (2012) I. A. Yugova, M. M. Glazov, D. R. Yakovlev, A. A. Sokolova, and M. Bayer, Phys. Rev. B 85, 125304 (2012).
- Korenev (2007) V. L. Korenev, Phys. Rev. Lett. 99, 256405 (2007).
- Rabi (1937) I. I. Rabi, Phys. Rev. 51, 652 (1937).
- Rabi et al. (1938) I. I. Rabi, J. R. Zacharias, S. Millman, and P. Kusch, Phys. Rev. 53, 318 (1938).
- Rabi et al. (1939) I. I. Rabi, S. Millman, P. Kusch, and J. R. Zacharias, Phys. Rev. 55, 526 (1939).
- Harris et al. (2002) R. K. Harris, E. D. Becker, S. M. Cabral De Menezes, R. Goodfellow, and P. Granger, Concept. Magnetic Res. 14, 326 (2002).
- Ramsey (1949) N. F. Ramsey, Phys. Rev. 76, 996 (1949).
- Ramsey (1950) N. F. Ramsey, Phys. Rev. 78, 695 (1950).
- Ramsey (1995) N. Ramsey, Appl. Phys. B 60, 85 (1995).
- Bloch (1946) F. Bloch, Phys. Rev. 70, 460 (1946).
- Hahn (1950) E. L. Hahn, Phys. Rev. 80, 580 (1950).
- Makhonin et al. (2011) M. N. Makhonin, K. V. Kavokin, P. Senellart, A. Lemaître, A. J. Ramsay, M. S. Skolnick, and A. I. Tartakovskii, Nat. Mater. 10, 844 (2011).
- Chekhovich et al. (2014) E. A. Chekhovich, M. Hopkinson, M. S. Skolnick, and A. I. Tartakovskii, Nat. Commun. 6, 1 (2014).
- Overhauser (1953) A. W. Overhauser, Phys. Rev. 92, 411 (1953).
- Chekhovich et al. (2013a) E. A. Chekhovich, M. N. Makhonin, A. I. Tartakovskii, A. Yacoby, H. Bluhm, K. C. Nowack, and L. M. K. Vandersypen, Nat. Mater. 12, 494 (2013a).
- Chekhovich et al. (2013b) E. A. Chekhovich, M. M. Glazov, A. B. Krysa, M. Hopkinson, P. Senellart, A. Lemaitre, M. S. Skolnick, and A. I. Tartakovskii, Nat. Phys. 9, 74 (2013b).