Dust and Polycyclic Aromatic Hydrocarbon in the Pre-Transitional Disk around HD 169142
Abstract
The pre-transitional disk around the Herbig Ae star HD 169142 shows a complex structure of possible ongoing planet formation in dust thermal emission from the near infrared (IR) to millimeter wavelength range. Also, a distinct set of broad emission features at 3.3, 6.2, 7.7, 8.6, 11.3, and , commonly attributed to polycyclic aromatic hydrocarbons (PAHs), are detected prominently in the HD 169142 disk. We model the spectral energy distribution (SED) as well as the PAH emission features of the HD 169142 disk simultaneously with porous dust and astronomical-PAHs taking into account the spatially resolved disk structure. Our porous dust model consisting of three distinct components that are primarily concentrated in the inner ring, middle ring, and outer disk, respectively, provides an excellent fit to the entire SED, and the PAH model closely reproduces the observed PAH features. The accretion of ice mantles onto porous dust aggregates occurs between and , which overlaps with the spatial extent () of the observed PAH emission features. Finally, we discuss the role of PAHs in the formation of planets possibly taking place in the HD 169142 system.
1 Introduction
Transitional disks are a subgroup of protoplanetary disks, which are primarily characterized by gaps of large inner cavities of a few tens of astronomical units (AU) (e.g., see Strom et al. 1989). These cavities are considered to be nearly devoid of solid materials, and several mechanisms have been explored for the disk clearing phenomena such as photoevaporation (e.g., Alexander et al. 2006), accretion toward the central star (e.g., Perez-Becker & Chiang 2011), grain growth and coagulation onto large bodies (e.g., Dullemond & Dominik 2005), and large-scale disturbing by orbiting companions (e.g., Papaloizou et al. 2007, Andrews et al. 2011, Zhu et al. 2011). Recently, it is found that some of the transitional disks have shown significant infrared (IR) excess emission at 2–6 implying the possible existence of a remaining inner disk inside the cavity (). These are classified as “pre-transitional” disks (e.g., Espaillat et al. 2007), which would be an earlier evolutionary stage of transitional disks. Since the presence of such an inner disk is in favor of the large-scale dynamical disturbing by companions (e.g., Andrews et al. 2011), pre-transitional disks are of great interest to look for ongoing planet formation and to investigate the associated physical and chemical conditions.
HD 169142 (also known as SAO 186777) was first classified as a Vega-like star due to its IR excess based on the broadband photometry of the Infrared Astronomical Satellite (; Walker & Wolstencroft 1988). Later, it was suggested to be a pre-main sequence star at an earlier evolutionary stage than Vega-type stars (Sylvester et al. 1997) and has been considered as a Herbig Ae star with a stellar mass of (Blondel & Djie 2006) located at away (e.g., Sylvester et al. 1997). The HD 169142 disk shows complex structures including at least two cavities (or gaps), one ring structure, and an outer disk, which have been spatially resolved (e.g., Honda et al. 2012, Quanz et al. 2013, Osorio et al. 2014, Momose et al. 2015). Also, since its spectral energy distribution (SED) shows a significant near-IR excess at indicative of the presence of an inner disk (e.g., Honda et al. 2012, Osorio et al. 2014, Wagner et al. 2015), the HD 169142 disk becomes one of the exemplary pre-transitional disks. Furthermore, a point-like feature within the inner cavity has been detected by two independent observations with the NACO camera at the Very Large Telescope (VLT; Biller et al. 2014, Reggiani et al. 2014), which implies the possible occurrence of (multiple) planet formation in the disk.
HD 169142 was reported as the first star among Vega-like to have “unidentified infrared” (UIR) bands in its circumstellar disk (Sylvester et al. 1994) as revealed through the broad emission features at 7.7, 8.6, and 11.3 obtained with the 7.5– Cooled Grating Spectrometer 3 (CGS3) at the United Kingdom Infrared Telescope (UKIRT). Since then a number of observational and/or theoretical studies have examined these features as well as other associated ones such as the feature in the HD 169142 disk (e.g., Sylvester et al. 1996, 1997, Meeus et al. 2001, Acke & van der Ancker 2004, Smith et al. 2004, Sloan et al. 2005, Keller et al. 2008, Maaskant et al. 2014). Habart et al. (2006) obtained the 3.2–3.76 -band long-slit spectrum of the HD 169142 disk with the NACO adaptive optics system at the VLT and found that the 3.3 UIR feature is spatially extended up to 50. More recently, Maaskant et al. (2013) obtained the 8–13 N-band long-slit spectrum of this disk with the VLT Spectrometer and Imager for the Mid–Infrared (VISIR) also at the VLT and found that the 11.3 UIR feature is spatially extended as well.
The UIR features are commonly attributed to polycyclic aromatic hydrocarbon (PAH) molecules (Léger & Puget 1984, Allamandola et al. 1985), which play an important role in the physical and chemical evolution of protoplanetary disks. PAHs are excited by ultraviolet (UV) and visible photons, of which the absorbed energy, in turn, is re-emitted through the vibrational relaxation of PAHs via available internal vibrational modes including the C–H stretching mode at , C–C stretching at 6.2 and , C–H in-plane bending at , and C–H out-of-plane bending at and . This makes the PAH emission features an important diagnostic of the physical conditions of the disk. Photoelectrons of PAH molecules are the dominant heating source of the gas in the surface layers of the disk. Furthermore, PAHs probe the presence of very small grains, which can infer the dust processing in the disk such as settling and coagulation, and these processes are essential to form planetesiamls as a building block of planet formation.
In the context of the recent detection of a planet candidate as well as a rich set of the prominent PAH features, the HD 169142 disk provides an excellent laboratory to investigate the physical and chemical properties of PAHs and dust associated with the formation of planets. We perform an extensive modeling of the PAH features adopting the astro-PAH model of Li & Draine (2001) and Draine & Li (2007), which takes precise PAH chemistry into account. In the meantime, we model the dust continuum simultaneously using the porous dust model of Li & Lunine (2003a, 2003b) and also infer the disk geometry. In the following sections, we briefly describe the observational data in Section 2 and explain the adopted models for dust and PAHs in Section 3 taking the previously-known disk geometry into account. We present the model results in Section 4 and discuss the physical properties of dust and PAHs in the HD 169142 disk in Section 5. Finally, we summarize the major results in Section 6.
2 Data
Multi-wavelength photometric data and IR spectra of the HD 169142 disk are collected from the literature to model the SED and the PAH features simultaneously. We adopt the UV fluxes from the International Ultraviolet Explorer () archive, the UBVRI optical fluxes from Sylvester et al. (1996), the JH near-IR photometry from the 2MASS All-sky Point Source Catalog,111http://www.ipac.caltech.edu/2mass/releases/allsky mid- to far-IR fluxes obtained with ground-based telescopes including UKIRT (Sylvester et al. 1996), Keck II (Jayawardhana et al. 2001), Gemini (Mariñas et al. 2011), and Subaru (Honda et al. 2012) as well as space telescopes including the Wide-field Infrared Survey Explorer (),222http://wise2.ipac.caltech.edu/docs/release/allsky AKARI,333http://www.ir.isas.jaxa.jp/AKARI/Observation/PSC/Public IRAS, and the Herschel Space Telescope (Meeus et al. 2010), sub-millimeter (submm) fluxes obtained with the Submillimetre Common-User Bolometer Array (SCUBA) on the James Clerk Maxwell Telescope (JCMT) from Sandell et al. (2011), and millimeter (mm) data obtained with UKT14 on JCMT (Sylvester et al. 1996) and with the Very Large Array (VLA; Osorio et al. 2014). All the photometric fluxes and uncertainties are listed in Table 2 with their references. For IR spectroscopy, we take the 2.4–15 spectrum of Acke & van den Ancker (2004) obtained with the Shorter Wavelength Spectrometer (SWS) on board the Infrared Space Observatory (ISO) and the 5–36 spectrum of Keller et al. (2008) obtained with the Infrared Spectrograph (IRS) on board the Spitzer Space Telescope.
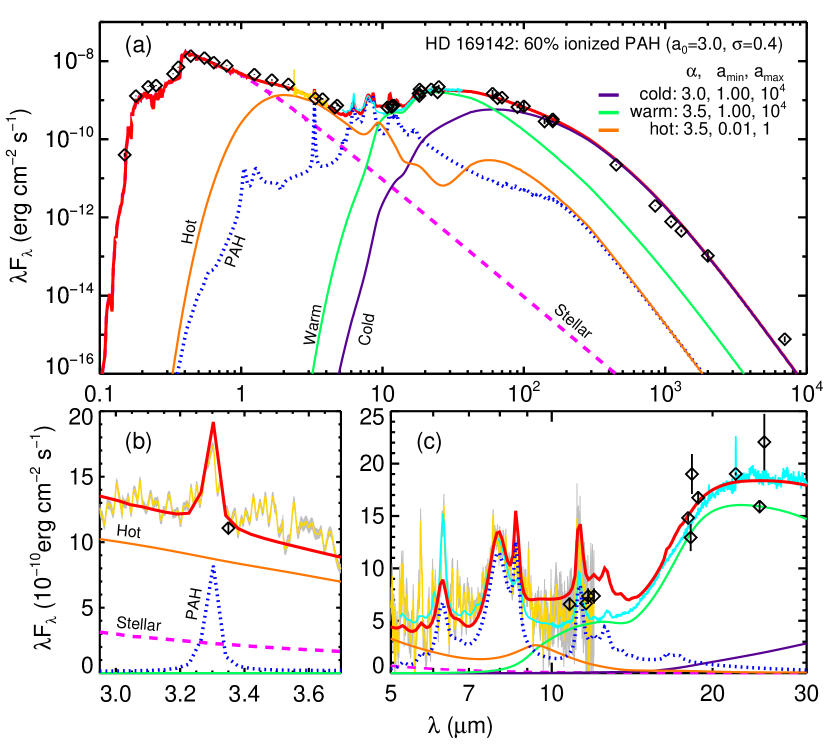
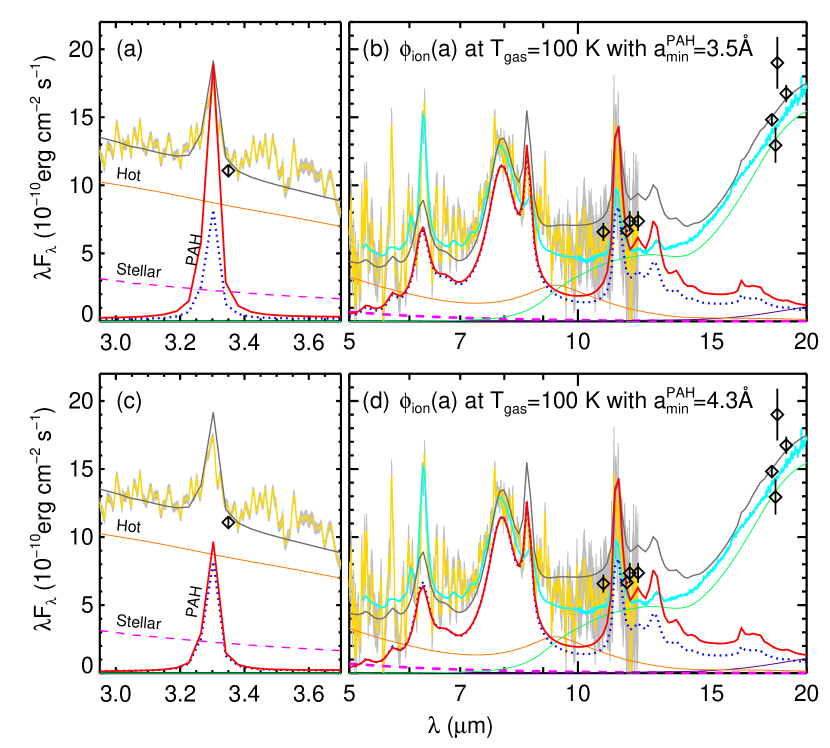
The observed SED at the entire wavelengths together with the IR spectra is shown in Figure 1(a). The stellar atmospheric model spectrum is overlaid for the case of K and log (Kurucz 1979). We adopt an interstellar extinction of (Blondel & Djie 2006) toward HD 169142 located at the distance of pc (e.g., Sylvester et al. 1997). All stellar parameters adopted in this paper are summarized in Table 2.
The PAH emission features detected in the ISO/SWS and Spitzer/IRS spectra are illustrated in Figures 1(b), (c). The major PAH features at 3.3, 6.2, 7.7, 8.6, and are prominent, and several minor features such as the 3.43, 6.87, and 7.23 features attributed to aliphatic hydrocarbon are also detected. No silicate feature is found in the Spitzer/IRS spectrum. As noted by Sloan et al. (2005), the 6.2 and features are shifted to 6.3 and 7.9, respectively,444The shift from still remains an enigma. Sloan et al. (2005) suggest that the shift is not sensitive to the charge of PAHs and speculate the influence of the PAH size. Later, a correlation between the peak wavelength of the feature and the effective temperature of the exciting star is found (Sloan et al. 2007): as the exciting star is cooler, the feature is shifted to longer wavelengths. In addition, it is suggested that the shift may be associated with the presence of circumstellar material (Tielens 2008). which are common for the so-called “class B” PAH spectra (Peeters et al. 2002). Class B sources are typically planetary nebulae, post-asymptotic giant branch stars, and isolated Herbig Ae/Be stars and are likely to be dominated by relatively pure PAHs (Peeters et al. 2002).
Recently, the variability of the disk emission of HD 169142 has been reported by Wagner et al. (2015). While the variability mostly occurs at the near-IR wavelengths (–, up to 45% over ), it is found that the intensities of the PAH features do not change with respect to their underlying continuum. As we aim to focus on the PAH emission and the variability-associated activity takes place within the region of the disk (Wagner et al. 2015), it is unlikely that our results would be affected. Thus, we have shifted the first segment (2.36–) of the ISO/SWS spectrum to fainter absolute fluxes by Jy to be consistent with the WISE photometric fluxes (see Figures 1(b)). The ISO/SWS spectrum at longer wavelengths (i.e., ) where the Spitzer/IRS spectrum overlaps is not used for modeling but is overlaid in Figure 1(c) to illustrate its agreement with the Spitzer/IRS spectrum.
| Wavelength | Flux | Uncertainty | Telescope/Filter | Reference |
|---|---|---|---|---|
| (µm) | (Jy) | (Jy) | ||
| 0.15 | 0.002 | 0.000 | IUE | 1 |
| 0.18 | 0.077 | 0.001 | IUE | 1 |
| 0.22 | 0.163 | 0.003 | IUE | 1 |
| 0.25 | 0.199 | 0.004 | IUE | 1 |
| 0.33 | 0.519 | 0.010 | IUE | 1 |
| 0.36 () | 0.841 | 0.019 | … | 2 |
| 0.44 () | 1.986 | 0.026 | … | 2 |
| 0.55 () | 2.207 | 0.020 | … | 2 |
| 0.64 () | 1.963 | 0.026 | … | 2 |
| 0.79 () | 2.004 | 0.041 | … | 2 |
| 1.24 () | 1.880 | 0.040 | 2MASS | 3 |
| 1.65 () | 1.810 | 0.060 | 2MASS | 3 |
| 2.16 () | 1.840 | 0.040 | 2MASS | 3 |
| 3.35 | 1.238 | 0.047 | WISE | 4 |
| 3.77 () | 1.349 | 0.064 | UKIRT | 2 |
| 4.60 | 0.995 | 0.021 | WISE | 4 |
| 4.78 () | 1.172 | 0.055 | UKIRT | 2 |
| 10.8 () | 2.370 | 0.237 | Keck II | 5 |
| 11.6 | 2.575 | 0.028 | WISE | 4 |
| 11.7 | 2.870 | 0.290 | Gemini | 6 |
| 12.0 | 2.950 | 0.290 | IRAS | 7 |
| 18.0 | 8.900 | 0.230 | AKARI/IRC | 8 |
| 18.2 | 7.860 | 0.786 | Keck II | 5 |
| 18.3 | 11.60 | 1.16 | Gemini | 6 |
| 18.8 | 10.50 | 0.40 | Subaru | 9 |
| 22.1 | 14.02 | 0.10 | WISE | 4 |
| 24.5 | 13.00 | 0.50 | Subaru | 9 |
| 25.0 | 18.39 | 2.24 | IRAS | 7 |
| 60.0 | 29.57 | 6.81 | IRAS | 7 |
| 65.0 | 24.45 | 0.10 | AKARI/FIS | 10 |
| 70.0 | 27.35 | 0.03 | Herschel | 11 |
| 90.0 | 19.99 | 1.23 | AKARI/FIS | 10 |
| 100 | 23.37 | 6.74 | IRAS | 7 |
| 140 | 13.32 | 1.89 | AKARI/FIS | 10 |
| 160 | 15.47 | 0.46 | AKARI/FIS | 10 |
| 160 | 17.39 | 0.05 | Herschel | 11 |
| 450 | 3.340 | 0.115 | JCMT/SCUBA | 12 |
| 850 | 0.565 | 0.010 | JCMT/SCUBA | 12 |
| 1100 | 0.287 | 0.013 | JCMT/UKT14 | 2 |
| 1300 | 0.197 | 0.015 | JCMT/UKT14 | 2 |
| 2000 | 0.070 | 0.019 | JCMT/UKT14 | 2 |
| 7000 | 0.0018 | 0.0003 | VLA | 13 |
References. — (1) IUE archival data; (2) Sylvester et al. (1996); (3) 2MASS All-sky Point Source Catalog; (4) WISE All-sky Data Release Catalog; (5) Jayawardhana et al. (2001); (6) Mariñas et al. (2011); (7) IRAS Point Source Catalog; (8) AKARI/IRC All-sky Survey Point Source Catalog (Version 1.0, Ishihara et al. 2010); (9) Honda et al. (2012); (10) AKARI/FIS All-Sky Survey Bright Source Catalog (Version 1.0); (11) Meeus et al. (2010); (12) Sandell et al. (2011); (13) Osorio et al. (2014)
| Parameter | Unit | Value | Reference |
|---|---|---|---|
| Sp. Type | A5Ve/A7Vz/A9III/IVe | 1, 2, 3 | |
| log | 4.2//4.0-4.1 | 1, 3 ,4 | |
| K | 8400//8250 | 1, 3, 5 | |
| 1.65 | 2 | ||
| 1.59/1.6/1.9 | 2, 4, 5 | ||
| 8.55/14.5/ | 2, 6, 7 | ||
| 6.0-30/ | 8, 9 | ||
| Age () | Myr | // | 2, 7, 10 |
| 0.01/0.43/0.00 | 2, 6, 7 | ||
| Distance | pc | 151/145/ | 2, 5, 7 |
Note. — Adopted values in this work are in bold.
References. — (1) Dunkin et al. (1997); (2) Blondel & Djie (2006); (3) Guimarães et al. (2006); (4) Meeus et al. (2010); (5) Sylvester et al. (1997); (6) Acke & van den Ancker (2004); (7) Meeus et al. (2012); (8) Panić et al. (2008); (9) Meeus et al. (2010); (10) Grady et al. (2007).
3 Model
We adopt the porous dust model of Li & Lunine (2003a, 2003b) and the astro-PAH model of Li & Draine (2001) and Draine & Li (2007) for modeling the dust continuum as well as the PAH features present in the observed IR spectra and SED. The modeling of dust and PAH emission for HD 169142 is similar to the modeling done on the HD 34700 debris disk in Seok & Li (2015), to which the reader is referred for more details. In addition, since the dust thermal IR emission in the HD 169142 disk has been spatially resolved previously, we elaborate the spatial (radial) distribution of dust in the disk. We briefly describe the adopted models with special attention paid to the effect of the disk geometry.
3.1 Disk Geometry
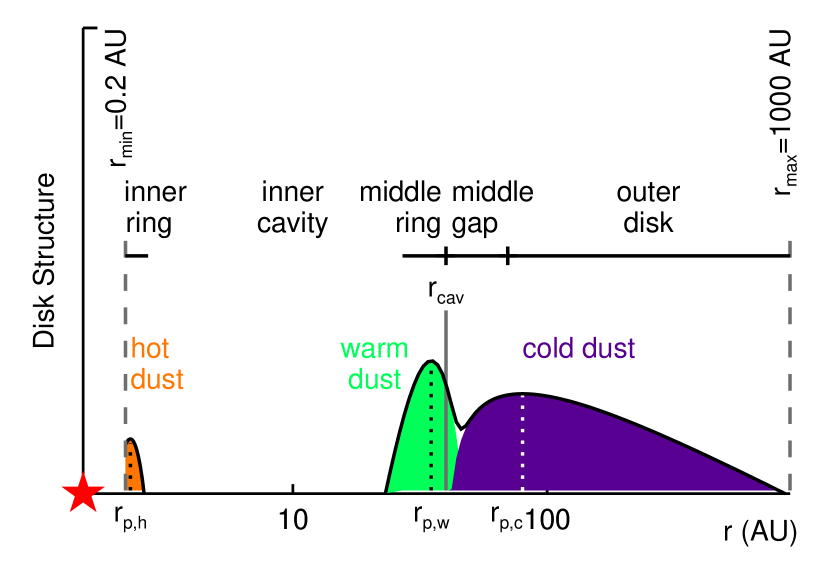
Various observations that spatially resolved the HD 169142 disk (e.g., Quanz et al. 2013, Osorio et al. 2014, Momose et al. 2015) enable us to better constrain the spatial distribution of dust in the disk. These observations have revealed a complex structure of the disk by direct imaging: an inner cavity (), a middle ring (), a middle gap (), and an outer disk (). Also, an inner ring (or inner disk, ) is inferred by the 2–6 near-IR excess emission continuum. Based on these observational results, the disk structure that we adopt is schematized in Figure 2. With this geometry, we suppose that the dust in the HD 169142 disk consists of three distinct components: hot, warm, and cold components. Each component is mainly located in one part of the disk: hot dust originates from the inner ring very close to the central star, warm dust peaks at the middle ring, and cold dust is mainly distributed throughout the outer disk beyond the middle gap. As shown in Figure 2 as well as in previous observations (e.g., Grady et al. 2007, Quanz et al. 2013, Osorio et al. 2014, Momose et al. 2015), the middle gap is not really a gap but a relatively depleted region. To formulate the spatial distribution of each component, we adopt two Gaussian profiles for the hot and warm components and one modified power-law for the cold component. The latter is more physical than a simple power-law and has been shown to be successful in reproducing the SED of the HD 34700 debris disk (see Equation (2) in Seok & Li 2015). The spatial distribution of each component is defined as
| (1) |
| (2) |
| (6) |
where and are, respectively, the peak radial distances of the hot and warm dust components, and are, respectively, the width of the inner and middle rings, and is the inner boundary of the middle gap. The cold dust component peaks at . The inner boundary of the entire dust disk () is defined as where dust grains sublimate (i.e., ), which is in the HD 169142 disk. For the outer boundary, is assumed as our model is barely affected by (see Li & Lunine 2003b, Seok & Li 2015), but it is within a reasonable range considering the distance to its companion (Grady et al. 2007)555A weak-line T Tauri binary, 2MASS 18242929–2946559 is located to the southwest of HD 169142, which corresponds to a projected separation of at (Grady et al. 2007).. Then, the total spatial distribution is expressed as
| (7) |
Since previous studies have revealed the detail structure of the HD 169142 disk (e.g., Honda et al. 2012, Quanz et al. 2013, Osorio et al. 2014, Momose et al. 2015), several parameters of the spatial distributions can be adopted accordingly. For the cold dust, is set based on Osorio et al. (2014), and is adopted based on previous observations of scattered light in the near-IR.666The radial profiles of the scattered light at 1.1 obtained with the Near Infrared Camera and Multi-Object Spectrometer (NICMOS) coronagraphy on board the Hubble Space Telescope (e.g., Grady et al. 2007) and the polarized intensity of the H-band scattered light obtained with Subaru (e.g., Momose et al. 2015) have an -dependence. As the stellar radiation field , the remaining is attributed to the radial dependence on the grazing angle between the scattering surface and the stellar light (see Appendix 2 of Momose et al. 2015). Although the column density of the uppermost layer of the dust disk where the scattered light is emitted is related to the total column density indirectly, we adopt a surface density proportional to here and fully examine the effect of varying in discussion (see Section 5.1). For the warm component, we vary and within a narrow range to be consistent with the middle ring seen in the direct imaging (i.e., the middle ring at , Quanz et al. 2013, Osorio et al. 2014). Finally, there are five free parameters to be constrained: , , , , and .
3.2 PAHs
For PAHs in the HD 169142 disk, we adopt a log-normal size distribution, , characterized by two parameters, the peak size () and the width () of the log-normal function (Li & Draine 2001, Li & Lunine 2003b, and see also Equation (1) in Seok & Li 2015). The PAH size distribution ranges from Å, which is the minimum size of PAHs of which can survive in the diffuse interstellar medium (ISM; Li & Draine 2001).
We adopt the PAH absorption cross sections from Draine & Li (2007). Neutral and charged PAHs are considered separately while neither cations from anions nor multiply charged PAHs from singly charged PAHs are distinguished. The absorption cross sections of the PAH features are expressed as a series of Drude profiles (Li & Draine 2001, Draine & Li 2007). As applied to HD 34700 (Seok & Li 2015), the peak wavelengths and/or widths of some of the Drude profiles are slightly modified (but the integrated area of each profile is kept unchanged) to fit the PAH features observed in the HD 169142 disk, which show some differences from those typically observed in the ISM (see Section 2).
The coexistence of the prominent PAH features at 3.3 and and those at 6.2 and in the observed IR spectra is indicative of a mixture of neutral and ionized PAHs in the HD 169142 disk. The ionization-recombination balance of PAHs is controlled by the PAH ionization parameter, , where is the UV starlight intensity, is the gas temperature, and is the electron density. This parameter originates from two competing mechanisms, the photoionization and the electron recombination (Bake & Tielens 1994, Weingartner & Draine 2001). Since the ionization parameter varies with the distance from the central star, the charge state of PAHs is expected to differ along the disk.
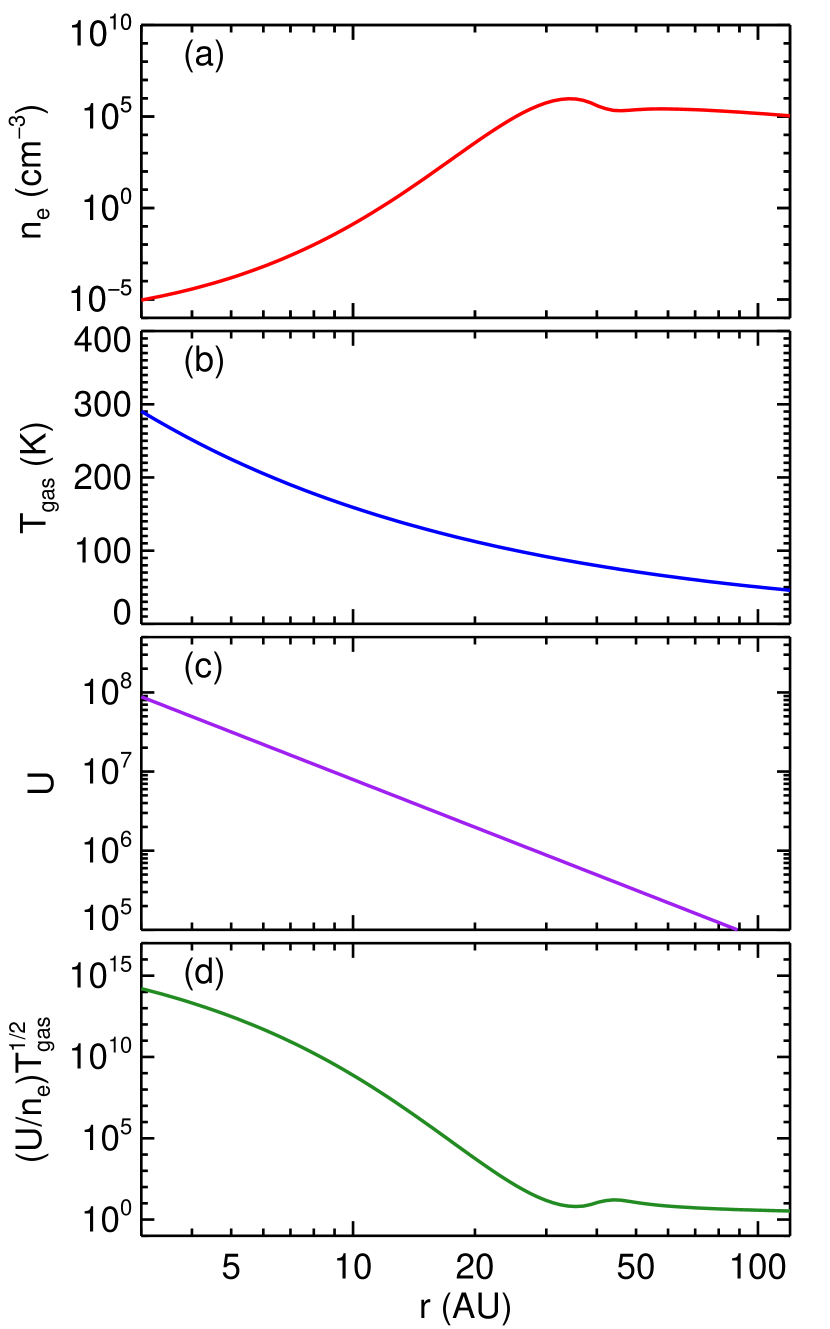
Following Li & Lunine (2003b), we derive , , and as a function of , the distance from the star (see also Section 3.1 in Seok & Li 2015). It is assumed that electrons primarily result from the cosmic-ray ionization of H2, of which the density is sufficiently high in the disk plane (Panić et al. 2008). Then, is calculated from , where is the cosmic ionization rate, is the stellar age, and is the density as a function of . We adopt and (Grady et al. 2007, see also Table 2). To derive , we first obtained the total H2 mass () from the total gas mass of the HD 169142 disk () in the literature (i.e., from Panić et al. 2008).777In Panić et al. (2008), is measured based on CO observations, and the measurement depends on the abundance of 12CO with respect to H2 inevitably. Panić et al. (2008) adopted a range of conversion factors (2.0–9.5) reported in the literature. We adopt their results obtained with the minimum conversion factor (i.e., ), which gives the most consistent value with what Meeus et al. (2010) derived based on the far-IR observations of Herschel (see Table 2). Assuming that the spatial distribution of H2 follows that of dust with a constant dust-to-H2 mass ratio (see Equations (1)–(7)) and that the disk is in vertical hydrostatic equilibrium, we derive from . With and , this leads to the radial distribution of electron density as shown in Figure 3(a) (see Appendix B in Li & Lunine 2003b for details). For shown in Figure 3(b), we take , where is the stellar radius for HD 169142 (Meeus et al. 2010).
The starlight intensity is defined as the intensity of the stellar radiation between 912 and 1 at a distance from the central star of HD 169142 with respect to that of the local interstellar radiation field (ISRF) of Mathis et al. (1983; MMP83). Following Equation (1) in Li & Lunine (2003b), we obtain as shown in Figure 3(c). Combining , , and , we calculate the ionization parameter, as a function of radial distance (). As shown in Figure 3(d), PAHs near the central star are highly ionized (i.e., high ) whereas those far from the star are mostly neutral or negatively charged (i.e., low ). A dip at – and a bump at in result from the spatial distribution of , which reflects the dust spatial distribution in the disk (see Section 3.1).
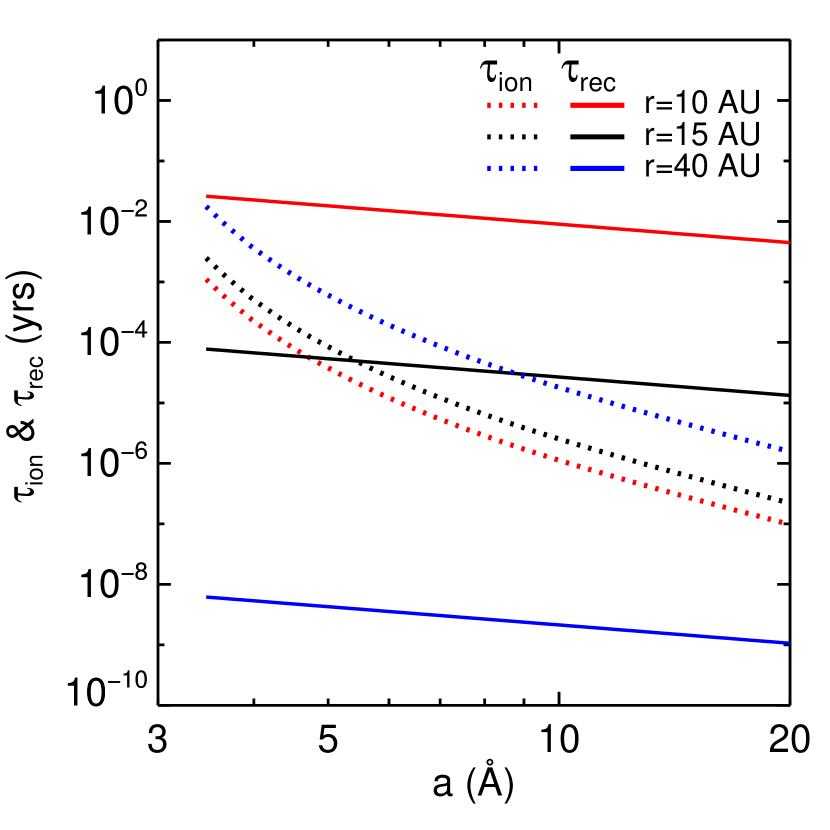
To examine the charge state of PAHs in the HD 169142 disk further, we have calculated the photoionization rate () and the electronic recombination rate () at given distances taking into account their dependences on PAH size (see Equations (A7)-(A8) in Li & Lunine 2003b). Figure 4 shows the timescales of photoionization () and electron recombination () as a function of PAH size ( in Å) at , 15, and 40. While all PAH molecules at would experience electronic recombination immediately, those at would be photo-ionized within a shorter timescale against recombination. Also, PAHs around may become negatively-charged because abundant free electrons are available to recombine with them. The 3.3 and PAH emission features in the HD 169142 disk were found to be spatially extended up to (Habart et al. 2006, Maaskant et al. 2013). If PAHs are distributed from somewhere in the inner gap to beyond (e.g., ), and/or if some PAHs in the middle ring become anion, we can naturally explain that both neutral and charged PAHs exist in the HD 169142 disk as indicated by the observed PAH features in the IR spectra.
To quantify the charge state of this mixture of neutral and charged PAHs, we examine the ionization fraction (), which is the probability of finding a PAH molecule in a nonzero charge state (Li & Lunine 2003b). The ionization fraction, depends on the PAH size (), starlight intensity (), and electron density (). In particular, a precise knowledge of is needed for an accurate calculation of (Weingartner & Draine 2001). For simplicity, we first search for a constant for all PAH sizes that can reproduce the observed PAH features closely. Then, the best-fit value will be compared to as a function of PAH size () derived with and shown in Figure 3 (see Section 5.2).
Because of the single-photon heating nature of PAHs, the spectral profiles of the PAH features are independent of the starlight intensity (Draine & Li 2001, Li & Draine 2001). Consequently, this indicates that the PAH abundance or the total mass of PAHs in the disk () becomes inversely proportional to .
3.3 Dust
Porous dust in the model of Li & Lunine (2003a,b) is assumed to be formed via cold coagulation of pristine interstellar grains. Dust aggregates are highly fluffy (quantified by porosity, ) and are composed of amorphous silicate (, Draine & Lee 1984) and carbonaceous materials (, Rouleau & Martine 1991). Those at regions also have mantles consisting of H2O-dominated ices (, Li & Greenberg 1998), which have a slightly different porosity (). The mixing mass ratios are adopted to be and , where , , and , are the total mass of the carbon, silicate, and ice subgrains, respectively (Li & Lunine 2003a). It is found that the variation of porosity within the range of , which is expected for dust aggregates via coagulation (Cameron & Schneck 1965, Blum & Wurm 2008) does not affect the modeling significantly (Seok & Li 2015), so we adopt for the silicate-carbon aggregate dust and for the ice-coated silicate-carbon aggregate dust in HD 169142 (Li & Lunine 2003a, 2003b).
Assuming that a dust grain is spherical in shape, we adopt a power-law size distribution: , where is the radius of the spherical dust aggregate, is the power-law index, and and are the lower and upper size cutoff. Since the three dust components (hot, warm, and cold dust in Section 3.1) are placed in different physical conditions, in particular the hot dust at the inner ring, each could have distinct size distributions. We took and for the warm and cold dust components (Li & Lunine 2003b). Varying the size cutoffs, in particular, , does not cause considerable changes in our results as explored in Li & Lunine (2003b) and Seok & Li (2015). However, for the warm component, is preferred because smaller grains produce a strong silicate feature at , which is absent in the IR spectra of HD 169142. For the hot component, much smaller grains ( and ) are adopted to account for the near-IR excess emission. Decreasing does not make much difference whereas larger enhances the silicate feature. Hence, the power-law index of each component (i.e., , , and for the hot, warm, and cold components, respectively) is set to be a free parameter for the dust size distribution. For a given set of these parameters combined with those for the disk geometry (see Section 3.1), the total dust mass () is determined by the flux level of the observed dust continuum (see Equation (11) in Li & Lunine 2003b).
4 Results
Our best-fit model is shown in Figure 1, which provides an excellent fit to both the entire SED as well as the PAH emission features. The best-fit model includes a mixture of neutral and charged PAHs with an ionization fraction of . The relatively high indicates either that the PAH emission from somewhere in the inner cavity contributes the total PAH intensity considerably or that a large fraction of PAHs in the middle ring are negatively charged. The former is because PAH cations are expected to be mostly distributed at (see Section 3.2 and Figure 4), and this implies that the inner cavity devoid of small dust grains might produce ionized PAH emission contributing to its entire IR spectrum significantly even if their contribution to the total PAH mass may not be significant. The latter is also feasible since the PAH emission is known to be spatially extended up to (Habart et al. 2006, Maaskant et al. 2013) and the electron recombination timescale in the middle ring is much shorter than the photoionization timescale (see Figure 4).
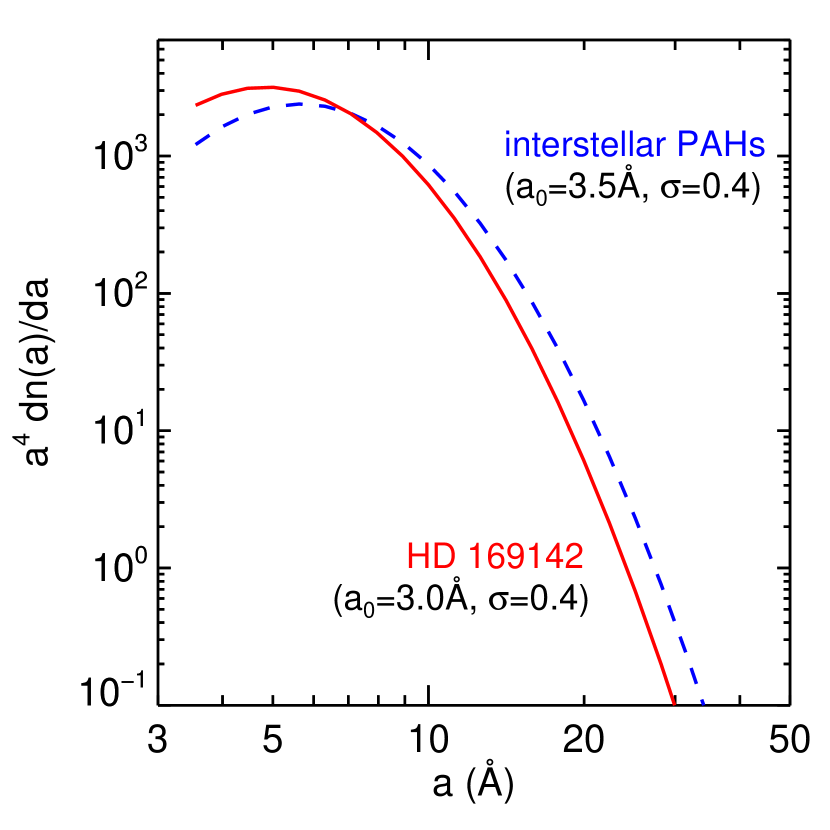
The PAH size distribution is characterized by and (Figure 5), which indicates that a population of slightly smaller PAHs is preferred for the HD 169142 disk compared with those in the diffuse ISM ( and , Li & Draine 2001).
For the dust emission, the best-fit model gives the dust size distribution with power-law indices of , , and for the hot, warm, and cold components, respectively. The flatter indicates that larger grains are more abundant in the cold dust component compared to the other components.
For the disk geometry, the hot dust component peaks at with a width of , the warm component peaks at with , and the cold component peaks at . Though the spatial distribution of the hot component cannot be verified due to the lack of spatially resolved observational data, the other derived parameters are consistent with previous observations (e.g., a ring at –40, a gap at –70, and an outer disk at –250 shown in Quanz et al. 2013). For the sake of convenience, we call this best-fit model the standard model hereafter.
With the parameters of the standard model, we calculate a total dust mass of (i.e., ), which is dominated by the cold component (). The hot and warm components contribute only 0.06% and 0.46% of , respectively. Our estimate is in good agreement with those reported in the literature including (Panić et al. 2008) or (Honda et al. 2012). A total IR flux including both the dust and PAH emission is derived as , based on the standard model. The hot, warm, and cold components contribute , 40%, and 19%, respectively, while the PAH emission accounts for of the total IR emission. Unlike that the total dust mass is dominated by the cold component, the contribution of each component to the total IR emission is comparable to each other. The total IR flux yields a total IR luminosity of at . This gives a ratio of the IR luminosity to the stellar luminosity of which is consistent with the estimates reported in previous studies (e.g., , Meeus et al. 2012).
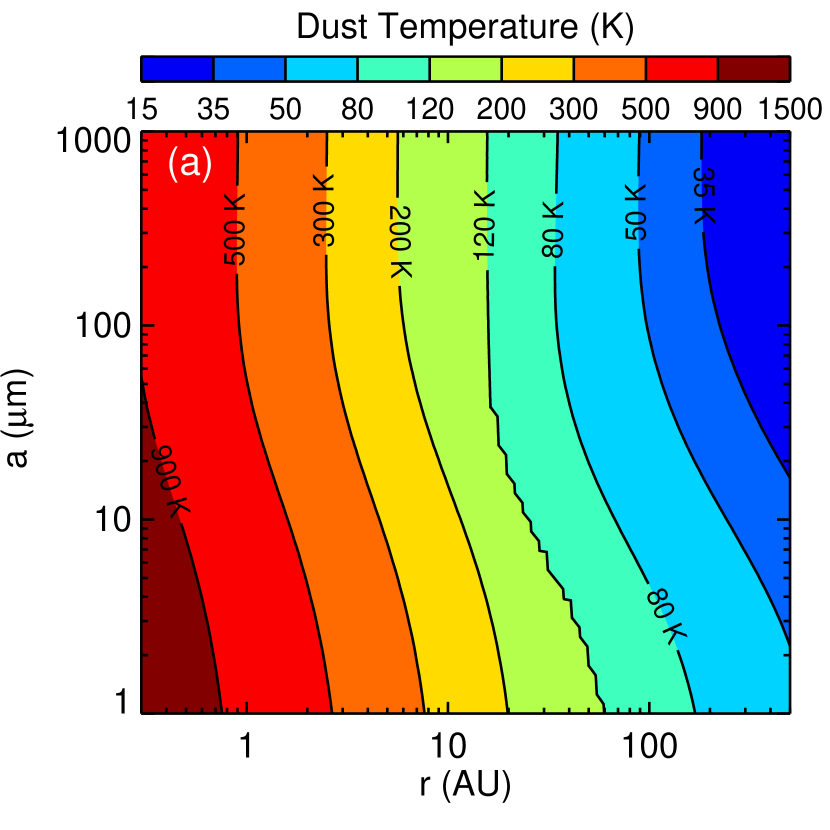
Assuming that the dust grains are in thermal equilibrium, we calculate the dust temperature () as a function of grain size () and distance () from the central star (Figure 6(a)). Porous dust with starts to have ice-coated subgrains when its temperature becomes below 120. Figure 6(a) shows that the ice sublimation of small grains starts to occur at in the HD 169142 disk, and all icy mantles are expected to have sublimated at . Since the ice-coated porous dust () is less absorptive due to the presence of the more transparent ice mantles of subgrains, the dust temperature varies abruptly at the transition between icy and non-icy dust grains.
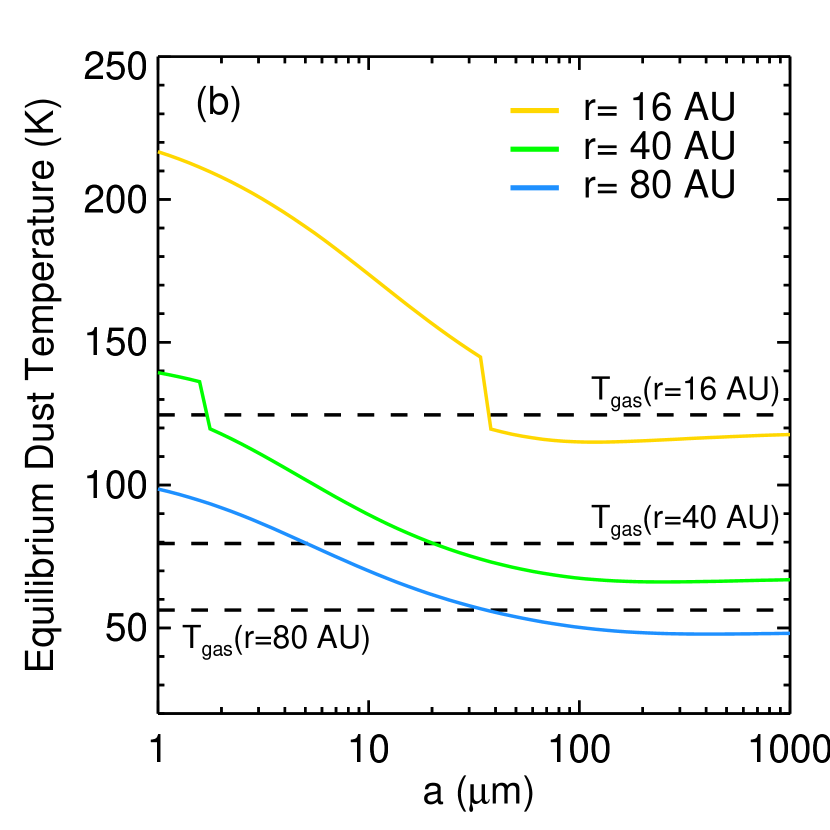
The transition can be seen in Figure 6(b) more clearly. It shows that the temperature of a dust grain depends on its size and the distance from the central star. The temperature profiles at and show rapid changes around . When a dust grain in a disk accretes volatile molecules from the gas-phase to form an ice mantle, its location (i.e., the radial distance from the central star) is defined as the “snowline”. The snowline plays an important role in the spatial distribution of (free-flying) PAHs and the PAH chemistry as PAH molecules might easily stick on the ice mantle of dust grains and then will not emit the observable emission features. As shown in Figure 6(a) and (b), the exact snowline ranges from to depending on the grain size. Recalling that the 3.3 and 11.3 PAH emission features are detected in the disk with a spatial extent of (Habart et al. 2006, Maaskant et al. 2013), the spatial distribution of PAH molecules in the HD 169142 disk seems to closely correlate with the snowline of the disk, and the condensation of free-flying PAHs onto the ice mantles becomes efficient when most of the small grains are coated with an ice mantle.
5 Discussion
5.1 Robustness
While our standard model reproduces the observed SED and PAH emission features successfully, it might not be the unique solution, so we verify the robustness of our best-fit parameters here. All the parameters of the porous dust model are explicitly discussed in Li & Lunine (2003b) for the HD 141569A disk. Also, the effects of some parameters including those for the dust spatial distribution are discussed in Seok & Li (2015) for the HD 34700 disk. These discussions are expected to be valid for the HD 169142 disk as well.
For the PAH modeling, there are three parameters involved: and for the size distribution, and for the ionization fraction. With , we have tried to fit the observed PAH emission features with the interstellar PAH size distribution (, ). The interstellar mixture also produces a model spectrum in good agreement with the observed spectrum. In comparison with our standard model, as the interstellar mixture contains fewer (more) small (large) PAHs (see Figure 5), the feature is slightly weaker while the feature is slightly stronger.
For , the observed spectrum shown in Figure 1 clearly depicts that the PAHs in the HD 169142 disk are neither fully ionized () nor fully neutral (). Varying affects the relative strengths of the PAH emission bands significantly (e.g., see Allammandola et al. 1999). We have calculated and 0.8, and the model produces too strong a feature by a factor of while the model emits too weak a feature by a factor of . The relative strength of the feature behaves in a way similar to that of the feature, which increases (or decreases) within for (or ). Note that we assumed a constant for PAHs of all sizes so far, and we will discuss its dependence on the PAH size in Section 5.2.3.
For the dust modeling, three components (hot, warm, and cold components) are combined to explain the observed SED, and each component can be described by a distinct set of grain size and spatial distributions. For all components, our models are not sensitive to the lower () and upper () cutoff sizes of the dust size distribution except of the warm component and of the hot component, which affect the strength of the silicate emission feature at (see Section 3.3).
For the hot component, since the inner ring has not been spatially resolved, its dust spatial distribution parameters and cannot be firmly constrained. We vary between and and between and . Any combination within these ranges does not alter the model-fit significantly and the model emission varies within 5% at . Models with show deficiency in the 2MASS J, H, Ks bands and a stronger silicate feature.
For the warm component, and can be directly compared to the middle ring spatially resolved in the near-IR polarized light image (e.g., Quanz et al. 2013), or in the 7 mm dust continuum (e.g., Osorio et al. 2014). To be consistent with the resolved ring structure, we only vary and . Models with slightly overproduce the dust continuum at wavelengths longer than . Models with can also reproduce the observed SED successfully except that as gets smaller, the silicate feature becomes stronger. Varying within the above range does not alter the model-fit considerably. Only for the case with small (i.e., ), as increases, the feature gets even stronger. This is because more grains are located close to the central star (Equation 2). With and fixed, we examine the power-law index for the size distribution. It is found that mainly affects the slope of the dust continuum at . The Spitzer/IRS spectrum shows that the dust continuum raises at and becomes roughly flat at (see Figure 1(c)). Models with flat () cannot explain the flat continuum as there would be too many large grains which emit at longer wavelengths. Models with give reasonable fits, but steeper (shallower) slopes slightly overproduce the emission at wavelengths shorter (longer) than .
Similar to the warm component, the spatial distribution of the cold component can be directly compared to the direct imaging. As the middle gap is located at (e.g., Quanz et al. 2003, Momose et al. 2015), is supposed to be near the outer radius of the gap (). Models with give almost identical SEDs except slight difference at (e.g., less than 10% of the flux level at ). We also examine by varying it between 2.5 and 3.5. Models with steeper slopes () emit too much at and too little at mm wavelengths. Models with shallower slopes () can produce reasonable fits to the observed SED but emit more by a factor of –4 in the five JCMT bands (–).
Based on previous observations (e.g., Grady et al. 2007, Momose et al. 2015), is adopted in our models (see Section 3.1). We find that increasing () does not affect the model-fit significantly except decreasing by a factor of at most and a little deficiency at 7 mm. In fact, our standard model already shows a deficiency at 7 mm by a factor of . The contribution of free-free emission is expected to be negligible as it is less than 5% of the observed VLA 7 mm flux density (Osorio et al. 2014). In addition, previous studies (e.g., Quanz et al. 2013) suggest that the radial profiles of the observed surface brightness of the outer disk would be better explained with two power-laws; the slope of the inner region () is relatively shallower than that of the outer region (). These results imply that the outer disk might require an additional component of the disk geometry and/or multiple dust grain populations to explain the 7 mm emission. We prefer not to model the 7 mm emission in terms of a two-power-law dust spatial distribution as this would inevitably requires three more parameters.
In summary, we have examined various models with different combinations of parameters and find that our main results are maintained. Therefore, the porous dust model together with the astro-PAH model is robust in explaining the dust and PAH emission from the HD 169142 disk.
5.2 PAHs in the HD 169142 Disk
5.2.1 Abundance
Because PAHs are exposed to stochastic heating by starlight (Draine & Li 2001), their IR emission profiles are independent of the starlight intensity, and the absolute flux levels of the PAH features simply scale with the starlight intensity. Consequently, the total PAH mass, , is inversely proportional to the starlight intensity (), and as is proportional to (Section 3.2), scales with .
To account for the observed fluxes of the PAH features, the total PAH mass in the HD 169142 disk can be expressed as assuming all PAHs are concentrated at a distance of . Although the spatial distribution of the PAH emission along the radial direction of the disk has not been revealed observationally, the spatially extended 3.3 and features clearly indicate that it is extended to up to (Habart et al. 2006, Maaskant et al. 2013). Adopting results in (or ),which is about a factor of smaller than the previous estimates (e.g., in Maaskant et al. 2014 or in Meeus et al. 2010). Since a large amount of PAH molecules could have frozen onto the ice mantles of cold dust grains beyond (i.e., snowline), our estimate of may not represent the actual total PAH mass in this disk. This could be the primary reason for the difference between our estimate and those of the previous studies, which assumed a constant PAH-to-dust mass fraction over the entire outer part of the disk (including the middle ring and the outer disk, ). The spatial distribution of PAHs in the HD 169142 disk is critical to calculate , which still remains unknown in detail except the outer boundary of the PAH emission. Future near- and mid-IR observations with higher spatial resolution and higher sensitivity could allow us to place a stronger constraint on the current PAH modeling.
The deficit of PAHs in protoplanetary disks or debris disks has been reported in the literature (e.g., Li & Lunine 2003b, Geers et al. 2006, Thi et al. 2013, Seok & Li 2015). Indeed, a low PAH mass fraction of the HD 169142 disk has also been found by previous studies (e.g., , Meeus et al. 2010, Maaskant et al. 2014). As our estimate of does not constrain the PAH mass beyond the snowline (i.e., ), we compare with the total mass of the hot and warm components (i.e., , see Section 4), which yields a PAH-to-dust mass ratio of . Although our ratio is higher than the previous estimates by a factor of , it still indicates that the HD 169142 disk has a deficit of PAHs relative to dust compared to the typical PAH abundance in the ISM (, Li & Draine 2001, Draine & Li 2007). The origin of the deficiency of PAHs remains unclear. Performing a systematic study of the PAH emission in protoplanetary disks and debris disks would extend our understanding of the origin of PAHs and their characteristics in the disks (J. Y. Seok & A. Li 2015, in preparation).
5.2.2 Photodestruction
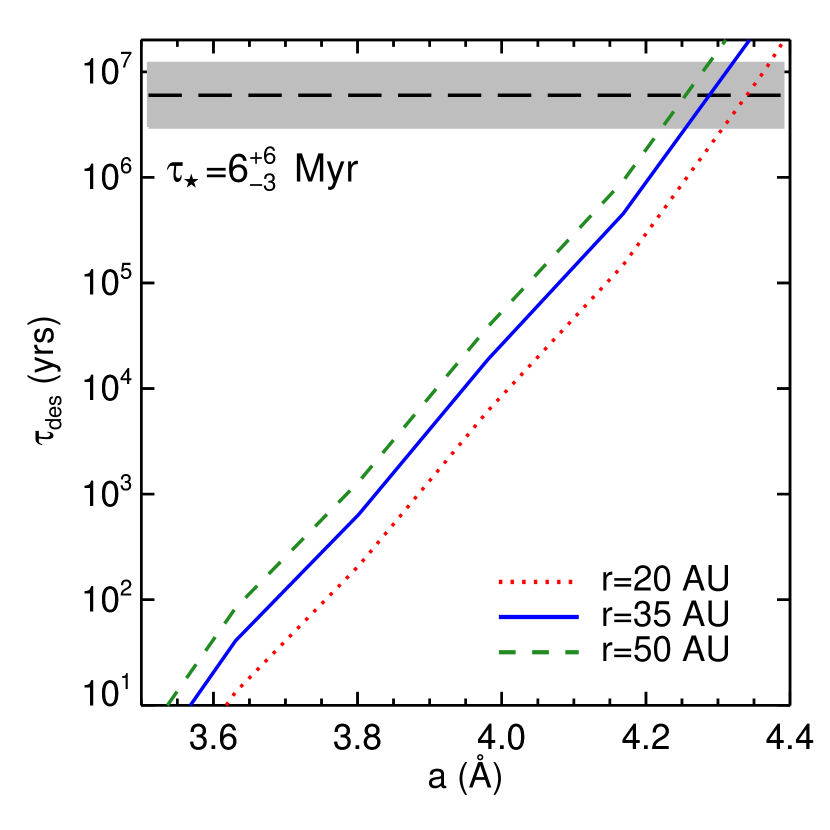
When an energetic photon hits a PAH molecule, this could eventually result in its photodissociation. In particular for small PAHs that do not have enough internal vibrational modes to distribute the energy absorbed from the photon, they may eject a hydrogen atom, a hydrogen molecule, or an acetylene molecule (C2H2) and end up with dissociation. We refer to Li & Lunine (2003b, see their Appendix A) for a detailed discussion of the PAH photophysics. Following their approach, we assume that a single ejection of an acetylene molecule causes the PAH destruction and derive the photodestruction rates () of PAHs exposed to UV photons in the HD 169142 disk. Figure 7 represents the timescales of photodestruction () for small PAHs at specific distances from the central star (, 35, and ). PAHs smaller than (or those containing the number of carbon atoms fewer than ) are likely to be destroyed during the lifetime of HD 169142 ( Myr). This indicates that a continuous replenishment of small PAHs is required to explain the current abundance, which is evidenced by the observed PAH feature.
To maintain the population of small PAHs in the region where the PAH feature has been detected (including the inner gap and the middle ring), continuous replenishment has been occurring at a rate of
| (8) |
where is the minimum size of PAHs, and is the mass density of PAHs, which is adopted to be that of graphite (). The PAH surface density distribution, , is assumed to be the same as the spatial distribution of the warm dust component with a cutoff at (Equation 2, see Section 3.1):
| (9) |
where is the PAH mid-plane surface density at .
Adopting , , , , , and from the standard model, we calculate , which yields the PAH replenishment rate of taking only photodestruction into account.
In addition to photodissociation, PAHs as well as dust grains in the HD 169142 disk are subject to radiation pressure, Poynting-Robertson drag, and gas drag. While the stellar radiation pressure which blows away materials is effective for dust with a size of , the Poynting-Robertson drag is effective for dust with a size of and causes the dust to spiral inward to the star. As this disk is still gas-rich, the gas drag dominates the motion of dust grains. Our simple estimate of a gas-drag timescale is very short (only a few decades), and a full treatment of the gas-drag requires a 2-dimensional disk structure (e.g., see Chiang & Yudin 2010 for a review), which is beyond the scope of this paper.
5.2.3 Ionization
The charge state of PAHs is determined by the balance between the photoelectric emission and collisions with electrons and ions. The steady state charge distribution as a function of PAH size () can be calculated from the photoemission rate, the positive ion accretion rate, and the electron accretion rate when relevant ambient conditions are given (e.g., see Bakes & Tielens 1994, Weingartner & Draine 2001). Since the detailed information about the electron density () such as its spatial distribution is not well known for the HD 169142 disk, we adopt a constant ionization fraction for our standard model, and gives the excellent fit to the observed PAH emission features. Here, we explore the effect of the ionization fraction more by calculating as a function of PAH size () and adopting the radial profiles of and shown in Figure 3. As the absorption cross sections for PAH molecules are proportional to (i.e., ), it is naturally expected that large PAHs are more ionized while small ones are more neutral. This is also consistent with the comparison between the photoionization and recombination timescales (Figure 4).
Figure 8 shows the best-fits to the ISO/SWS and Spitzer/IRS spectra provided by the PAH models with the ionization fraction calculated from the balance between the photoionization and electron recombination. We adopt a gas temperature , which corresponds to that at (see Figure 3). Within the range of radial distances where PAHs are possibly distributed in the HD 169142 disk (i.e., a few ), varies by less than a factor of 2, and the resultant PAH spectra are not sensitive to in the context that the ionization parameter is only proportional to . The best-fit shown in Figure 8 is obtained with the PAH size distribution used in the standard model ( and ). All other parameters associated with dust modeling are identical to those in the standard model.
In comparison with the standard model for which the PAH emission is shown as a blue dotted line in Figure 8, the best-fit model with variable increases the strength of the 3.3 and features while the 6.2, 7.7, and features are not altered. This is because small PAHs that dominate the the 3.3 emission feature become more neutral (i.e., –0.3 for ) than those in the standard model with ; moreover, neutral PAHs also emit more strongly at the 11.3 feature than ionized PAHs. To avoid the overproduction of these features, we adopt the lower cutoff size () for the PAH component from the largest PAH size that can be destroyed by photodissociation during the lifetime of HD 169142 (i.e., , see Section 5.2.2 and Figure 7). The best-fit model with predicts the strength of the feature to be comparable to that of the standard model, which successfully reproduces the observed feature (see Figure 8(c)). However, the intensity of the feature still remains overestimated. This is attributed to the overpopulation of neutral PAHs with a size of , which is the size regime of neutral PAHs that efficiently radiate the feature (e.g., Draine & Li 2007).
We do not attempt any further adjustment to reproduce the observed feature since is currently calculated on the basis of uncertain ambient conditions (e.g., ). It is noteworthy that our standard model with gives an excellent fit to the observed PAH emission, which might indicate that more small PAHs are positively or negatively charged in the HD 169142 disk. We speculate that anionic small PAHs are more favorable because small PAHs are required to be close to the central star to be ionized (see Figure 4) where they are subject to more efficient photodissociation (see Figure 7). Further knowledge on the ambient conditions and the spatial variation of the relative strengths the of PAH features can verify the true physical properties of PAHs in the HD 169142 disk.
5.2.4 Aliphatics versus Aromatics
In addition to the major, prominent PAH features at 3.3, 6.2, 7.7, 8.6, 11.3, and 12.7, several minor spectral features at 3.43, 6.87, and 7.23 are also clearly seen in the ISO/SWS and Spitzer/IRS spectra of the HD 169142 disk (see Figure 1b,c; also see Sloan et al. 2005, Acke et al. 2010). These features are generally attributed to the C–H vibrational modes in aliphatic hydrocarbons (e.g., Chiar et al. 2000). The detection of these aliphatic features indicates that the PAH species in the HD 169142 disk are alkylated and have aliphatic CH sidegroups.
Following Li & Draine (2012), we estimate the aliphatic fraction of the PAH molecules in the HD 169142 disk. Let and respectively be the total (integrated) fluxes emitted from the 3.3 and features. The ISO/SWS spectrum gives . Assuming that the feature exclusively originates from the aliphatic C–H bond (i.e., no contribution from anharmonicity (Barker et al. 1987) or superhydrogenation (Bernstein et al. 1996)), we derive an upper limit on the ratio of the number of C atoms in aliphatic sidegroups to that in aromatic benzene rings from , where and are the band strengths of the aliphatic and aromatic C–H bonds, respectively. The coefficient of 0.3 comes from the assumption that one aliphatic C atom corresponds to 2.5 aliphatic C–H bonds while one aromatic C atom corresponds to 0.75 aromatic C–H bond (see Li & Draine 2012). With (Yang et al. 2013), we obtain . This implies that the PAH molecules in the HD 169142 disk are mostly aromatic.
Similarly, let and respectively be the measured intensities of the 6.87 and emission features as shown in the Spitzer/IRS spectrum. By fitting the features with Drude profiles, we obtain . Let and respectively be the band strengths of the aliphatic C–H deformation band and the aromatic C–C stretching band. Let be the Planck function at wavelength and temperature . For we obtain . With per CH2 or CH3 group and per C atom for charged aromatic molecules (see Li & Draine 2012), we derive the ratio of the number of carbon atoms in aliphatic sidegroups to that in aromatic benzene rings: . Again, this demonstrates that the PAH molecules in the HD 169142 disk are predominantly aromatic.
5.2.5 Links to Planet Formation
As recent observations have revealed point-like features in the HD 169142 disk (e.g., Biller et al. 2014, Osorio et al. 2014, Reggiani et al. 2014) together with the nature of pre-transitional disks such as a cavity with an inner disk, we would postulate that planet formation is ongoing in the HD 169142 disk so that we can briefly discuss the link between PAH molecules and planet formation.
PAHs play an important role in the physical and chemical evolution of dust disks around young stellar objects, where planet formation takes place. PAH molecules in the surface layer of a dust disk where the stellar UV radiation directly reaches absorb UV photons efficiently and get photoionized. Energetic electrons ejected from the ionized PAHs are the dominant heating source of the surrounding gas, of which the temperature in turn determines the vertical structure of the disk. The energy absorbed by PAHs reradiate in their IR bands, which influence the physical processes driven by radiation close to the midplane. Chemically, both free-flying PAHs as well as those frozen-out on ice-mantles of dust grains are important. Neutral and negatively charged PAHs can transfer electrons with C+ efficiently, which affect the carbon chemistry of the disk. Ice mantles where PAHs are frozen can be processed by UV light and cosmic-rays so that various complex (organic) molecules can form (e.g., see Bernstein et al. 2002, Bouwman et al. 2011). Since such ice-coated grains are the building blocks of comets and planetesimals, these materials could be delivered to newly-forming planets and affect their early phase of the chemical evolution. Although it is observationally established that the 3.3 and 11.3 PAH emission is spatially extended in the HD 169142 disk, the precise spatial distribution of PAHs has not been resolved, so we cannot directly connect PAHs to the ongoing planet formation. However, the HD 169142 disk provides an unique opportunity to probe the role of PAHs in planet formation, and high spatial resolution studies by the Atacama Large Millimeter/Submillimeter Array (ALMA) and the James Webb Space Telescope () will allow us to unveil the mutual interaction of the gas, dust, and PAHs in the disk and their roles in the ongoing planet formation.
6 Summary
We have modeled the PAH emission features and the dust thermal emission SED from the near-IR to submm/mm wavelengths of the pre-transitional disk around HD 169142 with porous dust aggregates and a mixture of neutral and charged PAHs. Taking into account the spatially resolved disk structure (inner cavity, middle ring, middle gap, and outer disk) together with an inner ring inferred from the 2–6 near-IR excess emission, our standard model, consisting of three dust components and relatively small PAH molecules (following a log-normal size distribution with and ), provides an excellent fit to the entire SED and the PAH emission features.
The observed Spitzer/IRS and ISO/SWS IR spectra of the HD 169142 disk show the prominent PAH band emission at 3.3, 6.2, 7.7, 8.7, 11.3, and , which can be reproduced by PAHs with an ionization fraction of for all PAH sizes. A comparison between the photoionization and electron recombination timescales suggests that such a high can be attributed to either positively charged PAHs located at the inner gap () or negatively charged PAHs in the middle ring () where the electron density is high. As the 3.3 and PAH features are known to extend up to in the disk, both cases are plausible. For comparison with the constant scenario, as a function of PAH size () at a given distance from the central star is calculated according to the ambient physical conditions. As small PAHs tend to be more neutral than large PAHs, models with variable overproduce the intensities of the 3.3 and features when the lower cutoff of the PAH size is the same as the standard model (i.e., ). Adopting the largest PAH size subject to the photodestruction during the lifetime of HD 169142 as the lower cutoff size (i.e., ), the observed feature is reproduced closely while the feature is still enhanced. This implies that more small PAHs are required to be charged either positively or negatively in the HD 169142 disk to explain the observed emission.
The minor PAH features at 3.43, 6.87, and are also clearly detected in the ISO/SWS and Spitzer/IRS spectra. These minor features are indicative of aliphatic sidegroups attached to the benzene rings of PAHs. The 3.43 feature is generally attributed to the aliphatic C–H stretching band, while the 6.87 and 7.23 features are attributed to the aliphatic C–H deformation bands. By comparing the intensity of the 3.43 feature to that of the 3.3 feature, we place an upper limit of on the aliphatic fraction of the PAH molecules in the HD 169142 disk. Similarly, an aliphatic fraction of 0.025 is derived by comparing the intensity of the 6.87 feature to that of the 7.7 feature. We conclude that the PAH molecules in the HD 169142 disk are predominantly aromatic.
The three dust components in the standard model include a hot dust component (, ), a warm dust component (, ), and a cold dust component (, ), which mainly originate from the inner ring, the middle ring, and the outer disk, respectively. Our standard model suggests that the dust distribution in the inner disk peaks at at with a FWHM of . The spatial distributions of the warm and cold components ( with , and ) are in good agreement with the disk geometry previously resolved by direct imaging observations. The total dust mass in the disk is calculated to be , which is dominated by the cold dust component (99.48%).
The total IR luminosity of is obtained for a distance of , of which 10% is contributed by the PAH emission. The hot, warm, and cold components account for 31%, 40%, and 19% of the total IR luminosity, respectively.
In thermal equilibrium, ice mantles of porous dust grains in the HD 169142 disk are sublimated between and . Beyond , grains even smaller than become ice-coated, so that free-flying PAH molecules can easily stick onto the ice mantles of the grains. This is consistent with the previous observations showing that the 3.3 and emission features are extended up to , which implies that the snowline is closely related to the spatial distribution of the observable PAH emission. Assuming that the all the PAHs are located at a distance of from the central star, the observed PAH emission yields a total PAH mass of . Adopting , is obtained, which yields a PAH-to-dust mass ratio of in comparison with the total mass of the hot and warm components. This indicates a deficit of PAHs (relative to dust) in the HD 169142 disk with respect to the ISM, which is a common case for dust disks around young stars.
PAH molecules, in particular small PAHs, are subject to photodissociation by absorbing an energetic photon. During the lifetime of the HD 169142 disk (), PAHs smaller than are photo-destroyed, and to maintain the population of small PAHs, a PAH mass replenishment rate of is required. By combining the distinct PAH emission features and the spatially resolved disk structure with the detection of point-like sources in the disk, HD 169142 offers a unique opportunity to study the role of PAHs in disk physics and ongoing planet formation.
References
- (1) Acke, B., & van den Ancker, M. E. 2004, A&A, 426, 151
- (2) Acke, B., Bouwman, J., Juhász, A., et al. 2010, ApJ, 718, 558
- (3) Alexander, R. D., Clarke, C. J., & Pringle, J. E. 2006, MNRAS, 369, 229
- (4) Allamandola, L. J., Tielens, A. G. G. M., & Barker, J.R. 1985, ApJ, 290, L25
- (5) Allamandola, L. J., Hudgins, D. M., & Sandford, S. A. 1999, ApJL, 511, L115
- (6) Andrews, S. M., Wilner, D. J., Espaillat, C., et al. 2011, ApJ, 732, 42
- (7) Bakes, E. L. O., & Tielens, A. G. G. M. 1994, ApJ, 427, 822
- (8) Barker, J.R., Allamandola, L.J., & Tielens, A.G.G.M. 1987, ApJ, 315, L61
- (9) Bernstein, M. P., Elsila, J. E., Dworkin, J. P., et al. 2002, ApJ, 576, 1115
- (10) Bernstein, M.P., Sandford, S.A., & Allamandola, L.J. 1996, ApJ, 472, L127
- (11) Biller, B. A., Males, J., Rodigas, T., et al. 2014, ApJL, 792, L22
- (12) Blondel, P. F. C., & Djie, H. R. E. T. A. 2006, A&A, 456, 1045
- (13) Blum, J., & Wurm, G. 2008, ARA&A, 46, 21
- (14) Bouwman, J., Mattioda, A. L., Linnartz, H., & Allamandola, L. J. 2011, A&A, 525, A93
- (15) Cameron, A. G. W., & Schneck, P. B. 1965, Icarus, 4, 396
- (16) Chiang, E., & Youdin, A. N. 2010, Annual Review of Earth and Planetary Sciences, 38, 493
- (17) Chiar, J. E., Tielens, A. G. G. M., Whittet, D. C. B., et al. 2000, ApJ, 537, 749
- (18) Draine, B.T., & Lee, H.M. 1984, ApJ, 285, 89
- (19) Draine, B.T., & Li, A. 2001, ApJ, 551, 87
- (20) Draine, B.T., & Li, A. 2007, ApJ, 657, 810
- (21) Dullemond, C. P., & Dominik, C. 2005, A&A, 434, 971
- (22) Dunkin, S. K., Barlow, M. J., & Ryan, S. G. 1997, MNRAS, 286, 604
- (23) Espaillat, C., Calvet, N., D’Alessio, P., et al. 2007, ApJL, 670, L135
- (24) Geers, V. C., Augereau, J.-C., Pontoppidan, K. M., et al. 2006, A&A, 459, 545
- (25) Grady, C. A., Schneider, G., Hamaguchi, K., et al. 2007, ApJ, 665, 1391
- (26) Guimarães, M. M., Alencar, S. H. P., Corradi, W. J. B., & Vieira, S. L. A. 2006, A&A, 457, 581
- (27) Habart, E., Natta, A., Testi, L., & Carbillet, M. 2006, A&A, 449, 1067
- (28) Honda, M., Maaskant, K., Okamoto, Y. K., et al. 2012, ApJ, 752, 143
- (29) Ishihara, D., Onaka, T., Kataza, H., et al. 2010, AJ, 514, 1
- (30) Jayawardhana, R., Fisher, R. S., Telesco, C. M., et al. 2001, AJ, 122, 2047
- (31) Keller, L. D., Sloan, G. C., Forrest, W. J., et al. 2008, ApJ, 684, 411
- (32) Kurucz, R. L. 1979, ApJS, 40, 1
- (33) Léger, A., & Puget, J. 1984, A&A, 137, L5
- (34) Li, A. 2009, in Deep Impact as a World Observatory Event: Synergies in Space, Time, and Wavelength, ed. H. U. Käufl & C. Sterken, 161
- (35) Li, A., & Draine, B.T. 2001, ApJ, 554, 778
- (36) Li, A., & Draine, B.T. 2012, ApJ, 760, L35
- (37) Li, A., & Greenberg, J.M. 1998, A&A, 331, 291
- (38) Li, A., & Lunine, J. I. 2003a, ApJ, 590, 368
- (39) Li, A., & Lunine, J. I. 2003b, ApJ, 594, 987
- (40) Maaskant, K. M., Honda, M., Waters, L. B. F. M., et al. 2013, A&A, 555, A64
- (41) Maaskant, K. M., Min, M., Waters, L. B. F. M., & Tielens, A. G. G. M. 2014, A&A, 563, A78
- (42) Mathis, J. S., Mezger, P. G., & Panagia, N. 1983, A&A, 128, 212
- (43) Mariñas, N., Telesco, C. M., Fisher, R. S., & Packham, C. 2011, ApJ, 737, 57
- (44) Meeus, G., Montesinos, B., Mendigutía, I., et al. 2012, A&A, 544, A78
- (45) Meeus, G., Pinte, C., Woitke, P., et al. 2010, A&A, 518, L124
- (46) Meeus, G., Waters, L. B. F. M., Bouwman, J., et al. 2001, A&A, 365, 476
- (47) Momose, M., Morita, A., Fukagawa, M., et al. 2015, PASJ, 233
- (48) Osorio, M., Anglada, G., Carrasco-González, C., et al. 2014, ApJL, 791, L36
- (49) Panić, O., Hogerheijde, M. R., Wilner, D., & Qi, C. 2008, A&A, 491, 219
- (50) Papaloizou, J. C. B., Nelson, R. P., Kley, W., Masset, F. S., & Artymowicz, P. 2007, Protostars and Planets V, ed. B. Reipurth, D. Jewitt, & K. Keil (Tucson, AZ: Univ. Arizona Press), 655
- (51) Peeters, E., Hony, S., Van Kerckhoven, C., et al. 2002, A&A, 390, 1089
- (52) Perez-Becker, D., & Chiang, E. 2011, ApJ, 735, 8
- (53) Quanz, S. P., Avenhaus, H., Buenzli, E., et al. 2013, ApJL, 766, L2
- (54) Reggiani, M., Quanz, S. P., Meyer, M. R., et al. 2014, ApJL, 792, L23
- (55) Rouleau, F., & Martin, P. G. 1991, ApJ, 377, 526
- (56) Sandell, G., Weintraub, D. A., & Hamidouche, M. 2011, ApJ, 727, 26
- (57) Seok, J. Y., & Li, A. 2015, ApJ, 809, 22
- (58) Sloan, G. C., Jura, M., Duley, W. W., et al. 2007, ApJ, 664, 1144
- (59) Sloan, G. C., Keller, L. D., Forrest, W. J., et al. 2005, ApJ, 632, 956
- (60) Smith, T. L., Clayton, G. C., & Valencic, L. 2004, AJ, 128, 357
- (61) Strom, K. M., Strom, S. E., Edwards, S., Cabrit, S., & Skrutskie, M. F. 1989, AJ, 97, 1451
- (62) Sylvester, R. J., Barlow, M. J., & Skinner, C. J. 1994, Ap&SS, 212, 261
- (63) Sylvester, R. J., Skinner, C. J., & Barlow, M. J. 1997, MNRAS, 289, 831
- (64) Sylvester, R. J., Skinner, C. J., Barlow, M. J., & Mannings, V. 1996, MNRAS, 279, 915
- (65) Thi, W., Pinte, C., Pantin, E., et al. 2013, A&A, 561, A50
- (66) Tielens, A. G. G. M. 2008, ARA&A, 46, 289
- (67) Wagner, K. R., Sitko, M. L., Grady, C. A., et al. 2015, ApJ, 798, 94
- (68) Walker, H. J., & Wolstencroft, R. D. 1988, PASP, 100, 1509
- (69) Weingartner, J. C., & Draine, B. T. 2001, ApJS, 134, 263
- (70) Yang, X. J., Glaser, R., Li, A., & Zhong, J. X. 2013, ApJ, 776, 110
- (71) Zhu, Z., Nelson, R. P., Hartmann, L., Espaillat, C., & Calvet, N. 2011, ApJ, 729, 47