On the depletion and accretion timescales of cold gas in local early-type galaxies
Abstract
We consider what can be learnt about the processes of gas accretion and depletion from the kinematic misalignment between the cold/warm gas and stars in local early-type galaxies. Using simple analytic arguments and a toy model of the processes involved, we show that the lack of objects with counter-rotating gas reservoirs strongly constrains the relaxation, depletion and accretion timescales of gas in early-type galaxies. Standard values of the accretion rate, star formation efficiency and relaxation rate are not simultaneously consistent with the observed distribution of kinematic misalignments. To reproduce that distribution, both fast gas depletion ( yr; e.g. more efficient star formation) and fast gas destruction (e.g. by active galactic nucleus feedback) can be invoked, but both also require a high rate of gas-rich mergers ( Gyr-1). Alternatively, the relaxation of misaligned material could happen over very long timescales ( dynamical times or - Gyr). We explore the various physical processes that could lead to fast gas depletion and/or slow gas relaxation, and discuss the prospects of using kinematic misalignments to probe gas-rich accretion processes in the era of large integral-field spectroscopic surveys.
keywords:
galaxies: elliptical and lenticular, cD – galaxies: evolution – galaxies: ISM – ISM: molecules – ISM: evolution – galaxies: kinematics and dynamics1 Introduction
In all its forms, gas is one of the most important drivers of galaxy evolution. The availability of cold gas (atomic and molecular) regulates star formation, and thus the evolution and fate of galaxies, from the beginning of the universe to today. Many factors affect the supply and removal of gas. Some processes allow gas to flow onto galaxies and form stars (e.g. cold accretion, mergers, hot halo cooling and stellar mass loss; e.g. Keres et al. 2005; Parriott & Bregman 2008; Bauermeister, Blitz & Ma 2010), while others compete to remove, destroy, and/or prevent gas accretion (e.g. stellar and active galactic nucleus (AGN) feedback, outflows, the development of hot halos and virial shocks; e.g. Silk & Rees 1998; Birnboim & Dekel 2003; Croton et al. 2006). The balance reached by these processes determines if a galaxy forms stars throughout its life, or if it becomes a gas-starved “red and dead” object. Understanding these processes is thus vital to further develop theories of galaxy evolution.
One laboratory where we are able to study these processes at work is gas-rich early-type galaxies (ETGs; ellipticals and lenticulars). ETGs typically have red optical colours, forming a “red sequence” in optical colour-magnitude diagrams (e.g. Baldry et al., 2004). The majority of the stars in current-day ETGs were already in place at (e.g. Bower, Lucey & Ellis, 1992; Thomas et al., 2005), suggesting that some of the physical processes listed above have kept them relatively gas-free ever since.
Nevertheless, a small proportion of ETGs do have cold gas and associated star formation, consistent with a recent regeneration of their gas reservoir (Young et al., 2014). Such low level activity has been found to contribute up-to 30% of the mass of some ETGs since (e.g. Kaviraj, 2014).
A great deal of work has in fact been done in recent years to quantify the amount of gas present in the ETG population. Studies of statistically complete samples have shown that of ETGs have of cold molecular gas (e.g. Combes, Young & Bureau, 2007; Welch, Sage & Young, 2010; Young et al., 2011), while % have sizeable atomic gas reservoirs ( ) (e.g. Morganti et al., 2006; Sage & Welch, 2006; Serra et al., 2012). Dust is also present in a large fraction of ETGs (e.g. Smith et al., 2012), and the presence of gas has been inferred from low-level residual star formation (e.g. Knapp et al., 1989; Yi et al., 2005; Kaviraj et al., 2007; Salim & Rich, 2010; Temi, Brighenti & Mathews, 2009; Shapiro et al., 2010).
A quenched object has only two paths by which to rebuild its cold ISM: an internal one (cooling of material lost from stars during their evolution) and an external one (wet mergers, cold accretion, and/or cooling of hot/shocked accreted gas). Stellar mass loss must of course always be present, but the cold gas detection rate smaller than unity suggests that the majority of stellar ejecta does not cool but rather remains warm or hot (e.g. settling at the virial temperature of the galaxy; e.g. Parriott & Bregman 2008). Various observational studies have suggested that the external channel dominates in field environments. The evidence for this comes from the large fraction of gas-rich ETGs that are morphologically disturbed in deep imaging (e.g. van Dokkum, 2005; Duc et al., 2015), the presence of young kinematically decoupled cores in IFU surveys (e.g. McDermid et al., 2006), the orders of magnitude surplus of interstellar medium (ISM) compared to expectations from stellar mass loss (e.g. Merluzzi, 1998; Knapp et al., 1989; Rowlands et al., 2012; Kaviraj et al., 2012), the large spread of gas-to-dust ratios within their cold ISM (Smith et al., 2012; Davis et al., 2015) and the kinematic decoupling of the cold and ionized gas from the stars (Sarzi et al., 2006; Davis et al., 2011a; Katkov, Sil’chenko & Afanasiev, 2014)
In this paper we consider how gas accretion and depletion affect this last piece of observational evidence: the kinematic decoupling of the cold and ionized gas from the stars. In Section 2 we discuss how the observed distribution of angles between the projected angular momenta of the gas and stars can be used to estimate the gas-rich merger rate of ETGs and the time taken for gas to be depleted. In Section 3 we use a simple model to show that there is tension between these estimates and other observations. We discuss how to reconcile the two in Section 4 and conclude briefly in Section 5.
2 ACCRETION AND DEPLETION TIMESCALES
2.1 Origin of the gas
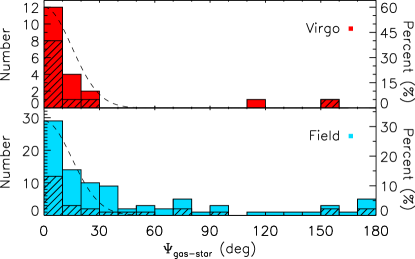
Davis et al. (2011a) studied the kinematic misalignment (the difference between the projected angular momenta) of the molecular gas and stars in the complete, volume-limited ATLAS3D survey of ETGs (Cappellari et al., 2011). Following Sarzi et al. (2006), they assumed that gas that has cooled from stellar mass loss must always be kinematically aligned with those same stars. On the other hand, material that has been accreted onto a galaxy from external sources can have any angular momentum. Davis et al. (2011a) found that roughly two-thirds of the galaxies are kinematically aligned and are thus consistent with an internal gas origin (i.e. stellar mass loss and/or gas remaining gas from the galaxy formation). One-third of the galaxies are kinematically misaligned and must therefore have acquired their gas externally (i.e. cold accretion and/or minor mergers).
Most importantly, as shown in Figure 1, this behaviour varies drastically as a function of environment. Indeed, there is essentially no kinematically-misaligned galaxy in the Virgo cluster (the only cluster surveyed by ATLAS3D), implying that external accretion of cold gas is shut off in dense environments. Conversely, at least half of the galaxies in the field have acquired their molecular gas externally. The same applies to ionised gas probed through optical emission lines, that can be detected in some cases in objects with ionised gas masses as low as . This results in a higher detection rate overall ( for ionised gas versus for molecular gas; Sarzi et al. 2006; Young et al. 2011) and thus better number statistics.
2.2 Depletion timescale
Although its importance was not recognised at the time, a key feature of the histograms presented in Figure 1 is the absence of a peak at a kinematic misalignment of for field galaxies. A kinematic misalignment generally traces a morphological misalignment (Krajnović et al., 2011), and structurally-misaligned gas in a fast-rotating ETG (one with a clear disc structure) should be forced back to the equatorial plane over time. This is primarily because the disc gravity provides a substantial torque toward the plane, and because gas dissipation prevents long lived precession of the gas reservoir (Tohline, Simonson & Caldwell, 1982). To first order this relaxation should occur symmetrically, with only the initial accretion angle determining if the gas relaxes to be exactly co- or counter-rotating, although stellar mass loss (co-rotating by definition) should create a drag on any misaligned material (including that at ). The peak of galaxies with kinematically-aligned gas (at ) is thus likely caused by a combination of this relaxation process for externally accreted gas, drag from stellar mass loss, and gas with an internal origin (i.e. cooled stellar mass loss itself). By contrast, the bin at should contain only relaxed externally-accreted gas.
Assuming we are not observing local ETGs at a special epoch in their evolution, the absence of a peak at a kinematic misalignment angle in Figure 1 thus implies that the externally-accreted gas is depleted on a timescale (equal to the gas survival timescale ) shorter than the torquing timescale , irrespective of the depletion process.
Previous studies of the relaxation of gas discs in elliptical galaxies were conducted to understand the dynamics of gaseous polar rings. Tohline, Simonson & Caldwell (1982) and Lake & Norman (1983) considered relaxation in both axisymmetric and triaxial halos, and found that in either case the alignment process typically takes a few dynamical times (). Lake & Norman (1983) found that
| (1) |
where is the ellipticity of the potential. For a typical bulge in a lenticular galaxy (Mendez-Abreu et al., 2008), thus .
As shown in Davis et al. (2013), the CO discs of the ATLAS3D ETGs have typical radii kpc, with rotational velocities at the disc edges of km s-1. This therefore yields the following constraint on the accreted molecular gas depletion timescale:
| (2) | |||||
The estimate yr is surprisingly short. Indeed, if the accreted molecular gas were to form stars at the same rate as observed in later-type disc galaxies (i.e. spiral galaxies), it should be consumed on a timescale of - yr (e.g. Kennicutt, 1998; Bigiel et al., 2011). Furthermore, the star formation efficiency of normal ETGs is lower than that of spiral galaxies (e.g. Kawata, Cen & Ho, 2007; Martig et al., 2013; Saintonge et al., 2012; Davis et al., 2014), so if anything the depletion timescale of molecular gas through star formation should be even longer in ETGs. According to the arguments above, the accreted gas observed in local ETGs must therefore be depleted at least times faster than the star-formation consumption timescale. We discuss this puzzling result in more depth in Section 4.
2.3 Accretion timescale
Combining the accreted molecular gas depletion (or survival) timescale with our detection rate (/) yields a simple estimate of the accretion timescale , that is the time interval between successive accretion events: .
The overall molecular gas detection rate of (Young et al., 2011) is an overestimate of the true value, as it includes kinematically-aligned galaxies to which the current argument does not apply. Only kinematically-misaligned gas should be counted. About one-third of all the detected galaxies are kinematically-misaligned, but this is an equally misleading (under)estimate, since we know that accretion does not take place in dense environments (Davis et al., 2011a). Indeed, the detection rate of kinematically-misaligned gas in the Virgo cluster is essentially nil, effectively yielding an infinite gas accretion timescale. The right detection rate to use is therefore that of kinematically-misaligned molecular gas in the field (and low-density environments such as groups). The overall molecular gas detection rate in the field is (Young et al., 2011), and roughly half of this gas is kinematically-misaligned (Davis et al., 2011a), yielding a relevant detection rate of . The molecular gas accretion timescale is therefore
| (3) | |||||
Our estimate therefore suggests that local ETGs in the field accrete molecular gas from an external source at least once every gigayear ( Gyr-1). We discuss this estimate further, and compare it with those of other studies, in Section 4.
Interestingly, the overall detection rate of diffuse ionised gas emission (H and/or [OIII] emission lines) in the ATLAS3D sample is (Sarzi et al., in prep). As Davis et al. (2011a) showed that the ionised and molecular gas are always kinematically-aligned and therefore must share a common origin, we can in principle replace the molecular gas detection rate used in Equation 3 by that for the ionised gas. The ionised gas detection rate for field galaxies in ATLAS3D is , with roughly half kinematically-misaligned, so the relevant detection rate is , roughly times higher than that used above for the molecular gas. This in turn yields an upper limit on the ionised gas accretion timescale for local field ETGs that is times smaller, only yr.
The relation between the gas phases in objects without detectable cold gas is, however, unclear. In many objects the ionised gas is likely in an interface layer (ionised by old stars, AGN or low level star-formation) around a atomic/molecular gas disc that has a low enough mass to fall below our sensitivity limit. This interpretation is supported by the similarity in the misalignment histograms (Figure 1). It is possible that this emission could be more nebulous, however, arising from the envelopes around evolved stars, and thus not be in a disc at all in some objects (in this case, however, the ionised gas emission would have to co-rotate with the stars). Given the above uncertainty the estimates of Tohline, Simonson & Caldwell (1982) and Lake & Norman (1983) may not apply (or, equivalently, the scaling factor may be different), and the ionised gas relaxation time may be much longer than that for molecular gas. This would then yield larger estimates for both and . Given these uncertainties, in the rest of this paper we favour the more reliable molecular gas estimates to put other timescales in context.
3 ACCRETION MODELS
3.1 Toy model
To validate and explore further the simple calculations above, we created a toy model. This model includes in a simple framework the processes of gas accretion, relaxation and depletion. These are characterised by three free parameters, respectively the accretion rate (, the number of gas accretion events per unit time), the relaxation timescale (; in units of ), and the gas depletion time ().
We initialised the model at time with an arbitrary number of gas-free, “red and dead” ETGs. These have realistic luminosities drawn uniformly from a Schechter function representation of the ATLAS3D -band galaxy luminosity function (Cappellari et al., 2011). From this we calculate the maximum circular velocity at which the gas can rotate by assuming the galaxies follow the -band CO Tully-Fisher relation of Davis et al. (2011b). Molecular gas reaches beyond the turnover of the rotation curve in of ATLAS3D ETGs (Davis et al., 2011b, 2013), so this should provide a good estimate of the rotation velocity of the gas at the edges of the gas discs for the bulk of the population.
After each timestep we randomly select galaxies that will accrete gas, such that the average number of mergers per galaxy per unit time is equal to . In this simple model, is independent of galaxy mass and morphology, which may not be true in reality. We discuss this assumption further in Section 4.3.
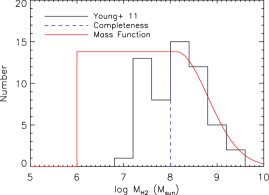
The amount of gas accreted is chosen randomly from the H2 mass function of Young et al. (2011), that was fitted with a Gaussian at the high mass end, and was assumed constant below the completeness limit down to an H2 mass of (see Fig. 2), as predicted from semi-analytic models (e.g. Lagos et al., 2014). Removing the low-mass cutoff does not affect our results. We here assume that after coalescence each one of our mergers results in the creation of a disc of H2 in the centre of the remnant, with a mass that is drawn from the observed distribution. For this simple model, we condense the complex time-dependent processes happening in mergers, and assume that this final state is obtained instantaneously. We discuss these assumption further in Section 4.3.
We determine the radial extent of the gas, and hence the dynamical time at its outer edge, by drawing uniformly from a log-normal fit to the observed distribution of molecular disc radii in Davis et al. (2013).
The angle at which gas is accreted onto galaxies is also chosen uniformly, sampling the full range -. If gas already exists in a galaxy, the interaction between the two reservoirs is roughly included by mass-weighting the resulting position angle of the gas (thus lying between the newly accreted and old material). Our assumption about the exact form of this weighting does not strongly affect our results (see Section 4.3).
The relaxation of the gas is tracked at each timestep. The gas relaxes at a rate that has a cosine dependance on the current misalignment angle (i.e. the rate increases as the disk approaches the galaxy plane, where the torque is higher), following the formalism of Tohline, Simonson & Caldwell (1982). The total time taken to relax is calculated such that the gas disc relaxes into the plane from a misalignment of in a time . We note that adopting a simpler form, where the gas relaxes linearly (i.e. by a full radians in a time ) does not affect the results of this paper. More complex prescriptions for the gas relaxation are beyond the scope of our analysis, but we expect any reasonable form to not unduly alter the results derived from these two cases.
Finally, we destroy a fraction of the molecular gas at each time step. In the first set of simulations discussed below, we choose to include only the effect of star formation on the molecular gas, using up of the gas per dynamical time, equivalent to the standard star-formation law derived from local star-forming galaxies (Kennicutt, 1998). In Section 3.2.3, we also include a very simple model of gas destruction (such as that caused by AGN feedback). An additional free parameter () then sets the duty cycle over which gas is destroyed. All the gas is instantaneously blown out of the model galaxy a time after it has been accreted. Clearly, this highly simple model is not meant to capture in detail the highly complex AGN feedback process, but it at least allows us to explore in a simple manner its effect. Any process that removes gas in one discrete event can be modelled by this formalism.
At the end of each timestep, we are thus left with the observable gas mass and kinematic position angle of each galaxy. We convolve the kinematic misalignment angles with a Gaussian kernel to match the observational errors, and set a limit of to define objects that are detectable, this to match the observations of the ATLAS3D survey (see Fig. 1; Young et al. 2011). Each model presented in Section 3.2 includes simulated galaxies and was run for Gyr, although the misalignment distribution histograms reach a steady state more quickly.
3.2 Model results
3.2.1 Reference model
In Figure 3, we present the misalignment histogram resulting from our reference model, based on our best current understanding of the processes involved. This model uses only the standard star-formation law to deplete the gas, a relaxation time of (as derived from the results of Lake & Norman 1983), and an accretion rate of Gyr-1 (calculated so the detection rate of kinematically-misaligned objects in the model matches the observed rate). This accretion rate is consistent with observations of the (minor and minor+major) merger rate estimated from other methods (see Section 4.1).
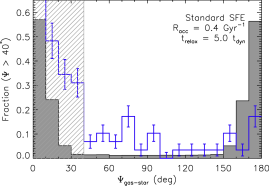
One should not compare the misalignment histogram produced by the model to the data within the shaded region in Figure 3 (), as material produced by internal processes not included in our model (e.g. stellar mass loss) will contribute (and may dominate) here. Outside this region, clear discrepancies are immediately obvious when comparing the reference model histogram to the observed one (Fig. 3). First, almost all model galaxies () lie in the exactly kinematically aligned and misaligned bins (at and , respectively). Second, the bins for kinematically aligned and misaligned gas contain approximately equal numbers of model galaxies. To produce an asymmetric histogram, one therefore clearly requires another process that preferentially produces/preserves gas that is always kinematically aligned with the stars (or, conversely, preferentially removes gas that is kinematically misaligned). The reference model thus highlights graphically the points made in Section 2.2, that the standard relaxation and gas depletion timescales cannot reproduce the observed misalignment histograms. In the sections below, we thus consider possible solutions to this problem.
3.2.2 Quicker gas depletion
As argued in Section 2.2, a faster gas depletion time may be required to understand the observed gas kinematic misalignment histograms. We show in Figure 4 a model where the star-formation efficiency (SFE) has been increased by a factor of (top panel) and (bottom panel) with respect to its standard value. This increase can be used to model any process that removes gas over time, not just star formation. Clearly, an order of magnitude increase in the depletion rate is required, over and above that expected from normal star formation, before the distribution of misalignments in the model can match that of the observations.
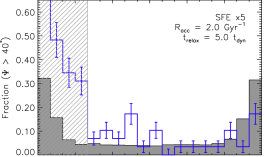
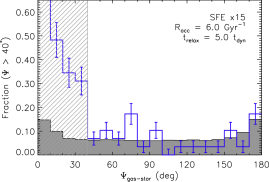
One drawback of this solution is that the accretion rate required to match the observed detection rate is inversely proportional to the gas depletion time, that is shorter depletion times require proportionally more accretion events per unit time to maintain the same detection rate. In these models with increased SFEs, one thus requires a merger rate of Gyr-1 to match the observed detection rate. We discuss this hypothesis further in Section 4.1.
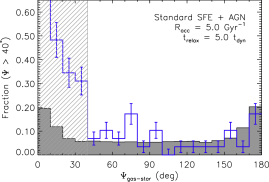
3.2.3 Gas destruction
In Section 2.2, we discussed the need to decrease the survival time of gas in ETGs. One mechanism that has become popular in recent years to quench ETGs is AGN feedback (e.g. Silk & Rees, 1998; Fabian, 2012). In this paradigm, the central black hole injects a significant amount of energy into the ISM, removing or destroying it. As described in Section 3.1, we can include a simple feedback prescription in our model, that blows all of the gas out of the galaxies a time after the gas has been accreted.
We show the result of turning on this simple AGN feedback prescription in Figure 5. We use the same standard SFE and relaxation timescale as the reference model (Section 3.2.1), and additionally set yr. This is at the upper end of the range - yr that has been suggested in the literature for the typical AGN duty cycle (e.g. Soker et al., 2001; Mazzotta et al., 2002; Hopkins et al., 2006). We again adjust the accretion rate to match the observed detection rate of molecular gas. The AGN feedback prescription does lower the fraction of galaxies within the co- and counter-rotating bins sufficiently to match the observed predictions. However, it also requires a very high accretion rate (approximately times higher than required in the reference model) to match the observed CO detection rate of kinematically-misaligned objects.
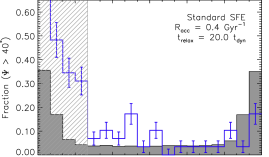
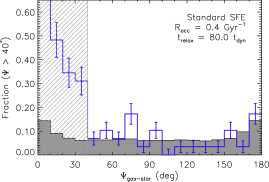
3.2.4 Slower relaxation
An alternative explanation for the large fraction of model galaxies whose gas reservoirs have yet to relax is that this process is slower than usually assumed. Figure 6 shows model runs assuming a standard SFE for depleting the gas and a standard accretion rate of Gyr-1 (so the detection rate in the model matches the observed rate by construction, as in Section 3.2.1). The relaxation time is however increased to and , respectively, in the top and bottom panels. These models show that the relaxation time would have to be much longer than normally assumed (by around an order of magnitude) to reproduce the observed lack of counter-rotating objects. This solution has the benefit that it removes the need for an extremely large accretion rate, but it requires additional processes to slow gas relaxation. We discuss this further in Section 4.2.
4 Discussion
In the sections above, we discussed the distribution of kinematic misalignments between the gas and stars of local ETGs, and the way in which it encodes information about the depletion and accretion timescales of the gas. We showed that the standard gas relaxation and depletion timescales from the literature cannot reproduce the observed misalignment histogram. We discuss below possible solutions to this problem.
4.1 Gas depletion and destruction
In Section 3.2.2, we showed that one can reproduce the observed kinematic misalignment histograms from ATLAS3D by increasing the rate at which gas is consumed. According to this argument, the accreted gas observed in local ETGs would have to be depleted at least times faster than the standard star-formation consumption timescale. Extreme starbursts have been observed to have such small depletion times (e.g. Mihos & Hernquist, 1994), but studies of ETGs (e.g. Saintonge et al., 2012; Martig et al., 2013; Davis et al., 2014) show that their SFE is actually slightly lower than in spiral galaxies (and therefore very much lower than in starburst objects). Fast starbursts thus cannot be invoked to explain the short depletion times required here. Other potential physical mechanisms that could remove gas include dissociation of H2 by X-rays from the ETGs’ hot gas halos, friction and/or shocks against kinematically-aligned gas from stellar mass loss of the bulk (co-rotating) galaxy stellar populations, and AGN feedback. Whatever the depletion mechanism is, it needs to be very rapid.
The depletion timescale of yr we estimated in Section 2.2 is the same as the typical timescale over which central supermassive black holes are active (e.g. Soker et al., 2001; Mazzotta et al., 2002; Hopkins et al., 2006). The energy input from an AGN is observed to be expelling the gas from at least some ETGs (e.g. NGC1266; Alatalo et al. 2011; Davis et al. 2012), hence we tried to include them in our toy models in a simple way (see Section 3.2.3). We then find that a duty cycle of yr is sufficient to bring the model kinematic misalignments in line with the observed data.
The drawback of both fast depletion and/or destruction of gas is that the accretion rate required to match the observed detection rate is inversely proportional to the gas depletion time. With such small gas depletion/destruction timescales, a merger rate of Gyr-1 is required to maintain the detection rate as observed. These timescales can also be used to constrain the likely mechanism(s) supplying the gas. They rule out major mergers (that are too rare), but as the accretion timescale becomes ever smaller, the case for nearly continuous accretion becomes stronger, and accretion of diffuse gas (rather than galaxies) along filaments may need to be considered. However, the large fraction of gas-rich ETGs that are morphologically disturbed in deep imaging (e.g. van Dokkum, 2005; Duc et al., 2015) suggests that stars are also accreted along with the gas, leading to the idea that minor mergers may dominate over cold mode accretion (see e.g. Kaviraj et al., 2009, 2011).
Interestingly, there is evidence of two separate recent minor mergers within such a short time interval in at least one ATLAS3D ETG galaxy, NGC4150. Indeed, Kaviraj et al. (in preparation) have shown that although this galaxy has a young ( yr) counter-rotating stellar core, presumably formed in a gas-rich minor merger, the molecular gas currently present is co-rotating with the bulk of the stars, suggesting an even more recent accretion event.
In the current CDM cosmology, the universe is (primarily) hierarchical in nature, making galaxy mergers an essential aspect of galaxy formation and evolution. The gas-rich merger rate at is thus an interesting quantity to determine from the gas misalignment data, and to compare with that measured from other observations and simulations (e.g. Lacey & Cole, 1993; Maller et al., 2006; Guo & White, 2008; Genel et al., 2009; Lotz et al., 2011; Bluck et al., 2012; Newman et al., 2012; Casteels et al., 2014; Rodriguez-Gomez et al., 2015).
The rate of gas-rich mergers derived here is somewhat higher than previous estimates of the incidence of minor mergers. For instance, Lotz et al. (2011) presented a range of estimates, and compared it extensively with other samples. They estimated a total merger rate of to Gyr-1 with of these mergers being minor (mass ratios of 1:4 to 1:10). Theoretically, studies such as that of Hopkins et al. (2010) find a major+minor merger rate of Gyr-1 for objects of , but predict that this merger rate scales positively with galaxy mass. The more massive galaxies in our sample (with stellar masses above ) are predicted to have merger rates of up to Gyr-1, still below our estimate. To make things worse, the estimates discussed above count all mergers, not only those that are gas rich.
We thus conclude that although accretion rates as fast as those require here may be possible for individual objects, it is unlikely that the average accretion rate in the universe is as high as our models require.
4.2 Slow gas relaxation
Another way to reconcile the observed kinematic misalignments of ETGs with the theoretical predictions is to adopt a relaxation (i.e. torquing) timescale much longer than a few dynamical times. This explanation is appealing, as it does not require high gas accretion rates, but the possible physical processes slowing the relaxation down are currently unconstrained. One possibility is that the accreted misaligned gas simply precesses. This would be possible if the accreted molecular gas were moving purely ballistically, as discrete molecular clouds can do, but it seems unlikely for the complex multi-phase ISM characteristic of galaxies, and especially for the warmer more diffuse ionised gas.
If gas is accreted onto ETGs over long timescales, then the continued addition of misaligned material could slow the relaxation process. This could happen, for instance, if a gas-rich merger throws out long tidal tails of gas, that fall back slowly over time (e.g. Barnes, 2002). Atomic gas tails are observed in a few objects (e.g. Morganti et al., 2006; Serra et al., 2012), but not in the entire population of misaligned ETGs. Low-density tails, or accretion of debris in hotter gas phases, could however be missed. van de Voort et al. (2015) looked at this process in a hydrodynamic simulation of a massive early-type galaxy. They found that continued accretion did indeed slow relaxation, as the angular momentum change induced by accreted gas dominates over that induced by stellar torques. The total time taken for the disc to settle in these simulations was 80-100 , very similar to the timescale we estimate in this work.
Another option is that the hot halos around galaxies have an effect. Lagos et al. (2014, 2015) found that the hot halos around ETGs may be misaligned (either because of mergers or continuous accretion from the cosmic web), and that this could be the cause of the observed kinematic misalignment distribution. These models make various assumptions that still need to be verified through hydrodynamic simulations, and they did not include any relaxation process, but it is clear that continued misaligned cooling could extend relaxation times. In addition, if the hot ISM of ETGs has a net angular momentum and can exert pressure on the relaxing accreted gas, then gas relaxation would not be a symmetric process, which would help explain the observed asymmetric kinematic misalignment distribution. These solutions, however, require the hot halos of galaxies to have significant angular momenta. It will not be possible to observationally verify whether the hot halos of galaxies have any significant rotation, and/or if it correlates with the rotation of the stellar body, until the X-ray satellite ASTRO-H launches (see e.g. Bianconi, Ettori & Nipoti, 2013).
4.3 Model limitations and associated uncertainties
The toy model we present in this paper makes various assumptions, that could potentially affect the results we derive, and are thus discussed below.
We know from previous studies that the gas is not sufficiently extended to reach the flat part of the rotation curve in of ETGs (Davis et al., 2011b, 2013). In these cases our model will overestimate the gas rotation velocity, and thus underestimate the dynamical time, relaxing the gas too quickly. However, this always happens in gas reservoirs with small radial extents, and thus the shortest dynamical times. Even an underestimation of the dynamical time by a factor of two in these objects (the largest difference between the CO velocity and the circular velocity in objects with small gas reservoirs; Davis et al. 2011b) would not help reconcile the reference model and the observations.
The second assumption we make is that , and the amount of gas accreted in each episode, is independent of galaxy mass and morphology. While this may be a reasonable first order approximation, it is known that ETG’s follow a morphology-density relation (e.g. Dressler, 1980), and interactions preferably happen in group scale environments. We minimise the effect of any such bias here by only comparing the model to observed galaxies in field environments. In addition, the typical merger mass-ratio must vary as a function of galaxy mass, which will affect the typical amount of gas brought in by each encounter. However, as the typical gas fraction in observed ETGs does not seem to depend on galaxy mass or environment (Young et al., 2011) it is likely that this second effect is small, and would not change our results significantly.
Our approach assumes that all of the gas brought in by the merger is molecular. We do not model additional Hi gas, that may be brought in by the merger and settle in a larger scale disc (e.g. Serra et al. 2012), and could convert to H2 over longer timescales. If significant radial mass/angular momentum exchange occurs, these larger scale Hi discs could slow relaxation similarly to the atomic gas tidal tails discussed above.
When gas is already present in a galaxy that experiences a new accretion event, we mass weight the misalignment angle of the new and old gas components to determine the resultant kinematic misalignment. In a real gas-rich merger complex processes take place that we are unable to capture in such a simple model, but we do not expect this simplification to have a major effect. Within our model, when this situation occurs the median amount of accreted gas is an order of magnitude larger than the gas already present, and thus the correction typically changes the accreted angle by only a small amount (a median change of ). Ignoring this correction entirely, and instead forcing all the gas to rotate with the newly accreted material does not change our result.
We also assume that the radial extent of the gas in these objects is uncorrelated with its mass (and other galaxy properties). We expect this assumption to not unduly affect our results, as although a strong relation between the gas mass and size of atomic gas discs exists (e.g. Broeils & Rhee, 1997), any such relation for molecular gas is weak (Davis et al., 2013). We do, however, caution that when gas is accreted onto a galaxy with an existing cold gas reservoir the interaction between the two discs could systematically affect the final radial extent of the settled gas disc.
In our simple model the SFE is a free parameter, but it does not depend on galaxy properties. Gas-rich mergers in the real universe seem to have increased SFEs, that result in faster gas depletion. These events are short-lived, however, and observed ETGs are found to have low star-formation efficiencies (e.g. Saintonge et al., 2011; Davis et al., 2014). Evidence also exists that gas minor mergers with early-type galaxies can further suppress the SFE (Davis et al., 2015). We thus do not expect merger induced starbursts to be important in these sources.
Overall the limitations discussed above are mostly expected to be second-order effects. Hydrodynamic simulations simulations are required to confirm this, and they will be the topic of a future work.
5 CONCLUSIONS
In this paper we considered what can be learnt about the processes of gas accretion and depletion from the observed distribution of kinematic misalignment angles between the cold/ionized gas and the stars.
We first presented simple arguments showing that the misalignment distribution encodes information on the relaxation, depletion and accretion timescales of gas in ETGs. Specifically, we argued that the lack of a peak of exactly counter-rotating objects strongly constrains these timescales. Simple calculations, based only on a rough estimate of the relaxation (i.e. torquing) timescale, imply a short gas depletion timescale ( yr) and a high rate of gas-rich mergers ( Gyr-1).
We then presented a toy model of the interplay between these processes, allowing us to better constrain and explore the effects of these timescales on the kinematic misalignment distribution. Realistic distributions of stellar masses and gas radii allow to derive estimates of the relevant timescales for the whole ETG population. We thus confirmed our simple calculations, clearly showing that the standard values for the accretion rate, star formation efficiency and relaxation time are not simultaneously consistent with the observed distribution of kinematic misalignments.
We then explored the effect of varying these parameters. Both faster gas depletion (via e.g. more efficient star formation) and/or faster gas destruction (via e.g. AGN feedback) can be used to explain the kinematic misalignment distribution, but they then require high rates of gas-rich mergers ( Gyr-1). Although some objects have evidence of multiple mergers within such a timescale, as a population accretion rates this high are unlikely.
An alternative explanation, which does not require high accretion rates, is that the misaligned gas relaxation occurs over longer timescales ( or - Gyr) than usually assumed. We suggest that this could come about because of ongoing accretion of tidal debris in mergers, rotating hot gas halos, or continued accretion from the cosmic web.
One way in which these scenarios could be tested would be to determine the age of the accretion event in other ways, such as age dating the most recent burst of star formation (via stellar population modelling), or with the ratio of gas phase metallicity to stellar metallicity. Models with fast relaxation require the misaligned objects to have accreted gas recently (typically within the last Myr, but up to Gyr for exactly counter-rotating gas). Slow relaxation removes such differences, predicting a flat distribution of accretion times as a function of misalignment.
Of course, all of the processes discussed above may take place simultaneously in galaxies and can not easily be separated. Many combinations of the parameters in our models can match the observed misalignment distribution. Further work, both observationally and numerically, is required to properly understand the gas misalignment in ETGs. Such work is also timely, since if we can understand the typical timescale over which misalignments are visible, new large integral-field spectroscopic surveys of galaxies (e.g. the Calar Alto Legacy Integral Field spectroscopy Area survey (CALIFA); García-Benito et al. 2015, the Sydney-AAO Multi-object Integral field spectrograph (SAMI) galaxy survey, Bryant et al. 2015; the Mapping Nearby Galaxies at APO (MaNGA) survey, Bundy et al. 2015) will have the power to investigate these effects as a function of galaxy mass, environment, etc, and thus to accurately constrain the (gas-rich) merger rate in the local universe.
Acknowledgments
We thank the members of the ATLAS3D team for generating the data at the origin of this paper and for constructive discussions. We also thank Sam Geen, Claudia Lagos, Sugata Kaviraj and Freeke van de Voort for useful exchanges. TAD acknowledges support from a Science and Technology Facilities Council Ernest Rutherford Fellowship. MB acknowledges support from STFC rolling grant ‘Astrophysics at Oxford’ PP/E001114/1 and the hospitality of Nagoya University while much of this work was carried out. The research leading to these results has received funding from the European Community’s Seventh Framework Programme (/FP7/2007-2013/) under grant agreement No 229517.
References
- Alatalo et al. (2011) Alatalo K. et al., 2011, ApJ, 735, 88
- Baldry et al. (2004) Baldry I. K., Glazebrook K., Brinkmann J., Ivezić Ž., Lupton R. H., Nichol R. C., Szalay A. S., 2004, The Astrophysical Journal, 600, 681
- Barnes (2002) Barnes J. E., 2002, Monthly Notices of the Royal Astronomical Society, 333, 481
- Bauermeister, Blitz & Ma (2010) Bauermeister A., Blitz L., Ma C.-P., 2010, The Astrophysical Journal, 717, 323
- Bianconi, Ettori & Nipoti (2013) Bianconi M., Ettori S., Nipoti C., 2013, MNRAS, 434, 1565
- Bigiel et al. (2011) Bigiel F. et al., 2011, The Astrophysical Journal Letters, 730, L13
- Birnboim & Dekel (2003) Birnboim Y., Dekel A., 2003, Monthly Notices of the Royal Astronomical Society, 345, 349
- Bluck et al. (2012) Bluck A. F. L., Conselice C. J., Buitrago F., Grützbauch R., Hoyos C., Mortlock A., Bauer A. E., 2012, The Astrophysical Journal, 747, 34
- Bower, Lucey & Ellis (1992) Bower R. G., Lucey J. R., Ellis R. S., 1992, R.A.S. MONTHLY NOTICES V.254, 254, 601
- Broeils & Rhee (1997) Broeils A. H., Rhee M.-H., 1997, A&A, 324, 877
- Bryant et al. (2015) Bryant J. J., Owers M. S., Robotham A. S. G., et al., 2015, MNRAS, 447, 2857
- Bundy et al. (2015) Bundy K., Bershady M. A., Law D. R., et al., 2015, ApJ, 798, 7
- Cappellari et al. (2011) Cappellari M. et al., 2011, Monthly Notices of the Royal Astronomical Society, 413, 813
- Casteels et al. (2014) Casteels K. R. V. et al., 2014, Monthly Notices of the Royal Astronomical Society, 445, 1157
- Combes, Young & Bureau (2007) Combes F., Young L. M., Bureau M., 2007, Monthly Notices of the Royal Astronomical Society, 377, 1795
- Croton et al. (2006) Croton D. J. et al., 2006, Monthly Notices of the Royal Astronomical Society, 365, 11
- Davis et al. (2013) Davis T. A. et al., 2013, Monthly Notices of the Royal Astronomical Society, 429, 534
- Davis et al. (2011a) Davis T. A. et al., 2011a, Monthly Notices of the Royal Astronomical Society, 417, 882
- Davis et al. (2011b) Davis T. A. et al., 2011b, Monthly Notices of the Royal Astronomical Society, 414, 968
- Davis et al. (2012) Davis T. A. et al., 2012, MNRAS, 426, 1574
- Davis et al. (2015) Davis T. A. et al., 2015, MNRAS, 449, 3503
- Davis et al. (2014) Davis T. A. et al., 2014, Monthly Notices of the Royal Astronomical Society, 444, 3427
- Dressler (1980) Dressler A., 1980, ApJ, 236, 351
- Duc et al. (2015) Duc P.-A. et al., 2015, MNRAS, 446, 120
- Fabian (2012) Fabian A. C., 2012, Annual Review of Astronomy and Astrophysics, 50, 455
- García-Benito et al. (2015) García-Benito R. et al., 2015, A&A, 576, A135
- Genel et al. (2009) Genel S., Genzel R., Bouché N., Naab T., Sternberg A., 2009, The Astrophysical Journal, 701, 2002
- Guo & White (2008) Guo Q., White S. D. M., 2008, Monthly Notices of the Royal Astronomical Society, 384, 2
- Hopkins et al. (2010) Hopkins P. F. et al., 2010, ApJ, 715, 202
- Hopkins et al. (2006) Hopkins P. F., Hernquist L., Cox T. J., Di Matteo T., Robertson B., Springel V., 2006, ApJS, 163, 1
- Katkov, Sil’chenko & Afanasiev (2014) Katkov I. Y., Sil’chenko O. K., Afanasiev V. L., 2014, Monthly Notices of the Royal Astronomical Society, 438, 2798
- Kaviraj (2014) Kaviraj S., 2014, Monthly Notices of the Royal Astronomical Society: Letters, 437, L41
- Kaviraj et al. (2009) Kaviraj S., Peirani S., Khochfar S., Silk J., Kay S., 2009, Monthly Notices of the Royal Astronomical Society, 394, 1713
- Kaviraj et al. (2007) Kaviraj S. et al., 2007, The Astrophysical Journal Supplement Series, 173, 619
- Kaviraj et al. (2011) Kaviraj S., Tan K.-M., Ellis R. S., Silk J., 2011, Monthly Notices of the Royal Astronomical Society, 411, 2148
- Kaviraj et al. (2012) Kaviraj S. et al., 2012, Monthly Notices of the Royal Astronomical Society, 423, 49
- Kawata, Cen & Ho (2007) Kawata D., Cen R., Ho L. C., 2007, The Astrophysical Journal, 669, 232
- Kennicutt (1998) Kennicutt R. C., 1998, Astrophysical Journal v.498, 498, 541
- Keres et al. (2005) Keres D., Katz N., Weinberg D. H., Davé R., 2005, Monthly Notices of the Royal Astronomical Society, 363, 2
- Knapp et al. (1989) Knapp G. R., Guhathakurta P., Kim D.-W., Jura M. A., 1989, The Astrophysical Journal Supplement Series, 70, 329
- Krajnović et al. (2011) Krajnović D. et al., 2011, MNRAS, 414, 2923
- Lacey & Cole (1993) Lacey C., Cole S., 1993, Monthly Notices of the Royal Astronomical Society (ISSN 0035-8711), 262, 627
- Lagos et al. (2014) Lagos C. d. P., Davis T. A., Lacey C. G., Zwaan M. A., Baugh C. M., Gonzalez-Perez V., Padilla N. D., 2014, Monthly Notices of the Royal Astronomical Society, 443, 1002
- Lagos et al. (2015) Lagos C. d. P., Padilla N. D., Davis T. A., Lacey C. G., Baugh C. M., Gonzalez-Perez V., Zwaan M. A., Contreras S., 2015, MNRAS, 448, 1271
- Lake & Norman (1983) Lake G., Norman C., 1983, Astrophysical Journal, 270, 51
- Lotz et al. (2011) Lotz J. M., Jonsson P., Cox T. J., Croton D., Primack J. R., Somerville R. S., Stewart K., 2011, The Astrophysical Journal, 742, 103
- Maller et al. (2006) Maller A. H., Katz N., Keres D., Davé R., Weinberg D. H., 2006, The Astrophysical Journal, 647, 763
- Martig et al. (2013) Martig M. et al., 2013, Monthly Notices of the Royal Astronomical Society, 432, 1914
- Mazzotta et al. (2002) Mazzotta P., Kaastra J. S., Paerels F. B., Ferrigno C., Colafrancesco S., Mewe R., Forman W. R., 2002, The Astrophysical Journal, 567, L37
- McDermid et al. (2006) McDermid R. M. et al., 2006, Monthly Notices of the Royal Astronomical Society, 373, 906
- Mendez-Abreu et al. (2008) Mendez-Abreu J., Aguerri J. A. L., Corsini E. M., Simonneau E., 2008, Astronomy and Astrophysics, 478, 353
- Merluzzi (1998) Merluzzi P., 1998, Astronomy and Astrophysics, 338, 807
- Mihos & Hernquist (1994) Mihos J. C., Hernquist L., 1994, ApJL, 431, L9
- Morganti et al. (2006) Morganti R. et al., 2006, Monthly Notices of the Royal Astronomical Society, 371, 157
- Newman et al. (2012) Newman A. B., Ellis R. S., Bundy K., Treu T., 2012, The Astrophysical Journal, 746, 162
- Parriott & Bregman (2008) Parriott J. R., Bregman J. N., 2008, The Astrophysical Journal, 681, 1215
- Parriott & Bregman (2008) Parriott J. R., Bregman J. N., 2008, ApJ, 681, 1215
- Rodriguez-Gomez et al. (2015) Rodriguez-Gomez V. et al., 2015, MNRAS, 449, 49
- Rowlands et al. (2012) Rowlands K. et al., 2012, Monthly Notices of the Royal Astronomical Society, 419, 2545
- Sage & Welch (2006) Sage L. J., Welch G. A., 2006, The Astrophysical Journal, 644, 850
- Saintonge et al. (2011) Saintonge A. et al., 2011, Monthly Notices of the Royal Astronomical Society, 415, 61
- Saintonge et al. (2012) Saintonge A. et al., 2012, The Astrophysical Journal, 758, 73
- Salim & Rich (2010) Salim S., Rich R. M., 2010, The Astrophysical Journal Letters, 714, L290
- Sarzi et al. (2006) Sarzi M. et al., 2006, Monthly Notices of the Royal Astronomical Society, 366, 1151
- Serra et al. (2012) Serra P. et al., 2012, Monthly Notices of the Royal Astronomical Society, 422, 1835
- Shapiro et al. (2010) Shapiro K. L. et al., 2010, Monthly Notices of the Royal Astronomical Society, 402, 2140
- Silk & Rees (1998) Silk J., Rees M. J., 1998, Astronomy and Astrophysics, 331, L1
- Smith et al. (2012) Smith M. W. L. et al., 2012, The Astrophysical Journal, 748, 123
- Soker et al. (2001) Soker N., White R. E. I., David L. P., McNamara B. R., 2001, The Astrophysical Journal, 549, 832
- Temi, Brighenti & Mathews (2009) Temi P., Brighenti F., Mathews W. G., 2009, The Astrophysical Journal, 695, 1
- Thomas et al. (2005) Thomas D., Maraston C., Bender R., Mendes de Oliveira C., 2005, ApJ, 621, 673
- Tohline, Simonson & Caldwell (1982) Tohline J. E., Simonson G. F., Caldwell N., 1982, Astrophysical Journal, 252, 92
- van de Voort et al. (2015) van de Voort F., Davis T. A., Kereš D., Quataert E., Faucher-Giguère C.-A., Hopkins P. F., 2015, MNRAS, 451, 3269
- van Dokkum (2005) van Dokkum P. G., 2005, The Astronomical Journal, 130, 2647
- Welch, Sage & Young (2010) Welch G. A., Sage L. J., Young L. M., 2010, The Astrophysical Journal, 725, 100
- Yi et al. (2005) Yi S. K. et al., 2005, The Astrophysical Journal, 619, L111
- Young et al. (2011) Young L. M. et al., 2011, Monthly Notices of the Royal Astronomical Society, 688
- Young et al. (2014) Young L. M. et al., 2014, Monthly Notices of the Royal Astronomical Society, 444, 3408