Statistical properties of superflares on solar-type stars based on the Kepler 1-min cadence data
Abstract
We searched for superflares on solar-type stars using the Kepler short-cadence (1-min sampling) data in order to detect superflares with short duration. We found 187 superflares on 23 solar-type stars whose bolometric energy ranges from the order of erg to erg. Using these new data combined with the results from the data with 30-min sampling, we found the occurrence frequency () of superflares as a function of flare energy () shows the power-law distribution () with for erg. The upper limit of energy released by superflares is basically comparable to a fraction of the magnetic energy stored near starspots which is estimated from the amplitude of brightness variations. We also found that the duration of superflares () increases with the flare energy () as . This can be explained if we assume the time-scale of flares is determined by the Alfvn time.
keywords:
stars:activity, stars:flare, stars:solar-type1 Introduction
Solar-flares are energetic eruption in the solar atmosphere caused by the magnetic reconnection (e.g. [Shibata & Magara (2011), Shibata & Magara 2011]). The occurrence frequency of solar-flares () as a function of flare energy () can be fitted by a simple power-law function () with - in the flare energy range between erg and erg (e.g. [Aschwanden et al. (2000), Shimizu (1995), Crosby et al. (1993), Crosby et al. 1993, Shimizu 1995, Aschwanden et al. 2000]). The bolometric energy released by an X10 class solar flare is estimated to be the order of erg ([Emslie et al. (2012), Emslie et al. 2012]) and the occurrence frequency of such flare is about once in 10 years. In the case of other stars, including solar-type stars, more energetic flares called “superflares” have been observed (e.g. [Landini et al. (1986), Schaefer (1989), Schaefer et al. (2000), Landini et al. 1986, Schaefer 1989, Schaefer et al. 2000]). Recently, many superflares on solar-type stars (G-type main sequence stars) have been discovered by the Kepler space telescope (e.g. [Maehara et al. (2012), Shibayama et al. (2013), Maehara et al. 2012, Shibayama et al. 2013]). The bolometric energy released by the superflare ranges from to erg which is - times larger than that of the largest solar flares ( erg). Majority of solar-type stars exhibiting superflares show quasi-periodic brightness variations with amplitude range from % to %. These light variations are thought to be caused by the rotation of the star with starspots (e.g. [Notsu et al. (2013), Notsu et al. 2013]). Although most of solar-type stars with superflares are rapidly rotating stars, the temperature and rotation velocity of some superflare stars are close to those of the Sun ([Nogami et al. (2014), Nogami et al. 2014]).
Previous studies of superflares on solar-type stars using the Kepler long-cadence data mainly focus on superflares with extremely large energy ( erg) and long duration ( hour). Here we report the results from the data with high time-resolution ( min) and discuss the statistical properties (e.g. occurrence frequency, flare duration) of superflares on solar-type stars. More details are described in [Maehara et al. (2015)].
2 Data
We searched for flares from the short-cadence data ( min interval) observed with the Kepler space telescope between 2009 April (quarter 0: Q0) and 2013 May (Q17) ([Koch et al. (2010), Gilliland et al. (2010), Koch et al. 2010, Gilliland et al. 2010]). We selected solar-type (G-type main sequence) stars from the data set by using the surface temperature of the star () and the surface gravity () taken from [Huber et al. (2014)] instead of those from [Brown et al. (2011)] (initial Kepler Input Catalog). In previous papers ([Maehara et al. (2012), Shibayama et al. (2013), Maehara et al. 2012, Shibayama et al. 2013]), we used stellar parameters taken from [Brown et al. (2011)] and the selection criteria of K and . However the temperatures in [Brown et al. (2011)] are systematically lower by K than those in [Huber et al. (2014)]. In order to reduce the difference in statistical properties of superflares caused by the systematic difference in stellar temperature, here we used the selection criteria of and . The total number of solar-type stars observed with short-cadence mode is 1547.
We used the Presearch Data Conditioned (PDC) light curve ([Stumpe et al. (2012), Smith et al. (2012), Stumpe et al. 2012, Smith et al. 2012]) for the detection of flares. The detail procedures of the flare detection are described in [Maehara et al. (2015)]. Bolometric energy released by each flare was estimated from the flare amplitude, flare duration, and stellar luminosity with the same manner as [Shibayama et al. (2013)]. The stellar luminosity were calculated from the effective temperature and the stellar radius taken from [Huber et al. (2014)]. We estimated periods of long-term light variations from light curves of each star by using the discrete Fourier transform (DFT) method. For period analysis, we used the long-cadence data (time resolution of 30 min) obtained from 2009 September (Q2) to 2013 April (Q16). These periods are basically consistent with those in [McQuillan et al. (2014)].
3 Results and discussion
We detected 187 flares on 23 solar-type stars from the data of 1547 solar-type stars. Figure 1 shows typical light curves of superflares detected from short-cadence data. The amplitude of flares normalized by the average brightness of the star range from to and the bolometric energies of flares range from to erg.

3.1 Occurrence frequency distribution
Figure 2 (a) represents the occurrence frequency of superflares () as a function of the bolometric energy of superflares (). Solid histogram in figure 2 (a) represents the frequency distribution of superflares on all solar-type stars derived from short-cadence data and dashed histogram represents that from long-cadence data ([Shibayama et al. (2013), Shibayama et al. 2013]). Since the period distribution of the stars observed in short-cadence mode is biased to the shorter-period end, we estimate the corrected occurrence frequency for short-cadence data taking into account the bias in the period distribution of the observed samples. Both frequency distributions from short- and long-cadence data are almost the same for the flare energy between erg and erg and can be fitted by a power-law function (). Using the combined data set from both short- and long-cadence data, the power-law index is for the flare energy of - erg.
According to [Shibata et al. (2013)], the frequency distribution of superflares on Sun-like stars (early-G dwarfs with day) and those of solar flares are roughly on the same power-law line. Figure 2 (b) represents the comparison between the frequency distribution of superflares on Sun-like stars ( and day) derived from both short- (filled circles) and long-cadence (solid line) data and those of solar flares (dashed lines). The thin dotted line indicates the power-law function () with an index taken from [Shibata et al. (2013)].

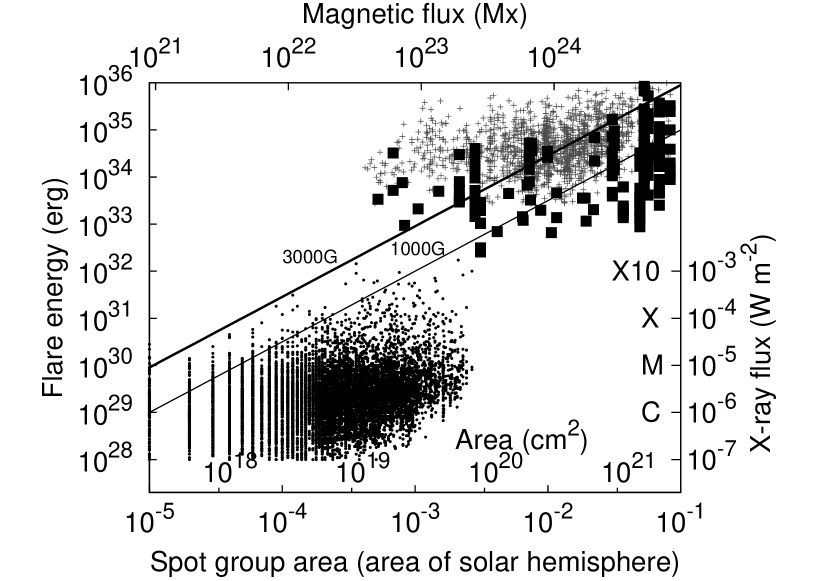
3.2 Flare energy and area of starspots
Majority of solar-type stars exhibiting superflares show quasi-periodic light variations with the amplitude of the order of 1 %. These variations are thought to be caused by the rotation of star with spotted surface and the amplitude of light variations corresponds to the area of starspots. Figure 4 shows the scatter plot of the energy of solar flares and superflares as a function of the area of sunspot/starspot group (). The area of starspots on superflare stars were estimated from the amplitude of light variations.Since the flares are a result of a sudden conversion of magnetic energy to thermal and kinetic energy, the bolometric energy released by the flare should be a fraction of the magnetic energy () ([Shibata et al. (2013), Notsu et al. (2013), (Shibata et al. 2013, Notsu et al. 2013)]). The energy released by a flare can be written as the following form:
| (1) |
where , and correspond to the fraction of magnetic energy released by the flare, the magnetic field strength of the starspots and the scale length of the starspot group respectively. The equation (1) suggests that the flare energy is roughly proportional to the area of the starspot group to the power of 3/2. According to [Aschwanden et al. (2014)]), . The typical sunspot area for generating X10-class flares ( erg) observed in 1989-1997 was of the half area of the solar surface ([Sammis et al. (2000), Sammis et al. 2000]), and the typical magnetic field strength of sunspot is the order of G (e.g. [Antia et al. (2003), Antia et al. 2003]). Therefore equation (1) can be written as
| (2) |
Solid and dashed lines in the figure 4 represent equation 2 for , G and , G respectively. Majority of superflares detected from short-cadence data (filled-squares) and almost all solar flares (small dots) are below these analytic lines. This suggests that the upper limit of the energy released by the flare is basically comparable to the stored magnetic energy estimated from the area of starspots. However there are some superflares above the analytic relation. These superflares would occur on the stars with low-inclination angle or stars with starspots around polar region. In the case of such stars, the light variation caused by the rotation become small. Hence the the actual area of starspots should be larger than that estimated from the amplitude of brightness variation. According to [Notsu et al. (2015)], some superflare stars which show superflares with energy larger than that expected from the amplitude of light variation were confirmed to have low-inclination angles. Moreover polar spots are often observed on rapidly-rotating late-type stars (e.g. [Strassmeier (2009), Strassmeier 2009]).
3.3 Correlation between flare duration and flare energy
Figure 4 represents the duration (-folding decay time) of superflares as a function of the energy of flares. A linear fit for the superflares from short-cadence data in the - plot yields
| (3) |
where and indicate the duration and energy of superflares. Similar correlation between the flare duration and energy was observed in solar flares (e.g. [Veronig et al. (2002), Christe et al. (2008), Veronig et al. 2002, Christe et al. 2008]). The flare energy is related to the magnetic energy stored near the starspots as shown in equation 1. On the other hand, the duration of impulsive phase of flares is comparable to the reconnection time () which can be written as
| (4) |
where is the Alfvn time, is the Alfvn velocity, and is the non-dimensional reconnection rate (- for the fast reconnection; [Shibata & Magara (2011), Shibata & Magara 2011]). If we assume and are not so different among solar-type stars, the duration of flares can be written as
| (5) |
This suggests that the power-law slope for the correlation between the flare duration and flare energy is about which is comparable to the observed value of .

4 Conclusions
We found 187 superflares on 23 solar-type stars from the Kepler 1-min cadence data. This new data set of superflares on solar-type stars suggests that the power-law frequency distribution of superflares (e.g. [Maehara et al. (2012), Shibayama et al. (2013), Maehara et al. 2012, Shibayama et al. 2013]) continues to the flare energy of erg. We also found the flare duration increases with the flare energy as . This suggests that the time-scale of flares is determined by the Alfvn time.
References
- [Antia et al. (2003)] Antia, H. M., Bhatnagar, A., & Ulmschneider, P. 2003, Lectures on Solar Physics (Berlin: Springer Verlag) p. 133
- [Aschwanden et al. (2000)] Aschwanden, M. J., Tarbell, T. D., Nightingale, R. W., et al. 2000, ApJ, 535, 1047
- [Aschwanden et al. (2014)] Aschwanden, M. J., Xu, Y., & Jing, J. 2014, ApJ, 797, 50
- [Brown et al. (2011)] Brown, T. M., Latham, D. W., Everett, M. E., & Esquerdo, G. A. 2011, ApJ, 142, 112
- [Christe et al. (2008)] Christe, S., Hannah, I. G., Krucker, S., et al. 2008, ApJ, 677, 1385
- [Crosby et al. (1993)] Crosby, N. B., Aschwanden, M. J., & Dennis, B. R. 1993, Solar Phys., 143, 275
- [Emslie et al. (2012)] Emslie, A. G., Dennis, B. R., Shih, A. Y., et al. 2012, ApJ, 759, 71
- [Gilliland et al. (2010)] Gilliland, R. L., Jenkins, J. M., Borucki, W. J., et al. 2010, ApJ (Letters), 713, L160
- [Huber et al. (2014)] Huber, D., Silva Aguirre, V., Matthews, J. M., et al. 2014, ApJS, 211, 2
- [Koch et al. (2010)] Koch, D. G., Borucki, W. J., Basri, G., et al. 2010, ApJ (Letters) 713, L79
- [Landini et al. (1986)] Landini, M., Monsignori Fossi, B. C., Pallavicini, R., & Piro, L. 1986, A&A, 157, 217
- [Maehara et al. (2012)] Maehara, H., Shibayama, T., Notsu, S., et al. 2012, Nature, 485, 478
- [Maehara et al. (2015)] Maehara, H., Shibayama, T., Notsu, Y., et al. 2015, Earth, Planet and Space, 67, 59
- [McQuillan et al. (2014)] McQuillan, A., Mazeh, T., & Aigrain, S. 2014, ApJS, 211, 24
- [Nogami et al. (2014)] Nogami, D., Notsu, Y., Honda, S., et al. 2014, PASJ, 66, L4
- [Notsu et al. (2013)] Notsu, Y., Shibayama, T., Maehara, H., et al. 2013, ApJ, 771, 127
- [Notsu et al. (2015)] Notsu, Y., Honda, S., Maehara, H., et al. 2015, PASJ, 67, 33
- [Sammis et al. (2000)] Sammis, I., Tang, F., & Zirin, H. 2000, ApJ, 540, 583
- [Schaefer (1989)] Schaefer, B. E. 1989, ApJ, 337, 927
- [Schaefer et al. (2000)] Schaefer, B. E., King, J. R., & Deliyannis, C. P. 2000, ApJ, 529, 1026
- [Shibata & Magara (2011)] Shibata, K., & Magara, T. 2011, Living Reviews in Solar Physics, 8, 6
- [Shibata et al. (2013)] Shibata, K., Isobe, H., Hillier, A., et al. 2013, PASJ, 65, 49
- [Shibayama et al. (2013)] Shibayama, T., Maehara, H., Notsu, S., et al. 2013, ApJS, 209, 5
- [Shimizu (1995)] Shimizu, T. 1995, PASJ, 47, 251
- [Smith et al. (2012)] Smith, J. C., Stumpe, M. C., Van Cleve, J. E., et al. 2012, PASP, 124, 1000
- [Strassmeier (2009)] Strassmeier, K. G. 2009, A&AR, 17, 251
- [Stumpe et al. (2012)] Stumpe, M. C., Smith, J. C., Van Cleve, J. E., et al. 2012, PASP, 124, 985
- [Veronig et al. (2002)] Veronig, A., Temmer, M., Hanslmeier, A., et al. 2002, A&A 382, 1070