January 4, 2015
Measurement of Electron Neutrino Charged-Current Inclusive Cross Section in 13 GeV energy region with the NOA Near Detector
Abstract
We present a measurement of the electron neutrino charged-current inclusive cross section per nucleon with a data sample corresponding to protons-on-target collected by NOA near detector at Fermilab. We measured the cross section in four energy bins from 1 GeV to 3 GeV with half GeV per bin.
1 Introduction
As summarized in Ref. [1], there are few cross section measurements. LSND provided a measurement in the low energy region up to 55 MeV [2]. The first measurement at GeV scale was from the Gargamelle experiment [3] based on 200 selected data events. The T2K experiment measured the cross section at neutrino energy GeV [4] using 315 selected data events. Most recently, MINERvA has published a result using approximately 2100 candidate events in the range (0.5-10 GeV) with average purity of 50% [5].
NOA [6] is a long baseline neutrino experiment with two functionally equivalent detectors, to study neutrino oscillations, neutrino interaction cross sections, and new phenomena searches. NOA detectors are low-Z and highly active tracking calorimeters, designed to efficiently identify interactions. The NOA near detector is located approximately 14.6 mrad off the axis of the NuMI neutrino beam [7], with a flux covering a broad range of energies. In this proceeding, we present the measurement of electron neutrino charged-current inclusive cross section per nucleon in bins of neutrino energy from 1 GeV to 3 GeV, using data corresponding to protons-on-target collected by NOA near detector between November 2014 and June 2015.
2 The NOA near detector
NOA near detector (ND) is located about 100 m underground at Fermilab, and 1 km from the source of NuMI neutrino beam. That beam is produced from the decay of charged pions and kaons generated by 120 GeV proton collisions on a graphite target. The ND is positioned at an angle of 14.6 mrad relative to the beam axis direction and composed of 214 layers of cells of extruded PVC [8], with 3.9 cm 6.6 cm in area and 4 m in length. There is a muon catcher, located at the end of the fully active detector, composed by 22 layers of PVC cells and 10 layers steel plates with 10 cm thickness, where each steel plate is put in between two layers of PVC cells. The muon catcher is the height of the fully active detector. Each PVC cell contains single looped wavelength-shifting fiber and is filled with liquid scintillator pseudocumene [9], where the scintillation light is transported to one pixel of a 32-pixel Hamamatsu avalanche photodiode. These planes of PVC cells are layered in orthogonal views to allow for 3-dimensional reconstruction of neutrino interactions. Overall, NOA ND consists of 20k readout channels, and weights 300 ton.
In this analysis, only fully active detector is used, which has a total mass of 190 ton. In the fiducial region of the detector, the liquid scintillator comprises 63% of the detector mass. The ND is dominated by Carbon, Chlorine, and Hydrogen (see Table 1). The total number of nucleons in the fiducial region is .
| C12 | Cl35 | H1 | Ti48 | O16 | others |
| 66.8% | 16.4% | 10.5% | 3.3% | 2.6% | 0.4% |
3 Simulation and Calibration
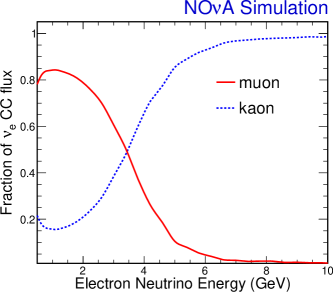
The neutrino beam flux is simulated using the fluka [10], interfaced with a geant4 [11] geometry with flugg [12] to model the interactions of protons with the target. The neutrino beam is dominated by with a 2% intrinsic beam component. These intrinsic beam dominantly come from the decay of produced by pions’ decay and from charged and neutral kaons. The from muon decays contribute most in low energy region ( GeV), while above that energy the comes primarily from kaon decays. The fraction of contribution to flux as a function of energy is shown in Fig. 1.
The neutrino interactions inside and outside the detector are simulated using genie [13], and geant is used to track the resulting particles and corresponding energy depositions. Experiment-specific simulations [14] are used to model the capture of the scintillation photons in the wavelength-shifting fibers and the response of the readout electronics.
Cosmic ray muons are used as standard candles to calibrate the detector response. In addition, the energy spectrum of Michel electrons and the mass peak, as well as the muons from neutrino interactions in near detector are used as the cross-checks. The detector response is simulated well; all results agree within 5%.
4 Reconstruction and event selection
The calibrated cell hits are grouped together to form the basic reconstructed clusters based on the time and space to construct the neutrino candidates [15, 16]. Each basic cluster corresponds to one neutrino interaction. Within these basic clusters, the particle paths are found, and the corresponding interactions of these paths are used as seeds to find the neutrino vertex. Furthermore, this event vertex is used as seed to form electromagnetic showers using the Fuzzy-clustering algorithm [17, 18].
The CC candidates are selected by requiring the most energetic EM shower (primary shower) to be contained, with energy less than 3.5 GeV. In addition, the shower length is required to be greater than 150 cm but less than 500 cm, and the fraction of MIP hits to be less than 35%. A likelihood-based selector is required to be greater than 0.2, which was developed using an artificial neural network by combining the likelihood differences of longitudinal and transverse shower energy deposition among different particle hypotheses, and other topological variables.
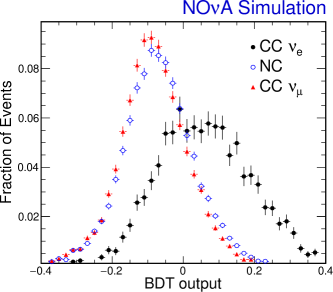
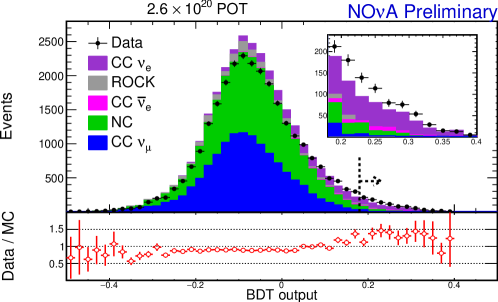
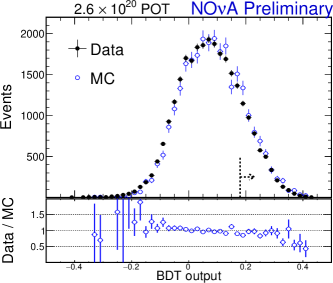
To reduce background further, a Boosted Decision Trees (BDT) [19] discriminant is defined, combining the fraction of MIP hits in the second most energetic shower, the fraction of energy in transverse road around the primary shower core by 4 cm, the maximal fraction of energy in 6-continuous planes along beam direction, the fraction of energy in first 10 planes, and the fraction of energy in secondary, third, and fourth plane of primary shower. The shapes of BDT output, normalized to unity area and obtained after all event selection criteria, are shown in Fig. 2, exhibiting a significant discrimination between CC signal, and and NC backgrounds. The BDT output distributions for the data, signal, and backgrounds (see Section 5) are shown in Fig. 3, the BDT output 0.18 is used in this analysis to extract the cross section. After imposing all selection requirements, 917 CC candidates are selected in data, with an expected purity of 65%.
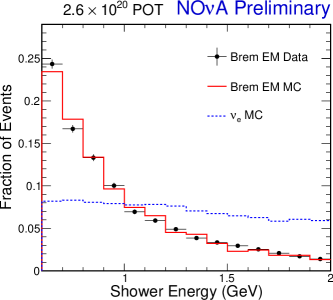
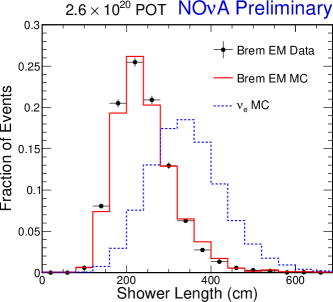
To validate the performance of EM shower reconstruction and the BDT discriminant, we select the electromagnetic showers from muon bremsstrahlung in data. While most muons produced in neutrino interactions and traversing the detector usually leave a long, isolated track, some produce bremsstrahlung electromagnetic showers. We select those events, remove the muon activity based on the energy deposition of MIP hits, and reconstruct the electromagnetic showers from the remaining activity. The shapes of the shower energy and length, normalized to unity area, for electromagnetic showers from muon bremsstrahlung in data and monte carlo simulation (MC), and CC signal are shown in Fig. 4. There is good agreement between data and MC, and these bremsstrahlung EM showers cover similar kinematic regions as the EM showers from the CC signal. The BDT discriminant distributions for those bremsstrahlung electromagnetic showers are shown in Fig. 5, showing good agreement between data and MC.
5 Background subtraction
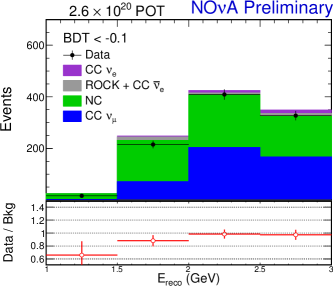
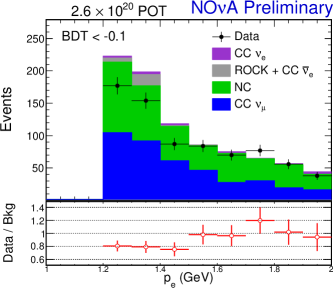
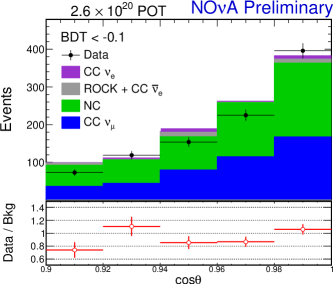
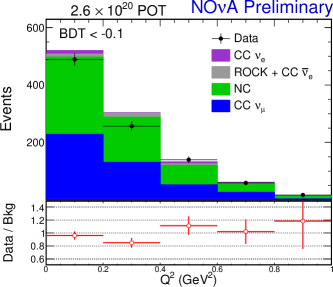
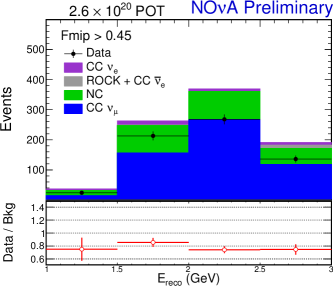
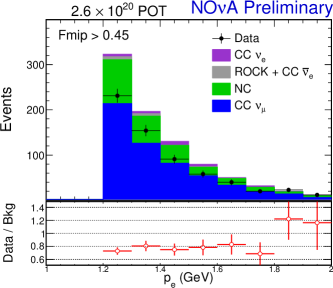
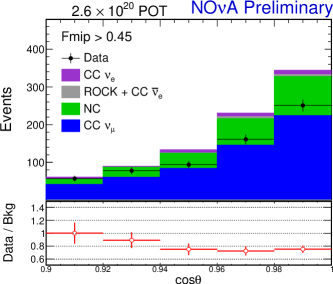
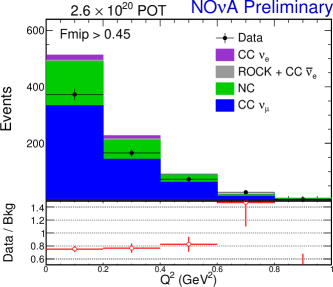
The CC (including CC), NC, and CC are the dominant backgrounds. We explicitly treat the neutrino interactions outside the detector as the rock background, which is dominated by CC events. These backgrounds are estimated from genie MC, and we derive the normalization factors from background dominant sideband samples to eliminate the uncertainties from flux and genie cross section modelings. Two sideband samples are selected by either reversing the fraction of MIP cut on the primary shower, or in the low BDT output region. To select the events in the similar kinematic regions as the backgrounds in the signal region, we further require the primary shower momentum to be greater than 1.2 GeV and cos of primary shower to be greater than 0.9. The sideband sample in the low BDT output region is used as the main sideband sample, as it has similar ratio between NC and CC backgrounds as in the signal region. The distributions for the reconstructed energy, primary shower momentum, primary shower scattering angle respect to beam direction, and invariant 4-momentum transfer squared for the two sideband samples are shown in Figs. 6 and 7. There is a clear normalization deficit between data and sum of the backgrounds. Conservatively, we use 0.95 0.2 as the background normalization factor to cover the bin by bin variation derived from the main sideband sample with low BDT output, while also covering the difference between the two sideband samples.
6 Systematics
The dominant sources of systematic uncertainties are from flux prediction, background normalization, hadronic energy, and event selection efficiency. There are two dominant uncertainties for flux prediction: one is from the beam transport due to the horn current, beam spot size, and magnetic field; the other is from the hadron production. We use the external data results, including the pion and kaon production cross section measurements from NA49 experiment [20, 21], the kaon and pion ratio using thin target from MIPP experiment [22], and the recent pion yield measurements based on thick target from MIPP experiment[23]. Based on these external constrains, we reduce our flux by 58% from 1 GeV to 3 GeV energy region, and corresponding uncertainty is 10%. There is 21% shape discrepancy for hadron energy between data and MC, measured from disappearance analysis. To take into account that discrepancy, we shift the hadron energy for CC signal by 21% event by event and the observed 610% change on neutrino energy is used as the systematic uncertainty. We cross-checked with selected CC candidates in sideband samples, and confirmed the used 21% shift is large enough to cover the existed discrepancy for hadron energy between data and MC. Our event selection requirements including the BDT discriminant are dominantly based on the primary shower to be as model independent as possible. The event selection efficiency is measured using genie CC events. The shower selection is studied using the bremsstrahlung showers in data and MC, 5% uncertainty is obtained by comparing the selection efficiency as a function of shower energy. There is 5% genie cross section uncertainty, dominantly from CC Quasi-Elastic normalization. The detector modeling effects have also been studied by using different geant4 physics lists, QGSP, QGSC, FTFP, which is found to be negligible.
The statistical and systematic uncertainties for each energy bin are summarized in Table 2. There is 20% systematic uncertainty across energy region, and we are already dominated by systematic uncertainty.
| Energy (GeV) | Statistical Uncertainty (%) | Systematic Uncertainty (%) |
|---|---|---|
| 1 1.5 | 22.6 | 22.4 |
| 1.5 2 | 11.8 | 20.4 |
| 2 2.5 | 10.3 | 21.5 |
| 2.5 3 | 6.8 | 18.7 |
7 Results
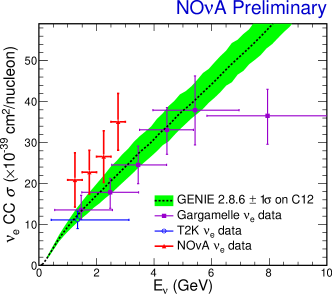
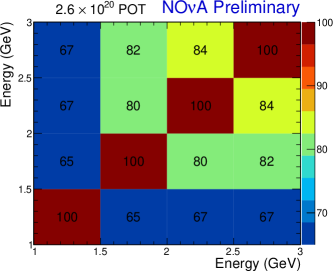
The measured CC inclusive cross section per nucleon in 4 energy bins from 1 GeV to 3 GeV are shown in Fig. 8. The uncertainties are highly correlated between the 4 energy bins (see Fig. 9). The genie prediction for on carbon only is also shown.
References
- [1] J.A. Formaggio, G.P. Zeller,“From eV to EeV: Neutrino Cross Sections Across Energy Scales”, Rev. Mod. Phys. 84, 1307 (2012).
- [2] LSND Experiment, Phys. Rev. C 64, 065501 (2001).
- [3] Gargamelle Experiment, Nucl. Phys. B 133, 205 (1978).
- [4] T2K Experiment, Phys. Rev. Lett. 113, 241803 (2014).
- [5] MINERvA Experiment, arXiv:1509.05729 [hep-ex].
- [6] NOA Technical Design Report, http://www-nova.fnal.gov/nova_cd2_review/tdr_oct_23/tdr.htm
- [7] P. Adamson et al., Nucl. Instrum. Meth. A 806, 279 (2016).
- [8] S. Magill, J. Phys.: Conf. Ser. 404, 012035 (2012).
- [9] S. Mufson et al., Nucl. Instrum. Meth. A 799, 1 (2015).
-
[10]
T. Bohlen et al., Nucl. Data Sheets 120 (2014).
A. Ferrari et al., Tech. Rep. CERN-2005-010 (2005).
Version 2011 is used. -
[11]
S. Agostinelli et al., Nucl. Inst. Meth. A 506 (2003).
J. Allison et al., IEEE Trans. Nucl. Sci. 53 (2006).
Version 4.9.6 is used. -
[12]
M. Campanella et al., Tech. Rep. CERN-ATL-SOFT-99-004 (1999).
Version 2009 is used. -
[13]
C. Andreopoulos et al., Nucl. Inst. Meth. A 614 (2010).
Version 2.8.6 is used. - [14] A. Aurisano et al., J. Phys.: Conf. Ser., (2015).
- [15] M. Ester et al., Proceedings of 2nd International Conference on Knowledge Discovery and Data Mining (1996).
- [16] M. Baird, Ph.D. Thesis, Indiana University (2015).
- [17] J.C. Bezdek, Pattern Recognition with Fuzzy Objective Function Algo- rithms, Plenum Press, New York, 1981.
- [18] E. Niner, Ph.D. Thesis, Indiana University (2015).
- [19] A. Hoecker, et al., CERN-OPEN-2007-007 (2007).
- [20] NA49 Experiment, Eur. Phys. J. C 49 (2007).
- [21] G. Tinti, Ph.D. Thesis, St. Cross College (2010).
- [22] A. Lebedev, Ph.D. Thesis, Harvard University (2007).
- [23] MIPP Experiment, Phys. Rev. D 90, 032001 (2014).