22email: [guilloteau,difolco,dutrey]@obs.u-bordeaux1.fr 33institutetext: IRAM, 300 rue de la piscine, F-38406 Saint Martin d’Hères, France 44institutetext: Max Planck Institute für Astronomie, Königstuhl 17, D-69117 Heidelberg, Germany 55institutetext: Observatoire Astronomique de Strasbourg, Université de Strasbourg, CNRS, UMR 7550, 11 rue de l’Université, 67000 Strasbourg, France
The shadow of the Flying Saucer:
A very low temperature for large dust grains.
Abstract
Context. Dust determines the temperature structure of protoplanetary disks, however, dust temperature determinations almost invariably rely on a complex modeling of the Spectral Energy Distribution.
Aims. We attempt a direct determination of the temperature of large grains emitting at mm wavelengths.
Methods. We observe the edge-on dust disk of the Flying Saucer, which appears in silhouette against the CO J=2-1 emission from a background molecular cloud in Oph. The combination of velocity gradients due to the Keplerian rotation of the disk and intensity variations in the CO background as a function of velocity allows us to directly measure the dust temperature. The dust opacity can then be derived from the emitted continuum radiation.
Results. The dust disk absorbs the radiation from the CO clouds at several velocities. We derive very low dust temperatures, 5 to 7 K at radii around 100 au, which is much lower than most model predictions. The dust optical depth is at 230 GHz, and the scale height at 100 au is at least 8 au (best fit 13 au). However, the dust disk is very flat (flaring index -0.35), which is indicative of dust settling in the outer parts.
Key Words.:
Stars: circumstellar matter – planetary systems: protoplanetary disks – individual: – Radio-lines: stars1 Introduction
Although dust is the main agent to control the protoplanetary disk temperature (Chiang & Goldreich 1997), our knowledge of dust temperatures essentially relies on modeling of disk images and SED (e.g., D’Alessio et al. 2001). Despite (or even because of) their sophistication, these models suffer from many uncertainties because of the large number of assumed properties: radial distribution, dust grain growth, dust settling, composition and porosity, disk flaring geometry, etc. The model temperatures are mostly constrained by the near-IR part of the SED, which comes from the optically thick region within 10 au from the star, and dust temperatures in the disk midplane only rely on the strong extrapolation that the model provides radially and vertically. Gas temperatures can provide a proxy for the dust temperature, but because molecules become heavily depleted on grains at (dust) temperatures below 15 K, this method only samples the lukewarm region 1 to 2 scale heights above the disk plane.
We present a completely different method for a direct measurement of the dust temperature. The method relies on seeing a disk in silhouette against a bright background. Edge-on disks are the best targets for this because their larger line-of-sight opacity maximizes the expected signal.
The Flying Saucer (2MASS J16281370-2431391) is an isolated, edge-on disk in the outskirts of the Oph clouds (Grosso et al. 2003) with evidence for large dust grains (Pontoppidan et al. 2007). Grosso et al. (2003) resolved the light scattered by (micron) dust grains in near-infrared with the NTT and the VLT and estimated a disk radius of , which is about 260 au for the adopted distance of 120 pc (Loinard et al. 2008). The detection of the CN N=2-1 line (Reboussin et al. 2015) confirms the existence of a large gas disk. The Oph region is crowded with molecular clouds that are brightly emitting in CO lines. However, the low extinction derived by Grosso et al. (2003) toward the Flying Saucer suggests it lies in front of these clouds, providing an ideal geometry for our purpose. We thus observed the Flying Saucer at high angular resolution in CO J=2-1 with the Atacama Large Millimeter Array (ALMA) and the molecular clouds with the IRAM 30-m telescope.
2 Observations
IRAM 30-m
We obtained a CO J=2-1 spectrum of the Flying Saucer with the IRAM 30-m to measure the brightness of the (foreground or background) emission. Pointing was performed on Saturn, which was a few degrees above the Flying Saucer at the time of the observations. The weather was relatively windy, which combined with the low declination of the Flying Saucer, resulted in some anomalous refraction on angular scales of a few arcsec.
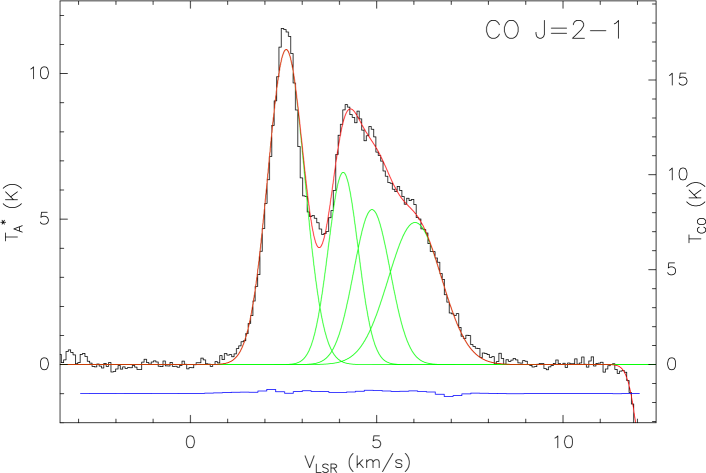
At 230 GHz, the beamsize is and the beam efficiency is while the forward efficiency is . The conversion from to Jy is thus 7.6 Jy/K. The pointing issues mentioned above broaden the effective beamsize, but should not significantly affect the conversion from the antenna temperature scale to sky brightness temperature because we are interested in sources extended compared to the 30-m beam size. We first performed an on-off measurement, using a reference position at , in a region of low emission selected with the FCRAO CO J=1-0 wide field survey (111COMPLETE team, 2011, FCRAO Ophiuchus 12CO cubes and map, http://hdl.handle.net/10904/10078, Harvard Dataverse, V2). The reference position was observed in frequency switching and the spectrum was added back to the on-off result, providing excellent agreement with a frequency switch spectrum on the Flying Saucer. The final 30-m spectrum (Fig.1) can be decomposed in four Gaussian profiles of typical line width around
ALMA
The high angular resolution observations of CO J=2-1 were performed with ALMA on 17 and 18 May 2015 under excellent weather (Cycle 2, 2013.1.00387.S). The correlator was configured to deliver very high spectral resolution with a channel spacing of 15 kHz (and an effective velocity resolution of 40 m/s). Data was calibrated via the standard ALMA calibration script in the CASA software package. Titan was used as a flux calibrator. The calibrated data was regridded in velocity to the LSR frame and exported through UVFITS format to the GILDAS package for imaging and data analysis. No self-calibration was performed. With robust weighting, the coverage provided by the antennas yields a circular beamsize of 0.5′′.
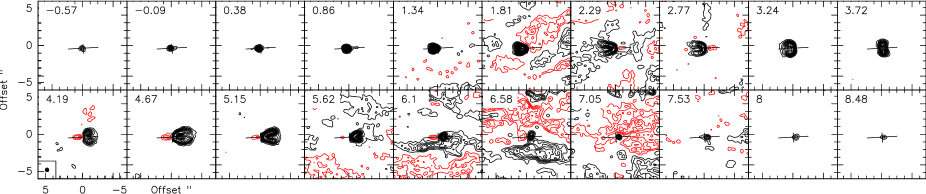
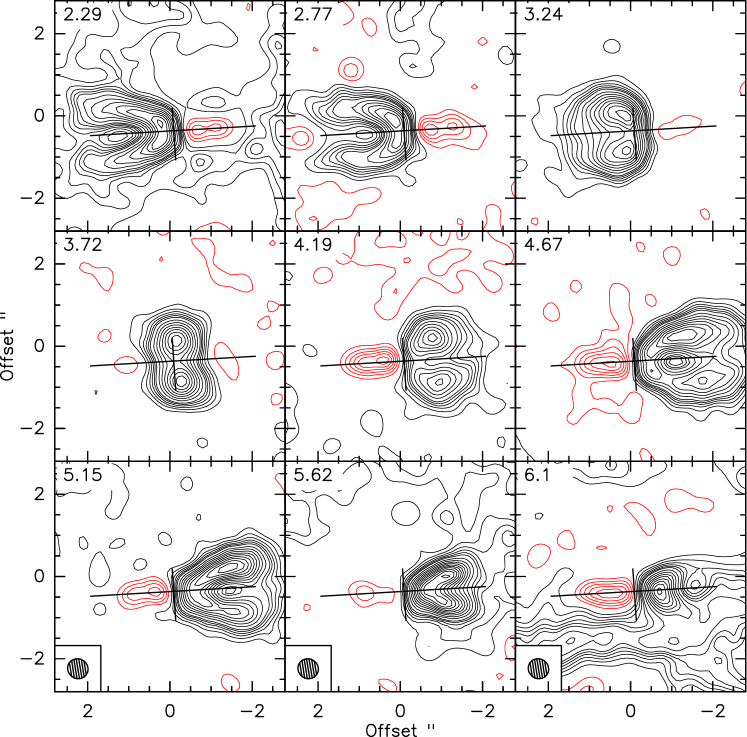
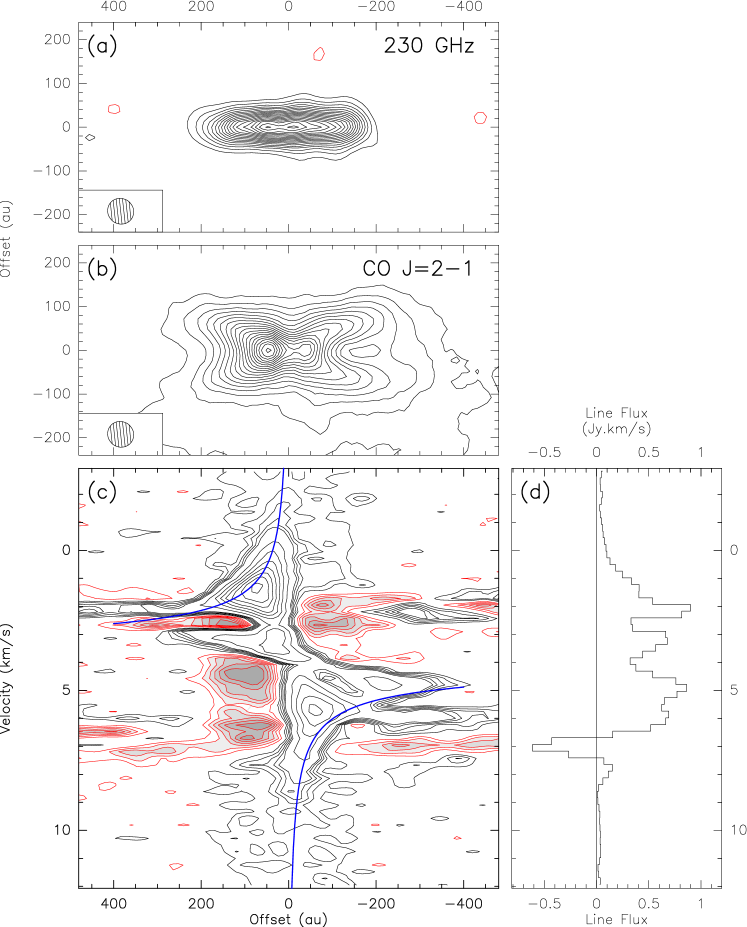
Figure 2 present channel maps of the CO J=2-1 emission. An enlarged version of the central channels is presented in Fig.3. In Fig.4, we show the dust continuum emission, the integrated CO map, the integrated CO J=2-1 spectrum, and a position-velocity diagram through the disk plane. The total continuum flux is 35 mJy at 242 GHz (with 5% calibration uncertainty).
3 Results and analysis
The dust disk clearly extends out to about 180 au, while the gas disks spreads to 300 au. The CO data is highly contaminated by emission from molecular clouds, which results in a complex integrated spectrum over the whole disk (Fig.4d). At velocities around and in the range , the filamentary structure of these clouds appears clearly(see Fig.2).
Around an LSR velocity of , CO in the western part shows the pattern expected from Keplerian rotation, and clearly reveals that CO originates from the upper layers of the disk contrary to the mm-emitting dust that has settled toward the midplane. In the eastern part, however, CO shows absorption against apparently nothing (see Fig.3). This is a result of interferometric filtering of extended emission from these molecular clouds. The results depend on whether the cloud is in the foreground (see Gueth et al. 1997, their Fig.7) or background. In the first case, the dust disk can be hidden by optically thick CO from the cloud, leading to null visibilities if that cloud is sufficiently spatially extended ( with our shortest baselines of 21 m).
However, in Figs.2-3, the signal goes to negative values, requiring a different explanation. A smooth extended CO emission is filtered out by the interferometer whatever its opacity, leading to a null brightness. A continuum dust source located in front of the CO cloud absorbs this CO emission if the dust temperature is below that of the background CO cloud. The resulting brightness at the CO velocity toward the dust disk is then smaller than around it, reaching negative values since the background extended emission is filtered out by the interferometer.
At frequencies away from that of the CO line, the apparent dust brightness in a synthesized beam is
| (1) |
where is the opacity; the beam filling factor; and , the radiation temperature, is the Planck function multiplied by ,
| (2) |
and is the cosmological background, K at 230 GHz. At velocity , the CO cloud has a brightness
| (3) |
Thus, at velocity , the brightness of the dust disk becomes
| (4) |
Subtracting and yields the opacity and beam filling factor product
| (5) |
from which we derive
| (6) |
which, as ) is small, is about
| (7) |
From Fig. 4, is typically 0.4 K, while is K around and K at 2.8 and 5-6 . Using from Fig.1, 8 to 17 K, we thus derive (average) dust temperatures as low as 5 to 8 K. From Eq. 5, the filling factor is at least 0.2, which for a beam size of (60 au) indicates a minimum FWHM of the dust disk of 13 au along the minor axis. Given the FWHM of au along the major axis, the aspect ratio is consistent with an inclination , or implies a minimal scale height of 8 au if the disk is purely edge-on. Also, the dust opacity at 230 GHz must be and is most likely substantially higher.
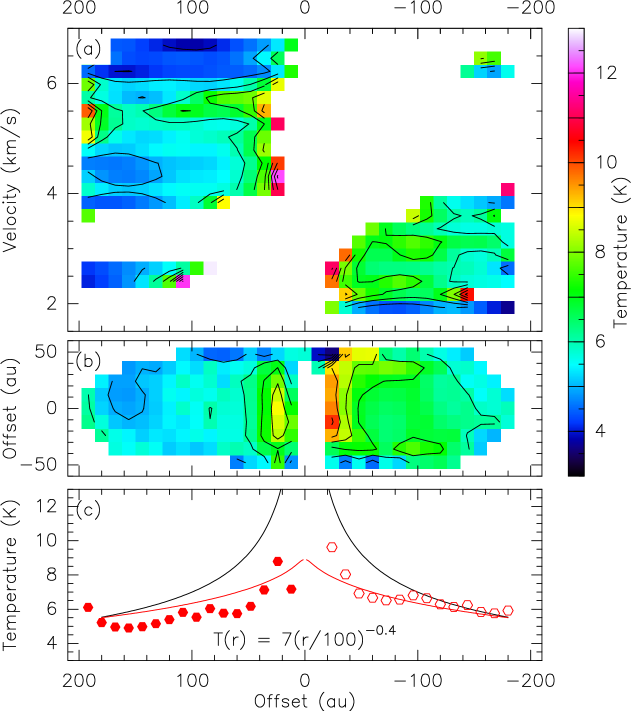
Eq. 6 can be applied for each pixel and velocity channel, allowing us to derive a datacube of dust temperatures. As the dust disk is unresolved vertically, we show these temperatures as a function of velocity along the disk axis in Fig. 5a, revealing the consistency of the derived values. Residual structures in the CO clouds probably perturb the measurement at LSR velocities around and at the extreme velocities where the clouds become optically thin and unveil their spatial column density variations. Yet, the derived values are remarkably consistent. Averaging the datacube over the whole velocity range produces the dust temperature map of Fig. 5b. A small radial gradient is visible, but the inner regions ( au) may be biased because of residual emission from the (warm) CO disk itself. The derived temperature is an average along the line of sight, sampling radii between the impact parameter and the disk radius of about 190 au. This effect is estimated in Fig. 5c, assuming a uniform surface density in the disk. It shows the measured values are consistent with . This absorption derived temperature only relies on the absolute calibration of the 30-m spectra (the ALMA calibration factor cancels out in Eq. 7), which we estimate accurate to 10%.
If the cloud has significant structure on scales 7-10′′, the local brightness toward the Flying Saucer can be higher (but also equally likely lower). The maximum expected brightness can be estimated assuming the cloud is the maximum size not sampled in our interferometric maps, 7.6′′, and computing the filling factor in the beam of the 30-m telescope. This would increase by a factor 1.9. However, because of the nonlinearity of Eq. 6, the dust temperature law would then become . Also, this is a maximally biased correction since it assumes that the all four different clouds (corresponding to the four Gaussian lines in Fig. 1) have their brightness maximum in the direction of the Flying Saucer.
| Parameter | Value | Unit | |
|---|---|---|---|
| Surface density exponent | |||
| au | Scale height at 100 au | ||
| exponent of scale height | |||
| au | Outer radius | ||
| ∘ | Inclination | ||
| ∘ | Orientation |
We analyzed the 242 GHz continuum with a simple disk model that is vertically isothermal, using truncated power laws for temperature and surface density and no dust settling (tapered edge viscous profiles yielded a poorer fit). We assumed , following Guilloteau et al. (2011). We ran an MCMC, using the “emcee” tool of Foreman-Mackey et al. (2013), which implements the affine invariant sampler of Goodman & Weave (2010) with 40 walkers and 5000 steps, retaining only the last 1000 steps for the error analysis. Results are in Table 1. The disk appears closer to edge-on than derived in the NIR analysis of Grosso et al. (2003). The low flaring index and negative value are the direct signatures of an edge-on settled dust disk fitted by a disk model that does not consider dust settling, as demonstrated by Boehler et al. (2013). The two observing frequencies, 230 GHz and 242 GHz, are insufficiently separated to provide constraints on the spectral index, and leave a strong degeneracy between the dust temperature and surface density, so no reliable value could be found. van Kempen et al. (2009) report a flux of 58 mJy in the 15′′ beam of SCUBA at 850m, giving a spectral index of 1.4 between 242 and 345 GHz. This would imply a mean dust temperature of 10 K if the dust disk is optically thick, 7 K if we take the minimum opacity at 230 GHz, 0.2, and a dust emissivity exponent . However, error bars are not specified and the region has extended flux, so these estimates are not very reliable. With standard disk dust properties (from Beckwith et al. 1990, with ), the disk H2 surface density is at least cm-2 at 100 au.
All measurements thus point toward very low dust temperature. More precise values can be obtained by measuring the missing short spacings of the ALMA data, either via the Alma Compact Array or on-the-fly mapping at the 30-m, and by obtaining an accurate SED covering the mm and sub-mm range, as the turnover frequency of the Planck function should be readily visible.
4 Discussion
The very low temperatures are at odds with previous estimates. Direct measurements of mm-emitting dust temperatures are rare. Dutrey et al. (2014) report 14 K at 200 au in GG Tau, using deviations from the Rayleigh-Jeans part of the blackbody between 230 and 690 GHz. However, the GG Tau disk is circumbinary and its thermal structure is special because the puffed-up inner rim of the tidal cavity effectively shades the outer ring. This leads to a steep temperature gradient (almost as 1/r) that is not expected in simpler circumstellar disks. Guilloteau et al. (2011) argue that some of the brighter disks have optically thick cores and used the apparent disk brightness to derive the temperature profile (see their Table 8). The temperatures of 15 to 25 K found for the cores of DG Tau, MWC 480, T Tau, DG Tau B, and HL Tau extrapolate to values around 11 to 19 K at 100 au when the mean exponent of 0.4 is considered. However, all these stars are rather luminous and at least three of them are relatively massive (1.7 to 2 ).
Most disk modeling also predicts rather high temperatures (e.g., Dullemond et al. 2002). Andrews et al. (2013) argue for an average dust disk temperature of for disks extending out to 200 au. This is similar to the results found by Isella et al. (2009). In particular, for DM Tau, whose mass is very similar to that of the Flying Saucer, Isella et al. (2009) derived a dust temperature of 20 K at 100 au
To yield lower temperatures than model predicts, either the disk must intercept much less stellar light or the dust must be a more efficient emitter at longer wavelengths than assumed. The J,H,Ks images of the Flying Saucer from Grosso et al. (2003) show direct evidence for a flared disk and require a stellar luminosity of , which is appropriate for a star, and, hence, the later hypothesis is preferred. Voshchinnikov & Semenov (2000) showed that for grains containing a conducting material (refractory organics, FeS, FeO, etc…), nonspherical grains can be colder than the spherical grains by 20-50%. For stochastically grown aggregates made of silicates, Fogel & Leung (1998) have found a similar (but weaker, 10-20%) cooling effects.
Another possibility is a difference in temperature between larger grains, which dominate at long wavelengths, and small grains, which dominate the SED in the NIR. If the Planck mean opacity is lower than 1, larger grains are expected to be colder than smaller grains. The difference in temperature can be reduced through thermal accommodation by collisions with the gas, but the efficiency of the process is low at densities below cm-3.
It is also worth pointing out that the dust emissivity may depend on the temperature (e.g., Boudet et al. 2005; Coupeaud et al. 2011), an effect which may be substantial given the very low values found in this study. Finally, such very low dust temperatures, if applicable to all grain sizes, affect the disk chemistry by reducing the mobility of molecules on grains and halting all surface reactions except hydrogenation by H atoms.
Acknowledgements.
This work was supported by “Programme National de Physique Stellaire” (PNPS from INSU/CNRS.) This research made use of the SIMBAD database, operated at the CDS, Strasbourg, France. This paper makes use of the following ALMA data: ADS/JAO.ALMA#2013.1.00387.S. ALMA is a partnership of ESO (representing its member states), NSF (USA), and NINS (Japan), together with NRC (Canada), NSC and ASIAA (Taiwan), and KASI (Republic of Korea) in cooperation with the Republic of Chile. The Joint ALMA Observatory is operated by ESO, AUI/NRAO, and NAOJ. This paper is based on observations carried out with the IRAM 30-m telescope. IRAM is supported by INSU/CNRS (France), MPG (Germany), and IGN (Spain).References
- Andrews et al. (2013) Andrews, S. M., Rosenfeld, K. A., Kraus, A. L., & Wilner, D. J. 2013, ApJ, 771, 129
- Beckwith et al. (1990) Beckwith, S. V. W., Sargent, A. I., Chini, R. S., & Guesten, R. 1990, AJ, 99, 924
- Boehler et al. (2013) Boehler, Y., Dutrey, A., Guilloteau, S., & Piétu, V. 2013, MNRAS, 431, 1573
- Boudet et al. (2005) Boudet, N., Mutschke, H., Nayral, C., et al. 2005, ApJ, 633, 272
- Chiang & Goldreich (1997) Chiang, E. I. & Goldreich, P. 1997, ApJ, 490, 368
- Coupeaud et al. (2011) Coupeaud, A., Demyk, K., Meny, C., et al. 2011, A&A, 535, A124
- D’Alessio et al. (2001) D’Alessio, P., Calvet, N., & Hartmann, L. 2001, ApJ, 553, 321
- Dullemond et al. (2002) Dullemond, C. P., van Zadelhoff, G. J., & Natta, A. 2002, A&A, 389, 464
- Dutrey et al. (2014) Dutrey, A., di Folco, E., Guilloteau, S., et al. 2014, Nature, 514, 600
- Fogel & Leung (1998) Fogel, M. E. & Leung, C. M. 1998, ApJ, 501, 175
- Foreman-Mackey et al. (2013) Foreman-Mackey, D., Hogg, D. W., Lang, D., & Goodman, J. 2013, PASP, 125, 306
- Goodman & Weave (2010) Goodman, J. & Weave, J. 2010, Comm. in Applied Math. and Computational Science, 5, 65
- Grosso et al. (2003) Grosso, N., Alves, J., Wood, K., et al. 2003, ApJ, 586, 296
- Gueth et al. (1997) Gueth, F., Guilloteau, S., Dutrey, A., & Bachiller, R. 1997, A&A, 323, 943
- Guilloteau et al. (2011) Guilloteau, S., Dutrey, A., Piétu, V., & Boehler, Y. 2011, A&A, 529, A105
- Isella et al. (2009) Isella, A., Carpenter, J. M., & Sargent, A. I. 2009, ApJ, 701, 260
- Loinard et al. (2008) Loinard, L., Torres, R. M., Mioduszewski, A. J., & Rodríguez, L. F. 2008, ApJ, 675, L29
- Pontoppidan et al. (2007) Pontoppidan, K. M., Stapelfeldt, K. R., Blake, G. A., van Dishoeck, E. F., & Dullemond, C. P. 2007, ApJ, 658, L111
- Reboussin et al. (2015) Reboussin, L., Guilloteau, S., Simon, M., et al. 2015, A&A, 578, A31
- van Kempen et al. (2009) van Kempen, T. A., van Dishoeck, E. F., Salter, D. M., et al. 2009, A&A, 498, 167
- Voshchinnikov & Semenov (2000) Voshchinnikov, N. V. & Semenov, D. A. 2000, Astronomy Letters, 26, 679