Herbig Ae/Be candidate stars in the innermost Galactic disk: Quartet cluster
Abstract
In order to investigate the Galactic-scale environmental effects on the evolution of protoplanetary disks, we explored the near-infrared (NIR) disk fraction of the Quartet cluster, which is a young cluster in the innermost Galactic disk at the Galactocentric radius kpc. Because this cluster has a typical cluster mass of as opposed to very massive clusters, which have been observed in previous studies ( ), we can avoid intra-cluster effects such as strong UV field from OB stars. Although the age of the Quartet is previously estimated to be 3–8 Myr old, we find that it is most likely 3–4.5 Myr old. In moderately deep JHK images from the UKIDSS survey, we found eight HAeBe candidates in the cluster, and performed K-band medium-resolution () spectroscopy for three of them with the Subaru 8.2 m telescope. These are found to have both Br absorption lines as well as CO bandhead emission, suggesting that they are HAeBe stars with protoplanetary disks. We estimated the intermediate-mass disk fraction (IMDF) to be 25 % for the cluster, suggesting slightly higher IMDF compared to those for young clusters in the solar neighborhood with similar cluster age, although such conclusion should await future spectroscopic study of all candidates of cluster members.
Subject headings:
infrared: stars — planetary systems: protoplanetary disks — stars: pre-main-sequence — open clusters and associations: general — stars: formation — Galaxy: abundances — ISM: HII regions1. INTRODUCTION
Whether stars form in the similar way everywhere in different physical/chemical environments or not is of great interest. Many groups are studying the initial mass function (IMF) in various environments, including the LMC and SMC, to find little difference (e.g., Bastian et al. 2010), which appears to suggest the universality of star formation. In the Galaxy, environments largely differ depending on the Galactic radius, e.g., metallicity, gas density, perturbation by spiral arms, which may offer an opportunity to study the environmental dependence of star formation (Kobayashi et al., 2008).
Previously, we studied young clusters in the extreme outer Galaxy with kpc and suggested that the IMFs and star formation efficiency (SFE) are not largely different from the solar neighborhood (Yasui et al., 2006, 2008a, 2008b) except for the lifetime of protoplanetary disks, which was found to be significantly shorter than in the solar neighborhood (Yasui et al., 2009, 2010). This might suggest that the environment affects disk evolution and thus planet formation more than star formation.
Star formation could also be largely affected by intra-cluster effects e.g., stellar winds, radiation, and dynamical effects (Adams et al., 2006). Because such effects largely depend on the existence of massive stars, the resultant star formation may also differ with the cluster mass () (Harayama et al., 2008). For very massive clusters ( ), the IMF may be different than the standard IMF (Bastian et al., 2010). The dependence of the disk lifetime on the cluster mass and density is also suggested (e.g., Stolte et al., 2010; Fang et al., 2013).
As the next step for our study of the disk fraction in stellar clusters as a function of Galactocentric radius (Yasui et al., 2009, 2010), we study the Quartet cluster that is a young cluster discovered by Messineo et al. (2009) from Spitzer/GLIMPSE images in the Galactic plane at . The cluster is named after a tight grouping of four mid-infrared brightest stars in the cluster (M1, M2, M3, and M5 in Fig. 1; see also Messineo et al. 2009). We selected the Quartet cluster with the following two criteria. (1) It has an that is about half that of the sun, and so a notable environmental difference compared to the solar neighborhood is expected. (2) It is important to study clusters with more common mass ( ) for direct comparison with solar neighborhood ( kpc), where most young clusters have the cluster mass of less than (Lada & Lada, 2003). However previous studies of clusters in the inner Galaxy had focused on very massive clusters with , because it was very difficult to find smaller clusters in such distant regions due to limited sensitivity. Recently, however, the Spitzer GLIMPSE survey by e.g., Mercer et al. (2005) and Messineo et al. (2009) led to the discovery of several star clusters of such as the Quartet cluster.
In this paper, we investigated the evolution of protoplanetary disks in the Quartet cluster. In Section 2, we describe the Quartet cluster, in particular, on the age of the cluster, since it is critical for interpreting the disk fraction. In Section 3.1, we present photometry using moderately deep JHK images obtained from the UKIDSS survey imaging ( mag). We then discuss intermediate-mass (IM) stars with K-band disk excesses (HAeBe stars) discovered in the Quartet cluster in Section 4. For three of the selected HAeBe candidates we obtained IRCS spectroscopy in Section 3.2. We then discuss the properties of objects with IRCS spectra in Section 5. Finally, we estimated intermediate-mass disk fraction (IMDF) for the Quartet cluster to discuss the nature of disks in the innermost Galactic disk in Section 6.2.
2. The Quartet cluster
Messineo et al. (2009) presented near-infrared (HK-bands) spectroscopic observations of bright ( mag) massive stars (Ofpe, WN9, and OB stars), which are selected based on 2MASS data. The distance is estimated to be 6.3 kpc from OB stars in the cluster. This is consistent with the kinematic distance derived with radio recombination line observations to an H II region G024.8300.10 (6 kpc; Kantharia et al. 2007), with which the Quartet cluster is associated. The age of the cluster is estimated to be 3–8 Myr: older than 3 Myr from the existence of evolved stars, such as WR and Ofpe/WN9, and younger than 8 Myr from the existence of WR stars and the absence of red supergiants (RSGs). They also estimated the cluster mass to be a few from a simple simulation with stellar populations.
In addition, because both WN and WC stars exist (two WN and one WC), the age range should be narrowed to 3–6 Myr (Schaerer et al. 1999, Crowther et al. 2006). Moreover, from the existence of at least three OB stars whose masses are 40 (Fig. 4 in Messineo et al. 2009), the age of the Quartet is likely to be less than 4.5 Myr because such stars evolve off the main sequence (MS) in that time (Lejeune & Schaerer, 2001). In summary, the age of the Quartet is most likely 3–4.5 Myr.
3. IMAGING DATA and SPECTROSCOPY
3.1. UKIDSS Survey Imaging
We used data from the United Kingdom Infrared Telescope Infrared Deep Sky Survey (UKIDSS; Lawrence et al. 2007) Galactic Plane Survey (GPS; Lucas et al. 2008) archive, which includes J, H, K, and H2-band images. The UKIDSS images are obtained using the 3.8 m United Kingdom Infrared Telescope (UKIRT), and the WFCAM wide-field camera (Casali et al., 2007). WFCAM pixel scale is 0.4 arcsec and the images have a FWHM1 arcsec. We obtained J, H, and K band images around the Quartet cluster from the GPS data release 4. The MKO near-infrared photometric filters (Simons & Tokunaga 2002; Tokunaga, Simons, & Vacca 2002) are employed.
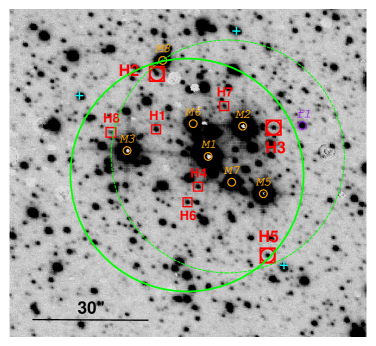
Because the target region is near the Galactic plane and is confusion limited, the WSA (WFCAM Science Archive) catalogue based on UKIDSS is found to be incomplete, in particular for fainter stars. We therefore performed photometry with PSF fitting using IRAF/DAOPHOT111IRAF is distributed by the National Optical Astronomy Observatories, which are operated by the Association of Universities for Research in Astronomy, Inc., under cooperative agreement with the National Science Foundation.. For deriving PSF, we picked up unsaturated bright stars, which are well off the edge of the frame and do not have any nearby stars with magnitue difference of more than 4 mag. PSF photometry was performed using the ALLSTAR routine two times, once using original images and once using the subtracted images. We used PSF fit radii of 3.8, 3.3, and 3.2 pixels for J-, H-, and K-band, respectively, which are the FWHM values, and set the sky annulus four times as large as the PSF fit radii. Saturated stars are removed considering the flag information in the WSA catalog. For the photometric calibration, we used about 100 isolated stars in the frames, whose magnitudes were obtained from the 2MASS Point Source Catalog, and converted to MKO magnitudes with the photometric color corrections given by Leggett et al. (2006). We also confirmed that obtained magnitudes are almost identical (0.02 mag) to those in the WSA catalogue for isolated stars. Limiting magnitudes (10 ) of mag, mag and mag were obtained. Using the photometric results here, we identified eight HAeBe candidates (HAeBe 1–8; red squares in Fig. 1 and Tab. 1), which is described in detail in Section 4.
3.2. IRCS Spectroscopy
For three HAeBe candidates (HAeBe 2, 3, and 5), we conducted spectroscopic observations using the IRCS (Tokunaga et al. 1998, Kobayashi et al. 2000) attached to the Subaru 8.2 m telescope on 2012 May 27. We used the grism mode in combination with the K filter to cover the wavelength region from 1.93 m to 2.48 m and pixel scale is 52 mas pixel-1. We used the AO system with natural guide star mode (Hayano et al., 2010) using wave front reference stars, which are located within 30′′ from the targets and whose magnitudes are 14–15 mag (Fig. 1, aqua plus symbols). We achieved a FWHM of 0.2–0.3′′ in the K band. We used a slit with 0.225′′ width, which provided a spectral resolving power of .
The slit position angles for targets were set to avoid contaminations of other stars in the slit. The telescope was nodded along the slit by about 5 arcsec between exposures. In order to avoid saturation, exposure time for each frame is set as 180 sec. About 10 sets of data were obtained for each target, resulting in a total exposure time of 1800 sec. Spectra of bright telluric standard stars (HD 139731; F0V) at similar airmass were obtained in a similar fashion. We summarize the details of the observation in Table 2.
All the data were reduced following standard procedures using the IRAF noao.imred.echelle package, including sky subtraction (subtraction of two frames), flat-fielding (halogen lamp with an integrating sphere), and aperture extraction. Argon lamp spectra that were taken at the end of the observing night were used for vacuum wavelength calibration. Each target spectrum was divided by the spectrum of the F0V standard star in order to correct for atmospheric absorption and instrumental response after the Br absorption line of the standard spectrum was eliminated with linear interpolation. Usually, AO correction is more effective for longer wavelength, while the diffraction-limit FWHM is larger for longer wavelength. In our observation, the observed FWHM is found to be almost constant throughout the band maybe because both effects are cancelled out. The signal to noise (S/N) for the continuum level for the three targets, HAeBe 2, 3, and 5 (see Section 4), are 42, 9, and 46, respectively (Table 2). Considering the S/N, lines with equivalent width (EW) of 0.8 Å is detected with 3 for HAeBe 2 and 5, while lines with EW of 4 Å is detected with 3 for HAeBe 3.
4. HAeBe Candidates in the Quartet cluster
Using photometric results in Section 3.1, we selected HAeBe candidates in the Quartet cluster members with the following steps.
4.1. Definition of cluster region and control field
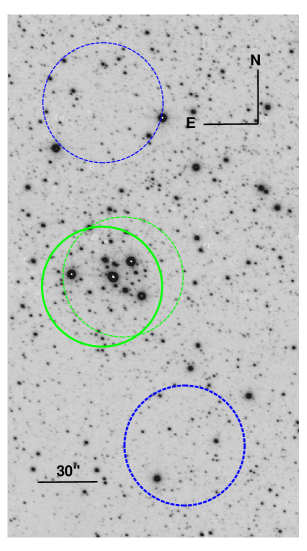
First, we defined the cluster region and the control field using the UKIDSS K band image of the Quartet cluster shown in Fig. 1. We counted the numbers of stars within circles of a 50 pixel (10′′) radius around the cluster position. We then defined the center of the circle which includes the maximum numbers of stars as the cluster center, and this was found to be at , , with an uncertainty of 2′′. Fig. 2 shows the radial variation of the projected stellar density from the cluster center in the K band. The horizontal solid line shows the background stellar density. There is a dip in the plot at the radius of 20′′. Such a dip in this kind of radial variation plot is often seen for brighter stars in nearby clusters (e.g., Pandey et al. 2008) probably due to the stochastic IMF effects on the number of higher mass stars, thus brighter stars (Santos & Frogel, 1997). However, in our case, this may be also because the bright stars block fainter stars in the images so that the number of stars is not correctly counted. The very bright stars appear to block fainter stars located within 2.5 FWHM radii (2.5 arcsec) from the centers of the bright stars. The area of a circle with the radius is about 20 arcsec2. Because there are 6 very bright stars (the four brightest stars, M6, and M7 in Fig. 1) around the center of the cluster, the total area of the blocked region is 120 arcsec2 at most. In the dipped bin in the radial plot (–20′′) the total area is about 950 () arcsec2 and the blocking can affect about 13 % () of the total number at most and may be partly contributing to the 20 % dip in the plot.
We define the cluster region to be within a radius of where the stellar density is larger than that of the background region by 3 . This corresponds to 0.9 pc assuming a distance to the cluster of 6 kpc. The defined cluster region is smaller than the 45′′ radius found by Messineo et al. (2009), and one of their cluster members, No.9, is not included in our definition. However, it is necessary to define the cluster region strictly in order to obtain cluster parameters with higher S/N by subtracting for a control field in the later sections because there should be a lot of contaminations in the field of the Quartet. The region at arcmin is regarded as the background region with field stars because the stellar density at arcmin appears to fall off sufficiently (Fig. 2). We defined a control field at ), which is at the same Galactic latitude but 1.5 arcmin off to smaller Galactic longitude. In Fig. 1 (left), the defined cluster region is shown with a thick solid circle, while the control field is shown with a thick dashed circle.
4.2. Color-magnitude diagram
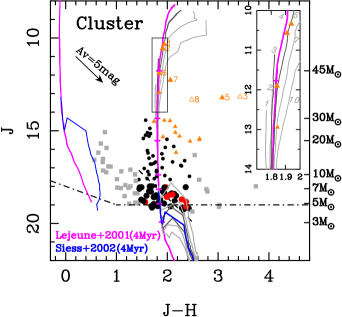
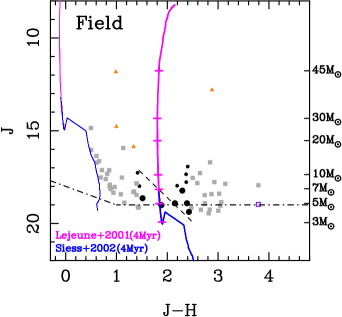
We next constructed the versus color-magnitude diagram of all detected point sources in the cluster region (Fig. 3, left) and those in the control field (Fig. 3, right). The isochrone model by Lejeune & Schaerer (2001) in the mass range of 3 for an age of 4 Myr and those by Siess et al. 2000 in the mass range of 0.1–7 for the same age are shown with magenta and blue thin lines, respectively. Stars with the mass of 3 are on the turn-on point to the main sequence for the age. A distance of 6 kpc was assumed. An arrow shows the reddening vector of mag. In the color-magnitude diagram the extinction of each star was estimated from the distance along the reddening vector between its location and the isochrone models by Lejeune & Schaerer (2001).
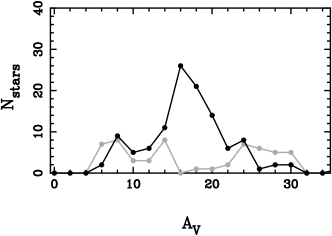
We then constructed the distributions of the extinction of stars in the cluster region (black) and those in the control field (gray) in Fig. 4. The resultant distribution for the control field shows three peaks at mag, 14 mag and 24–30 mag, while that for the cluster region show a significant excess in the range of 14–24 mag. The peak value of the excess extinction for the stars in the cluster region, mag, is consistent with Messineo et al. (2009), who estimated extinction of the cluster as mag. Therefore, we identified the cluster members as being in the cluster region and with of 14–24 mag. However, because there could still be a significant amount of background contamination from field stars, we correct for this in discussion in Section 6.2.
In Fig. 3, candidate cluster members, stars with of 14–24 mag, are shown with filled circles, while other stars are shown with gray squares. The average value of extinctions for the possible cluster members is estimated to be 18 mag. The isochrone model by Lejeune & Schaerer (2001) for the age of 4 Myr with the distance of 6 kpc and the average extinction is shown with magenta thick line, while those by Siess et al. (2000) for the same age with the same distance and extinction is shown with blue thick line. The short horizontal lines placed on the thick magenta lines show positions of 45, 30, 20, 10, 7, 5, and 3 , that are also shown on the right y-axis. This indicates that the mass detection limit of possible cluster members with limiting magnitude of mag is 5 . Therefore, all the possible cluster members should be in the MS phase at the age of 4Myr. Just in case, we checked the isochrone tracks in the age range of 3–4.5 Myr (see Section 2) to see if this conclusion holds. The isochrone tracks for the ages of 3 and 5Myr are shown with dark gray lines in Fig. 3. Because isochrone tracks of the PMS phase are located below the distribution of all the candidate cluster members in the color-magnitude diagram, all the possible cluster members should be in the MS phase regardless of age. Therefore, the estimated extinction values are not affected by the change of isochrone tracks with age.
In Fig. 3, we also plotted the brightest stars in the cluster in Messineo et al. (2009) with large orange triangles, filled ones for possible cluster members and open ones for field stars. Note that two stars in Messineo et al. (2009), No. 4 and 9, are not shown in Fig. 3 because they are not located in the cluster region with 30′′ radius, but are at large distances of 1′ and 2′ from the cluster center, respectively. Only a very bright star, No. 5, which is identified as a cluster member in Messineo et al. (2009), appears to have a large extinction of mag (see large orange filled triangle in Fig. 3), which is out of the extinction range defined above. Because this star is identified as a late-type WC star in Messineo et al. (2009), the large extinction can be attributed to the thick circumstellar shell. In fact, the large color excesses of –1.5 mag are observed in case of WC stars in Westerlund 1 cluster with the age of 4.5–5Myr (Crowther et al., 2006), which is consistent with the differences between colors of the No. 5 star and those of other cluster members identified in Messineo et al. (2009), No. 1, 2, 6, and 7 ( mag; see Fig. 3). Therefore, the apparently large color excess of the No. 5 star is likely to be from its intrinsic cause.
In Fig. 3, we also plotted sources in 2MASS Point Source Catalog, which are in the cluster region and for which the photometry cannot be performed with UKIDSS data because of saturation, with small orange triangles. Only the stars with good photometric quality (the flag of ‘A’ and ‘B’) are shown. The results that there are few stars with mag (2 out of 12) also support the idea that the range of 14–24 mag can pick up almost all of the cluster members.
4.3. Selection of intermediate-mass stars
Before identifying HAeBe candidate stars (IM stars with K-band disk excess as defined by Hernández et al. 2005), we selected IM stars from the candidate cluster members identified in Section 4.2 based on the color-magnitude diagram (Fig. 3). The J-band magnitudes are less affected by disk excess emission222Just in case, we confirmed this with a young cluster, Taurus with the age of 1.5 Myr. In this cluster, 9 HAeBes and 20 IM-stars without disks in the spectral range of B9–K5 exist (Yasui et al., 2014). We found the average J-band magnitude of HAeBes to be 9.01.5 mag, while that of IM stars without disks to be 8.71.0 mag, suggesting no significant difference of J-band magnitudes. Considering that the differences of distance modulus of stars in a cluster are negligible and that the spectral types of HAeBes and IM stars without disks are not significantly different, the J-band excess of HAeBes should be negligible., while large H and K band excesses are seen in HAeBes (IM stars with K-band excess; see Fig. 5–9 in Hernández et al. 2005). Moreover, the effects of differential extinction should be very small as discussed in Section 4.2. Therefore, we used the J-band magnitudes for selecting IM stars as is usually done for studying distant open clusters. This approach was successfully applied to the studies of old clusters e.g., Orionis (3 Myr; Hernández et al. 2007, Lodieu et al. 2009), Upper Scorpius (5 Myr; Aller et al. 2013).
The presence of disks around stars earlier than B5 (6–7 in the main-sequence phase) is not well established since the disk lifetime of high-mass stars is probably very short, e.g. 1 Myr (Zinnecker & Yorke, 2007; Fuente et al., 2002). Therefore, we set the highest target mass of IM stars as 7 that still have protoplanetary disks. This is the same upper limit mass as Yasui et al. (2014), who systematically derived IMDFs for young clusters in the solar neighborhood and estimated disk lifetime of IM stars.
Using isochrone models by Lejeune & Schaerer (2001) with the age of 4 Myr assuming the distance of 6 kpc and the extinction of mag, the stellar mass of 7 corresponds to mag. Because stars with mass of more than 5 are already in MS phase, the difference of J-band magnitudes of stars with different age between 3 and 4.5 Myr are very small, only 0.05 mag. Therefore, we selected faint stars with mag as IM stars, which are shown with large filled circles in Fig. 3. The limiting magnitude of UKIDSS images is about mag, which corresponds to about 5 .
4.4. Color-color diagram
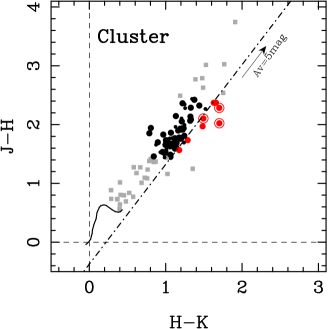
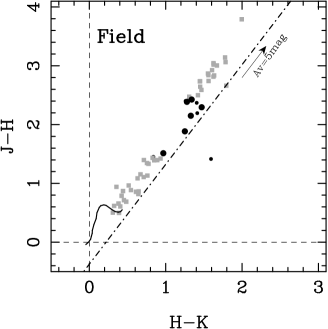
K-band excess of YSOs suggests the existence of innermost dust disk (1 AU in the case of Herbig Be stars; Millan-Gabet et al. 2007), where the dust is in the sublimation temperature (1500 K). The versus color-color diagrams for the stars in the cluster region and in the control field are shown in Fig. 5. Stars with the extinction of –24 mag (probable cluster members) and the other stars (mainly field stars) are shown with filled circles and small gray squares, respectively. Among the likely cluster members, stars with mag (IM stars) are shown with large filled circles. The line that intersects and is parallel to the reddening vector, is the borderline between IM stars with circumstellar disks (candidate HAeBe stars; right side) and without circumstellar disks (left side) (Yasui et al., 2014). This line is defined to avoid selecting the reddest star without disk among all the samples in Hernández et al. (2005), HIP 112148. However, because this borderline is originally defined in the 2MASS system, we checked the location of the line in the MKO system, which is used by UKIDSS. We converted the 2MASS magnitudes of the HAeBe stars and the classical Be stars for all samples in Hernández et al. (2005) to MKO magnitudes with the color transformation equations given by Leggett et al. (2006). Considering the converted colors of HIP 112148, the MKO borderline is defined as the line that intersects and is parallel to the reddening vector (dot dashed lines in Fig. 5). Because very few stars with disks in Hernández et al. (2005) are bluer than the borderline (e.g., the filled circle with of 0.2 mag in Fig. 5 by Hernández et al. 2005), the number of selected HAeBe candidates with this borderline should be lower limit. Indeed, some groups e.g., Comerón et al. (2008) defined the bluer borderline (the grey dot-dashed line in Fig. 1 in Yasui et al. 2014), which can select more HAeBe candidates. Using the MKO borderline, we selected eight stars with possible K disk excesses among the probable IM stars in the cluster region. These are the candidate HAeBe stars in the Quartet cluster, and they are shown with red filled circles in Figs. 3 and 5. The coordinates and magnitudes of the HAeBe candidates are summarized in Table 1, and their positions are shown with red squares in Fig. 1 (right).
5. Spectroscopy of three HAeBe candidates
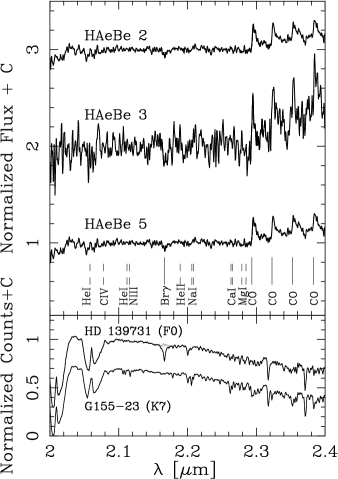
We obtained K-band spectra of HAeBe 2, 3, and 5 as described in Section 3.2. The location of these three stars in the color-color diagram is shown with filled circles enclosed by open circles in Figs. 3 and 5. They are relatively bright in the K-band and are located close to bright stars (–15 mag) that are needed as natural guide stars for AO mode observation. The spectra of three HAeBe candidates, which were normalized to 1.0 after 2-pixel smoothing, are shown with an offset for clarity in Fig. 6. In all spectra, the Br absorption lines at 2.166 m and first overtone CO bandhead emissions at 2.294 m are detected. EWs of the Br absorption lines were measured between 2.160 and 2.175 m, while those of the CO bandhead emission lines were measured between 2.290 and 2.315 m. The uncertainties are estimated as , where is the spectral dispersion of 6.14 Å, is the number of pixels used for measuring EWs, and S/N is the pixel-to-pixel S/N of the continuum. The estimated EWs and their uncertainties of the three spectra are summarized in Table 2. We also show the obtained spectrum of the telluric standard star, HD 139731, in the bottom plot in Fig. 6. The observed spectrum, which was reduced in the same way as in Section 3.2 but was not divided by spectrum of standard star, is shown with black, while that after eliminating the Br absorption line (see Section 3.2) is shown with gray. The pixel-to-pixel S/N for the continuum level of the spectrum is estimated to be as high as 167.
5.1. Implication to spectral types
We estimated spectral types of HAeBe 2, 3, and 5 from the obtained spectral features by comparing them with those in the literatures, Hanson et al. (1996) for O and B type stars, Ali et al. 1995 for late B to M type stars, and Rayner et al. (2009) from F to M type stars. The spectral resolutions in the references are comparable or higher ( 800–3,000) compared to our data ( 800).
All three HAeBe candidates show Br absorption line, which are known to appear clearly in stars from O to G type (Hanson et al. 1996 for O and B type; Ali et al. 1995 for late B to G type). The EW reaches a maximum at a spectral type of A0–A5 type ( Å by Hanson et al. 1996; by Ali et al. 1995), and then becomes smaller with later type. For early type stars in this spectral range, O type stars are known to show N III emission lines at 2.116 m and He II at 2.188 m (Hanson et al., 1996, 2005), while B type stars show He I at 2.113 m in stars earlier than B3 (Hanson et al., 1996). The non-detection of the above lines with Å for HAeBe 2 and 5 (see Section 3.2) suggest that they are late O type or later, although the detection of the above two lines is difficult for HAeBe 3 due to the low S/N of 10. On the other hand, F or later type stars are known to show absorption lines of Ca I at 2.263 and 2.266 m, Na I at 2.206 and 2.209 m, and Mg I at 2.279–2.285 m (Ali et al., 1995; Rayner et al., 2009). The features become more prominent in later type stars to be comparably strong as the Br absorption feature in K type stars. Because all the three HAeBe candidates do not show Ca I, Na I, and Mg I, the spectral types of the three are most likely to be G or earlier. In summary, the suggested spectral types for HAeBe 2 and 5 are late O to G, while that for HAeBe 3 is O to G.
We also estimated the spectral types of HAeBe 2, 3, and 5 from the EWs of Br absorption line. Because the EWs of Br by Ali et al. (1995) was measured in 2.160–2.170 m, which does not necessarily cover the Br lines, we also measured the EWs in the same wavelength range for HAeBe 2, 3, and 5 as 3.60.6, 7.72.8, 5.40.6 Å, respectively, and then compared to the EWs with those by Ali et al. (1995) for estimating spectral types. Although we could not find the wavelength range used for measuring EWs by Hanson et al. (1996), the larger EWs by Hanson et al. (1996) than those by Ali et al. (1995) for the same spectral types, 2 Å, may be due to the wider range by Hanson et al. (1996). Therefore, we compared EWs originally measured between 2.160 and 2.175 m (Table 2) with those by Hanson et al. (1996). First, as a consistency check, we measured the EWs for observed standard stars with known spectral type. Besides the telluric standard HD 139731 (F0V), we obtained a spectrum of another star, G155-23 (K7V) with high S/N. We show their spectra, which were reduced in the same way as in Section 3.2 but was not corrected for the telluric absorption, in the bottom plot of Fig. 6. For HD 139731, the estimated EW of Br is 6.90.1 in 2.16–2.17m and 7.60.2 in 2.16–2.175um, which is consistent with the F0 type stars (EW of 6.51 in Ali et al. 1995). Also, the non-detection of Br line in G155-23 is consistent with its spectral type (Ali et al. 1995, Rayner et al. 2009). We therefore estimated spectral types for HAeBe 2, 3, and 5 to be G or O to early B, B to G, and late O to early B or late F to G, respectively. However, it should be noted that objects with protoplanetary disks often have hydrogen emission lines due to mass accretion activity (Donehew & Brittain, 2011) and thus the EWs of the central stars could be larger than the observed EWs for low-resolution spectroscopy. Therefore, the true spectral types of the above stars could be closer to A0–A5.
In summary, detections and non-detections of absorption lines suggest that the spectral types for all three HAeBe candidates are late O to G, though this is still a rather wide range for spectral type due to the limits of the currently available data. In the age of 3–4.5 Myr, the spectral type of G corresponds to the stellar mass of 2.0 (Siess et al., 2000), which is consistent with the intermediate-mass we aimed only using the J-band magnitudes in Section 4 (1.5 ). Although we could not put strong constraints on the upper limit of the stellar mass by spectroscopy (late O type corresponds to 20 ), the three objects should not be background/foreground massive stars in view of the very small probability of chance projection. In fact, the J-band magnitude of late O type stars is 15.5 mag at the distance of 6 kpc and the extinction of mag, which is much brighter than the magnitudes for IM-stars ( mag for 7 ). Because the magnitude for stars with mass of 10 comes down to mag, which is only 0.5 mag brighter than the maximum magnitude of IM stars, the upper limit mass of the three objects are likely to be 10 at most, corresponding to early B type.
5.2. Nature of HAeBe 2, 3, and 5
All three HAeBe candidates were found to have prominent CO bandheads in emission. The K-band excess noted in Section 4.4 might be due to the CO bandhead emission and so we investigated this possibility. The spectra of HAeBe 2, 3, and 5 were divided by the spectrum of a F0V standard star and multiplied by a blackbody function of 7,300 K (Drilling & Landolt, 2000) to obtain the relative flux density. We then calculated the ratio of the flux from the CO bandhead emission to the continuum flux in the wavelength range of 2.03–2.37 m where atmospheric transmission is 50 %333http://www.ukidss.org/technical/technical.html. As a result, the ratios were found to be 5 %, 3 %, and 2 % in HAeBe 2, 3, and 5 respectively. If we subtract the excess CO bandhead emissions, all of the objects still have sufficient K-band excesses to be identified as HAeBe candidates on the JHK color-color diagram.
The CO bandhead emission is characteristic of a stellar object harboring dense circumstellar material. The conditions required to excite the overtone emission are high temperatures (2,000 K) and high densities ( cm-3; Scoville et al. 1980). CO overtone emission is detected in young stellar objects (YSOs; Scoville et al. 1979, 1983), supergiants (SGs; McGregor et al. 1988), and proto-planetary nebulae (PPNe; Hrivnak et al. 1994). However, the positions of SGs in the color-magnitude diagram (Section 4.3) are very different from those of IM stars ( mag; see Fig 3 and Fig. 1 in Bik et al. 2006). Also, SGs with K-band excess (B[e]SGs) are known to show Br emission, which is not observed for HAeBe 2, 3, and 5. As for PPN, it should not be associated with the Quartet cluster because the age of the central star of PPN is measured in Gyr (10 Gyr for the case of 1 ; Schröder & Connon Smith 2008). Moreover, because the period of the SGs and PPNe phase are very short ( yr for SGs by Smartt 2009; yr for PPNe by Kwok 1993), it is highly unlikely that such rare objects in the foreground or background are coincidentally superposed on the Quartet cluster region. On the other hand, the Quartet cluster is a young star cluster and the properties of HAeBe 2, 3, and 5 are consistent with YSOs from photometry (Section 4) and spectroscopy (Section 5.1). Therefore, HAeBe 2, 3, and 5 are most likely to be YSOs in the Quartet cluster.
The fraction of YSOs with CO emission is quite low (Najita et al., 2007). Although we could not find any good compilations of K-band spectra for YSOs, it would be useful to compare our results to several references. Hoffmeister et al. (2006) estimated 4 % for M17, which is a very young star-forming cluster with an age of 1 Myr, although the mass range of their samples is on the higher side (5–20 ) compared to the Quartet cluster (5–7 ). Ishii et al. (2001), whose targets are IRAS sources identified as luminous YSOs, estimated fraction of the detection at 15 % for HAeBe stars. In the case of the Quartet cluster, the fraction is at least 40 % considering that there are eight HAeBe candidates and all three objects with spectra has CO emission (38 % (3/8)). This value appears to be quite high and this may be characteristic of IM stars in the inner Galaxy. However, because the possibility of variability in both CO emission and Br lines is suggested (Hoffmeister et al., 2006), further study is necessary to have a firm conclusion. In any case, the existence of both K-band excess and CO bandhead emission in HAeBe 2, 3, and 5 suggest that they still have significant amount of dust and gas in their disks.
Br emission is a well-known tracer of mass accretion (Muzerolle et al., 1998) and indicates the existence of gas disks very close to the central stars (0.1 AU; Hartmann 2009). However, the line is less sensitive to mass accretion, yr-1 or higher (e.g., Muzerolle et al., 1998; Calvet et al., 2004), compared to optical hydrogen lines such as H, yr-1 or higher (Muzerolle et al., 2005). Since we could not detect any Br emission lines, whether the innermost gas disks exist or not for HAeBe 2, 3, and 5 is not known at this stage.
6. Discussion
6.1. Implication to the age of the Quartet cluster
In general, young clusters have high intra-cluster extinctions with large dispersions on a timescale of embedded phase (about 2 to 3 Myrs; Lada & Lada 2003): from 0 mag to 25–100 mag for the age of 1 Myr, from 0 mag to 5–10mag for the age of 2–3Myr, and from 0 mag to 2–4 mag for the age of 4 Myr444We checked extinctions for all young clusters listed in Yasui et al. (2014), with reviews of each star-forming region in Reipurth (2008a, b) and references listed in Tab. 3 of Yasui et al. (2014). Only one cluster, sigma Ori (3 Myr old), has very low extinction for the age of the cluster, with maximum of 0.3 mag. Because of small distances to nearby clusters, 400 pc on average, extinctions should be dominated by intra-cluster extinctions.. Considering the extinction dispersion of the Quartet cluster, mag (Section 4.2), the cluster may be still in embedded phase. From 13CO data by Boston University–Five College Radio Astronomy Observatory (BU-FCRAO) Galactic Ring Survey (Jackson et al., 2006), five molecular components are detected in the direction of the Quartet cluster with peak velocities of , 45, 52, 100, 107 km s-1. Considering the location of the Quartet cluster ( and kpc), the velocity is likely to be 100–120 km s-1 in the case that the cluster is in nearly circular Galactic orbit, while it can be 70 km s-1 in the case that the cluster has a large peculiar motion (Reid et al., 2014). Although we do not know the velocity of the cluster, even the strongest component at km s-1, one with peak of 100 km s-1, has an integrated intensity of 5.4 K km s-1, corresponding to only mag (Pineda et al., 2008). Therefore, the molecular component can cause the intra-cluster extinction of only –3 mag at most even if the cluster is located in the molecular component. Compared to the intra-cluster extinction dispersions of young nearby clusters, the age of the cluster is suggested to be 4 Myr, at least. Distant clusters can also have large extinction dispersions only due to foreground components, clouds of atomic gas and/or molecular clouds: e.g. mag for RSGC 1 (Figer et al., 2006)555RSGC 1 is a 7–12 Myr old cluster with identical distance (6 kpc) and the size (1.5 arcmin radius) to the Quartet. It is located within 30 arcmin of the Quartet on the sky, . The extinction dispersion is estimated from mag in Fig.6 of Figer et al. (2006). In the direction of the cluster, no molecular clouds are detected in the BU-FCRAO 13CO survey in the velocity of km s-1 with 3 upper limit of 0.082 K km s-1, corresponding to mag.. Therefore, the large extinction dispersion for the Quartet cluster can be attributed to foreground extinction.
{2} We also compare plots of the possible cluster members with the isochrone tracks in the wide age range of 1–10 Myr on J-H vs. J color-magnitude diagram (Fig. 3). The isochrone tracks for the ages of 1, 2, 3, 5, 7, and 10 Myr are shown with dark and light gray lines in Fig. 3 (left). The inset shows a blowup of the region enclosed with the black box. The gray italic numbers in the inset show the ages of isochrone models. The maximum mass of isochrone models by Lejeune & Schaerer (2001) are set as 120 for the age of 1 and 2 Myr. For these ages, the J magnitudes of the maximum mass stars ( mag) are much fainter than those of No. 1 and 2 stars, whose masses are estimated at 25–60 from the spectral types (Messineo et al., 2009), thus the cluster can never be younger than 2 Myr. In the contrast, for the age of 3 Myr, the maximum masses of the isochrone models are set as 105, 35, 25, and 18 for the age of 3, 5, 7, and 10 Myr, respectively, which are determined by the lifetime of massive stars. For these ages, isochrone models cover the magnitude range of all members of the Quartet cluster, suggesting that the age of the cluster is 3 Myr. Although the isochrone track for the age of 5 Myr appears to match well the plots for No. 1, 2, and 6 stars, we cannot put strong constraints on the age considering the relatively large dispersion (5 mag). In any case, the suggested age here (3 Myr) is consistent with the age estimate in Section 2.
In summary, most likely age of the Quartet cluster is 3 Myr, supporting the previous age estimates in Section 2 based on WR stars (3–4.5 Myr).
6.2. Disk fraction in the Quartet cluster
The fraction of sources having protoplanetary disks within a young cluster, the disk fraction, is one of the fundamental parameters characterizing the evolution of disks and planet formation. We derived the disk fraction of IM stars (IMDF) in the mass range of 5–7 for the Quartet cluster using the J-H vs. H-K color-color diagram (Fig. 5, see detail in Section 4). In Section 4 we found eight disk excess sources out of 42 stars, to yield an IMDF of 19 % . Because there could be a significant number of contaminating IM field stars in the direction of the Quartet cluster, we estimated disk fraction of the Quartet cluster by subtracting the estimated number of IM field stars in a control field. The IMDF in the control field was found to be 0 % out of 6 IM stars by using the same selection methods as for the cluster region. As a result, IMDF for the Quartet is estimated to be % . Just in case, we checked another control field, which has the same area as the cluster region and is separated by 1 arcmin to the north (the thin blue dashed circle in Fig. 1). For the field, the IMDF was found to be 0 % out of 18 IM stars, and the resulting IMDF for the Quartet cluster is % . This suggests that the IMDF of 25 % is a reasonable estimate for the Quartet cluster.
In Section 4.1, we discussed that a part of the cluster members could be missed by the blocking of very bright stars. If the maximum density of the cluster (200 stars per arcmin-2 from Fig. 2) is assumed, at most 7 cluster members could be missed from our sample. Even if all of those missed members do not have K-band excess, the IMDF is estimated to be 19 % , which is well within the statistical uncertainty of the originally estimated IMDF. Another possible source of systematic uncertainty is the definition of the cluster region. Because the centroid of the cluster may be different due to the possible blocking of the cluster members, just in case, we additionally estimated IMDF with an alternatively defined cluster region, whose center is at the centroid of very bright cluster members, No. 1, 2, 5, 6, and 7 in Messineo et al. (2009) (18:36:16.95, -07:05.07.3), and whose radius is the same as the original cluster region (see the green dashed circle in Fig. 1). We derived the IMDF in this alternative cluster region to be 18 % , and the estimated IMDF after the field-star correction is 21 % , which is identical to the originally estimated IMDF.
In Section 4.3, we selected IM stars simply based on J-band magnitudes ( mag). This way of selecting IM stars enabled us to include HAeBe stars, which have large J-H excesses from the sample of IM stars (see Section 5.2). However, just in case, we tried to select IM stars along the extinction vector to see the difference in the estimated IMDF. In this case, stars located at the lower left of the thin dashed lines in Fig. 3, which pass through the isochrone track by Lejeune & Schaerer (2001) at the mass of 7 and are parallel to the reddening vector, can be regarded as IM stars. Out of our original sample of IM stars without disks (large filled black circles in Fig. 3), stars located at the upper right of the line are excluded, while stars with mag that are located at the lower left of the line are included as new samples. Because the numbers of the selected IM stars are decreased by eight and two in the cluster region and in the control field, respectively, IMDF with the new sample becomes 279 % , which is again consistent with the IMDF based on the selection criteria of Section 4.3 (228 %).
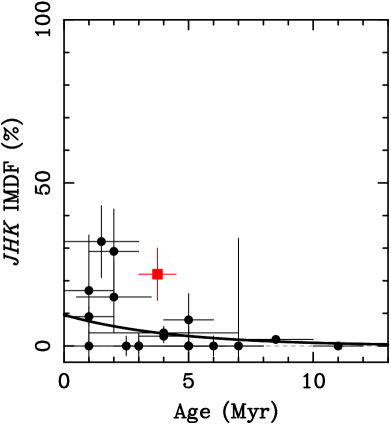
In the IMDF-age diagram in Fig. 7, we show the derived IMDF of the Quartet cluster (red filled square), as well as of the IMDF for young clusters in the solar neighborhood (black filled circles), which are from Fig. 5 (left; red symbols) of Yasui et al. (2014). The IMDFs in the solar neighborhood were derived from the near-infrared color-color diagram for stars that were identified as IM stars (1.5–7 ) by spectroscopy. The IMDFs derived with only NIR JHK-band are generally low, 30 % at most for cluster ages of 2 Myr and decrease down to nearly zero at 5 Myr as shown with a black line in Fig. 7. The IMDFs derived from mid-infrared data have very high values of 100 % for ages of 2 Myr (Yasui et al., 2014). The disk fraction for OBA type stars observed in the L-band also have a relatively high value of 50 % in young clusters (Stolte et al., 2010) although the stellar mass range is on a little higher side than that in this paper. Fig. 7 suggests that the IMDF of the Quartet cluster is one of the highest among all young clusters. For the age of the Quartet cluster, 3–4.5 Myr old, its IMDF appears to be higher than those in the solar neighborhood. Note that the stellar mass range for the estimation of IMDF for the Quartet is on the higher-mass side (5–7 ) than those in the solar neighborhood (1.5–7 ). Because shorter disk lifetime is suggested for higher mass stars (Williams & Cieza, 2011), the estimated IMDF of the Quartet cluster could be rather underestimated.
Even considering the above uncertainties, the IMDF of the Quartet is suggested to be one of the highest among IMDFs of young clusters in the solar neighborhood. This might be one of the characteristics of clusters in the inner Galaxy, but should be investigated by observations of more clusters in the inner Galaxy with a wide range of ages in the future.
7. Conclusion
We aimed to investigate environmental effects on the evolution of protoplanetary disks. First, we used UKIDSS survey data to search for HAeBe stars in the Quartet cluster in the innermost Galactic disk at the Galactrocentric radius of kpc. We then performed IRCS spectroscopy for some of HAeBe candidates to confirm their characteristics. The Quartet cluster is an appropriate target for measuring environmental effects because the mass of the cluster is more typical ( ) compared to previous studies for clusters in the inner Galaxy with cluster mass of . Although the age of the Quartet is previously estimated to be 3–8 Myr old, we find that it is most likely 3–4.5 Myr old, because of the existence of both WC and WN stars and existence of OB stars with mass of 40 . Our conclusions can be summarized as follows:
-
•
As a result of photometry with UKIDSS data with the mass detection limit of 5 , we found eight HAeBe candidates with K-band disk excesses in the mass range of 5–7 .
-
•
For three HAeBe candidates, we performed K-band medium-resolution () spectroscopy and found that they all have both Br absorption and CO bandhead emission. From the existence of Br absorption line and the non-detection other absorption lines, all three are suggested to be IM or higher mass stars. The CO bandhead emission suggests that all three objects are most likely to be YSOs with protoplanetary disks. It should be also noted that the high detection rate of the CO emission (at least 40 %), which is generally low in the solar neighborhood (15 %), may be characteristics of disks in such a region.
-
•
We estimated IMDF of the Quartet cluster to be 25 %. Although there may be still a large systematic uncertainty, it is one of the highest value among IMDF derived for young clusters in the solar neighborhood. Considering the mass detection limit of 5 , this value may be even a lower limit.
To understand the characteristics of disk evolution in the inner Galaxy, observation for more young clusters with a wide range of ages as well as identification of cluster members with less uncertainty by comprehensive spectroscopic follow-up is important in the future.
| Star | R.A. | Decl. | ||||
|---|---|---|---|---|---|---|
| (J2000.0) | (J2000.0) | (mag) | (mag) | (mag) | ||
| HAeBe | 1 | 18:36:18.20 | -07:05:00.2 | 18.050.05 | 16.080.06 | 14.590.03 |
| 2 | 18:36:18.18 | -07:04:45.9 | 18.710.09 | 16.420.06 | 14.720.03 | |
| 3 | 18:36:16.15 | -07:04:59.9 | 18.490.06 | 16.470.04 | 14.770.03 | |
| 4 | 18:36:17.47 | -07:05:15.1 | 18.830.07 | 16.460.06 | 14.830.02 | |
| 5 | 18:36:16.25 | -07:05:33.0 | 18.440.06 | 16.330.05 | 14.840.05 | |
| 6 | 18:36:17.65 | -07:05:19.1 | 19.100.08 | 16.730.05 | 15.070.02 | |
| 7 | 18:36:17.01 | -07:04:54.3 | 18.560.08 | 16.830.07 | 15.540.05 | |
| 8 | 18:36:18.98 | -07:05:00.9 | 18.840.07 | 17.280.05 | 16.100.05 | |
| Target | Airmass | Integration | S/Na | Br | CO (2–0) | |
|---|---|---|---|---|---|---|
| (sec) | EW (Å) | EW (Å) | ||||
| HAeBe | 2 | 1.2 | 42 | 4.40.7 | 22.70.9 | |
| 3 | 1.3 | 9 | 9.83.4 | 35.94.4 | ||
| 5 | 1.1 | 46 | 5.70.7 | 13.70.9 | ||
References
- Adams et al. (2006) Adams, F. C., Proszkow, E. M., Fatuzzo, M., & Myers, P. C. 2006, ApJ, 641, 504
- Ali et al. (1995) Ali, B., Carr, J. S., Depoy, D. L., Frogel, J. A., & Sellgren, K. 1995, AJ, 110, 2415
- Aller et al. (2013) Aller, K. M., Kraus, A. L., Liu, M. C., et al. 2013, ApJ, 773, 63
- Bastian et al. (2010) Bastian, N., Covey, K. R., & Meyer, M. R. 2010, ARA&A, 48, 339
- Bik et al. (2006) Bik, A., Kaper, L., & Waters, L. B. F. M. 2006, A&A, 455, 561
- Calvet et al. (2004) Calvet, N., Muzerolle, J., Briceño, C., et al. 2004, AJ, 128, 1294
- Casali et al. (2007) Casali, M., Adamson, A., Alves de Oliveira, C., et al. 2007, A&A, 467, 777
- Comerón et al. (2008) Comerón, F., Pasquali, A., Figueras, F., & Torra, J. 2008, A&A, 486, 453
- Crowther et al. (2006) Crowther, P. A., Hadfield, L. J., Clark, J. S., Negueruela, I., & Vacca, W. D. 2006, MNRAS, 372, 1407
- Donehew & Brittain (2011) Donehew, B., & Brittain, S. 2011, AJ, 141, 46
- Drilling & Landolt (2000) Drilling, J. S., & Landolt, A. U. 2000, Allen’s Astrophysical Quantities, 381
- Fang et al. (2013) Fang, M., van Boekel, R., Bouwman, J., et al. 2013, A&A, 549, A15
- Fuente et al. (2002) Fuente, A., Martın-Pintado, J., Bachiller, R., Rodrıguez-Franco, A., & Palla, F. 2002, A&A, 387, 977
- Figer et al. (2006) Figer, D. F., MacKenty, J. W., Robberto, M., et al. 2006, ApJ, 643, 1166
- Hanson et al. (1996) Hanson, M. M., Conti, P. S., & Rieke, M. J. 1996, ApJS, 107, 281
- Hanson et al. (2005) Hanson, M. M., Kudritzki, R.-P., Kenworthy, M. A., Puls, J., & Tokunaga, A. T. 2005, ApJS, 161, 154
- Harayama et al. (2008) Harayama, Y., Eisenhauer, F., & Martins, F. 2008, ApJ, 675, 1319
- Hartmann (2009) Hartmann, L. 2009, Accretion Processes in Star Formation: Second Edition, by Lee Hartmann. ISBN 978-0-521-53199-3. Published by Cambridge University Press, Cambridge, UK, 2009.,
- Hayano et al. (2010) Hayano, Y., Takami, H., Oya, S., et al. 2010, Proc. SPIE, 7736,
- Hernández et al. (2005) Hernández, J., Calvet, N., Hartmann, L., Briceño, C., Sicilia-Aguilar, A., & Berlind, P. 2005, AJ, 129, 856
- Hernández et al. (2007) Hernández, J., Hartmann, L., Megeath, T., et al. 2007, ApJ, 662, 1067
- Hoffmeister et al. (2006) Hoffmeister, V. H., Chini, R., Scheyda, C. M., et al. 2006, A&A, 457, L29
- Hrivnak et al. (1994) Hrivnak, B. J., Kwok, S., & Geballe, T. R. 1994, ApJ, 420, 783
- Ishii et al. (2001) Ishii, M., Nagata, T., Sato, S., et al. 2001, AJ, 121, 3191
- Jackson et al. (2006) Jackson, J. M., Rathborne, J. M., Shah, R. Y., et al. 2006, ApJS, 163, 145
- Kantharia et al. (2007) Kantharia, N. G., Goss, W. M., Roshi, D. A., Mohan, N. R., & Viallefond, F. 2007, Journal of Astrophysics and Astronomy, 28, 41
- Kobayashi et al. (2000) Kobayashi, N., Tokunaga, A. T., Terada, H., et al. 2000, Proc. SPIE, 4008, 1056
- Kobayashi et al. (2008) Kobayashi, N., Yasui, C., Tokunaga, A. T., & Saito, M. 2008, ApJ, 683, 178
- Kwok (1993) Kwok, S. 1993, ARA&A, 31, 63
- Lada & Lada (2003) Lada, C. J., & Lada, E. A. 2003, ARA&A, 41, 57
- Lawrence et al. (2007) Lawrence, A., Warren, S. J., Almaini, O., et al. 2007, MNRAS, 379, 1599
- Leggett et al. (2006) Leggett, S. K., et al. 2006, MNRAS, 373, 781
- Lejeune & Schaerer (2001) Lejeune, T., & Schaerer, D. 2001, A&A, 366, 538
- Lodieu et al. (2009) Lodieu, N., Zapatero Osorio, M. R., Rebolo, R., Martín, E. L., & Hambly, N. C. 2009, A&A, 505, 1115
- Lucas et al. (2008) Lucas, P. W., Hoare, M. G., Longmore, A., et al. 2008, MNRAS, 391, 136
- McGregor et al. (1988) McGregor, P. J., Hyland, A. R., & Hillier, D. J. 1988, ApJ, 334, 639
- Mercer et al. (2005) Mercer, E. P., Clemens, D. P., Meade, M. R., et al. 2005, ApJ, 635, 560
- Messineo et al. (2009) Messineo, M., Davies, B., Ivanov, V. D., et al. 2009, ApJ, 697, 701
- Millan-Gabet et al. (2007) Millan-Gabet, R., Malbet, F., Akeson, R., et al. 2007, Protostars and Planets V, 539
- Muzerolle et al. (1998) Muzerolle, J., Hartmann, L., & Calvet, N. 1998, AJ, 116, 2965
- Muzerolle et al. (2005) Muzerolle, J., Luhman, K. L., Briceño, C., Hartmann, L., & Calvet, N. 2005, ApJ, 625, 906
- Najita et al. (2007) Najita, J. R., Carr, J. S., Glassgold, A. E., & Valenti, J. A. 2007, Protostars and Planets V, 507
- Pandey et al. (2008) Pandey, A. K., Sharma, S., Ogura, K., et al. 2008, MNRAS, 383, 1241
- Rayner et al. (2009) Rayner, J. T., Cushing, M. C., & Vacca, W. D. 2009, ApJS, 185, 289
- Reid et al. (2014) Reid, M. J., Menten, K. M., Brunthaler, A., et al. 2014, ApJ, 783, 130
- Reipurth (2008a) Reipurth, B. 2008, Handbook of Star Forming Regions, Volume I
- Reipurth (2008b) Reipurth, B. 2008, Handbook of Star Forming Regions, Volume II
- Pineda et al. (2008) Pineda, J. L., Mizuno, N., Stutzki, J., et al. 2008, A&A, 482, 197
- Santos & Frogel (1997) Santos, J. F. C., Jr., & Frogel, J. A. 1997, ApJ, 479, 764
- Schaerer et al. (1999) Schaerer, D., Contini, T., & Kunth, D. 1999, A&A, 341, 399
- Schröder & Connon Smith (2008) Schröder, K.-P., & Connon Smith, R. 2008, MNRAS, 386, 155
- Scoville et al. (1979) Scoville, N. Z., Hall, D. N. B., Ridgway, S. T., & Kleinmann, S. G. 1979, ApJ, 232, L121
- Scoville et al. (1980) Scoville, N. Z., Krotkov, R., & Wang, D. 1980, ApJ, 240, 929
- Scoville et al. (1983) Scoville, N., Kleinmann, S. G., Hall, D. N. B., & Ridgway, S. T. 1983, ApJ, 275, 201
- Siess et al. (2000) Siess, L., Dufour, E., & Forestini, M. 2000, A&A, 358, 593
- Simons & Tokunaga (2002) Simons, D. A., & Tokunaga, A. 2002, PASP, 114, 169
- Smartt (2009) Smartt, S. J. 2009, ARA&A, 47, 63
- Stolte et al. (2010) Stolte, A., Morris, M. R., Ghez, A. M., et al. 2010, ApJ, 718, 810
- Tokunaga et al. (1998) Tokunaga, A. T., Kobayashi, N., Bell, J., et al. 1998, Proc. SPIE, 3354, 512
- Yasui et al. (2006) Yasui, C., Kobayashi, N., Tokunaga, A. T., Terada, H., & Saito, M. 2006, ApJ, 649, 753
- Yasui et al. (2008a) Yasui, C., Kobayashi, N., Tokunaga, A. T., Saito, M., & Tokoku, C. 2008a, Formation and Evolution of Galaxy Disks, 396, 225
- Yasui et al. (2008b) Yasui, C., Kobayashi, N., Tokunaga, A. T., Terada, H., & Saito, M. 2008b, ApJ, 675, 443
- Yasui et al. (2009) Yasui, C., Kobayashi, N., Tokunaga, A. T., Saito, M., & Tokoku, C. 2009, ApJ, 705, 54
- Yasui et al. (2010) Yasui, C., Kobayashi, N., Tokunaga, A. T., Saito, M., & Tokoku, C. 2010, ApJ, 723, L113
- Yasui et al. (2014) Yasui, C., Kobayashi, N., Tokunaga, A. T., & Saito, M. 2014, MNRAS, 442, 2543
- Williams & Cieza (2011) Williams, J. P., & Cieza, L. A. 2011, ARA&A, 49, 67
- Zinnecker & Yorke (2007) Zinnecker, H., & Yorke, H. W. 2007, ARA&A, 45, 481

Appendix A Additional data of IRCS spectroscopy
In the IRCS spectroscopy of HAeBe 3, two stars (the f1 star and [MDI2009] Quartet 2) are also included in the same slit (see Fig. 1). [MDI2009] Quartet 2 is the same star as the star No.2 in Messineo et al. (2009). The f1 star is located to the 7′′ west of HAeBe 3, while [MDI2009] Quartet 2 is located to the 8′′ east of HAeBe 3. The K band magnitude of the f1 star is estimated to be 13.12 mag in Section 3.1, while that of the [MDI2009] Quartet 2 is 7.58 mag from 2MASS point source catalogue (Messineo et al., 2009). Because the f1 star has a large extinction ( mag; square), it should not be a member but a background star. Because each star is included in the slit in only one position out of two by nodding (see Section 3.2), integration time is 9 min () for both stars. Although the f1 star was almost centered on the slit, [MDI2009] Quartet 2 was a little off center. Spectra of the two stars are shown in Fig. 8. The S/N of the spectra of f1 and [MDI2009] Quartet 2 are 23 and 115, respectively. Considering the S/Ns, lines with equivalent width of 1.4 Å is detected with 3 for the f1 star, while that of 0.3 Å is detected for [MDI2009] Quartet 2.
The spectrum of the f1 star shows CO bandhead absorption, although other lines are weak or not detected. For luminosity class V stars, significant CO bandhead absorption lines are detected in stars later than F-type although the Na absorption line at 2.20 m is also detected comparably in those stars (Rayner et al., 2009). For luminosity class III stars (or earlier), the CO absorption lines are detected in stars later than G-type and Na absorption is very small (EW of 1.4 Å) in stars earlier than mid K-type (Rayner et al., 2009). Therefore, f1 is suggested to be an early K III star. The spectrum of [MDI2009] Quartet 2 shows He I 2.1126 m absorption, N III 2.116 m emission, and Br emission lines, which were all detected by Messineo et al. (2009). In addition, the He II 2.188 m emission line is also detected.
