The optical-UV emissivity of quasars: dependence on black hole mass and radio loudness
Abstract
We analyzed a large sample of radio-loud and radio-quiet quasar spectra at redshift to compare the inferred underlying quasar continuum slopes (after removal of the host galaxy contribution) with accretion disk models. The latter predict redder (decreasing) continuum slopes ( at Å) with increasing black hole mass, bluer with increasing luminosity at 3000Å, and bluer with increasing spin of the black hole, when all other parameters are held fixed. We find no clear evidence for any of these predictions in the data. In particular we find that: (i) shows no significant dependence on black hole mass or luminosity. Dedicated Monte Carlo tests suggest that the substantial observational uncertainties in the black hole virial masses can effectively erase any intrinsic dependence of on black hole mass, in line with some previous studies. (ii) The mean slope of radio-loud sources, thought to be produced by rapidly spinning black holes, is comparable to, or even redder than, that of radio-quiet quasars. Indeed, although quasars appear to become more radio loud with decreasing luminosity, we still do not detect any significant dependence of on radio loudness. The predicted mean slopes tend to be bluer than in the data. Disk models with high inclinations and dust extinction tend to produce redder slopes closer to empirical estimates. Our mean values are close to the ones independently inferred at suggesting weak evolution with redshift, at least for moderately luminous quasars.
Subject headings:
galaxies: active — galaxies: jets — quasars: general1. Introduction
The current accretion paradigm on compact objects (from stellar sources to super-massive black holes) assumes that infalling matter will settle in a rotating disk in which the gas looses its angular momentum via dynamical friction. The disk is usually assumed to be geometrically thin and optically thick (Shakura & Sunyaev, 1973), i.e., each annulus radiates as a black body whose temperature depends on its radius. The resulting spectrum shows a broad peak at a characteristic energy related to the temperature at the inner radii of the disk. In Active Galactic Nuclei (AGN) the disk spectrum peaks in the UV/soft X-rays (the “Big Blue Bump”, e.g., Frank et al., 2002).
The disk model spectra are self–similar in logarithmic plots, and the location of the peak depends on the black hole mass, the accretion rate, and the location of the innermost stable circular orbit (, related to black hole spin). In particular, at fixed accretion rate and , the peak will shift to lower frequencies with increasing black hole mass. Since the peak is expected to lie at wavelengths 3000Å, the peak shift results in a reddening (decrease) of the spectral slope at 3000Å (, Eq. 1). Also, at fixed black hole mass and spin, the peak will shift to higher frequencies with increasing UV luminosity, and the spectral slope will become bluer. Finally, at fixed black hole mass and accretion rate, the peak will shift to higher frequencies with decreasing (i.e. increasing black hole spin), and the slope at UV wavelengths is again expected to become bluer (see, e.g., Figure 2 in Davis & Laor, 2011).
According to some popular models (e.g., Blandford & Znajek, 1977), powerful jets are produced by rapidly spinning black holes. In this framework, the spectral properties of radio-loud and radio-quiet quasars are expected to show significant differences, and may provide valuable insights for testing theoretical expectations.
The main purpose of this letter is to compare the AGN UV spectral slopes with predictions of standard thin-disk models using an improved method to measure the quasar continuum applied to a very large sample.
2. Data
The quasar sample used in this work is a subset of the SDSS DR7 quasar sample discussed in Schneider et al. (2010). The spectral properties of this sample are discussed in the catalog by Shen et al. (2011). However, we re-analyzed all sources with to better account for the host galaxy and the iron complex contributions on each spectrum, and to identify the actual broad band AGN continuum. The details will be presented in a forthcoming paper (Calderone et al. 2016, in preparation), but we provide a brief description here: the SDSS DR10 spectrum of each source is fitted via a model that includes the quasar continuum (modeled as a smoothly broken power law), an elliptical host galaxy template (Mannucci et al., 2001), an optical (Véron-Cetty et al., 2004) and UV (Vestergaard & Wilkes, 2001) iron template, and a list of common broad and narrow emission lines. The smoothly broken power law extends over the entire observed wavelength range, providing a reasonable estimate of the actual AGN continuum. The host galaxy template is chosen to be that of an elliptical galaxy since such galaxies are those usually observed to be the hosts of massive, luminous black holes, based on direct photometric studies (e.g., Falomo et al., 2014) and local scaling relations (e.g., Shankar, 2009; Kormendy & Ho, 2013).
Our catalog thus contains updated continuum (isotropic) luminosities and slopes with respect to the Shen et al. (2011) one, where the host galaxy and iron contributions were neglected. Note that our luminosity and slopes estimates are measured on the smoothly broken power law component that extends over the whole rest-frame observed wavelength range. This implies that the slopes are evaluated on a wider wavelength range with respect to Shen et al. (2011).
The purpose of our spectral analysis is to estimate the underlying quasar continuum slope defined as follows:
| (1) |
calculated at Å (source rest frame).
In the following we will consider several sub–samples of the original Schneider et al. (2010) sample according to either: the virial black hole mass as listed in Shen et al. (2011) derived mainly from MgII in the redshift range of interest to this work; the continuum luminosity and slopes at 3000Å (rest frame) according to the results of our new spectral analysis; and the radio loudness (Jiang et al., 2007) defined as the ratio between the flux density () at 6 cm and 2500Å rest-frame respectively, available for all SDSS quasars matched against the Faint Images of the Radio Sky at Twenty-Centimeters (FIRST) survey at 1.4 GHz (White et al., 1997). We devote specific attention to the difference in spectral slopes between radio-quiet quasars, lying within the footprint of FIRST but with , and very radio-loud sources with , though the exact threshold chosen for radio loudness does not alter any of our conclusions. We also briefly mention results based on “radio morphology” as reported in Shen et al. (2011), in which radio-loud quasars are broadly divided into “FR1” and “FR2” sources (Fanaroff & Riley, 1974), i.e. core– or lobe–dominated (see Jiang et al. 2007 for details).
We will specifically select sources lying in the redshift interval . This redshift window allows for more accurate measurements of the SDSS optical-UV quasar continuum spectra around 3000Å. As detailed in Calderone et al. (2016) in fact, spectral slopes measured with our procedure on quasars with or may be biased due to the limited SDSS wavelength spectral coverage. Finally, Malmquist bias effects and reddening/extinction by intervening cosmic dust (Xie et al., 2015) could become increasing issues at higher redshifts and/or larger redshift bins, further biasing the true distributions of .
3. Disk models
We compare our data with predictions of the non-relativistic, steady-state, geometrically thin, optically thick standard accretion disk Shakura & Sunyaev (1973). In brief, the model first computes the amount of gravitational energy released from each disk annulus of size and, under the assumption of optical thickness, it converts it into a blackbody temperature . The expected frequency-dependent luminosity is then computed as a superposition of blackbody spectra . The physical input parameters in the standard disk model are the innermost stable circular orbit , directly linked to the spin/radiative efficiency, the black hole mass , and the mass accretion rate (e.g., Thorne, 1974; Calderone et al., 2013, and references therein).
We also compare our main observational results with AGNSPEC (Hubeny & Hubeny, 1997; Hubeny et al., 2000, 2001), a self-consistent numerical model for AGN disk spectra as viewed by an observer at a given angle with respect to the axis of rotation. The model properly considers departures from local thermodynamic equilibrium, and takes into account the vertical structure of the disk, as well as relativistic Doppler shifts, gravitational redshifts and light bending in a rotating spacetime (Hubeny et al., 2000). The direct comparison between the predictions from basic disk models and AGNSPEC will allow us to pin down which additional features from the latter (more realistic) models are essential in describing the UV spectra of quasars.
4. Results
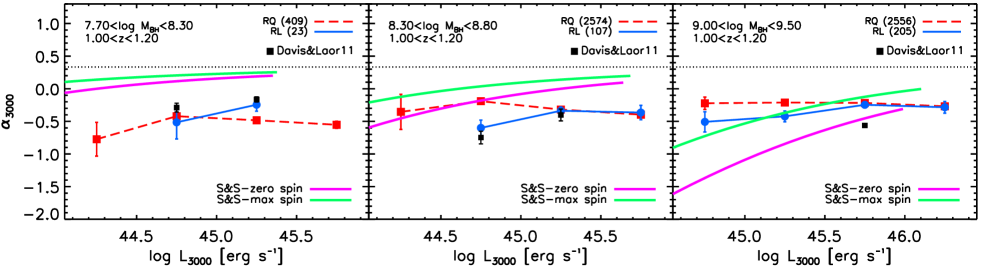
Figure 1 shows the mean (and standard deviation of the mean) as a function of the luminosity at 3000Å (rest frame) for black holes in the range (left), (middle), and (right). We chose bins (in black hole mass and/or luminosity) sufficiently large to enhance statistics but still small enough to provide multiple bins across our parameter space. We note that none of our results depend on the exact binning. In this and all subsequent figures, the total numbers of radio-quiet (red, long-dashed lines) and radio-loud (blue, solid lines) sources is indicated in the legend of each plot. All our data gather around rather constant mean slopes of , quite independently of black hole mass, luminosity, or the quasar radio state. Most of the radio-loud sources share slopes very close to those of radio-quiet sources of similar black hole mass and luminosity. At luminosities below radio sources may tend towards even redder spectra (lower ). We also note that the mean values extracted from our data agree well with those derived at by Davis & Laor (2011) for a sample of 80 PG measured in the interval between 4816Å and 1549Å, at least at lower luminosities, suggesting little redshift evolution in the optical-UV spectral properties of quasars.
We compare our measurements with the predictions of the Shakura & Sunyaev (1973) disk model for a non-rotating, zero spin (red lines) and maximally spinning (green lines) black holes of same mass and luminosity. As already emphasized by a number of previous groups (e.g., Bonning et al., 2007; Davis et al., 2007; Laor & Davis, 2014, and references therein), the results of direct quasar spectral fittings are often at variance with the theoretical expectations of the thin disk model. Our measurements further reinforce this by pointing to rather constant mean values, in apparent conflict with basic predictions from standard accretion disk theory that requires a significant drop of at fixed optical luminosity when moving from low to high-mass black holes, as evident from the models reported in Figure 1 when moving from the left to the right panel.
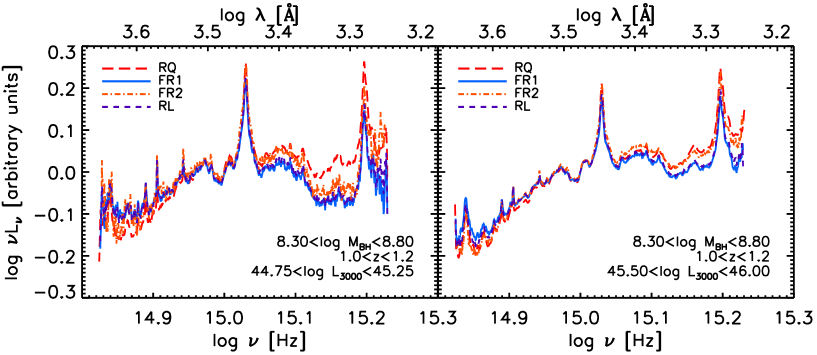
The differences in between radio-loud and radio-quiet quasars, in particular, are not an artifact of the exact spectral fitting procedure and/or on the exact definition of radio loudness. Indeed, such systematic differences are already clearly evident directly on the stacked spectra. Figure 2 reports the stacked spectra of radio-quiet and radio-loud quasars with black hole masses in the range at , and normalized at Å. Irrespective of the exact subsample of radio sources, either FR1, FR2, or simply based on their radio loudness (here we report sources with to increase the statistics), all radio-detected sources show systematically redder profiles (lower ) with respect to their radio-quiet counterparts. This difference is however more marked for less luminous sources (left panel), while it progressively disappears for brighter sources (right panel), in agreement with Figure 1.
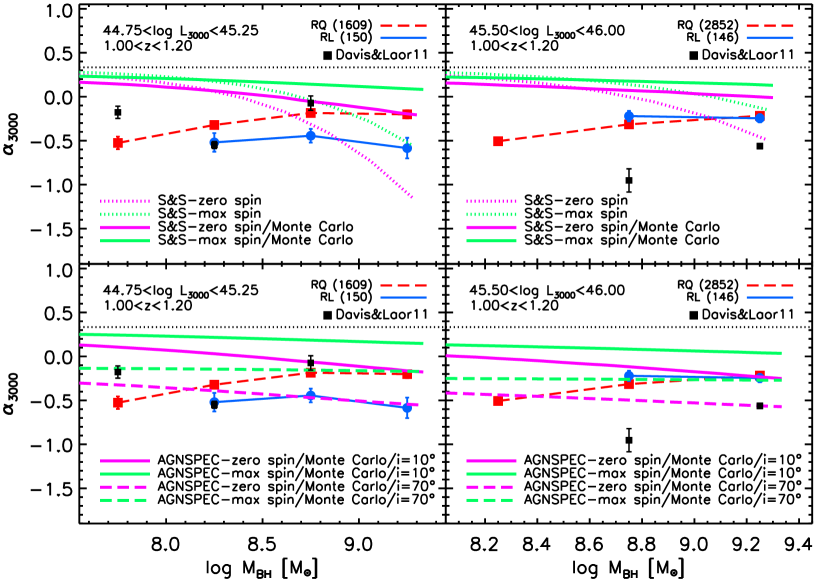
Figure 3 further compares model predictions against SDSS data by specifically plotting the behavior of as a function of black hole mass for quasars in the narrow bins of optical luminosity (left) and (right). Our measured is rather flat, or even slightly bluer with increasing black hole mass in the range , in nice agreement with the values for between inferred by Davis et al. (2007, their Figure 3), who also emphasized very weak dependence on black hole mass. Similarly, Selsing et al. (2015) recently constructed a composite spectrum for very luminous quasars at from UV to near-infrared deriving a mean slope of .
As anticipated in Figure 1 the standard disk models (upper panels) with zero and maximal spin (magenta and green dotted lines) predict a steady reddening of with increasing black hole mass at fixed luminosity. The substantial uncertainties in virial black hole mass estimates of dex (e.g., Shen & Liu, 2012, and references therein), could however have a non-negligible impact on the comparison between models and data. To probe this, we performed a series of Monte Carlo tests. We started by randomly extracting a very large number of black holes from the Type 1 corrected active black hole mass function at by Schulze et al. (2015). To these we associated an Eddington ratio taken from a power-law with broad exponential cut-off distribution (Shankar et al., 2013), typical of AGN at these redshifts (e.g., Bongiorno et al., 2012). We also experimented with different shapes for the underlying black hole mass function or Eddington ratio distribution without finding any strong change in the main outcomes of our tests. Bolometric luminosities were then converted to adopting the quasar bolometric corrections by Runnoe et al. (2012), . We then ran a few hundred realizations assigning at each iteration random Gaussian errors to black hole masses and luminosities with widths of dex and dex, respectively, and then computed the resulting mean over all realizations as a function of black hole mass and luminosity. The results of the test, marked by solid, magenta and green lines in the upper panels of Figure 3, show that “flattens out”, becoming significantly bluer at large black hole masses, aligning better with the data (though still predicting bluer slopes, especially at higher luminosities). This is expected given the significantly higher number densities of lower mass black holes coupled to the large errors in black hole masses assumed in the tests. These results agree well with those by Davis et al. (2007) who also showed that large errors in black hole virial masses can effectively erase most of the dependence of UV slopes on black hole mass.
The lower panels of Figure 3 show the comparisons of our data with the AGNSPEC disk predictions with two extreme values of the input inclinations ( and , solid and long-dashed lines, respectively). We verified that models with more realistic random input orientations fall within these two extreme cases. Models with low inclinations are in good agreement with those from basic blackbody models (solid lines in the upper panels), while the predicted slopes tend to significantly decrease when assuming progressively higher inclinations. Interestingly, we identified a degeneracy among models characterized by low inclination/low spin and high inclination/high spin (purple solid and green dot-dashed lines, respectively). While high spin models show bluer slopes due to the smaller inner disk radius, the redder UV slopes for viewing angles near the disk plane are mostly due to limb darkening effects.
We have also checked that including dust extinction in the predicted quasar spectra yields redder spectra further contributing to the degeneracy with inclination and spin. In particular, modeling the extinction curve as (e.g., Capellupo et al., 2015) yields . Higher values of the extinction in quasars are also possible (e.g., Stern & Laor, 2012). Rapidly spinning black holes need in general high inclinations with some degree of extinction to match the data. Black holes with retrograde spins may also yield redder slopes.
Other systematics may arise from adopting different input galaxy spectra. To check for this effect, we randomly selected quasar subsamples of different black hole mass and luminosity at , and refitted the quasar spectra adopting the star-forming host galaxy template of Arp220 (e.g., Polletta et al., 2007). Despite this template being more prominent in the UV with respect to our reference elliptical template (Section 2), we found resulting slopes on average bluer by a relatively modest . This effect could anyway be significantly reduced by extinction.
We finally note that the complexities behind the exact modeling of absorption/emission features such as those from FeII/III groups, may limit the precision of our continuum measurements, though we do not expect them to significantly alter any of our results.
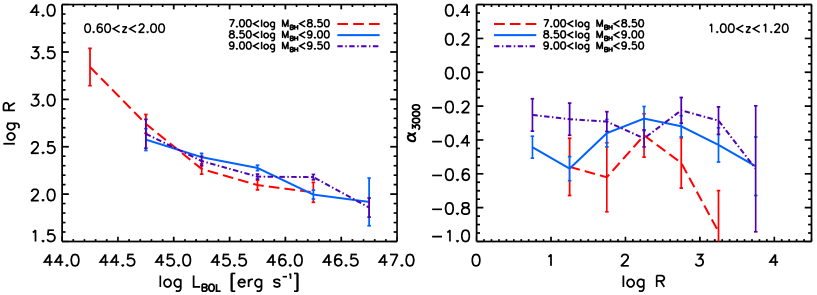
In Figure 4 we further investigate the connection between spectra and radio loudness in specifically radio-loud quasars. There are clear trends (left panel) that the mean radio loudness decreases with increasing luminosity, and thus ultimately accretion rate (e.g., Sikora et al., 2007, 2013). These trends hold irrespective of the exact black hole mass or redshift interval. However, the slope (right panel) shows no clear dependence on radio loudness , at least for the radio-loud quasars in the interval .
5. Discussion
Our analysis of quasar spectra at pointed to rather constant and red mean values of the UV slope in the range with a mild dependence on black hole mass. This (lack of) trend, we showed, is most probably induced by the significant uncertainties in black hole mass estimates (Figure 3), while including high inclinations and extinction can align the predicted to the redder slopes derived from the data.
We also find that the vast majority of radio-loud quasars have comparable or even redder slopes with respect to optical quasars of similar black hole mass and accretion rate. This finding is of particular interest to the still unsolved issue of the origin of radio-loudness (e.g., Sikora et al., 2007; Körding et al., 2008; Merloni & Heinz, 2008; Shankar et al., 2010; Kratzer & Richards, 2015). If radio-loud quasars are characterized by systematically higher spins than radio-quiet quasars, they would in fact be expected to show bluer UV slopes (Section 1), in contrast to our data. Interestingly, Punsly (2014) has also reported a “deficit” in the UV spectra of radio-loud quasars between 1100Å and 580Å, which might reflect what we observe in SDSS at longer wavelengths. If this spectral distortion is linked to local energy dissipation due to a large-scale magnetic flux (Punsly, 2014), it should moderately scale with the spin and/or radio loudness, while no clear correlation is detected in our data between and radio loudness (Figure 4). Additional causes for a weak spectral dependence on spin and general spectral distortions may be related to AGN wind losses (e.g., Laor & Davis, 2014; Slone & Netzer, 2012).
There are a number of cases in which the Shakura & Sunyaev (1973) models have been successfully applied to describe quasar spectra (Shields, 1978; Kishimoto et al., 2008; Capellupo et al., 2015). However, our results add to the mounting evidence for some disagreement between standard disk models and data derived from direct spectral fitting (e.g., Bonning et al., 2007; Davis et al., 2007; Slone & Netzer, 2012), quasar microlensing (e.g., Dai et al., 2010), or lags measured from correlated X-ray/UV/optical monitoring of AGN (e.g., McHardy et al., 2014).
Acknowledgments
We thank Ivan Hubeny and Eric Agol for their AGNSPEC and Kerrtrans9 codes and Omar Blaes for general help. We warmly thank Shane Davis and Ari Laor for very useful comments and for sharing their data. We also thank Gordon Richards for discussions and an anonymous referee for helpful comments that improved the clarity of the paper.
References
- Blandford & Znajek (1977) Blandford, R. D., & Znajek, R. L. 1977, MNRAS, 179, 433
- Bongiorno et al. (2012) Bongiorno, A., Merloni, A., Brusa, M., et al. 2012, MNRAS, 427, 3103
- Bonning et al. (2007) Bonning, E. W., Cheng, L., Shields, G. A., Salviander, S., & Gebhardt, K. 2007, ApJ, 659, 211
- Calderone et al. (2013) Calderone, G., Ghisellini, G., Colpi, M., & Dotti, M. 2013, MNRAS, 431, 210
- Capellupo et al. (2015) Capellupo, D. M., Netzer, H., Lira, P., Trakhtenbrot, B., & Mejía-Restrepo, J. 2015, MNRAS, 446, 3427
- Dai et al. (2010) Dai, X., Kochanek, C. S., Chartas, G., et al. 2010, ApJ, 709, 278
- Davis & Laor (2011) Davis, S. W., & Laor, A. 2011, ApJ, 728, 98
- Davis et al. (2007) Davis, S. W., Woo, J.-H., & Blaes, O. M. 2007, ApJ, 668, 682
- Falomo et al. (2014) Falomo, R., Bettoni, D., Karhunen, K., Kotilainen, J. K., & Uslenghi, M. 2014, MNRAS, 440, 476
- Fanaroff & Riley (1974) Fanaroff, B. L., & Riley, J. M. 1974, MNRAS, 167, 31P
- Frank et al. (2002) Frank, J., King, A., & Raine, D. J. 2002, Accretion Power in Astrophysics: Third Edition
- Hubeny et al. (2000) Hubeny, I., Agol, E., Blaes, O., & Krolik, J. H. 2000, ApJ, 533, 710
- Hubeny et al. (2001) Hubeny, I., Blaes, O., Krolik, J. H., & Agol, E. 2001, ApJ, 559, 680
- Hubeny & Hubeny (1997) Hubeny, I., & Hubeny, V. 1997, ApJ, 484, L37
- Jiang et al. (2007) Jiang, L., Fan, X., Ivezić, Ž., et al. 2007, ApJ, 656, 680
- Kishimoto et al. (2008) Kishimoto, M., Antonucci, R., Blaes, O., et al. 2008, Nature, 454, 492
- Körding et al. (2008) Körding, E. G., Jester, S., & Fender, R. 2008, MNRAS, 383, 277
- Kormendy & Ho (2013) Kormendy, J., & Ho, L. C. 2013, ARA&A, 51, 511
- Kratzer & Richards (2015) Kratzer, R. M., & Richards, G. T. 2015, AJ, 149, 61
- Laor & Davis (2014) Laor, A., & Davis, S. W. 2014, MNRAS, 438, 3024
- Mannucci et al. (2001) Mannucci, F., Basile, F., Poggianti, B. M., et al. 2001, MNRAS, 326, 745
- McHardy et al. (2014) McHardy, I. M., Cameron, D. T., Dwelly, T., et al. 2014, MNRAS, 444, 1469
- Merloni & Heinz (2008) Merloni, A., & Heinz, S. 2008, MNRAS, 388, 1011
- Polletta et al. (2007) Polletta, M., Tajer, M., Maraschi, L., et al. 2007, ApJ, 663, 81
- Punsly (2014) Punsly, B. 2014, ApJ, 797, L33
- Runnoe et al. (2012) Runnoe, J. C., Brotherton, M. S., & Shang, Z. 2012, MNRAS, 422, 478
- Schneider et al. (2010) Schneider, D. P., Richards, G. T., Hall, P. B., et al. 2010, AJ, 139, 2360
- Schulze et al. (2015) Schulze, A., Bongiorno, A., Gavignaud, I., et al. 2015, MNRAS, 447, 2085
- Selsing et al. (2015) Selsing, J., Fynbo, J. P. U., Christensen, L., & Krogager, J.-K. 2015, ArXiv e-prints, arXiv:1510.08058
- Shakura & Sunyaev (1973) Shakura, N. I., & Sunyaev, R. A. 1973, A&A, 24, 337
- Shankar (2009) Shankar, F. 2009, New Astron. Rev., 53, 57
- Shankar et al. (2010) Shankar, F., Sivakoff, G. R., Vestergaard, M., & Dai, X. 2010, MNRAS, 401, 1869
- Shankar et al. (2013) Shankar, F., Weinberg, D. H., & Miralda-Escudé, J. 2013, MNRAS, 428, 421
- Shen & Liu (2012) Shen, Y., & Liu, X. 2012, ApJ, 753, 125
- Shen et al. (2011) Shen, Y., Richards, G. T., Strauss, M. A., et al. 2011, ApJS, 194, 45
- Shields (1978) Shields, G. A. 1978, Nature, 272, 706
- Sikora et al. (2013) Sikora, M., Stasińska, G., Kozieł-Wierzbowska, D., Madejski, G. M., & Asari, N. V. 2013, ApJ, 765, 62
- Sikora et al. (2007) Sikora, M., Stawarz, Ł., & Lasota, J.-P. 2007, ApJ, 658, 815
- Slone & Netzer (2012) Slone, O., & Netzer, H. 2012, MNRAS, 426, 656
- Stern & Laor (2012) Stern, J., & Laor, A. 2012, MNRAS, 423, 600
- Thorne (1974) Thorne, K. S. 1974, ApJ, 191, 507
- Urry & Padovani (1995) Urry, C. M., & Padovani, P. 1995, PASP, 107, 803
- Véron-Cetty et al. (2004) Véron-Cetty, M.-P., Joly, M., & Véron, P. 2004, A&A, 417, 515
- Vestergaard & Wilkes (2001) Vestergaard, M., & Wilkes, B. J. 2001, ApJS, 134, 1
- White et al. (1997) White, R. L., Becker, R. H., Helfand, D. J., & Gregg, M. D. 1997, ApJ, 475, 479
- Xie et al. (2015) Xie, X., Shen, S., Shao, Z., & Yin, J. 2015, ApJ, 802, L16