Is the Escape Velocity in Star Clusters Linked to Extended Star Formation Histories? Using NGC 7252: W3 as a Test Case
Abstract
The colour-magnitude diagrams of some intermediate-age clusters (1–2 Gyr) star clusters show unexpectedly broad main-sequence turnoffs, raising the possibility that these clusters have experienced more than one episode of star formation. Such a scenario predicts the existence of an extended main sequence turn off (eMSTO) only in clusters with escape velocities above a certain threshold ( km s-1), which would allow them to retain or accrete gas that eventually would fuel a secondary extended star-formation episode. This paper presents a test of this scenario based on the study of the young and massive cluster NGC 7252: W3. We use the HST photometry from WFPC2 and WFC3 images obtained with UV and optical filters, as well as MagE echellette spectrograph data from the Las Campanas Clay 6.5m telescope, in order to construct the observed UV/optical SED of NGC 7252: W3. The observations are then compared with synthetic spectra based on different star formation histories consistent with those of the eMSTO clusters. We find that the SED of this cluster is best fitted by a synthetic spectrum with a single stellar population of age Myr and mass M⊙, confirming earlier works on NGC 7252:W3. We also estimate the lower limit on the central escape velocity of 193 km s-1. We rule out extended star-formation histories, like those inferred for the eMSTO clusters in the Magellanic Clouds, at high confidence. We conclude that the escape velocity of a cluster does not dictate whether a cluster can undergo extended periods of star formation.
keywords:
globular clusters: general – galaxies: star clusters: general – galaxies: star clusters: individual: W31 Introduction
In the last decade, precise photometry of stars in several intermediate-age (1–2 Gyr) clusters in the Small and Large Magellanic Clouds (SMC and LMC) has revealed an extended main-sequence turnoff (eMSTO) in their optical colour–magnitude diagrams (CMDs). Many studies have interpreted these observations as extended episodes of star formation lasting hundreds of Myr (e.g. Mackey & Broby Nielsen 2007; Mackey et al. 2008; Goudfrooij et al. 2011b, a; Milone et al. 2009; Rubele et al. 2013). To sustain extended or multiple episodes of star formation a cluster needs to be able to retain stellar ejecta or acquire new gas, which poses limits on the escape velocities of clusters hosting eMSTO. The current escape velocities of the clusters hosting eMSTOs are modest (3–20 km s-1, see Goudfrooij et al. 2011a), and in many cases are below those estimated for young massive clusters that do not show evidence for extended star-formation episodes lasting Myr (Bastian & Silva-Villa, 2013; Longmore et al., 2014; Kruijssen, 2014).
However, Goudfrooij et al. (2011b) have suggested that the intermediate-age clusters may have lost a significant fraction of their stars since their birth, hence their initial escape velocities were much higher, potentially km/s, which the authors claim is a limit above which clusters can retain their stellar ejecta. In this scenario, a first generation of stars forms in a near instantaneous burst, which is then followed by a lull that lasts between a few Myr and a few hundred Myr, and then by a further Gaussian-shaped extended star formation episode that lasts a few hundred Myr. In order to have enough matter available to form the second generation of stars a large amount of material needs to be accreted from the clusters’ surroundings, because the material shed by the first generation is not sufficient to form the observed numbers of second generation stars. However, we note that a plausible mechanism for this accretion has not yet been identified.
A link between the eMSTO phenomenon in intermediate-age clusters and the chemical anomalies found in globular clusters (GCs, see Gratton et al. 2012) has been proposed, suggesting a common evolution of massive clusters independent of the environment and time of formation (e.g. Keller et al. 2011; Conroy & Spergel 2011; Goudfrooij et al. 2011a, b; Goudfrooij et al. 2014, hereafter G11a,b and G14). The above scenario and its link with multiple populations in GCs have been tested by searching for abundance spreads within the eMSTO clusters, which are expected to be observed if these clusters are self-enriched. However, no evidence for abundance spreads have been found in the clusters with eMSTOs (Mucciarelli et al. 2008, 2014, Mackey et al. in prep.). Hence, self-enrichment is unlikely to have happened in the eMSTO clusters, and the eMSTO phenomenon does not appear to be linked to multiple populations in GCs.
The lack of ongoing star formation within young ( Gyr) massive ( M⊙) clusters (YMCs) and the lack of extended star formation histories (SFHs) in resolved YMCs in the LMC are seemingly at variance with the age spreads inferred from the eMSTOs (Bastian & Silva-Villa, 2013; Niederhofer et al., 2015c). In addition, some post-main-sequence evolutionary phases (e.g. the subgiant branch and red clump) of eMSTO clusters appear to be incompatible with the extended SFHs inferred from the analysis of their turnoffs (Bastian & Niederhofer 2015; Li et al. 2014; Niederhofer et al. 2015a, although see Goudfrooij et al. 2015). This may indicate that alternative explanations are needed for these phenomena such as stellar evolutionary effects, e.g. stellar rotation, as has been suggested and explored by Bastian & de Mink (2009), Li et al. (2014) and Brandt & Huang (2015b).
In two recent studies of the resolved stellar populations in the young ( Myr) massive ( M⊙) LMC cluster NGC 1856 (Milone et al., 2015; Correnti et al., 2015), the authors found evidence for an eMSTO at young ages for the first time. Although these authors suggest a prolonged star-formation episode as the origin of the eMSTO, further analyses of post-main-sequence stars are necessary to see whether they are in agreement with this interpretation. However, note that the proposed duration of the secondary star-formation episode is significantly shorter than that inferred for the 1–2 Gyr old clusters. Niederhofer et al. (2015a) have shown that there is a strong relation between the age of the cluster and the inferred age spread, suggesting that stellar evolutionary effects are the cause of the eMSTO phenomenon.
It has been suggested that the intermediate-age (1–2 Gyr) cluster population found in the LMC/SMC arose after these galaxies underwent a strong starburst during this epoch due to a three-body interaction with the Milky Way (G14). However, estimates of the SFH for both galaxies do not show clear evidence for such a burst, as the star-formation rate seems to be constant during this period within a factor of , cf. Harris & Zaritsky (2009); Weisz et al. (2013). The scenarios that propose extended star formation episodes as the origin of the eMSTO, also suggest that massive intermediate-age clusters, due to their large initial gravitational potential wells, were capable of retaining (and accreting) gas from which a second stellar generation was formed. Accordingly, one should see—in young massive clusters with escape velocities in excess of km s-1—clear signatures of younger generations of stars that formed after the initial, main burst in their integrated colours and SEDs. In this paper, we address the issue of the origin of the eMSTO of intermediate-age clusters by analysing the SED of W3, a YMC in the merger remnant NGC 7252 that has an escape velocity in excess of 193 km s-1.
The cluster NGC 7252: W3 is an excellent candidate to test these scenarios given that with a mass of M⊙ (Schweizer & Seitzer, 1998; Maraston et al., 2004) it is the most massive young cluster known to date. The age of W3 is constrained by numerical simulations of NGC 7252, which suggest that its last major merger event took place about 600 Myr ago (Hibbard & Mihos, 1995; Chien & Barnes, 2010). This event has been proposed to trigger the star formation episode that gave birth to the YMC population observed in NGC 7252 (Whitmore et al., 1993; Miller et al., 1997; Schweizer & Seitzer, 1998). The age of Myr for W3, places it right in the range when the extended star-formation episode should be going on (or just have ceased), according to the SFHs inferred for eMSTO clusters by G14. All this makes this cluster ideal to test whether the eMSTO of intermediate-age clusters has its origin in extended periods of star formation.
The paper is organised as follows: In §2 we present the HST photometry and the MagE spectrum of W3. In §3 we show the procedure used to estimate the age, mass and escape velocity of W3. The experiments with synthetic SEDs are described in §4. Finally, we discuss our results and present our conclusions in §5 and §6, respectively.
2 Data
We took the WFC3 photometry of W3 from Bastian et al. (2013a) (bands and ).111HST programme GO-11554 (PI: Bastian; see Bastian et al. 2013a)Additionally, we performed aperture photometry on WFPC2 images taken with the filters , and .222HST programme GO-5416 (PI: Whitmore; see Miller et al. 1997). The HST pipeline processed images were first cleaned from cosmic rays by using the LACOS IRAF333IRAF is distributed by the National Optical Astronomy Observatories, which is operated by the Association of Universities for Research in Astronomy, Inc., under cooperative agreement with the National Science Foundation. routine (van Dokkum, 2001), and then we performed aperture photometry with the task PHOT from DAOPHOT under IRAF adopting the same aperture sizes as Bastian et al. (2013a), i.e. a circular aperture with 0.4″ radius centred on W3 and a sky annulus of inner radius 1.325″ with a width of 0.25″. The results of our photometry on the WFPC2 images can be found in Table 1.
| (mag) | (mag) | (mag) | (mag) |
A spectrum of this cluster was obtained on Aug 23rd of 2009 with the MagE echellette spectrograph (Marshall et al., 2008) on the Clay 6.5-m telescope at Las Campanas. The slit was placed across the cluster at parallactic angle. The 2.3 hr total exposure was broken into seven 20 minute subexposures, during which the airmass decreased from 1.49 to 1.04 and the seeing was . To permit flux calibration, six standard stars were also observed at parallactic angle throughout the night.
The reduction of the MagE spectrum included pipeline processing to flat-field and coadd frames, rectify spectral orders, calibrate wavelengths, and subtract the galaxy-plus-sky background spectrum. The final extracted spectrum of W3 covers the wavelength range 3300 – 8250 Å, extracted from orders 18 – 8, at a spectral resolution of . Due to small wiggles in the spectral continuum introduced by the digital splicing together of the various overlapping orders, we here restrict our use of the spectrum to its highest-quality range of 3300 – 5500 Å. However, the overall SED of W3 is a good representation of the actual flux levels of this cluster, as we will show via the good agreement with HST photometry in §4 (see below).
3 Age and mass of NGC 7252: W3
We used DynBaS, a Dynamical Basis Selection spectral fitting algorithm (Cabrera-Ziri et al., 2014; Magris et al., 2015) to recover the SFH of W3. Basically, the DynBaS algorithm finds the best simple stellar population (SSP) template or the best linear combination of two or three SSPs templates to fit the target spectrum (with their relative weights/masses). Here, we outline briefly the basics of our spectral fitting of W3 and refer the reader interested in a more detailed discussion of the limitations and uncertainties of our technique to the publications cited above.
We performed three different fits to W3 data:
-
1.
HST broad band photometry: This was a full SED fit using the HST’s WFPC2 and WPC3 photometry described in §2 and assuming an mag,444this value was derived from the reported in Bastian et al. (2013a) and assuming from Jordán et al. (2004). and a distance to NGC 7252 of 64 Mpc (Bastian et al., 2013a). The results of all fits are presented in Table 2.555We also carried out the fit including the photometry from Maraston et al. (2001) and find that the results are unaffected.
Table 2: Results of DynBaS fitting: Ages and masses of each of the fit components, mass weighted ages, and total masses. Fit Solution /M1 /M2 /M3 (a) M (Myr / %) (Myr / %) (Myr / %) (Myr) (M⊙) HST DynBaS1D 509 / 100 509 photometry DynBaS2D 453 / 4.3 509 / 95.7 506 DynBaS3D 453 / 65.3 719 / 14.4 5,750 / 20.3 815 MagE DynBaS1D 571 / 100 571 spectrum DynBaS2D 404 / 9.4 13,750 / 90.6 9,883 DynBaS3D 360 / 2.6 404 / 6.2 13,750 / 91.2 10,057 MagE DynBaS1D 571 / 571 - normalized DynBaS2D 508 / 8,500 / 619 - spectrum(b) DynBaS3D 508 / 1,700 / 8,500 / 589 - (a) , with
(b) Since there was no continuum in this spectrum we are not able to retrieve masses. -
2.
MagE spectrum: This was also a full SED fit, using this time the flux-calibrated MagE spectrum instead of the HST photometry, and assuming the same and distance as above. The results of these fits are shown in Fig. 1. From this figure, we can see that there is a slight offset between the SED and the synthetic stellar populations fitted by DynBaS. In order to determine whether these observed differences are due to the issues on the continuum calibration mentioned in §2, we decided to carry out an additional fit after normalizing the continuum, in order to assess the robustness of our age determination.
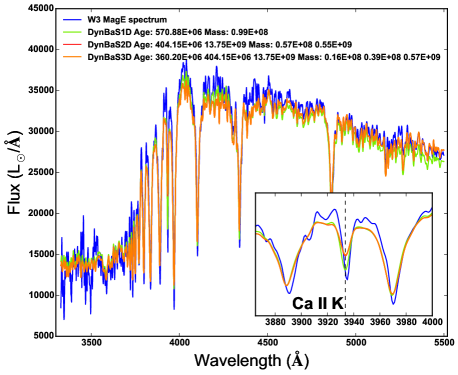
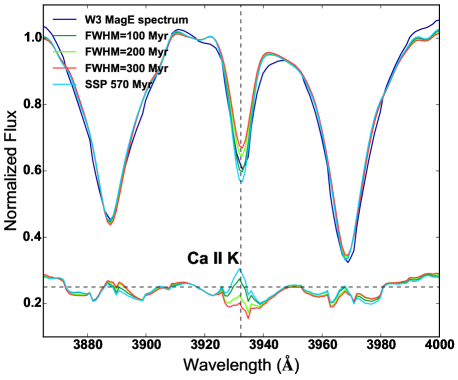
Figure 1: DynBaS1D, DynBaS2D and DynBaS3D fits (see the text) to the MagE spectrum of Cluster W3. The DynBaS fits presented here were obtained using stellar population models of solar metallicity. See text for a discussion of these results. -
3.
MagE continuum-normalized spectrum: We normalized the continuum of W3’s SED for our fitting. To obtain the continuum we ran a median filter of 100 Å width over the cluster spectrum, masking 2000 km s-1 around the core of each Balmer line. Then we normalized the continuum for each SSP spectrum comprised in the Bruzual & Charlot (2003) models, using again a median filter with the same width and mask as we used for the observed spectrum. Next, we divided each model SED by its respective continuum. The spectral fit was then carried out on the normalized spectrum of W3 with the normalized SSP model spectra. The results of these fits are shown in Fig. 2.
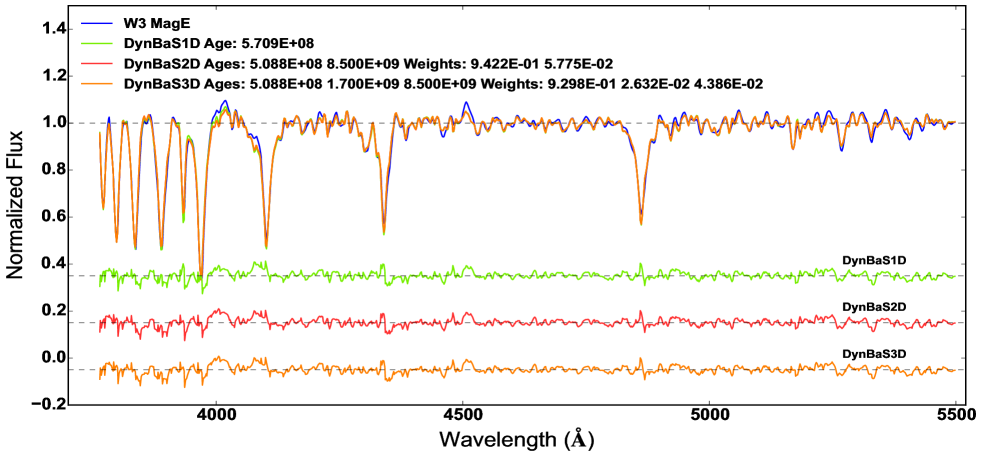
Figure 2: DynBaS1D, DynBaS2D and DynBaS3D fits to the continuum-normalised spectrum of W3. The DynBaS fits presented here were obtained using BC03 models of solar metallicity. On the bottom we plot the residuals (data - DynBaS fits) in the same vertical scale with 3 different offsets for clarity. The three solutions provide virtually the same spectrum. We can rule out the DynBaS2D and DynBaS3D solutions using the same arguments that were used for NGG 34: S1, see text for details.
Table 2 shows that all DynBaS1D solutions (i.e. best-fitting SSPs) are rather precise, i.e. in agreement within Myr of each other. Both fits of the MagE spectrum (unnormalized and normalized) yield a cluster age of 571 Myr, while the fit to the HST broad-band photometry yields a somewhat younger age of 509 Myr.
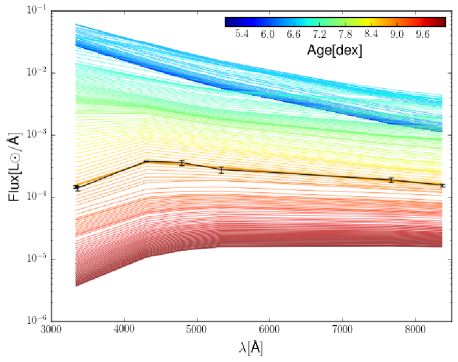
For both the photometry and the MagE spectrum fits, we see that the multiple-population solutions (i.e. DynBaS2D and DynBaS3D) consist of a young population relatively close in age to the SSP solution, i.e. about 500 Myr, and an old ( Gyr) population with a significant fraction of the total mass. The origin of these old components in the DynBaS fits is simple. Basically, they come from the fact that the mass-luminosity ratio increases with time for an SSP evolving passively, i.e. without any subsequent star formation events. This is shown in Fig. 3, where we plot the evolution of an SSP for a fixed mass. As the figure shows, the old ( Gyr) populations are at least an order of magnitude fainter than a population of the same mass but younger age (i.e. few hundred Myr). Due to this, it is possible to allocate considerable important fractions of the mass into these old components during the fits, without affecting the overall SED of the younger populations in a significant way. In other words, if any component of the fit is attributed to an old population, due to the high mass to light ratio, it will necessarily be given a high mass.
However, although the overall multiple-population SED might appear to be in good agreement with the SED of the W3 and/or the SSP solution, we emphasize that the solutions with significant fractions of older components do not accurately reproduce the Ca ii K line, a spectral feature that is highly age sensitive (cf. Fig. 1, more on this in §5).
As was also found for the YMC NGC 34: S1 in Cabrera-Ziri et al. (2014), the multiple stellar-population solutions from the continuum-normalized spectral fit require a very old and low-mass burst to have happened Gyr ago, after which the cluster suffered a huge burst of 13–15 times the mass of the old population at a young ( Myr) age. These kinds of solutions would appear to be rather exotic, as discussed in Cabrera-Ziri et al. (2014). Very old populations arise when the code is forced to retrieve a multiple stellar-population solution, as they artificially improve the residuals between the observed spectrum and the stellar population templates on a very small level (i.e. less that tenths of reduced ).
We carried out fits to the continuum-normalized spectrum of W3 using Bruzual & Charlot (2003) models with metallicities of , 1 and 2.5 (, 0 and 0.4), and we found that the best fits to the spectrum (specifically, the 5100–5400 Å region which hosts a number of important metallicity indicators, including Mg, Fe5270, Fe5335; González 1993) were with the templates, as also found by Schweizer & Seitzer (1998).
Given that the DynBaS SSP solution for the continuum-normalized spectrum yields the most accurate fit of all our experiments, we adopt this solution, Myr, as the age of W3. Having derived the age, we are able to infer the cluster mass, scaling the SSP of 570 Myr to the HST photometry (corrected for extinction and distance). The match between W3 photometry and the SSP template of 570 Myr is also shown in Fig. 3. Additionally, we use this figure to make a conservative estimate of the uncertainties in age/mass. We adopt as uncertainties the values of the youngest/oldest SSP ages that lie within the photometric error bars. This yields an age for W3 of Myr and a mass of M⊙ (we discuss the possible degeneracies of our age determination, in Appendix A).
These results are consistent with those from previous studies of this cluster. For example, Schweizer & Seitzer (1998) found an age of Myr and a mass of M⊙, a similar analysis by Maraston et al. (2001) found an age of Myr while Maraston et al. (2004) estimated the dynamical mass of W3 to be M⊙.
3.1 Escape velocity of NGC 7252: W3
We use equation (1) from Georgiev et al. (2009):
to estimate the current escape velocity of W3. Here, is a coefficient which takes into account the dependence of the escape velocity on the density profile of the cluster, i.e. its concentration where and are the tidal and core radius of the cluster, respectively.
Georgiev et al. (2009) computed for King (1962) models by deprojecting the density profile and then calculating the potential as a function of radius. In order to estimate a lower limit to the escape velocity of this cluster, we adopted the smallest value for reported by these authors in their Table 2, i.e. 0.076. We adopt an effective radius (Maraston et al., 2004) and a cluster mass as determined above. With these values, we get km s-1 for W3, well above the km s-1 limit proposed by G11b as the threshold for any extended star-formation episode to happen (which would be responsible for the eMSTO observed in intermediate-age clusters).
We emphasize that this value represents a lower limit as is likely higher for this cluster. According to Bastian et al. (2013a) the tidal radius is pc for W3. From Table 1 in G14, we derive that the mean value of . Assuming that the core radius is , this leads to log, which would correspond to a , leading to a much larger km s-1 for W3.
4 Synthetic SED experiments
Having determined that the SFH of W3 is consistent with an SSP of 570 Myr, in this section we test how the SEDs built by using the SFHs of eMSTO clusters inferred by G14 compare to the observed SED of W3. With these experiments, we explore whether the inferred SFHs from eMSTO clusters are also compatible with the SED of this cluster, which satisfies all the characteristics of an eMSTO cluster of this age ( Myr), namely:
-
1.
It has the age when a second episode of star formation is expected to have happened recently or be happening.
-
2.
Currently it has an escape velocity well above the threshold suggested by G11b as being necessary to retain/accrete gas from which the second stellar generation will form.
This makes W3 suitable to undergo, or have recently undergone, the extended star-formation episode responsible for eMSTOs according to some authors (e.g. G14 and Correnti et al. 2015).
All the synthetic SEDs in this section and the previous one (i.e. SED fitting) were built by using Bruzual & Charlot (2003) stellar-population models of , assuming a Chabrier (2003) IMF, and computing models with ‘Padova 1994’ evolutionary tracks (Alongi et al., 1993; Bressan et al., 1993; Fagotto et al., 1994a, b; Girardi et al., 1996) and the stellar library STELIB (Le Borgne et al., 2003). All synthetic SEDs were attenuated with the extinction value reported for W3, mag, by using a Cardelli et al. (1989) extinction law and .
4.1 Experiments with Goudfrooij et al. (2014) SFHs
G14 analyse the eMSTOs of 18 intermediate-age clusters in the Magellanic Clouds, and report SFHs for all clusters that consist of a first, instantaneous massive burst followed by an extended period of star formation, equivalent to a small fraction of the mass of the first burst.
We would like to emphasize that the SFHs directly inferred from the eMSTO (referred by these authors as pseudo-age distributions) have little evidence of a large initial burst. From Figs. 2, 3 and 4 of G14, we see that only an extended episode of star formation is found which can be represented reasonably well by a Gaussian distribution with a FWHM of Myr for most clusters. However, without an initial burst this would represent a problem regarding the build up of the mass of this extended star formation episode. This is because if there is no first generation, there would not be a potential well that could accrete and retain the gas from which the next generation of stars are going to be born (i.e. it would take hundreds of Myr for the clusters to build up enough mass to exceed the suggested limit of 15 km s-1 escape velocity). In G14 they solve this problem invoking a first generation of stars which will be lost nearly entirely after the second episode of star formation takes place. By doing this they are able to build up such extended star formation episode and simultaneously match the inferred pseudo-age distributions from the eMSTO with no signs of an older and massive population.
For the present experiments, we have built the SEDs of synthetic clusters according to the same kind of star-formation episodes, i.e. a first, instantaneous burst of star formation at 570 Myr (i.e. the age recovered by DynBaS for W3) contributing most of the mass of the cluster, followed by an extended, Gaussian-shaped star-formation episode with a fraction of the mass of the first burst. We have made a couple of conservative assumptions and choices:
-
1.
We do not allow the final star-formation episode to extend over the last 100 Myr of the cluster life. Young populations with current ages Myr would leave a strong signature on the integrated SED of any cluster, which is clearly incompatible with our observations of W3 (cf. §5).
-
2.
For this experiment we have restricted our second star-formation episode to a FWHM = 100 Myr. If we were to increase the FWHM of the second star-formation episode, we would increase the difference between the SEDs of the synthetic clusters and that of W3, as we would be increasing the fraction of younger populations relative to the original instantaneous burst.
The rationale behind these choices is to favour all these extended star-formation scenarios, as we are trying to minimize the differences in the SEDs between an extended star formation episode and an instantaneous burst (our best fit SFH for W3).
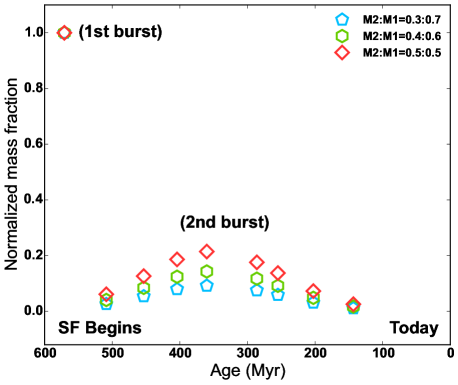
In G14, the authors used the results from a simulation called SG-R1 by D’Ercole et al. (2008) to describe the dynamical evolution of intermediate-age clusters.666This simulation most likely is inadequate to describe intermediate-age clusters in the SMC/LMC as we discuss in §5.1. This particular simulation was chosen due to the “agreement" in the reproduction of the mass fractions formed during the second, extended and first, instantaneous star-formation episodes inferred by G14 from the eMSTOs of intermediate-age clusters at their current ages (i.e. mass ratio between the second and first generation stars 2:1 observed today, 1–2 Gyr after their birth). For our synthetic clusters we take the values for from this simulation at younger ages, i.e. between . These range from 0.3:0.7 (at Myr) to 0.5:0.5 (at Gyr).
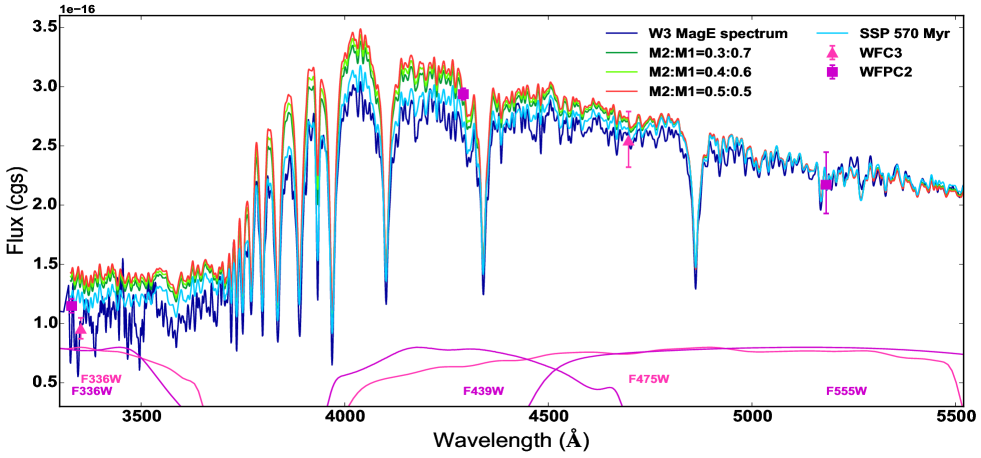
Figure 4 shows the SFHs of synthetic multiple-generation clusters for three different mass ratios. We will refer to these synthetic clusters with extended star-formation episodes hereafter as composite stellar population (CSP) clusters. The synthesised SEDs of these CSP clusters are shown in Figs. 5 and 6 together with the observed spectrum of W3.
4.2 Experiments with Goudfrooij et al. (2014) pseudo-age distributions
Although for a massive cluster of W3’s age (570 Myr) the SG-R1 simulation shows that most of the cluster mass comes from the stars of the first generation, we also explore the possibility that this entire generation was already lost during the early dynamical evolution of this cluster, leaving just the observed age distribution derived by G14 from the eMSTO stars.
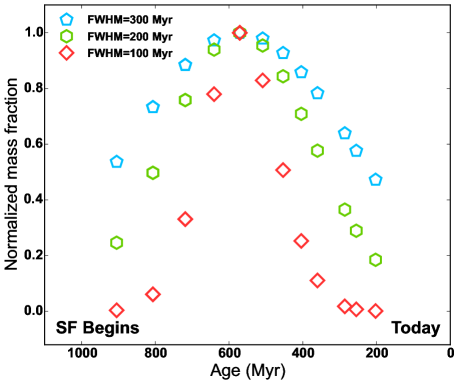
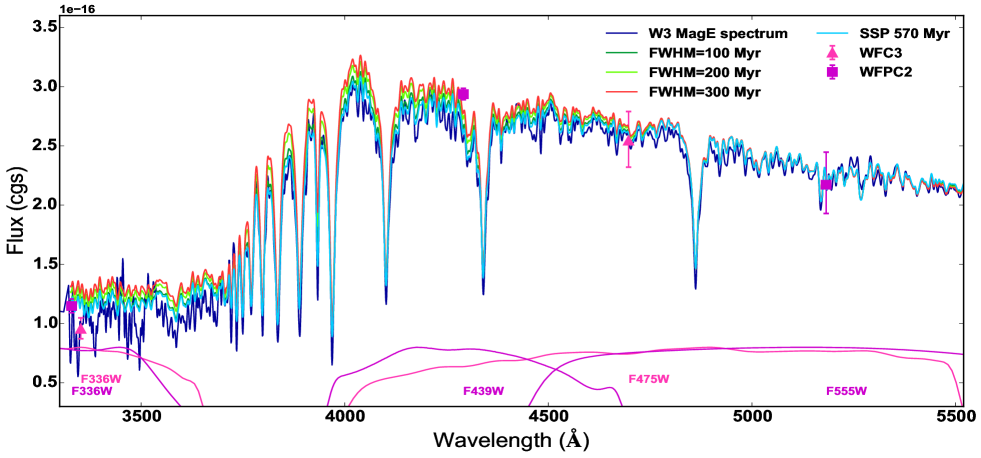
To test this possibility, we built a second set of CSP clusters, this time following the present-day age distribution (i.e. pseudo-age distributions in G11a,b and G14). For this we assumed a simple Gaussian distribution centred at 570 Myr and with FWHM ranging from 300 to 100 Myr (cf. Fig. 7). The resulting SEDs are shown in Figs. 8 and 9, where they are compared directly with the observed W3 spectrum.
5 Discussion
Figure 5 shows a portion of the MagE spectrum of W3 together with overplotted synthetic spectra of the best SSP DynBaS solution as well as of the CSPs with SFHs shown in Fig. 4. For this figure, we have normalized the flux of all our synthetic cluster spectra to the observed flux of W3 at WFPC2’s . Obviously, the MagE spectrum agrees well with the WFPC2 and WFC3 photometry (data points with error bars). This confirms that the wiggles in flux present in the MagE spectrum are negligible compared to the overall SED. This figure shows that the DynBaS solution (570 Myr SSP) is a very good representation of the observed SED of W3, while the synthetic CSP clusters fail to reproduce the optical colours of this cluster as these CSPs are too blue ( brighter for ). The offsets between the DynBaS solution and the MagE spectrum presented in Fig. 5 are in part due to the wiggles in the continuum mentioned in §2. Once the DynBaS solution and the MagE data are both continuum-normalized, the spectra match very well as shown in Fig. 2.
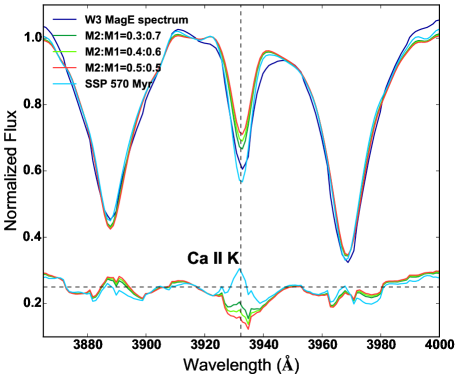
Besides analysing the overall shape of the SED of W3 and its agreement with the SED of synthetic SSP and CSP clusters, we can also analyse the behaviour of individual spectral features that are sensitive to age. Figure 6 shows the same SEDs as displayed in Fig. 5, but now centred on a narrow region around the Ca ii K line, which is very sensitive to age (for a given metallicity, this line gets deeper with age). Figure 6 illustrates once more how the CSP clusters fail to reproduce the observed characteristics of W3 (this time the profile of the Ca ii K line), and although the SSP of 570 Myr does not reproduce perfectly the depth of this line (as it is a little bit deeper), it still does a better job than any of the CSPs. As already stated, this particular line gets deeper with age, whence even a small young component in a CSP would make this line appear significantly shallower. The differences between the W3 spectrum and the best SSP solution in the profile of this line, could be due to the finite sampling in age of the SSP templates used for this work. If this were the case, the precise age of this cluster would be somewhere between the template of 570 Myr and the next youngest (508 Myr) one, as this spectrum will have about the same depth of the Balmer lines but the Ca ii K line will be a little bit shallower than that of the 570 Myr template.
We note that the extent of our second episode of star formation (i.e. when the extended burst begins and ends) is limited to Myr (see Fig. 4), which is about the FWHM of the extended star-formation episode proposed to explain the eMSTOs of some intermediate-age clusters according to G11a,b and G14. If we were to consider a more extended episode of star formation (i.e. Myr as suggested by G14), the differences in the SEDs and the Ca ii K line between W3 and the synthetic CSP clusters would become more marked due to the inclusion of even younger components to the CSP. In other words, even with these favorable assumptions, like a short second star-formation episode (FWHM=100 Myr) and the truncation of the star formation at younger ages (no star-formation in the last 100 Myr, see Fig. 4), we still find considerable differences between the SEDs of a cluster with a SSP and a cluster that experienced such extended star-formation event.
We can use the experiments with the pseudo-age distributions (§4.2 and Fig. 7) to place constraints on any extended SFH that may be present in W3 (i.e. the age resolution that our data offer). Extended star formation leaves a second-order imprint on a cluster’s SED due to the nonlinear evolution of colour. A cluster with an extended burst of star formation centred at lookback time will be bluer than an SSP of age ; the effect scales as , where is the duration of star formation. Extended SFHs have been inferred from eMSTOs in the CMD, where the effect is instead first-order: the width of the MSTO increases linearly with the duration of star formation.
Figure 8 shows how the SEDs of synthetic clusters with the extended SFHs of Fig. 7 compare to the observed SED of W3. At first glance, one can see that the CSPs with the long star-formation episodes (FWHM = 200 and 300 Myr) are easily distinguished from the W3/SSP SED, since the flux in is again about 10% higher than that of the W3 or SSP SEDs. But this time, the CSP cluster with the narrowest star formation episode (i.e. FWHM=100 Myr) is not very different from the SSP or W3’s SED.
We conclude the same, if instead we focus on the Ca ii K line, as shown in Fig. 9, we can see that the CSPs with FWHM Myr never reproduce the profile of this line better than the single SSP spectrum. We conclude from this that in order to produce a CSP that has an SED and shape of the Ca ii K line similar to what is observed in W3, we would need to (1) decrease the contribution of the main (first) burst proposed by G14, either by reducing its mass or by reducing the period between the first and second burst to be short enough so that both bursts would be indistinguishable, and (2) reduce the extent of the second star-formation period, down to a limit where it approaches the SED of an SSP. Figure 9 illustrates that this would be the case for a CSP following a Gaussian distribution with a FWHM Myr.777This upper limit for the extent of any prolonged star formation episode within W3 is consistent with the uncertainties/degeneracies in age estimated for this cluster cf. §3 and Appendix A.
We note that the mean FWHM age spread claimed by G14 for a sample of 18 intermediate-age clusters is 375 Myr and the shortest FWHM is 200 Myr. These values are well above our derived limit where one could start confusing the SED of an SSP and of a brief ( Myr) CSP event. Stellar rotation can mimic a fractional age spread of 20%, or 100 Myr at the age of W3; Fig. 8 shows that W3 is perfectly consistent with such a pseudo-age spread. It is, however, strongly inconsistent with the 300–400 Myr durations inferred from the eMSTOs in older LMC clusters.
5.1 Is the SG-R1 simulation suited to describe eMSTO clusters?
The simulation chosen by G14 to describe the dynamical evolution of intermediate-age clusters in the SMC/LMC displaying eMSTOs may not reproduce accurately their mass losses. This simulation, described in D’Ercole et al. (2008) and named SG-R1, was originally developed to study the dynamical evolution of Gyr old Galactic globular clusters in a strong tidal field. Due to this, there are some issues that may make it unsuitable for studies of intermediate-age SMC/LMC clusters, such as:
-
•
The second-generation stars in this simulation have only masses between 0.1 and 0.8 M⊙. Yet, the estimated masses of stars that populate the turnoff of intermediate-age (1–2 Gyr) clusters are all M⊙. Hence, this simulation would not feature any stars visible today in the regions of colour–magnitude diagrams where the eMSTO is observed in intermediate-age clusters.
-
•
The main reason that led G14 to choose this particular simulation for describing eMSTO clusters is that the mass ratio between second- and first-generation stars yielded at the age of intermediate-age clusters is very similar to the ratio inferred from the SFH derived from the eMSTO. This ratio is 2 : 1 for present-day eMSTO clusters. However, Figs. 15 and 16 of D’Ercole et al. (2008) show that one only gets this ratio for stars in the mass range . If one takes into account that the stars of the first generation in this simulation cover masses between 0.1 and 100 M⊙ following a standard (i.e. Kroupa) IMF, the actual mass ratio between the second- and first-generation stars decreases as there are more stars from the first generation than just the ones between .
-
•
The cluster in the simulation SG-R1 is tidally limited, i.e. the stars in the cluster are distributed up to the radius where a star is equally bound to the cluster and the Galaxy. This setup provides an extremely efficient way to lose stars. However, all the intermediate-age clusters studied in G14 have tidal radii between 4.9 and 43 times larger than their core (and effective) radii according to these authors. This fact makes mass loss in these clusters very inefficient.
To put this in context, we emphasize that the scenario of G14 requires retaining the first generation of stars (most of the cluster mass) at younger ages in order to provide enough gravitational potential to hold on to the gas expelled from evolved stars and to accrete gas from their surroundings. This gas will eventually fuel the extended (second) star-formation episode responsible for the eMSTO. Figures 2, 3 and 4 of G14 show that for these 1–2 Gyr old clusters, this second episode stopped forming stars 800–1500 Myr ago (depending on the cluster). Hence, the first-generation stars can only be lost after these ages, when they are no longer needed to hold on to the material to form the second burst. In other words, this implies a strong change of the tidal potential hosting each of these clusters in the last 800–1500 Myr, for which—to the best of our knowledge—there is no evidence.
-
•
Another critical factor is that the simulation SG-R1 assumes that the cluster is sitting in the Galactic potential tidal field, at a galactocentric distance of 4 kpc. Yet, the tidal fields of the SMC and LMC are significantly weaker than that of the Galaxy. Hence, the disruption derived from this simulation will be significantly overestimated compared to the actual one suffered by the eMSTO clusters in the SMC/LMC. We figure that this simulation could only apply to the eMSTO clusters if their densities at young ages were about two orders of magnitude lower than the densities of YMCs observed today (see Appendix B).
We conclude that the simulation SG-R1 by D’Ercole et al. (2008) is unsuitable for describing the dynamical evolution of SMC/LMC clusters with an eMSTO.
5.2 NGC 1856: a YMC with an eMSTO
The young cluster NGC 1856 represents a very interesting peace of the puzzle of the origin of the eMSTO. As mentioned before, this massive ( M⊙) young cluster with an age of Myr is significantly younger than any of the clusters previously reported with eMSTOs (with ages usually between 1–2 Gyr). The young age of this cluster allows us an unprecedented opportunity to understand the early evolution of a cluster with an eMSTO. In this section we combine the information derived by Milone et al. (2015); Correnti et al. (2015) from the eMSTO of NGC 1856 with previous studies of YMCs in order to place some constrains on the origin of the eMSTO.
In a previous study we analysed the YMC NGC 34: S1 (Cabrera-Ziri et al., 2014). Using DynBaS we concluded that the SFH of this cluster is consistent with an SSP of age Myr and mass M⊙. We were able to rule out any significant episode of star formation in the last 70 Myr of the cluster. G14 claim this is consistent with their scenario, as perhaps 100 Myr may not be enough for a second episode of star formation to take place, as the Lyman-Werner photons from the first-generation stars prevent the gas from cooling down to form stars (Conroy & Spergel, 2011).
If the suggestion of G14 indeed applies, then a break in the star formation lasting Myr would not be consistent with the age spreads inferred from the eMSTO of the young cluster NGC 1856. For the age of this cluster ( Myr) a Myr delay between the first- and second-generation stars would be readily observable in its CMD. However, the distribution of stars in the eMSTO of this cluster, and the inferred age distributions, seem to be continuous with no apparent gaps (Milone et al., 2015; Correnti et al., 2015). This could mean that the beginning of the extended star-formation episode responsible for the eMSTO varies from cluster to cluster in a very peculiar way, as it has never been observed to be ongoing in any YMC. That is, no evidence of ongoing star formation has been found in a study of young (10–1000 Myr) massive ( M⊙) clusters (Bastian et al., 2013b). Nor has any evidence been found of gas reservoirs within YMCs that could fuel extended star-formation episodes with the masses suggested by these scenarios (e.g. Bastian & Strader 2014; Cabrera-Ziri et al. 2015). Hence, the alternative explanation is that it cannot be an age spread that is responsible for the eMSTO.
Niederhofer et al. (2015a) found a correlation between the width of the eMSTO (or inferred age spread) and the age of the clusters in their sample, suggesting an evolutionary effect. For instance, a young cluster like NGC 1856 has an inferred MSTO age spread of 140 Myr (c.f. Milone et al. 2015), while an older cluster (1 Gyr) like NGC 2108 has an inferred age spread of 230 Myr spread and an even older (1.45 Gyr) cluster like NGC 411 shows an MSTO spread equivalent to 516 Myr (c.f. G14).
Evolutionary effects, like stellar rotation, have been proposed as an alternative to age spreads for the origin of the eMSTO (c.f. Bastian & de Mink 2009; Yang et al. 2013; Li et al. 2014). Niederhofer et al. (2015b) showed that stellar models that include rotation can reproduce an evolution of the MSTO morphology in time. Furthermore, they also show that if these evolutionary effects (rotation) were to be interpreted as age spreads, the inferred age spreads from the eMSTO are in agreement with the ones claimed by the authors supporting the age spread scenario e.g. G14.
Supporting this interpretation is the recent analysis of the CMD of NGC 1856 by D’Antona et al. (2015), which suggests that the complex MSTO of this cluster is due to two populations of the same age ( 350 Myr), one composed mainly of very rapidly rotating stars (), while the other is composed of slowly/non-rotating stars.
In this context, we can use W3 to test the age spread or the rotation scenarios. As seen in the previous sections, the maximum age spread present in W3 is at most 100 Myr. In the age spread scenario suggested by G14, for a cluster with such a high escape velocity, the expected age spread is typically Myr, inconsistent with the observations. On the other hand, in the rotational scenario, the expected MSTO spread would be the equivalent of Myr. However, the post-main sequence features, which contributed significantly to the integrated light are expected to have age spreads equivalent to Myr (Niederhofer et al., 2015b). Hence, our observations are inconsistent with the age spread scenario, but consistent with those expected from the rotational scenario.
6 Summary and Conclusions
We have used the SED of W3, a YMC in the merger remnant NGC 7252, and have compared it with the SED of synthetic clusters constructed with the SFHs that are proposed to explain the eMSTOs of intermediate-age clusters. We find that the SED of this cluster is consistent with that of an SSP of age Myr, mass M⊙ and current central escape velocity above 193 km s-1.
A key argument of some of the scenarios that have been proposed to explain the eMSTOs of intermediate-age clusters is based on the fact that these clusters all have masses above M⊙. These scenarios also assume that the eMSTO clusters were a factor of 10–20 more massive at birth and had escape velocities km s-1, enabling them to retain the gas that fueled the extended episode of star formation responsible for the observed eMSTO (cf. Keller et al. 2011). However, our results are in strong contradiction to the prediction of these scenarios, given that the SED of W3 does not match the model SED of young clusters with an age spread similar to any of those suggested for eMSTO clusters. Yet, W3 is the most massive young cluster known to date, and its mass ( M⊙) and escape velocity ( km s-1) exceed by orders of magnitude the masses/escape velocities (and the expected birth masses/escape velocities) of intermediate-age clusters showing eMSTOs. The near lack of significant extinction in this cluster () is also in conflict with the properties of a young cluster hosting a massive reservoir of cool gas (Longmore, 2015), suggesting that currently there is no cold gas that could fuel an extended star-formation episode in the near future.
Of course, there is a possibility that this specific cluster has some intrinsic property or that there is something peculiar in its environment that has prevented any extended episodes of star formation to take place. Yet, note that these results are in perfect agreement with previous studies of YMCs, as they all point towards a SFH of a single burst with a negligible extent. Also, in the scenarios investigated here there is no explicit requirement regarding the eMSTO cluster environments that would make the results we have obtained from W3 irrelevant for constraining the origin of this phenomenon.
Additionally, the open clusters Hyades and Praesepe—composed of 300 and 1000 members, respectively, and each 800 Myr old (Perryman et al., 1998; Kraus & Hillenbrand, 2007)—are known to have MSTOs that are inconsistent with a single isochrone, which has been attributed to spreads of a few hundred Myr in age (Eggen, 1998). Brandt & Huang (2015a) have recently proposed that age spreads are not needed to explain the broadened MSTOs in these clusters, since stellar models that include rotation can reproduce the same morphology with a single generation of stars. This mechanism has also been explored in the past to explain the origin of eMSTO clusters in the SMC/LMC (e.g. Bastian & de Mink 2009).
However, given the relatively small number of stars in the Hyades and Praesepe, it is hard to tell if the broadening of the turnoff observed in these open clusters is the same phenomenon as that observed in the significantly more massive ( M⊙) intermediate-age clusters displaying an eMSTO. If this were the case, this would also challenge the suggestion that the cluster’s gravitational potential well retained the gas long enough to have these extended star formation episodes, as it is highly unlikely that these open clusters had the necessary elevated escape velocity at birth.
Piatti & Bastian (2015) have recently found evidence for eMSTO in extremely low mass clusters (< 5000 M⊙) in the LMC, which shows that cluster mass cannot be the essential parameter. Similar hints of eMSTOs can been seen in CMD of the low-mass Galactic open clusters NGC 752 and Tombaugh 1 (Twarog et al., 2015; Sales Silva et al., 2015).
Finally, we would like to reiterate the important point made by G11 that, if the eMSTOs observed in intermediate-age clusters are due to the same mechanisms proposed to explain the chemical abundance patterns in GCs, then one would expect to see the same light-element abundance variations in intermediate-age clusters. However, different abundance analyses have shown no signs of these abundance patterns in the LMC intermediate-age clusters NGC 1806, 1651, 1783, 1978, and 2173 (Mucciarelli et al., 2008, 2014). Some of these clusters show an eMSTO (e.g. NGC 1783, 1651 and 1806) and have stellar masses comparable to GCs (all of these intermediate-age clusters are above M⊙). All of these considerations suggest, again, that the eMSTO phenomenon is unrelated to the chemical anomalies found in old GCs.
7 Acknowledgements
We would like to thank P. Goudfrooij, C. Li and R. de Grijs for enlightening discussions and comments on an earlier version of this manuscript. This paper includes data obtained with the Clay 6.5-m Magellan Telescope located at Las Campanas Observatory, Chile. NB is partially funded by a Royal Society University Research Fellowship and an European Research Council Consolidator Grant (Multi-Pop - 646928). FS gratefully acknowledges support from the Carnegie Institution for Science. GB acknowledges support for this work from the National Autonomous University of México (UNAM), through grant PAPIIT IG100115. JMDK is funded by a Gliese Fellowship. This work was performed in part under contract with the Jet Propulsion Laboratory (JPL) funded by NASA through the Sagan Fellowship Program executed by the NASA Exoplanet Science Institute.
References
- Alongi et al. (1993) Alongi M., Bertelli G., Bressan A., Chiosi C., Fagotto F., Greggio L., Nasi E., 1993, A&AS, 97, 851
- Alves & Nelson (2000) Alves D. R., Nelson C. A., 2000, ApJ, 542, 789
- Bastian & Niederhofer (2015) Bastian N., Niederhofer F., 2015, MNRAS, 448, 1863
- Bastian & Silva-Villa (2013) Bastian N., Silva-Villa E., 2013, MNRAS, 431, L122
- Bastian & Strader (2014) Bastian N., Strader J., 2014, MNRAS, 443, 3594
- Bastian & de Mink (2009) Bastian N., de Mink S. E., 2009, MNRAS, 398, L11
- Bastian et al. (2013a) Bastian N., Schweizer F., Goudfrooij P., Larsen S. S., Kissler-Patig M., 2013a, MNRAS, 431, 1252
- Bastian et al. (2013b) Bastian N., Cabrera-Ziri I., Davies B., Larsen S. S., 2013b, MNRAS, 436, 2852
- Brandt & Huang (2015a) Brandt T. D., Huang C. X., 2015a, ApJ, 807, 24
- Brandt & Huang (2015b) Brandt T. D., Huang C. X., 2015b, ApJ, 807, 25
- Bressan et al. (1993) Bressan A., Fagotto F., Bertelli G., Chiosi C., 1993, A&AS, 100, 647
- Bruzual & Charlot (2003) Bruzual G., Charlot S., 2003, MNRAS, 344, 1000
- Cabrera-Ziri et al. (2014) Cabrera-Ziri I., Bastian N., Davies B., Magris G., Bruzual G., Schweizer F., 2014, MNRAS, 441, 2754
- Cabrera-Ziri et al. (2015) Cabrera-Ziri I., et al., 2015, MNRAS, 448, 2224
- Cardelli et al. (1989) Cardelli J. A., Clayton G. C., Mathis J. S., 1989, ApJ, 345, 245
- Chabrier (2003) Chabrier G., 2003, PASP, 115, 763
- Chien & Barnes (2010) Chien L.-H., Barnes J. E., 2010, MNRAS, 407, 43
- Conroy & Spergel (2011) Conroy C., Spergel D. N., 2011, ApJ, 726, 36
- Correnti et al. (2015) Correnti M., Goudfrooij P., Puzia T. H., de Mink S. E., 2015, MNRAS, 450, 3054
- D’Antona et al. (2015) D’Antona F., Criscienzo M. D., Decressin T., Milone A. P., Vesperini E., Ventura P., 2015, MNRAS, 453, 2637
- D’Ercole et al. (2008) D’Ercole A., Vesperini E., D’Antona F., Mcmillan S. L. W., Recchi S., 2008, MNRAS, 391, 825
- Eggen (1998) Eggen O. J., 1998, AJ, 116, 284
- Fagotto et al. (1994a) Fagotto F., Bressan A., Bertelli G., Chiosi C., 1994a, A&AS 104, 104, 365
- Fagotto et al. (1994b) Fagotto F., Bressan A., Bertelli G., Chiosi C., 1994b, A&AS 105, 105, 29
- Georgiev et al. (2009) Georgiev I. Y., Hilker M., Puzia T. H., Goudfrooij P., Baumgardt H., 2009, MNRAS, 396, 1075
- Girardi et al. (1996) Girardi L., Bressan A., Chiosi C., Bertelli G., Nasi E., 1996, A&AS, 117, 113
- González (1993) González J. J., 1993, PhD thesis, Univ. California
- Goudfrooij et al. (2011a) Goudfrooij P., Puzia T. H., Kozhurina-Platais V., Chandar R., 2011a, ApJ, 737, 3
- Goudfrooij et al. (2011b) Goudfrooij P., Puzia T. H., Chandar R., Kozhurina-Platais V., 2011b, ApJ, 737, 4
- Goudfrooij et al. (2014) Goudfrooij P., et al., 2014, ApJ, 797, 35
- Goudfrooij et al. (2015) Goudfrooij P., Girardi L., Rosenfield P., Bressan A., Marigo P., Correnti M., Puzia T. H., 2015, MNRAS, 450, 1693
- Gratton et al. (2012) Gratton R. G., Carretta E., Bragaglia A., 2012, A&ARv, 20, 50
- Harris & Zaritsky (2009) Harris J., Zaritsky D., 2009, AJ, 138, 1243
- Hibbard & Mihos (1995) Hibbard J. E., Mihos J. C., 1995, AJ, 110, 140
- Jordán et al. (2004) Jordán A., et al., 2004, ApJS, 154, 509
- Keller et al. (2011) Keller S. C., Mackey A. D., Da Costa G. S., 2011, AJ, 731, 22
- King (1962) King I., 1962, AJ, 67, 471
- Kraus & Hillenbrand (2007) Kraus A. L., Hillenbrand L. A., 2007, AJ, 134, 2340
- Kruijssen (2014) Kruijssen J. M. D., 2014, Class. Quantum Gravity, 31, 244006
- Kruijssen (2015) Kruijssen J. M. D., 2015, MNRAS, 454, 1658
- Lamers et al. (2010) Lamers H. J. G. L. M., Baumgardt H., Gieles M., 2010, MNRAS, 409, 305
- Le Borgne et al. (2003) Le Borgne J.-F., et al., 2003, A&A, 402, 433
- Li et al. (2014) Li C., de Grijs R., Deng L., 2014, Nat, 516, 367
- Longmore (2015) Longmore S. N., 2015, MNRAS, 448, L62
- Longmore et al. (2014) Longmore S. N., et al., 2014, Protostars and Planets VI, p. 291
- Mackey & Broby Nielsen (2007) Mackey A. D., Broby Nielsen P., 2007, MNRAS, 379, 151
- Mackey et al. (2008) Mackey A. D., Nielsen P. B., Ferguson A. M. N., Richardson J. C., 2008, ApJ, 681, L17
- Magris et al. (2015) Magris G., Mateu J., Mateu C., Bruzual G., Cabrera-Ziri I., Mejía-Narváez A., 2015, PASP, 127, 16
- Maraston et al. (2001) Maraston C., Kissler-Patig M., Brodie J. P., Barmby P., Huchra J. P., 2001, A&A, 370, 176
- Maraston et al. (2004) Maraston C., Bastian N., Saglia R. P., Kissler-Patig M., Schweizer F., Goudfrooij P., 2004, A&A, 416, 467
- Marshall et al. (2008) Marshall J. L., et al., 2008, Proc. SPIE, 7014, 701454
- Miller et al. (1997) Miller B. W., Whitmore B. C., Schweizer F., Fall S. M., 1997, AJ, 114, 2381
- Milone et al. (2009) Milone A. P., Bedin L. R., Piotto G., Anderson J., 2009, A&A, 497, 755
- Milone et al. (2015) Milone A. P., et al., 2015, MNRAS, 450, 3750
- Mucciarelli et al. (2008) Mucciarelli A., Carretta E., Origlia L., Ferraro F. R., 2008, AJ, 136, 375
- Mucciarelli et al. (2014) Mucciarelli A., Dalessandro E., Ferraro F. R., Origlia L., Lanzoni B., 2014, ApJL, 793, L6
- Niederhofer et al. (2015a) Niederhofer F., Bastian N., Kozhurina-Platais V., Hilker M., de Mink S. E., Cabrera-Ziri I., Li C., Ercolano B., 2015a, A&A, in press (arXiv:1510.08476)
- Niederhofer et al. (2015b) Niederhofer F., Georgy C., Bastian N., Ekström S., 2015b, MNRAS, 453, 2070
- Niederhofer et al. (2015c) Niederhofer F., Hilker M., Bastian N., Silva-Villa E., 2015c, A&A, 575, A62
- Perryman et al. (1998) Perryman M. A. C., et al., 1998, A&A, 331, 81
- Piatti & Bastian (2015) Piatti A. E., Bastian N., 2015, MNRAS, submitted
- Portegies Zwart et al. (2010) Portegies Zwart S. F., McMillan S. L. W., Gieles M., 2010, ARA&A, 48, 431
- Rubele et al. (2013) Rubele S., Girardi L., Kozhurina-Platais V., Kerber L., Goudfrooij P., Bressan A., Marigo P., 2013, MNRAS, 430, 2774
- Sales Silva et al. (2015) Sales Silva J. V., Carraro G., Anthony-Twarog B. J., Moni Bidin C., Costa E., Twarog B. A., 2015, preprint, (arXiv:1510.08120)
- Schweizer & Seitzer (1998) Schweizer F., Seitzer P., 1998, AJ, 116, 2206
- Stanimirović et al. (2004) Stanimirović S., Staveley-Smith L., Jones P. A., 2004, ApJ, 604, 176
- Twarog et al. (2015) Twarog B. A., Anthony-Twarog B. J., Deliyannis C. P., Thomas D. T., 2015, AJ, 150, 134
- Weisz et al. (2013) Weisz D. R., Dolphin A. E., Skillman E. D., Holtzman J., Dalcanton J. J., Cole A. A., Neary K., 2013, MNRAS, 431, 364
- Whitmore et al. (1993) Whitmore B. C., Schweizer F., Leitherer C., Borne K., Robert C., 1993, AJ, 106, 1354
- Yang et al. (2013) Yang W., Bi S., Meng X., Liu Z., 2013, ApJ, 776, 112
- van Dokkum (2001) van Dokkum P. G., 2001, PASP, 113, 1420
Appendix A Degeneracies of the continuum normalized fit
As mentioned in §3, we use the SSP solution from the DynBaS fit to the continuum normalized spectrum, as the best estimate of the age of NGC 7252: W3. This fit yielded an age for this cluster of 570 Myr. In this appendix we look for possible degeneracies in our age estimate (i.e. if some other combinations of multiple populations reproduce the W3 spectrum equally well as our best solution), conducting fits to our data using grids of synthetic multiple-population clusters.
This experiment is the same we carried out to study the degeneracies on the SFH of NGC 34: S1 in Cabrera-Ziri et al. (2014). Here we built a grid of synthetic cluster spectra, in which each element represents a cluster with two star formation events. These spectra were built using the same continuum normalized Bruzual & Charlot (2003) models we used for our DynBaS fits (cf. §3). In this grid each synthetic cluster consists of a massive population with always the same age, 570 Myr (Pop. I from here on), followed or preceded by a less massive second population of a different age (Pop. II). The ages for Pop. II in this grid range from 1 Myr to 1 Gyr and are distributed almost uniformly in log space. While the masses of Pop. II could take values ranging from 10 to 90 per cent of the mass of Pop. I.
In Fig. 10 we show the results of the fits of the continuum normalized MagE spectrum of W3 to each of the elements in this grid. In this figure we colour coded the solutions as a function of their . The contours denote constant values of . For practical reasons, we have normalized all these values dividing each of them by the of our DynBaS1D solution (i.e. SSP 570 Myr). We found that for fits with , it is possible to distinguish by eye that the spectral fits are poor (i.e. fail to reproduce the depths/profiles of some Balmer lines and the Caii K line), and such solutions are excluded. For reference, the differences between solutions with and , are similar (or greater) to the differences between the FWHM = 100 and 200 Myr spectra and the spectrum of W3 in Fig. 9, respectively.
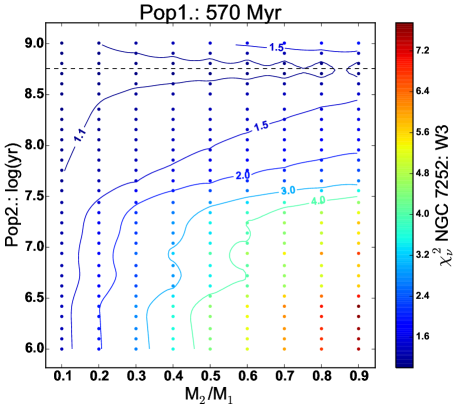
Overall, this parameter space has a similar behaviour as the one found for NGC 34: S1 in Cabrera-Ziri et al. (2014). In the sense that we do not see any other region with a local minimum which could host/hide another solution that represents a fit as good (or better) than the DynBaS SSP solution. This figure also shows that the region with (i.e. the region where it is not possible to distinguish a multiple population solution from a SSP solution) basically comprises all the synthetic clusters with a secondary burst (Pop. II) of age 508 and 640 Myr (which are the row of dots bellow and above the dashed line respectively) regardless of their mass. This region lies exactly within the uncertainties reported in §3 DynBaS fit solution, Myr. This is also in agreement with the upper limit of 100 Myr for the width of an extended star formation event centred at 570 Myr, where this mulitple population solution represent a fit as good as the SSP solution (cf. Fig. 9 and the discussion in the text about this figure).
From this experiment, we conclude that the possible degeneracies in the SFH of this cluster, i.e. any multiple population solution as good as our SSP solution, lie within the uncertainties in the age of W3 reported in §3. We note that these uncertainties/degeneracies are significantly smaller than the age spread expected for this cluster according to the scenarios that attribute the eMSTO in intermediate-age clusters to extended star formation events.
Appendix B Cluster disruption in the SMC/LMC
Here we discuss the feasibility of applying the strong Galactic tidal field of the D’Ercole et al. (2008) models to the intermediate-mass clusters in the SMC/LMC studied by G14.
Most of the dynamical mass loss in the D’Ercole et al. (2008) model of multiple-generation clusters is induced by stellar evolution, i.e. by the change of the gravitational potential due to massive stars ending their lives. This mass loss depends sensitively on how extended a cluster is — D’Ercole et al. (2008) achieve the high second-to-first generation ratio required by G14 only by assuming that the cluster fills its Roche lobe (their SG-R1 simulation), allowing it to lose stars efficiently as the gravitational potential changes. Hence, this model can only be applied to the SMC/LMC clusters if the ratio between the cluster radius and the tidal radius is the same as in the D’Ercole et al. (2008) model. This ratio is in Roche lobe-filling clusters with King parameters (e.g. Lamers et al., 2010). Independently of the cluster’s mass, this translates directly to a ratio between the half-mass density and the tidal density (where is the orbital angular velocity within the cluster’s host galaxy, assumed to have a flat rotation curve) of for . In other words, the simulation SG-R1 requires that
| (1) |
This density can be evaluated using the known rotation curves for the SMC and LMC (Alves & Nelson, 2000; Stanimirović et al., 2004). Table 3 lists and for a number of galactic environments, such as the Milky Way at a radius of (as in D’Ercole et al. 2008, assuming a circular velocity of ), the SMC at , and the LMC at . The table shows that the SMC and LMC require densities , with median values of for , which is up to an order of magnitude lower than in the D’Ercole et al. (2008) model used by G14.
| Galaxy | ||||
|---|---|---|---|---|
| MW | ||||
| SMC | ||||
| LMC | ||||
| LMC | ||||
| LMC |
Radii are in kpc, angular velocities in (100 Myr)-1, and densities in M⊙ pc-3.
To determine whether the above low densities are still reasonable for young stellar clusters, we compare them to the densities of local-Universe YMCs listed in Portegies Zwart et al. (2010). The median density of the YMCs (ages ) in their comprehensive sample is , i.e. between 1 and 2 orders of magnitude higher than the low densities required by G14 to apply the D’Ercole et al. (2008) model to SMC/LMC clusters. Out of the 30 YMCs, only 3 (Per, NGC 4038: W99-16, and NGC 4449: N-2) have densities lower than . For reference, the only YMC younger than 10 Myr in the LMC (R136) has .
Therefore, the observed densities of recently-formed YMCs are too high for the D’Ercole et al. (2008) model to apply. The only way in which this application could be appropriate is if the intermediate-age clusters of G14 represent the low-density end of some larger, initial cluster population, of which the high-density YMCs were subsequently destroyed. However, there is no known mechanism that destroys high-density clusters more easily than low-density ones. The main disruption agents in gas-rich galaxies are tidal evaporation and tidal shocks by giant molecular clouds, both of which favour the survival of high-mass, high-density clusters (e.g. Kruijssen, 2015).
We conclude that applying the simulation SG-R1 by D’Ercole et al. (2008) to YMCs in the SMC and LMC requires either extremely rare or carefully-tuned conditions, making it highly unlikely that this model applies to the clusters considered by G14.