On the eclipsing binary ELHC 10 with occulting dark disc in the Large Magellanic Cloud
Abstract
We investigate the luminous star ELHC 10 located in the bar of the Large Magellanic Cloud, concluding that it is a SB1 long-period eclipsing binary where the main eclipse is produced by an opaque structure hiding the secondary star. For the more luminous component we determine an effective temperature of 6500 250 , log g = 1.0 0.5 and luminosity 5970 L☉. From the radial velocities of their photospheric lines we calculate a mass function of 7.37 0.55 M☉. Besides Balmer and forbidden N ii emission, we find splitting of metallic lines, characterized by strong discrete absorption components (DACs), alternatively seen at the blue and red side of the photospheric spectrum. These observations hardly can be interpreted in terms of an structured atmosphere but might reflect mass streams in an interacting binary. The primary shows signatures of s-process nucleosynthesis and might be a low-mass post-AGB star with a rare evolutionary past if the binary is semi-detached. The peak separation and constancy of radial velocity in H suggest that most of the Balmer emission comes from a circumbinary disc.
keywords:
stars: binaries: eclipsing, stars: evolution, stars: circumstellar matter, stars: mass loss1 Introduction
ELHC 10 (also known as [BE74] 561, 2MASS J05194770-6939121 or OGLE LMC-LPV-41682) is a binary system with period of 219.9 d111http://ogledb.astrouw.edu.pl/ogle/CVS/, located near the nebular complex N 120 (Henize, 1956) in the bar of the Large Magellanic Cloud (LMC); it was identified as a H emission-line star by Bohannan & Epps (1974). The name ELHC 10 for this object was proposed by Lamers et al. (1999) and de Wit et al. (2002), who searched the EROS database for blue objects with irregular photometric behavior similar to Galactic Herbig Ae/ Be stars in the LMC bar. ELHC 10 was the reddest and brightest star in their sample, with a color and estimated absolute magnitude of . The low resolution spectrum showed emission in H with equivalent width of -23 Å. Contrary to the other stars in their sample, this star was not an early B star; the spectrum was more compatible with an early F-type giant or supergiant. The spectral type was estimated as F2/5 I-II, and the object was included in a sample of HAeBe stars (de Wit et al., 2005). Although Herbig Ae/ Be stars (or HAeBe) are emission-line stars of spectral types O, B, A and in a few cases F, and in most instances exhibit IR excesses, which are attributed to dust emission from circumstellar discs, this star is hardly a HAeBe candidate, due to the much evolved nature of the luminous component.
In this paper, we focus on resolving the uncertainty about the nature of this system by performing an analysis of the stellar components and the surrounding environment. High-resolution spectra and very accurate light curves allowed us to study ELHC 10 in unprecedented detail for the first time. We find that the brightest member of this binary has a low surface gravity and an atmosphere depleted in refractory elements and might be identified as a member of the subclass of post-Asymptotic Giant Branch stars. In addition, we provide evidence for the existence of a circumbinary disc and a circumstellar opaque disc.
There are many substantial evidences for stable and compact Keplerian circumbinary disks around many post-AGB objects (de Ruyter et al., 2006; Gielen et al., 2008, 2009; van Aarle et al., 2011; Hillen et al., 2013, 2014, 2015; Bujarrabal et al., 2015). Additionally the binary nature of the disc source has been in some cases confirmed, with the most famous example certainly being HD 44179, better known as the Red Rectangle Nebula (de Ruyter et al. 2005; Witt et al. 2009; Thomas 2012; Martínez González et al. 2015; Van Winckel et al. 1995, and references therein). Two other important cases where it has been possible to test the existence of stable Keplerian discs and the correlation with binarity in post-AGB stars have been reported by Gorlova et al. (2012, 2015). Hence, the present work aims to inquire into the nature of ELHC 10 bringing new light on the formation of stable discs in these binary systems, which are produced presumably by means of interaction with the companion, when the more massive component becomes either a red giant (RG) or an AGB star. Actually, these amazing and rare systems might represent a new evolutionary channel that until now has been poorly studied.
In Section 2 we present a detailed report of the photometric and spectroscopic observations used in this paper. In Section 3 we analyze these observations to obtain the orbital ephemeris and a preliminary spectral type for the more luminous component. The spectral energy distribution is also analyzed in this section and a radial velocity study is presented. A study of line profiles yields to detailed parameters of the more prominent star. In Section 4 we use results of our radial velocity study to get information about masses and offer an interpretation of discrete absorption components (DACs) in terms of mass exchange and mass loss in an interacting binary. Finally, in Section 5 we provide the conclusions of our work.
In this paper we call the primary star the stellar component whose absorption lines are detected in the spectrum, while the secondary is the undetected (and more massive) star. Let’s remember that this scenario of a less evolved more massive star can be possible in case of past or present mass transfer by Roche-lobe overflow, as happens in Algols. Quantities relative to these stars are labeled with subindexes 1 and 2, respectively.
| Phase | Telescope | Instrument | Date-obs | UT-start | exptime (s) | Airmass | HJD | S/N | DACs |
|---|---|---|---|---|---|---|---|---|---|
| 0.04 | ESO/3.6 | HARPS | 2014/11/06 | 04:19:02 | 2400 | 1.419 | 2456967.693794 | 14 | BACs |
| 0.22 | ESO/3.6 | HARPS | 2010/09/28 | 05:05:09 | 2500 | 1.737 | 2455467.712230 | 20 | RACs |
| 0.25 | ESO/3.6 | HARPS | 2013/10/08 | 05:44:38 | 2000 | 1.505 | 2456573.739580 | 22 | RACs |
| 0.47 | LCO/Clay | MIKE | 2012/02/07 | 00:22:03 | 900 | 1.323 | 2455964.514824 | 25 | No |
| 0.54 | LCO/Clay | MIKE | 2013/12/11 | 00:21:28 | 600 | 1.718 | 2456637.518113 | 25 | No |
| 0.54 | LCO/Clay | MIKE | 2013/12/12 | 00:17:46 | 600 | 1.717 | 2456638.515537 | 25 | No |
| 0.62 | Irénée Du Pont | ECHELLE | 2010/12/27 | 05:36:25 | 900 | 1.387 | 2455557.743669 | 40 | BACs |
| BE | RE | B | V | I | (B-V) | (V-I) | (B-V)0 | Spectral Type |
|---|---|---|---|---|---|---|---|---|
| 13.576 | 13.503 | 14.428 | 13.931 | 13.484 | 0.494 | 0.446 | 0.32 | F5 |
2 Observations and data reduction
2.1 Spectroscopy data
We conducted optical spectroscopic observations of ELHC 10 at different epochs during 4 years with several echelle spectrographs. Three high-resolution spectra were obtained in September 2010, October 2013 and November 2014, using the HARPS Echelle Spectrograph mounted on the ESO 3.6 m telescope at La Silla Observatory, Chile. The two CCD chips on this instrument sample the spectral range of 3780-6910 Å. The fibres allowed us to obtain spectra at resolving power . The HARPS spectra do not include the 5304 to 5337 region, because of the gap between the two detectors.
Three additional spectra were secured with the Magellan Inamori Kyocera Echelle (MIKE) spectrograph at the Clay Telescope in Las Campanas Observatory, Chile, in February 2012 and December 2013. This double echelle spectrograph provided wavelength coverage of 3390-4965 Å (blue camera) and 4974-9407 Å (red camera). With a slit width of 0.7 arcsec, the resolving power was 40000. Unfortunately, the two spectra obtained in December 2013 could not be calibrated in wavelength, but they were used to perform a qualitative analysis of line shapes.
We also obtained one high-resolution ( 40000) spectrum with the DuPont Echelle Spectrograph at Las Campanas Observatory, covering the spectral region 4448-7982 Å in December of 2010.
All spectra discussed in this work are corrected for earth translational motion and normalized to the continuum. The radial velocities (RVs) are heliocentric. The data reductions were done with standard IRAF 222IRAF is distributed by the National Optical Astronomy Observatories, which are operated by the Association of Universities for Research in Astronomy, Inc., under cooperative agreement with the National Science Foundation. routines for echelle spectroscopy, including flat and bias correction, wavelength calibration and order merging. No flux calibration was needed for our purposes. A summary of our spectroscopic observations is shown in Table 1.
2.2 Photometric data
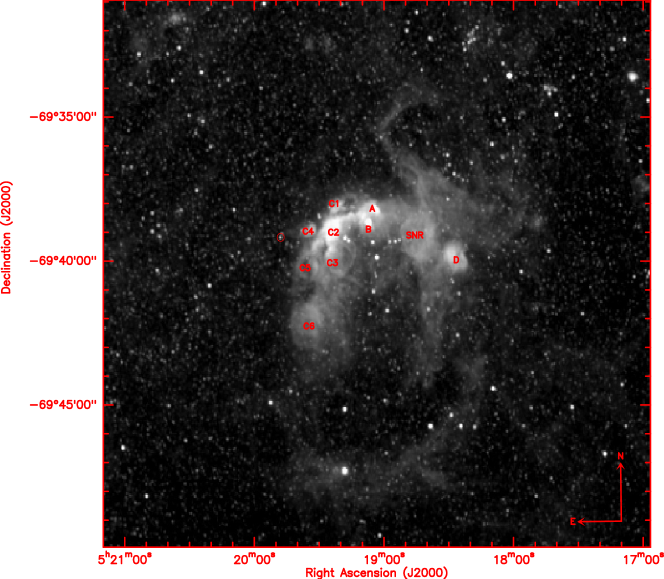
We used the H images from the Magellanic Cloud Emission-Line Survey (Smith & MCELS Team, 1999) to get information about the conditions surrounding the environment of ELHC 10. As mentioned above, ELHC 10 is located near the nebular complex N 120. This complex is composed of smaller nebulae arranged in a bright incomplete ring with the exciting stars in the centre of the bubble-like nebular complex. Firstly, Henize in 1956 separated the nebula into four brighter overlapping H ii regions: N 120 A, B, C and D. Additional images of this region as those of MCELS, revealed that N 120 C was composed of smaller nebulae, denoted C1 to C6, as shown in Fig. 1. The heliocentric velocity of the nebulae C1 to C6 were accurately measured to be between 250 and 263 km s-1, with velocity dispersions between 3 to 7 km s-1 by Laval et al. (1992). In particular, we are interested in the heliocentric velocities of the nebular complex N 120 C4 and C5 that are closer to our star; these nebulae have heliocentric velocities between 260 and 261 km s-1.
Multi-band and time-series photometry was retrieved from the Optical Gravitational Lensing Experiment in its third phase (OGLE III; Udalski et al. 2002), the Expérience de Recherche d’Objects Sombres in its second phase EROS-2333http://eros.in2p3.fr/ and the Massive Compact Halo Object (MACHOs444http://wwwmacho.anu.edu.au/) project.
The OGLE III photometry was accumulated over an interval of almost 8 years, from July 2001 to May 2009, with the 1.3 meter Warsaw telescope located at Las Campanas Observatory in Chile. The majority of these observations were taken in the -band, typically about 500 points, but ELHC 10 has OGLE II observations too, which increases the number of points up to 1000. About 40-60 observations ( with the OGLE II data) were secured in the -band. See Soszyñski et al. (2009) for more information about the obtention of OGLE photometric data.
The EROS-2 observations were obtained using the 1 m Ritchey-Chrétien Telescope at ESO, La Silla-Chile. The telescope was equipped with two cameras, each camera contained eight detectors mounted in a mosaic pattern. The pixel size is , with a typical seeing of FWHM at the site. The EROS-2 Photometric System consisted of a (420-720 nm, blue) band and (620-920 nm, red) band. The band is close to the Johnson -band, but it is broader. The band is intermediate between the bands of Cousins and . The photometric points obtained using the -band generally have better accuracy than in the -band (Grison et al., 1995; Ansari & EROS Collaboration, 2001).
The MACHO survey provides instrumental magnitudes for each star in two contiguous “blue” and “red” passbands, labeled and , at different effective wavelengths than the standard B and R passbands in the Johnson-Cousins photometric system (Alcock et al., 1999). The MACHO light curves have between 500 to 1300 points per star, depending on the filter with which they were taken. The MACHO photometry was accumulated over the interval of 8 years from July 1992 to January 2000. The light curves retrieved from MACHO together with the EROS-2 light curves were used to construct color curves for ELHC 10 (Fig. 2).


3 Results
3.1 Photometric characterization and period search
In Table 2 we give the EROS-2 magnitudes and mean magnitudes and colors obtained from the OGLE II catalog. OGLE II has a median seeing for the entire dataset of about , and the uncertainty of the zero-point is less than 0.02 mag (Udalski et al., 2000). We calculated derredened colors assuming mean internal reddening mag given by Oestreicher & Schmidt-Kaler (1996), as representative for the gas and dust distribution inside the LMC.
The color is concordant with a middle F-type giant or supergiant, and this spectral type determination is compatible with the lines observed in the HARPS spectra discussed in Section 3.2 and the earlier estimate by de Wit et al. (2005).
The OGLE III -band and -band light curves have been analyzed utilizing the Phase Dispersion Minimization (PDM) algorithm introduced by Stellingwerf (1978), as implemented in IRAF. We have found the fundamental period of days on the -band time series. The period error is the half-width at half-maximum (HWHM) of the periodogram’s peak. The ephemeris for the main eclipses is:
| (1) |
We have modeled the OGLE III and EROS-2 light curves with a Fourier series including the orbital frequency plus harmonics following the method described by Mennickent et al. (2012). The analysis of the residuals of the light curve regarding this model did not reveal any additional periodicity.
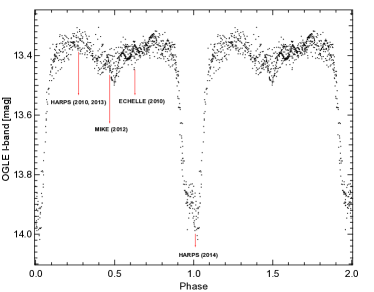
Afterwards, OGLE III and EROS-2 light curves were folded using the ephemeris given by Eq. 1, and the result is shown in Fig. 2. The structure seen in the eclipses of ELHC 10, in particular the plateau, is similar to that exhibited in EE Cep (Gałan et al., 2012) and the newly discovered systems OGLE LMC-ECL-11893 (Scott et al., 2014; Dong et al., 2014), OGLE-BLG182.1.162852 (Rattenbury et al., 2015) and OGLE004633.76731204.3 (Mennickent et al., 2010). These systems have been described as long-period eclipsing binaries with circumstellar discs and the most plausible hypothesis to explain the observed shape of the light curve is a nearly edge-on dusty disk around a low-luminosity central object, this specific configuration is very similar to the geometry of the eclipses in the Aur system (Kloppenborg et al., 2015) and the plateau reflects the fraction covered for the opaque circumsecondary disc onto the primary stellar disc.
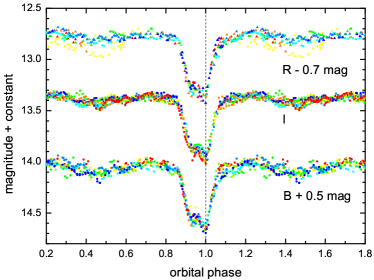
The OGLE -band and -band light curves were phased with the 219.9 day period, and then interpolated to a constant phase-step to get a representation of the average light variability during the cycle at each band. The color was constructed by subtracting both averaged light curves; it does not show any significant change during the cycle, but remains constant at the value = 0.5, representative of a F2-F5 type supergiant. The same color constancy is observed in MACHO and EROS colors (Fig. 2). Actually, the MACHO color shows the system slightly bluer by 0.01 mag. at quadratures. The almost gray and irregular eclipse is compatible with occultation of the primary by a inhomogeneous disk dominated by particles of quite large diameters, mixture of grains and dust similar to the discs in Aur and EE Cep system (Hoard et al., 2010; Gałan et al., 2012)
The variability of the eclipse shape at different epochs and also short-term quasi-periodic oscillations can be observed in Fig. 3. The scatter observed in the -band at certain phases occurs only during one epoch (yellow points) and near secondary eclipse; it could be instrumental error related to problems with removal of H luminosity of the background nebulosity or alternatively, reveals changes in H emission strength.
| Filter | fλ | fλ | |
|---|---|---|---|
| (Å) | (erg/cm2/s/Å) | (erg/cm2/s/Å) | |
| B | 4413.08 | 1.30E-14 | 1.79E-16 |
| V | 5512.12 | 9.38E-15 | 1.30E-16 |
| DENIS I | 7862.10 | 4.97E-15 | 1.37E-16 |
| I | 8059.88 | 4.86E-15 | 2.24E-17 |
| J | 12350 | 1.66E-15 | 6.11E-17 |
| H | 16620 | 7.48E-16 | 2.76E-17 |
| Ks | 21590 | 2.91E-16 | 1.61E-17 |
| WISE1 | 33526 | 7.93E-17 | 2.05E-18 |
| IRAC1 | 35634 | 5.79E-17 | 1.60E-18 |
| IRAC2 | 45110 | 2.61E-17 | 6.97E-19 |
| WISE 2 | 46028 | 2.60E-17 | 6.46E-19 |
| IRAC3 | 57593 | 1.17E-17 | 5.41E-19 |
| IRAC4 | 79594 | 4.67E-18 | 7.74E-19 |
| WISE3 | 115608 | 2.08E-18 | 1.57E-19 |
| WISE4 | 220883 | 1.38E-18 | 3.50E-19 |
References: I data from DENIS Deep Near Infrared Survey (Cioni et al., 2000), data from OGLE II - III survey (Udalski et al., 2000; Udalski et al., 2008), data from 2MASS all-sky survey (Skrutskie et al., 2006), IRAC (Meixner et al., 2006) and WISE using data retrieved from the Spitzer Space Telescope Archive (Wright et al., 2010).

3.2 Temperature and surface gravity of the primary star
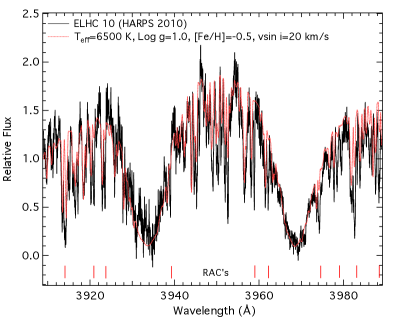
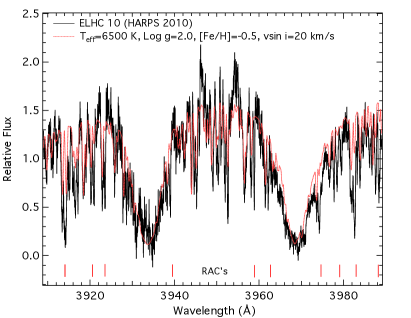
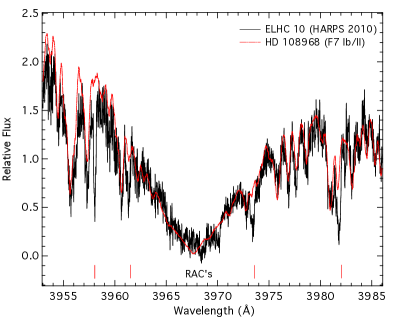
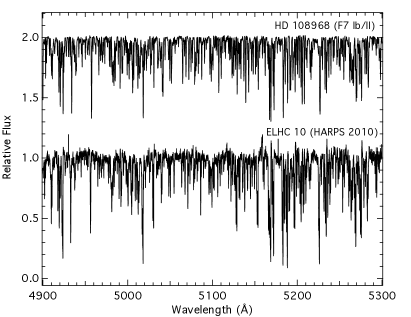
We compared our spectra with the library of synthetic stellar spectra given by Coelho et al. (2005). The synthetic spectra with low metallicity were adopted, for which, upper and lower limits of the metallicity were established from the mean values of metallicity distribution derived by Carrera et al. (2008) for the chemical enrichment history of the LMC. The spectra with effective temperatures and surface gravities were subtracted from our spectrum in the region 3911-3993 Å covering the Ca ii H/K lines in order to find the residual spectrum with the smaller standard deviation, considered as the best model spectrum.
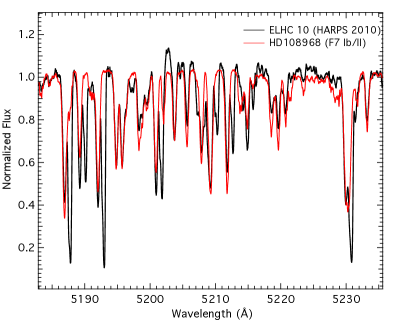
We find that a spectrum with K, and [Fe/H] reproduces well this part of the HARPS spectrum in 2010. We estimate the accuracy of our adjustment to be K in Teff and dex in and [Fe/H]. In addition, we used the tabulated effective temperature of supergiants as a function of spectral type from Kovtyukh (2007) to independently verify the range of spectral type for ELHC 10 based on its : F3 (6700 K)F6 (6270 K), which is consistent with the photometric estimation. In Fig. 4 we show the HARPS spectrum taken in 2010 for ELHC 10, along with the best synthetic spectrum and also the spectrum of the standard HD 108968 (F7 Ib/II, v km/s) taken from the atlas UVES-POP555http://www.eso.org/sci/observing/tools/uvespop.html (Bagnulo et al., 2003).
The fact that no veiling was necessary to fit the lines in the spectrum with a supergiant template indicates that most of the optical flux comes from this star, and the contributions of the companion and circumstellar material are very small at these wavelengths.
3.3 Analysis of the spectral energy distribution
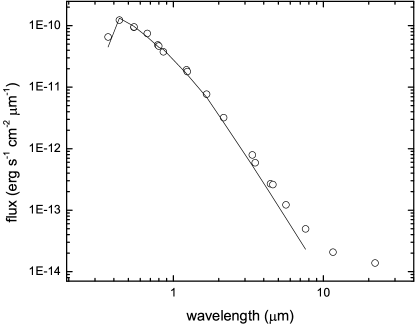
We compiled fluxes at different wavelengths from several sources to build the spectral energy distribution (SED) from optical to far-infrared. Magnitudes were transformed to fluxes using the standard zero magnitude fluxes; the results are shown in Table 3.
We performed a fit to the SED by means of Marquant-Leveberg non-linear least-square algorithm by minimization of of the function:
| (2) |
where
| (3) |
and is the flux of the primary star, is the normalized extinction curve, is the ratio of extinction at to reddening, is the distance to the binary and is the primary physical radius. Since the secondary is not detected in the spectrum it was not considered in the fit. For further information about the fitting procedure see Mennickent et al. (2010).
The parameters and obtained in Section 3.2 were used to obtain a synthetic spectrum with metallicity from the grid of BT-NextGen (AGSS2009) spectra available at the Spanish Virtual Observatory666http://svo.cab.inta-csic.es/main/index.php and the parameters and were the free parameters. We minimized the between the observed SED and the synthetic spectrum and converted to absolute units using the distance to the LMC of mag (Pietrzyński et al., 2013).
The result of the fit gives and , compatible with the excess derived from the H emission strength in Sec. 4.4. We calculate the ranges of primary mass from
| (4) |
where and are in solar units and surface gravity is in CGS system of units. The radius and surface gravity are compatible with a primary mass between 0.3 and 5.9 M⊙. The fit and the data are shown in Fig. 5; the small infrared excess remaining at WISE and bands could indicate emission from circumstellar material. The obtained radius excludes the main sequence nature for the primary, as expected from the large brightness of this cool star located in the LMC.

| Phase | Y ii (4 883.7 Å) | Ba ii (4 934.1 Å) | Ba ii (5 853.7 Å) | Ca i (5 857.5 Å) | ||||
|---|---|---|---|---|---|---|---|---|
| (km s-1) | (km s-1) | (km s-1) | (km s-1) | (km s-1) | (km s-1) | (km s-1) | (km s-1) | |
| 0.04 | 1.016 | -0.317 | -0.281 | 2.330 | ||||
| 0.22 | -1.392 | -1.636 | -2.176 | -2.236 | ||||
| 0.25 | 0.221 | 0.438 | 1.074 | 2.768 | ||||
| 0.47 | 0.711 | -1.228 | 0.729 | 2.632 | ||||
| 0.62 | -0.604 | -1.342 | -0.108 | -0.358 |
3.4 Radial velocity study of photospheric lines
The optical and near-infrared spectrum of ELHC 10 is dominated by metallic lines of the F-type primary. The spectral lines are redshifted by amounts of roughly 3 Å, typical for LMC stars. Interesting, some metallic lines are split in discrete absorption components (Fig. 6). Line identification was made by comparing line positions with theoretical line wavelengths (Kurucz, 1993). Radial velocities (RVs) were measured by calculating the positions of the line centre with a Gaussian fit using the IRAF SPLOT task. In the case where lines were blended, we employed a deblending method to isolate the components by fitting multiple gaussians to the observed profiles. We performed this task with the IRAF deblending ‘d’ routine available in the SPLOT package.
Firstly, we measured RVs of lines clearly representative of the primary motion. The four absorption lines used for this purpose were Ba ii 4934.1 and 5853.7 Å, Ca i 5857.5 Å and Y ii 4883.7Å. These lines were chosen because they are “well behaved", i.e. they are not too weak to be measured, they are not contaminated by telluric features, they are not blends with lines from other elements, the lines are almost always symmetrical in comparison with the other metallic lines and they do not show additional discrete absorption components similar to other metallic lines in the optical spectra of ELHC 10. In Table 4 we report the RVs determined for each of these lines. The measures reflect very well the orbital motion of the primary (Fig. 7).
We assume a circular orbit and fit the RVs with a sine function of the form:
| (5) |
Considering all velocities with equal statistical weight we find a system velocity km s-1, semi-amplitude km s-1 with rms 6 km s-1 and phase shift . The existence of a small phase shift between the spectroscopic and photometric ephemerides is compatible with the fact that we use the ephemerides for the very minimum of the light curve, which is shifted by about from the minimum of the light curve assuming symmetrical eclipse. We reviewed the spectra throughout the spectral range to find that there is no indication for the secondary component even at minimum.
3.5 Radial velocity study of non-photospheric lines
The other prominent lines seen in the spectra are due to Ca ii, Na i and a large number of lines from Fe ii, Ti ii, Na i and Si ii and other species. They display line splitting as discrete red or blue extra absorptions depending on the phase in which the spectrum was obtained. These DACs were denominated RACs or BACs; they are not due to another stellar component because their variable morphology is incompatible with this assumption. Once the orbital motion of the primary was determined, DACs were clearly identified in the lines. In this section we report the RV measurements of these DACs.
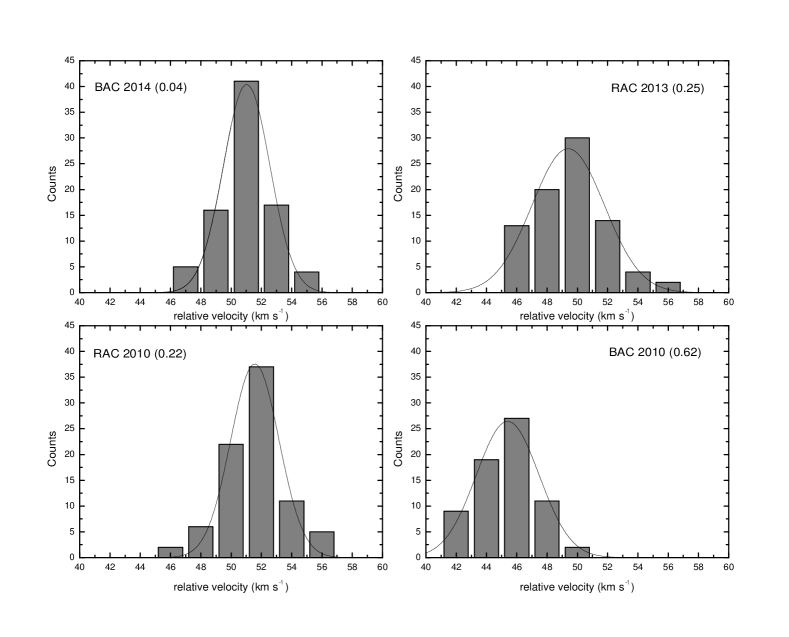
For the present study we selected 202 prominent lines to obtain accurate radial velocities. The result of this procedure is summarized in Table 5. We give the average RV of the primary, along with the velocity of the additional components for each ion. The internal error, measured by weighting the internal of individual ions in photospheric lines, usually do not exceed . In Fig. 8, we show the distribution of relative velocity between the main (photospheric) component ( and its associated RAC or BAC ().
We performed a non-linear least squares fit to the DAC velocity distributions using a gaussian function of the form:
| (6) |
The coefficients , and are given in Table 6. We notice relatively narrow distributions and that the velocity of blue or redshifted absorptions are always near km s-1, except at = 0.62 when they are around km s-1 (Fig. 8).
We also find narrow absorption components at velocity 252 km s-1 at the Si ii 6347 and 6371 Å lines. These absorptions are visible only at main eclipse, they have 3 km s-1 and are shifted by km s-1 with respect to the velocity of the system center of mass; they might be produced in a slowly expanding disc surrounding the binary or in a wind perpendicular to the orbital plane. We discard the origin in the supergiant because of the very narrow line width, not comparable with the photospheric lines seen in the spectrum. The lines are also too narrow to be formed in any Keplerian disc rotating near the stars.
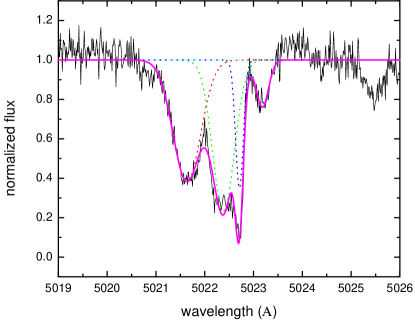
As an example of radial velocity for DACs we show in Fig. 9 the case of Fe ii 5018 Å. It is clear how the photospheric line follows the orbital motion whereas the DAC moves from blue to red and the velocity of the narrow absorption component remains stable.
| Ion | 2014 (BAC) | 2010 (RAC) | 2013 (RAC) | 2012 | 2010 (BAC) |
|---|---|---|---|---|---|
| Ba II | |||||
| Ca I | |||||
| Ca II | … | ||||
| Cr II | |||||
| Fe I | |||||
| Fe II | |||||
| Mg I | |||||
| Mg II | |||||
| Na I | |||||
| Sc I | |||||
| Sc II | |||||
| Si II | |||||
| Sr II | |||||
| Ti I | |||||
| Ti II | |||||
| Y II | |||||
| Mean (km s-1) | |||||
| Weighted mean (km s-1) |
| Phase | |||
|---|---|---|---|
| 0.04 | |||
| 0.22 | |||
| 0.25 | |||
| 0.62 |
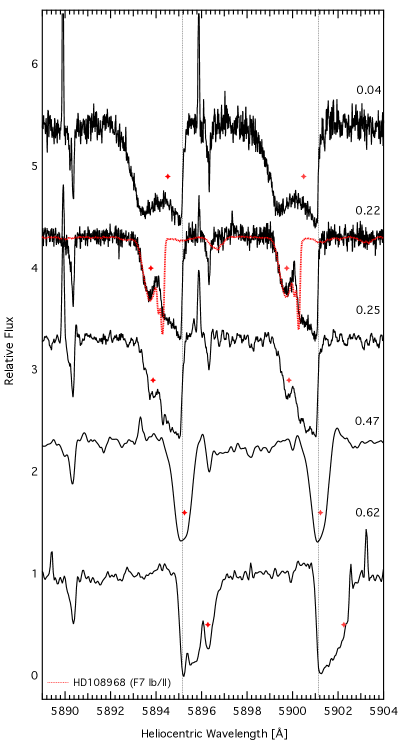
3.6 Na i D-line profiles
Perhaps the most interesting parts of the Na i D-line profiles are the discrete absorption components present at almost all orbital phases, appearing as red absorption components near quadrature (), disappearing near and changing to blue absorption components from to inferior conjunction (, Fig. 10). DACs in metallic lines follow the same behavior, and are generally of comparable strength and sometimes stronger than the main component. A triple Gaussian fit to the NaD lines at phases 0.22 and 0.25 gives a ratio of equivalent widths close to unity. The ratio of the sodium lines is equal to 2 for optically thin material and the ratio approaches unity for optically thick gas. Therefore the gas producing the NaD absorption must be optically thick. Because our star is located in the LMC, an important contribution of interstellar medium to the sodium lines would not be expected, due to the low metallicity. From the above we deduce that the material contributing to the extra absorption components in the NaD line comes from circumstellar material of high optical depth in the binary system.
Such behavior in the shape of the spectral features in Na i lines is similarly observed in the Fe ii and Ti ii lines. But quite different are the changes in the shape of ions such as Ba ii, Mg ii and Ca i-ii which usually do not show DACs (Fig. 11).
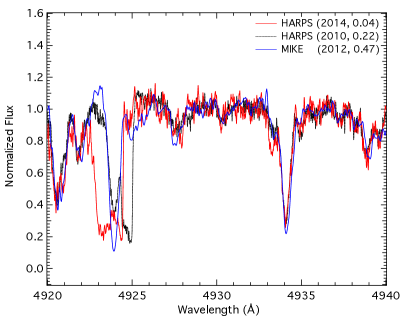
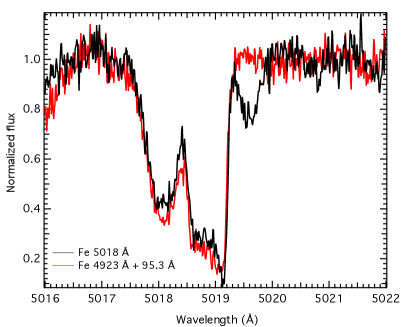
3.7 Fe i and Fe ii profiles
The variations in the profiles in both Fe ii 4923 and 5018 lines are hard to interpret in terms of simple changes in the stellar atmospheric parameters, such as the effective temperature, surface gravity and microturbulent velocity (Fig. 12). Actually, multiple components in the iron lines, up to 4 components, can sometimes appear. These components are characterized by different line widths, revealing different physical conditions in the formation regions. A similar behavior (unexplained) is reported in the interacting binary candidate OGLE004633.76731204.3 which harbors an A-type supergiant (Mennickent & Smith, 2010). In Fig. 9 we show the radial velocities of 3 components of Fe ii line at 5018 Å. It is clear how the photospheric line follows the primary motion, narrow stationary components remain stable with the velocity of the system center of mass, and DACs move from the blue to the red side of the photospheric line. A similar behavior is followed by DACs in other metallic lines.
The apparition of these variable and complex double-bottomed shapes in the profile of metallic lines in iron-groups elements, probably reflects large-scale motions with different radial velocities, in shock regions, possible representing multiples layers in between the stars. In addition, these spectral characteristics appear and are stronger at or near quadratures and disappear during secondary eclipse, as evident in the 2012 spectrum in Figs. 10 and 11. All this behavior of features strongly modulated with the orbital period suggests that DACs are produced in gas streams inside the binary system.
3.8 Signatures of s-process elements and abundance determination
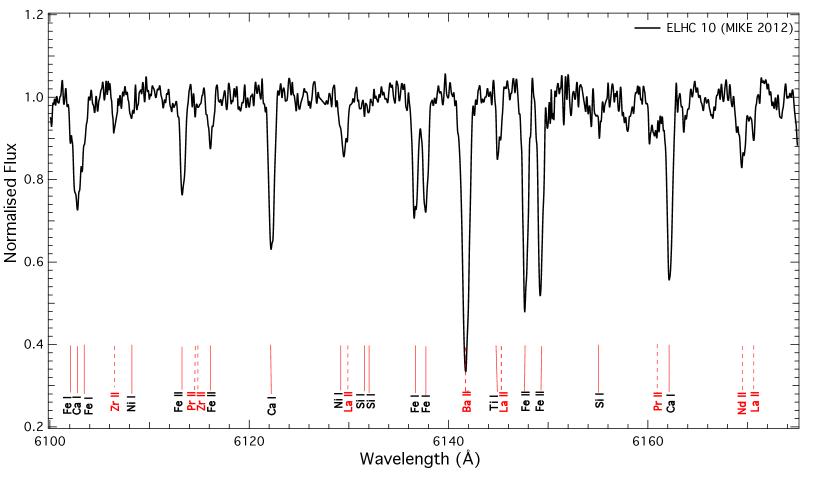
The s-process nucleosynthesis is characterized by the presence of elements created by slow neutron capture reactions in the absorption features of elements such as Ba ii at 4554.03 Å, 5853.68 Å, 6141.72 Å, and 6496.89 Å, Sr ii line at 4077.71 Å and 4215.52 Å (see, Pereira & Miranda 2007 and Kamath et al. 2014, for further details on identifying signatures of s-process enhancements in post-AGB stars).
The Ba ii, Ba i and Sr ii lines are present in our spectra and are stronger in the primary of ELHC 10 than in the F-type supergiant UVES-POP template spectrum. This fact suggests that s-process enrichment has taken place in the primary. In order to calculate the abundances of -elements and s-process species, we used the MIKE spectrum obtained on February 07, 2012 for analysis. This observation was carried out near maximum light at a phase () corresponding to the superior conjunction of the post-AGB star, when its obscuration by the circumstellar disc and the contribution from secondary star should be minimal. Additional to this, the metallic lines at this phase do not present DACs and were nearly symmetric and hence easy to measure providing unblended lines (Fig. 13).
The abundances are calculated using suitable programs coupled with state-of-the-art atmospheric models (Sneden, 1973; Kurucz, 1993) using the LTE approximation, as usual in the abundance analysis of post-AGB stars (e.g. van Aarle et al. 2013). We used as input parameters the effective temperature and surface gravity derived from our spectroscopic analysis (Section 3.2). Microturbulence velocity is obtained by removing any slope in the relation between the abundance from Fe i lines and the reduced EWs. Abundances for all the other elements are obtained from EW measurements. Usually cool stars show no evidence of significant rotation, so EWs are obtained from simple Gaussian fitting of spectral features. The NLTE effects should alter the ionization structure compared with the LTE model, but at the mild low metallicity and effective temperature of ELHC 10 this effect should be less than 0.1 dex for Fe i and 0.01 dex for Fe ii (Mashonkina et al., 2011). In any case, the effective temperature derived by us comes from the comparison with the synthetic stellar spectra library, and does not depend on the LTE assumption.
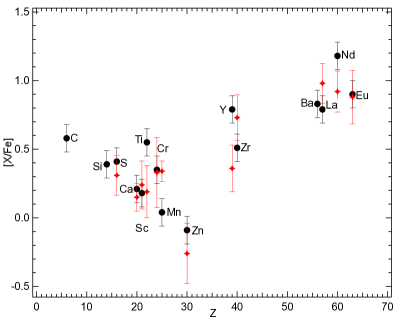
The final abundance analysis of the ELHC 10 primary yields the parameters shown in Table 7, where is the proton number and represents the number of lines used for the abundance determination of the species. The iron abundance [Fe i / H] is consistent with a star located in the low metallicity environment of the LMC.
Derived abundances for the ELHC 10 primary are plotted in Fig. 14. The simple mean of the [X/Fe] ratio for the -elements Si, S, Ca and Ti, is [/Fe]= , normal when compared with Galactic objects in this metallicity range, and consistent with the -enhancement expected for LMC stars at their respective metallicities (Pompéia et al., 2008; Van der Swaelmen et al., 2013). In Fig. 14 we also compare the derived abundances of ELHC 10 with the abundances of J053253.51695915.1, which is a post-AGB star confirmed in the LMC (van Aarle et al., 2013). It is clear that the primary of ELHC 10 shows light s-process elements (magic neutron number 50) around Y and Zr which confirms the post-second dredge-up status of our star (Van Winckel, 2003).
As a by-product of our abundance analysis we calculated a microturbulence velocity of 0.5 km s-1 and an upper limit for the projected rotational velocity of km s-1. The last figure comes from the width of the wings of the line profiles considering that a contribution of macro-turbulent velocity is also present.
| Species | [X/H] | [X/Fe] | ||||
|---|---|---|---|---|---|---|
| C i | 2 | 8.72 | 8.52 | 0.20 | 0.58 | 6 |
| Si i | 1 | 7.56 | 7.55 | 0.01 | 0.39 | 14 |
| S i | 2 | 7.36 | 7.33 | 0.03 | 0.41 | 16 |
| Ca i | 3 | 6.19 | 6.36 | -0.17 | 0.21 | 20 |
| Sc ii | 2 | 2.97 | 3.17 | -0.20 | 0.18 | 21 |
| Ti ii | 2 | 5.19 | 5.02 | 0.17 | 0.55 | 22 |
| Cr ii | 1 | 5.64 | 5.67 | -0.03 | 0.35 | 24 |
| Mn i | 2 | 5.05 | 5.39 | -0.34 | 0.04 | 25 |
| Fe i | 15 | 7.12 | 7.50 | -0.38 | … | 26 |
| Zn i | 1 | 4.13 | 4.60 | -0.47 | -0.09 | 30 |
| Y ii | 3 | 2.65 | 2.24 | 0.41 | 0.79 | 39 |
| Zr ii | 1 | 2.73 | 2.60 | 0.13 | 0.51 | 40 |
| Ba ii | 1 | 2.79 | 2.34 | 0.45 | 0.83 | 56 |
| La ii | 1 | 1.67 | 1.26 | 0.41 | 0.79 | 57 |
| Nd ii | 1 | 2.30 | 1.50 | 0.80 | 1.18 | 60 |
| Eu ii | 1 | 1.03 | 0.51 | 0.52 | 0.90 | 63 |
4 Discussion
In this Section we calculate the system mass function using results of our radial velocity analysis and discuss the possible scenarios for the system that are compatible with the existing data.
4.1 On the nature of the primary star
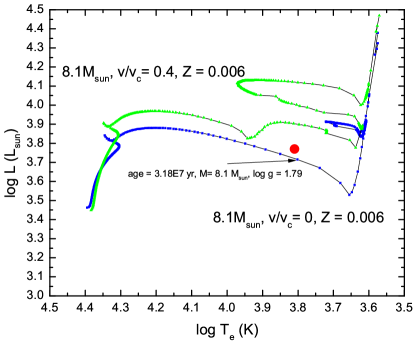
Using the Stefan-Boltzmann law, the radius obtained from the SED fit and the spectroscopic temperature, the luminosity of the primary turns to be . Using by de Wit et al. (2002) and neglecting the bolometric correction for a mid-F supergiant (Cox, 2000) we get and the previous value is confirmed. We have compared the luminosity and temperature of the primary with the evolutionary tracks of single stars at metallicity = 0.006 provided by Georgy et al. (2013). The primary closely fits the model of an initially (and present) 8.1 M⊙ star at an age of yr but with a relatively large surface gravity log g = 1.79 (Fig. 15). This high mass primary does not fit our results for the mass range and surface gravity inferred from the SED and the spectrum as given in Section 3.3. Moreover, it produces a problematic very high mass secondary as we will show in the next Section.
4.2 Constraints on the mass of the unseen secondary star and the semidetached case
We calculate the mass function defined for a single-lined spectroscopic binary as (Hilditch, 2001):
| (7) |
where is the orbital period in days, is the inclination of the orbit and the primary radial velocity half-amplitude in km s-1.
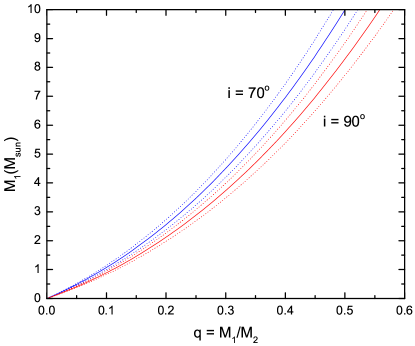
Assuming an eccentricity and using our derived we get 0.55 M⊙. The possible masses for the secondary for a range of possible inclinations and primary masses, are shown in Fig. 16. It is clear that the secondary is always more massive that the primary. Since it is not detected either in the continuum or in the line spectrum probably it is hidden by the eclipsing structure.
We notice that, according to equation (6), a primary of 8.1 M⊙ implies a (unseen) secondary of at least 16 M⊙. It is hard to explain why this high mass star does not heat the dark cool eclipsing structure. Let’s remember that to explain the equal depth in the eclipses at different bandpasses and the similar strength of the lines inside/outside the main eclipse a dark cool structure is required.
Let’s explore now the consequences of a possible semidetached configuration that should explain the existence of the eclipsing opaque structure as a disc produced by mass transfer due to Roche-lobe overflow. Assuming that the primary fills its Roche lobe, their mean density should be constrained by the orbital period for as (in our nomenclature ):
| (8) |
where is the orbital period in hours (e.g. Frank et al. 2002). For ELHC 10 we find . Using this value, the radius derived in the previous section and assuming spherical symmetry we calculate a mass for the primary . Surprisingly, this is very near the mass of a Post-AGB star with the observed luminosity. In fact, using the luminosity-core mass relation given by Wood & Zarro (1981) we obtain , which fits the primary mass restrictions derived in Section 3.3. With this mass we get a mass-ratio (for = 90o) and a mass for the unseen secondary star M⊙, consisting of a main-sequence B2 V star. We conclude that an hypothetical semidetached configuration should imply a low-mass primary consistent with a Post-AGB classification, as is discussed in the next section.
4.3 Exploring the association with N120
The association with N120 yields interesting clues on the history of the system. N120 is a young association: the presence of H ii regions and a SNR suggest an age of about 10 Myr (Laval et al., 1992). This age imposes a problem for the evolutionary stage of the low-mass primary. There has not been enough time for the low-mass primary to evolve to the observed supergiant stage. The problem disappears if the primary has evolved from an initially higher mass star in an evolutionary channel strongly influenced by the presence of the binary companion. For instance, the primary could have lost significant amounts of matter by Roche lobe overflow during a semidetached stage as happens in Algols. In this case, a primary of several solar masses is expected in ELHC 10 before mass ratio reversal, since the total mass is about 7 or 9 solar masses. On the contrary, a low mass progenitor is expected for the evolution of a single post-AGB star. Evolutionary tracks for single AGB stars have been published by Vassiliadis & Wood (1994). Extrapolating these models (that are for ) to the mass of ELHC 10 we find mass for the progenitor of 1.5 (De Smedt et al., 2012). Possibly the evolution have followed a different path in the post-AGB star of ELHC 10, because of the presence of the companion and epochs of significant mass transfer. This conjecture is consistent with the existence of massive post-AGB stars (; Ventura et al. 2015). Since the amount of mass lost by the system during this process is hard to know, we cannot reconstruct the history of the binary and the evolutionary track up to the progenitors.
We notice that the expected progenitor for a 0.62 M⊙ post-AGB stars is 1.5 . It is impossible that this star has evolved to the current evolutionary stage as a single star if we assume the same age as the nebular complex N120.
4.4 H emission and discs
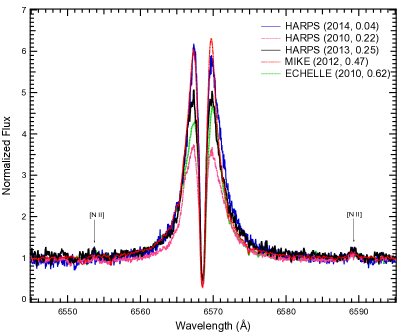
H is the most intense line in the spectra and shows a double-peak emission, broad wings extending from 6557 to 6582 Å and a mean separation of the blue and red peak of km s-1 with the blue peak approximately equal to the red peak. The H emission is characterized by several parameters whose values are given in Table 8. The strong H double-peak emission is consistent with the presence of an emitting disc. The central absorption component in the H profile remains with the same radial velocity in spite of changes in the radial velocity of the primary over the years (see Fig. 17 and Table 8). The same occurs for the position of the violet and red emission peaks. The velocity of the central core is km s-1, blue shifted from the systemic velocity, i.e. at velocity 260 km s-1. The constancy of this velocity is possible if (i) the disc is around a star considerably more massive than the primary, therefore it performs small (undetected) motions around the system center of mass or (ii) most of the emission comes from a slowly expanding circumbinary disc extending beyond the binary to considerable distances, producing a column density large enough to produce the almost stationary H central absorption. In the following we give arguments favoring this last possibility.
Emission from a circumbinary disc is consistent with the fact that the velocity of the H central absorption is practically the same as the velocity of the nebular complex N 120 C4 and C5 that are close to our star; viz. 260 km s-1 (Section 2.2). It is also consistent with the detection of stationary N ii 6548, 6583 Å forbidden emission lines, which are commonly attributed to low density material in the circumstellar environment. It is possible that the H emitting disc extends into the interstellar medium to zones of low density where forbidden emission lines are produced. The circumbinary disc should be optically thin, to explain the steep Balmer emission decrement, and contribute with free-free emission to the system at infrared wavelengths (Fig. 5). In addition, the large H central absorption indicates strong self-absorption, this is possible if the disc is coplanar (or almost coplanar) with the binary. Finally, the disc is not eclipsed by the primary, as reveals the H equivalent width during secondary eclipse (Table 8).
| Phase | Instrument | -EW | IV/ICont. | IR/ ICont. | IC/ ICont. | IV/ IR | RVmean | Vpeak | FWHM | E |
|---|---|---|---|---|---|---|---|---|---|---|
| (Å) | (km s-1) | (km s-1) | (km s-1) | (mag) | ||||||
| 0.04 | HARPS (2014) | 25.5 | 6.19 | 5.91 | 0.42 | 1.05 | 260 | 112 | 304 | 0.05 |
| 0.22 | HARPS (2010) | 26.0 | 4.31 | 4.24 | 0.33 | 1.02 | 260 | 118 | 269 | 0.05 |
| 0.25 | HARPS (2013) | 22.8 | 5.07 | 5.04 | 0.45 | 1.01 | 259 | 114 | 244 | 0.05 |
| 0.47 | MIKE (2012) | 24.5 | 6.03 | 6.30 | 0.29 | 0.96 | 260 | 112 | 247 | 0.05 |
| 0.62 | ECHELLE (2010) | 21.3 | 3.98 | 4.34 | 0.19 | 0.92 | 262 | 110 | 234 | 0.04 |
The circumbinary disc analyzed in this section is different from the opaque structure around the secondary. In fact, Balmer emission can be produced in a relatively hot disc (T 10.000 ) but the opaque structure (probably another disc) around the secondary is cool; it does not contribute significantly to the flux in the optical region as evident from the constancy of line depths during the orbital cycle, even during eclipse (Fig. 11). Coexistent circumstellar and circumbinary discs have been also found in some post-AGB binaries (Gorlova et al., 2012, 2015; Hillen et al., 2013, 2014, 2015).
4.5 On the line splitting observed in ELHC 10
Line splitting is a very particular property of ELHC 10. It is observed in metallic lines, especially lines of Fe i, Fe ii and Ti ii, but disappears near secondary minimum at = 0.47. Since these lines are stronger at this phase, it is possible that DACs and photospheric lines are blended. Line splitting are not observed in Ba ii, Ca i, Mg ii and Si ii lines except during main eclipse at phase = 0.04 (at least Ba ii and Si ii that are spectrally covered at this phase). Line splitting occurs in the form of DACs displaced to the red or blue side of the photospheric line.
Line splitting has been observed in lines of heavy elements in post-AGB stars with C-rich circumstellar environments and explained by structured atmospheres (Klochkova, Panchuk, & Tavolzhanskaya, 2015). For instance, in V 5112 Sgr the Ba ii line profiles are split in multiple components (Klochkova, 2013). The case of ELHC 10 is different, since its primary is not carbon-rich and the alternated visibility of DACs during the orbital cycle exclude any interpretation in terms of an structured envelope. In fact, lines formed in an structured envelope around the primary should follow the primary motion during the orbital cycle with a blue velocity shift, but not move from the red to the blue side of a line formed in the photosphere. In addition, we do not observe DACs in ELHC 10 only in s-process elements, as in V 5112 Sgr, but also in metallic lines of light elements.
In ELHC 10 DACs are probably formed by occultation of the primary photosphere by dense and extended gas regions co-rotating with the binary. This view is supported by the large strength of the features and their radial velocity behavior. Since the number of available spectra is limited, we cannot go deeper in this interpretation.
Evidence for interaction has been observed in the Galactic post-AGB star BD46o 442, an evolved binary with gas streams, jets and disc (Gorlova et al., 2012).
Contrary to ELHC 10, this last system shows strong orbital variability at the H emission; this line has been interpreted
as formed in the disc around the secondary and the H blue-shifted absorption in terms of a disc jet (Gorlova et al., 2012).
4.6 ELHC 10 in the context of post-AGB binaries
70 high probability and 1337 candidate post-AGB LMC stars have been catalogued by van Aarle et al. (2011). About half of them are probably binaries, a distinction made based on the shape of the spectral energy distribution, indicating a stable and likely Keplerian disc. This is a surprising result, since one could expect that the residual material from the AGB mass loss should be found in an expanding envelope. Therefore, it has been suggested that the formation of a circumbinary disc plays a major role in the evolution of post-AGB systems (van Winckel, 2007). Very few of these binaries have been studied in detail. To our knowledge, ELHC 10 could be the first post-AGB binary in the Large Magellanic Cloud, and the post-AGB binary with the highest progenitor mass and the highest-mass companion known.
Hitherto the process of disc formation in post-AGB stars remains obscure. For instance, Livio & Soker (1988) and Sandquist et al. (1998) showed that the disc can be the result of the AGB evolution after engulfing the companion with a common envelope. Other scenario proposes a disc-like structure formed by wind accretion (Mastrodemos & Morris, 1999). Finally, the disc can be the result of interaction between the AGB wind and the disc jet (Akashi & Soker, 2008). While these scenarios can be possible in some systems at some evolutionary stages, the current observations of ELHC 10 suggest that equatorial mass loss through the outer Lagrangian points could form a circumbinary disc. This is consistent with Roche-lobe overflow and the presence of a large and thick disc surrounding the secondary star. The kind of outflows that possibly explain the DACs have been predicted by hydrodynamical simulations of gas dynamics in close interacting binaries (Bisikalo et al., 2003; Sytov et al., 2007). To accept this view, we need to assume a non-standard evolution for the post-AGB star, as explained in Section 4.3.
5 Conclusion
In this paper we have studied the very interesting and complex eclipsing binary ELHC 10, located in the young nebular complex N120 in the Large Magellanic Cloud. While we have determined solid constrains for some parameters of the system, some others remains unbounded. The following is a list of our main conclusions:
-
•
We find that ELHC 10 is a SB1 long-period eclipsing binary with the main eclipse produced by a dark structure hiding the secondary star.
-
•
For the primary we determined an effective temperature of 6500 250 , log g = 1.0 0.5 and luminosity 5970 L☉.
-
•
From their radial velocities we find a mass function of 7.37 0.55 M☉.
-
•
If the primary fills its Roche lobe it also fits the core-luminosity relationship of a post-AGB star with a mass of 0.625 M☉. The abundance pattern is consistent with this classification.
-
•
A 8.1 M☉ primary fits the observed luminosity and temperature in a detached configuration, but implies a secondary of at least 16 M☉ and it is hard to explain why this high-mass star is not visible and does not heat their surrounding dark structure. Another problem with the high-mass primary is its late evolutionary stage, since the unseen secondary should be far more evolved, larger and luminous.
-
•
The very likely membership to the young nebular complex N120 suggests that the only way for the primary to has arrived to the observed advanced evolutionary stage (low-mass primary case) is from an initially much more massive star, something that could has occurred by mass transfer due to Roche lobe overflow in a semidetached binary.
-
•
We find a prominent stationary H double emission line which we attribute to a circumbinary disc.
-
•
We discovered line splitting of metallic lines characterized by discrete absorption components (DACs) observed alternatively at the blue and red side of the photospheric line profiles during the orbital cycle.
-
•
These DACs are similar in appearance to those observed in carbon-rich post-AGB stars (Klochkova, Panchuk, & Tavolzhanskaya, 2015), but cannot be interpreted as evidence for structured atmosphere as done by these authors for carbon-rich post-AGB systems.
-
•
One possible interpretation for the DACs observed in ELHC 10 are gas streams in an interacting binary.
6 Acknowledgments
We thank W. Gieren, G. Pietrzyński and Araucaria-project observers for their help with data acquisition. We also thank Dr. Claus Tappert for useful discussions on this object and Dr. Willem-Jan de Wit by providing us the EROS light curves and also thanks for being the referee whose comments helped to improve a first version of this manuscript. This publication makes use of VOSA, developed under the Spanish Virtual Observatory project supported from the Spanish MICINN through grant AyA2008-02156. This research has made use of the SIMBAD database, operated at CDS, Strasbourg, France. We acknowledge the use of data from the UVES Paranal Observatory Project ESO DDT Program ID 266.D-5655. R.E.M. acknowledges support by VRID-Enlace 214.016.001-1.0, Fondecyt 1110347 and the BASAL Centro de Astrofísica y Tecnologías Afines (CATA) PFB–06/2007. This research was funded in part by the Ministry of Education, Science and Technological Development of Republic of Serbia through the project Stellar Physics (No. 176004). S.V. gratefully acknowledges the support provided by Fondecyt reg. 1130721.
References
- Akashi & Soker (2008) Akashi M., Soker N., 2008, New Astronomy, 13, 157
- Alcock et al. (1999) Alcock C., Allsman R. A., Alves D. R., Axelrod MACHO Collaboration 1999, PASP, 111, 1539
- Cox (2000) Cox A. N., 2000, Allen’s astrophysical quantities, 4th ed. Publisher: New York: AIP Press; Springer, 2000. Editedy by Arthur N. Cox. ISBN: 0387987460
- Ansari & EROS Collaboration (2001) Ansari R., EROS Collaboration 2001, in Brainerd T. G., Kochanek C. S., eds, Gravitational Lensing: Recent Progress and Future Go Vol. 237 of Astronomical Society of the Pacific Conference Series, Probing Galactic Structure Using Microlensing with EROS-2. p. 235
- Bagnulo et al. (2003) Bagnulo S., Jehin E., Ledoux C., Cabanac R., Melo C., Gilmozzi R., ESO Paranal Science Operations Team 2003, The Messenger, 114, 10
- Bisikalo et al. (2003) Bisikalo D. V., Boyarchuk A. A., Kaigorodov P. V., Kuznetsov O. A., 2003, ARep, 47, 809
- Bohannan & Epps (1974) Bohannan B., Epps H. W., 1974, A&AS, 18, 47
- Bujarrabal et al. (2015) Bujarrabal V., Castro-Carrizo A., Alcolea J., Van Winckel H., 2015, A&A, 575, 7
- Carrera et al. (2008) Carrera R., Gallart C., Hardy E., Aparicio A., & Zinn R., 2008, AJ, 135, 836
- Cioni et al. (2000) Cioni M. R., Loup C., Habing H. J., Fouqué P., Bertin E., Deul E., 2000, A&AS, 144, 235C
- Coelho et al. (2005) Coelho P., Barbuy B., Meléndez J., Schiavon R. P., Castilho B. V., 2005, A&A, 443, 735
- Dachs et al. (1988) Dachs J., Kiehling R., Engels D., 1988, A&A, 194, 167
- De Smedt et al. (2012) De Smedt K., Van Winckel H., Karakas A. I., Siess L., Goriely S., Wood P. R., 2012, A&A, 541, A67
- de Ruyter et al. (2006) de Ruyter S., van Winckel H., Maas T., Lloyd Evans T., 2006, A&A, 448, 641
- de Ruyter et al. (2005) de Ruyter S., van Winckel H., Dominik C., Waters L. B. F. M., Dejonghe H., 2005, A&A, 435, 161
- de Wit et al. (2002) de Wit W. J., Beaulieu J. P., Lamers H. J. G. L. M., 2002, A&A, 395, 829
- de Wit et al. (2005) de Wit W. J., Beaulieu J. P., Lamers H. J. G. L. M., Coutures C., Meeus G., 2005, A&A, 432, 619
- Dong et al. (2014) Dong S., Katz B., Prieto J. L., Udalski A., Kozlowski S., Street R. A., Bramich D. M., Tsapras Y., Hundertmark M., Snodgrass C., Horne K., Dominik M., Figuera Jaimes R., 2014, ApJ, 788, 41
- Frank et al. (2002) Frank J., King A., Raine D. J., 2002, Accretion Power in Astrophysics: Third Edition
- Gałan et al. (2012) Gałan C., Mikołajewski M., Tomov T.; Graczyk D., Apostolovska G., Barzova I., 2012, A&A, 544, 53
- Georgy et al. (2013) Georgy C., Ekström S., Granada A., Meynet G., Mowlavi N., Eggenberger P., Maeder A., 2013, A&A, 553, A24
- Gielen et al. (2009) Gielen C., van Winckel H., Reyniers M., Zijlstra A., Lloyd Evans T., 2009, A&A, 508, 1391
- Gielen et al. (2008) Gielen C., van Winckel H., Min M., Waters L. B. F. M., Lloyd Evans T., 2008, A&A, 490, 725
- Gorlova et al. (2015) Gorlova N., Van Winckel H., Ikonnikova N. P., Burlak M. A., Komissarova G. V., 2015, MNRAS, 451, 2462
- Gorlova et al. (2012) Gorlova N., Van Winckel H., Gielen C., Raskin G., Prins S., Pessemier W., 2012, A&A, 542, A27
- Grison et al. (1995) Grison P., Beaulieu J.-P., Pritchard J. D., Tobin W., Ferlet 1995, A&AS, 109, 447
- Hoard et al. (2010) Hoard, D.W., Howell, S. B., & Stencel, R. E. 2010, AJ, 714, 459
- Henize (1956) Henize K. G., 1956, ApJS, 2, 315
- Hilditch (2001) Hilditch R. W., 2001, An Introduction to Close Binary Stars, by R. W. Hilditch, pp. 392. ISBN 0521241065. Cambridge, UK: Cambridge University Press, March 2001.
- Hillen et al. (2015) Hillen M., de Vries B. L., Menu J., Van Winckel H., 2015, A&A, 578, 40.
- Hillen et al. (2013) Hillen M., Verhoelst T., Van Winckel H., Chesneau O., Hummel C. A.; 2013, A&A, 559, 111.
- Hillen et al. (2014) Hillen M., Menu J., Van Winckel H., Min M., Gielen C., 2014, A&A, 568, 12.
- Kamath et al. (2014) Kamath D., Wood P. R., Van Winckel H., 2014, MNRAS, 439, 2211
- Klochkova (2013) Klochkova V. G., 2013, Astronomy Letters, 39, 765
- Klochkova, Panchuk, & Tavolzhanskaya (2015) Klochkova V. G., Panchuk V. E., Tavolzhanskaya N. S., 2015, AstL, 41, 14
- Kloppenborg et al. (2015) Kloppenborg B. K., Stencel R. E., Monnier J. D., Schaefer G. H., Baron F., Tycner C., 2015, ApJS, 220, 14
- Kovtyukh (2007) Kovtyukh V. V., 2007, MNRAS, 378, 617.
- Kurucz (1993) Kurucz R., 1993, SYNTHE Spectrum Synthesis Programs and Line Data. Kurucz CD-ROM No. 18. Cambridge, Mass.: Smithsonian Astrophysical Observatory, 1993., 18
- Lamers et al. (1999) Lamers H. J. G. L. M., Beaulieu J. P., de Wit W. J., 1999, A&A, 341, 827
- Laval et al. (1992) Laval A., Rosado M., Boulesteix J., Georgelin Y. P., Le Coarer E., Marcelin M., Viale A., 1992, A&A, 253, 213
- Livio & Soker (1988) Livio M., Soker N., 1988, ApJ, 329, 764
- Mashonkina et al. (2011) Mashonkina L., Gehren T., Shi J.-R., Korn A. J., Grupp F., 2011, A&A, 528, 87
- Martínez González et al. (2015) Martínez González M. J., Asensio Ramos A., Manso Sainz R., Corradi R. L. M., Leone F., 2015, A&A, 574, 16.
- Mastrodemos & Morris (1999) Mastrodemos N., Morris M., 1999, ApJ, 523, 357
- Meixner et al. (2006) Meixner M., Gordon K. D., Indebetouw R., Hora J. L., Whitney B., Blum R., Reach W., Bernard J.-P., Meade M., Babler 2006, AJ, 132, 2268
- Mennickent et al. (2012) Mennickent R. E., Djurašević G., Kołaczkowski Z., Michalska G., 2012, MNRAS, 421, 862
- Mennickent et al. (2010) Mennickent R. E., Kołaczkowski Z., Graczyk D., Ojeda J., 2010, MNRAS, 405, 1947
- Mennickent & Smith (2010) Mennickent R. E., Smith M. A., 2010, MNRAS, 407, 734
- Mennickent et al. (2010) Mennickent R. E., Smith M. A., Kołaczkowski Z., Pietrzyński G., Soszyński I., 2010, PASP, 122, 662
- Oestreicher & Schmidt-Kaler (1996) Oestreicher M. O., Schmidt-Kaler T., 1996, A&AS, 117, 303
- Pereira & Miranda (2007) Pereira C. B., Miranda L. F., 2007, A&A, 462, 231
- Pietrzyński et al. (2013) Pietrzyński G., Graczyk D., Gieren W., Thompson I. B., Pilecki B., Udalski 2013, Nature, 495, 76
- Pompéia et al. (2008) Pompéia L., Hill V., Spite M., Cole A., Primas F., Romaniello M., Pasquini L., Cioni M.-R., Smecker Hane T., 2008, A&A, 480, 379
- Rattenbury et al. (2015) Rattenbury N. J., Wyrzykowski Ł., Kostrzewa-Rutkowska Z., Udalski A., Kozłowski S., Szymański 2015, MNRAS, 447, L31
- Sandquist et al. (1998) Sandquist E. L., Taam R. E., Chen X., Bodenheimer P., Burkert A., 1998, ApJ, 500, 909
- Scott et al. (2014) Scott E. L., Mamajek E. E., Pecaut M. J., Quillen A. C., Moolekamp F., Bell C. P. M., 2014, ApJ, 797, 6
- Skrutskie et al. (2006) Skrutskie M. F., Cutri R. M., Stiening R., Weinberg M. D., Schneider 2006, AJ, 131, 1163
- Smith & MCELS Team (1999) Smith R. C., MCELS Team 1999, in Chu Y.-H., Suntzeff N., Hesser J., Bohlender D., eds, New Views of the Magellanic Clouds Vol. 190 of IAU Symposium, The UM/CTIO Magellanic Cloud Emission-line Survey. p. 28
- Sneden (1973) Sneden C. A., 1973, PhD thesis, The University of Texas at Austin.
- Soszyñski et al. (2009) Soszyñski I., Udalski A., Szymañski M. K., Kubiak M., Pietrzyñski G., Wyrzykowski Ł., Szewczyk O., Ulaczyk K., Poleski R., 2009, AcA, 59, 239
- Stellingwerf (1978) Stellingwerf R. F., 1978, ApJ, 224, 953
- Sytov et al. (2007) Sytov A. Y., Kaigorodov P. V., Bisikalo D. V., Kuznetsov O. A., Boyarchuk A. A., 2007, Astronomy Reports, 51, 836
- Thomas (2012) Thomas, J. D., 2012, PhD thesis, The University of Toledo
- Udalski et al. (2002) Udalski A., Paczynski B., Zebrun K., Szymanski M., Kubiak M., Soszynski I., Szewczyk O., Wyrzykowski L., Pietrzynski G., 2002, AcA, 52, 1
- Udalski et al. (2000) Udalski A., Szymanski M., Kubiak M., Pietrzynski G., Soszynski I., Wozniak P., Zebrun K., 2000, AcA, 50, 307
- Udalski et al. (2008) Udalski A., Szymanski M. K., Soszynski I., Poleski R., 2008, AcA, 58, 69
- van Aarle et al. (2013) van Aarle E., Van Winckel H., De Smedt K., Kamath D., Wood P. R., 2013, A&A, 554, 106
- van Aarle et al. (2011) van Aarle E., van Winckel H., Lloyd Evans T., Ueta T., Wood P. R., Ginsburg A. G., 2011, A&A, 530, A90
- Van der Swaelmen et al. (2013) Van der Swaelmen M., Hill V., Primas F., Cole A. A., 2013, A&A, 560, 44.
- van Winckel (2007) Van Winckel H., 2007, BaltA, 16, 112
- Van Winckel (2003) Van Winckel H., 2003, ARAA, 41, 391
- Van Winckel et al. (1995) Van Winckel H., Waelkens C., Waters L. B. F. M., 1995, A&A, 293, 25
- Vassiliadis & Wood (1994) Vassiliadis E., Wood P. R., 1994, ApJS, 92, 125
- Ventura et al. (2015) Ventura P., Karakas A. I., Dell’Agli F., Boyer M. L., García-Hernández D. A., 2015, MNRAS, 450, 3181
- Witt et al. (2009) Witt Adolf N., Vijh Uma P., Hobbs L. M., Aufdenberg Jason P., Thorburn Julie A., York Donald G., 2009, ApJ, 693, 1946
- Wood & Zarro (1981) Wood P. R., Zarro D. M., 1981, ApJ, 247, 247
- Wright et al. (2010) Wright E. L., Eisenhardt P. R. M., Mainzer A. K., Ressler M. E., Cutri R. M., Jarrett 2010, AJ, 140, 1868