Disruption of Molecular Clouds by Expansion of Dusty H II Regions
Abstract
Dynamical expansion of H II regions around star clusters plays a key role in dispersing the surrounding dense gas and therefore in limiting the efficiency of star formation in molecular clouds. We use a semi-analytic method and numerical simulations to explore expansion of spherical dusty H II regions and surrounding neutral shells and the resulting cloud disruption. Our model for shell expansion adopts the static solutions of Draine (2011) for dusty H II regions and considers the contact outward forces on the shell due to radiation and thermal pressures as well as the inward gravity from the central star and the shell itself. We show that the internal structure we adopt and the shell evolution from the semi-analytic approach are in good agreement with the results of numerical simulations. Strong radiation pressure in the interior controls the shell expansion indirectly by enhancing the density and pressure at the ionization front. We calculate the minimum star formation efficiency required for cloud disruption as a function of the cloud’s total mass and mean surface density. Within the adopted spherical geometry, we find that typical giant molecular clouds in normal disk galaxies have , with comparable gas and radiation pressure effects on shell expansion. Massive cluster-forming clumps require a significantly higher efficiency of for disruption, produced mainly by radiation-driven expansion. The disruption time is typically of the order of a free-fall timescale, suggesting that the cloud disruption occurs rapidly once a sufficiently luminous H II region is formed. We also discuss limitations of the spherical idealization.
Subject headings:
galaxies: star clusters — galaxies: star formation — H II regions — ISM: clouds — ISM:kinematics and dynamics — stars: formation1. Introduction
Giant molecular clouds (GMCs) are the sites of star formation in galaxies. They are highly structured, consisting of hierarchy of clumps, filaments, and sheets resulting from shock interactions in supersonic turbulence (Elmegreen & Scalo, 2004; André et al., 2014). Stars predominantly form in groups (later becoming OB associations or clusters) within dense, gravitationally-bound clumps inside GMCs (Lada & Lada, 2003). Newborn star clusters have a profound influence on the surrounding interstellar medium (ISM) via protostellar outflows, stellar winds, ionizing radiation, and supernova explosions, which are collectively referred to as stellar feedback. The question of how each feedback process affects formation, evolution, and dispersal of their natal clouds is an active and contentious area of research (see Dobbs et al. 2014 and Krumholz et al. 2014 for recent reviews).
An important unsolved problem in star formation theory is what determines net star formation efficiency of a cloud, defined as the fraction of the cloud’s mass that is turned into stars over its lifetime. GMCs are known to be inefficient in converting gas into stars. Over their lifetime, individual GMCs in the Milky Way appear to turn only a few to several percent of their mass into stars (Myers et al., 1986; Williams & McKee, 1997; Carpenter, 2000; Evans et al., 2009; Kennicutt & Evans, 2012; García et al., 2014). Furthermore, observations of Galactic infrared dark clouds, nearby galaxies, and high-redshift star-forming galaxies all point to a conclusion that the depletion time of molecular gas is more than an order of magnitude longer than the internal dynamical timescale (e.g., Krumholz & Tan, 2007; Genzel et al., 2010; Krumholz et al., 2012; Leroy et al., 2013).
Observations and theoretical arguments indicate that star formation efficiency tends to be higher within high-density environments (Elmegreen & Efremov, 1997; McKee & Ostriker, 2007). For example, the estimated star formation efficiencies of cluster-forming clumps for low-mass clusters in the solar neighborhood is –, higher than the few percent efficiency of entire GMCs (Lada & Lada, 2003). The Orion Nebula Cluster, which has been forming stars for several dynamical times (Tan et al., 2006), appears to have stellar fraction (Da Rio et al., 2014). Observations of massive, dense clouds in dwarf starburst galaxies containing nascent super star clusters indicate efficiencies (Meier et al., 2002; Turner et al., 2015). Gas expulsion from protoclusters is also important in the context of disruption or survival of a stellar cluster (e.g., Hills, 1980; Elmegreen, 1983; Goodwin, 1997; Lada & Lada, 2003; Banerjee & Kroupa, 2015). If star formation efficiency is sufficiently high, a star cluster may remain gravitationally bound and thus become long-lived. If star formation efficiency varies with the mass of protocluster, it is likely to leave an imprint on the shape of the cluster mass function distinct from the cloud mass function (e.g., Ashman & Zepf, 2001; Kroupa & Boily, 2002; Fall et al., 2010).
A number of theoretical studies have proposed that H II regions may be the primary means of controlling the star formation efficiency within a cluster’s birth cloud (e.g., Whitworth, 1979; Williams & McKee, 1997; Matzner, 2002; Krumholz et al., 2006; Goldbaum et al., 2011; Dale et al., 2012, 2013). A newborn cluster of stars embedded in a cloud emits abundant ultraviolet (UV) photons, creating an ionization front that separates the fully ionized gas close to the cluster from surrounding neutral gas. Thermal balance between heating by photoionization and cooling by line emission keeps the temperature of the ionized gas roughly at (e.g., Osterbrock, 1989; Draine, 2011). In the absence of radiation pressure (see below) and considering confined rather than blister-type H II regions, the density of ionized gas is relatively uniform. Expansion of the ionized gas due to its high thermal pressure (initially times ambient levels) drives a shock wave ahead of the ionization front. An expanding shell of dense gas between the ionization and shock fronts is created, incorporating the ambient neutral gas as the shock sweeps outward. Cloud disruption by shell expansion and/or associated photoevaporation create hostile conditions for further star formation. Whitworth (1979) and Franco et al. (1994) found that photoevaporation by massive stars born near the cloud boundary can limit to in a typical molecular cloud. Williams & McKee (1997) and Matzner (2002) found that clouds convert on average of their mass into stars before destruction by photoevaporation. Using the time-dependent virial theorem, Krumholz et al. (2006) found that both mass ejection by photoevaporation and momentum injection by expanding H II regions limit the net star formation efficiency of GMCs to – before disruption.
The classical picture of an embedded H II region described above does not account for the effects of radiation pressure on dust grains, which are efficient at absorbing UV photons. If dust is tightly coupled to gas through mutual collisions, radiation forces exerted on the former are readily transmitted to the latter. Not only does dust reduce the size of the ionized zone (Petrosian et al., 1972), but it can also produce a central “hole” near the cluster by the action of radiation pressure (Mathews, 1967; Arthur et al., 2004). Recently, Draine (2011, hereafter Dr11) obtained families of similarity solutions for the internal structure of dusty H II regions in static force balance. He found that radiation pressure is important for dense and luminous H II regions, forming a central cavity surrounded by an over-dense ionized shell just inside the ionization front. Krumholz & Matzner (2009, hereafter KM09) showed that while expansion of H II regions excited by a small number of massive stars is well described by the gas-pressure driven classical model (Spitzer, 1978), the dynamics of H II regions around massive star clusters is dominated by radiation pressure. They presented an analytic formula for the shell evolution driven by the combination of gas and radiation pressures, finding that radiation pressure is more important during the early phase of the expansion, while the late stage is governed by a gas pressure force that increases with the shell radius.
Since gas expulsion by thermally driven expanding H II regions does not occur efficiently for clouds with high escape velocities () (e.g., Matzner, 2002; Krumholz et al., 2006; Dale et al., 2012, 2013), radiation pressure has been considered the most promising mechanism for disruption of massive clouds (e.g., Scoville et al. 2001; KM09; Fall et al. 2010; Murray et al. 2010). In particular, Fall et al. (2010) considered the potential for disruption of molecular clouds by various feedback mechanisms including protostellar outflows, photoionization, and supernova explosions, and concluded that radiation pressure may dominate momentum injection in dense and massive protoclusters. Utilizing the analytic solutions of KM09 for shell expansion, they argued that the minimum star formation efficiency, , required for cloud disruption primarily depends on the mean cloud surface density. With independent of the mass, this would explain the observed similarity between shapes of mass functions of molecular clouds and young star clusters. Murray et al. (2010, hereafter MQT10) analytically examined disruption of massive GMCs for sample systems representative of various galactic environments, estimating effects of stellar feedback from protostellar jets, shocked stellar winds, thermal pressure of photoionized gas, radiation pressure, and the total gravity from stars and shell. They found that star formation efficiency for massive GMCs in the Milky Way is only a few percent, while clouds in starburst galaxies and star-forming giant clumps in high-redshift galaxies require – of efficiency for disruption. In the part of parameter space they explored, direct and/or dust-reprocessed radiation pressure dominates ionized-gas pressure in driving shell expansion.
While the previous analytic works mentioned above are informative in understanding the effects of radiation pressure on the shell expansion and related cloud disruption, they are not without limitations. The minimum star formation efficiency derived by Fall et al. (2010) does not allow for the effect of gas pressure and inward gravity that may be important in the late stage of the shell expansion. MQT10 applied their expansion model to only a few representative cases, so that the general dependence of on the cloud mass and surface density has yet to be explored. In addition, KM09 and MQT10 set the radiation force on the shell equal to , where and refer to the luminosity of the central source and the speed of light, respectively, assuming that all dust inside the H II region is pushed out to the shell. They also assumed the thermal pressure acting at the inner edge of the shell is equal to the mean thermal pressure in the ionized region. Since the static solutions of Dr11 indicate the ionized gas inside a dusty H II region is strongly stratified (at high luminosity) and absorbs radiation from the central source, the assumption of the unattenuated radiation up to the shell should be checked. All of the above also adopt the assumption of spherical symmetry and a source luminosity that is constant in time.
The numerical work of Dale et al. (2012, 2013) is not limited by symmetry idealizations, allowing for fully turbulent gas dynamics and self-consistent collapse to create sources of ionizing radiation. However, these works do not include effects of radiation pressure, and consider only a limited parameter space. Very recently, Raskutti et al. (2015) have conducted a set of numerical radiation hydrodynamic (RHD) simulations focusing exclusively on the effects of (non-ionizing) UV in turbulent clouds with surface densities in the range –. The Raskutti et al. simulations showed that turbulent compressions of gas can raise the value of by a factor of 5 for typical Milky Way GMC parameters, because strong radiation forces are required for dispersal of dense, shock-compressed filamentary structures. Skinner & Ostriker (2015) used numerical RHD simulations to consider the complementary regime of extremely high surface density clouds, evaluating the ability of radiation forces from dust-reprocessed infrared (IR) to disrupt clouds. This work showed that IR is effective only if , with being the gas opacity to dust-reprocessed IR radiation, and even in this case the predicted efficiency is , which may explain observations of nascent super star clusters (Turner et al., 2015).
In this paper, we use a simple semi-analytic model as well as numerical simulations to investigate expansion of dusty H II regions and its effect on disruption of star-forming clouds across a variety of length and mass scales. This work improves upon previous analytic works in several ways. First, shells in our model expand due to both radiation and thermal pressures explicitly, extending Fall et al. (2010), which considered solely radiation pressure. We also include the inward force due to gravity of the stars and shell, which extends the non-gravitating models of KM09. Second, we adopt the static solutions of Dr11 for non-uniform internal structure of H II regions. This allows us not only to accurately evaluate the contact forces on the shell arising from thermal and radiation pressures, but also to compare them with the effective forces adopted in the previous studies (e.g., \al@KM09, MQT10; \al@KM09, MQT10, ). Third, we have also run direct numerical simulation to check the validity of the solutions of Dr11 for representing the interior structure in an expanding H II region and also to confirm our semi-analytic shell expansion solutions. Fourth, we conduct a systematic parameter survey in the full space of cloud mass and surface density, evaluating at each (, ) the minimum efficiency required for disruption, the relative importance of radiation and ionized-gas pressures, and the timescale of cloud disruption. We also consider the effects of the mass-dependent light-to-mass ratio, the density distribution of the background medium, and the dust-reprocessed radiation. Our model does not allow for potentially important effects of stellar winds, which we briefly discuss in Section 5.2. The chief idealization of our study is the adoption of spherical symmetry. While real clouds are not symmetric, our results provide a guide and baseline for future work that will relax this restriction.
The rest of this paper is organized as follows. In Section 2, we briefly summarize the solutions of Dr11 for dusty H II regions in static equilibrium. In Section 3, we describe our semi-analytic model for shell expansion, and evaluate the contact forces on the shell in comparison with the effective forces adopted by other authors. We also run numerical simulations for expanding H II regions, and compare the results with those of the semi-analytic model. In Section 4, we calculate the minimum efficiency of star formation required for cloud disruption. We also present analytic expressions for in the radiation or gas pressure driven limits. Finally, we summarize our results and discuss their astrophysical implications in Section 5.
2. Internal Structure of Dusty H II Regions
Dr11 studied the effect of radiation pressure on the internal structure of static, dusty H II regions, finding that radiation pressure acting on gas and dust gives rise to a non-uniform density profile with density (and gas pressure) increasing outward. In this section, we revisit Dr11 to obtain the parametric dependence of various H II region properties on the strength of ionizing radiation. This information will be used for our dynamical models in Section 3.
Let us consider a central point source with luminosity embedded in a cloud, where and refer to the luminosities of hydrogen ionizing and non-ionizing photons, respectively. The number of ionizing photons per unit time emitted from the source is , where is the mean photon energy above the Lyman limit. For simplicity, we ignore the effect of He and assume that the ionized gas has a constant temperature under photoionization equilibrium. Dust grains absorb both ionizing and non-ionizing radiation, with a constant absorption cross-section per hydrogen nucleus of (Dr11). The outward photon momentum absorbed by the dust is transferred to the gas via thermal and Coulomb collisions, resulting in a non-uniform gas density profile . Let denote the fraction of photons absorbed by the gas. Assuming “Case B” recombination, the radius of the Strömgren sphere centered at the source is then given by
| (1) |
where is the effective recombination coefficient (Osterbrock, 1989) and
| (2) |
is the root-mean-square number density within the ionized region.
The luminosity at radius inside the Strömgren sphere is given by , where is the dimensionless quantity that describes attenuation of ionizing photons and is the dust optical depth of non-ionizing photons. The functions and ought to satisfy
| (3) |
| (4) |
The gas/dust mixture (assumed to be collisionally coupled) in the H II region is subject to both thermal pressure and radiation pressure . The condition of static force balance can thus be written as
| (5) |
Equations (3)–(5) can be solved simultaneously for , , and subject to the boundary conditions , , and . Dr11 showed that there exists a family of similarity solutions that are completely specified by three parameters: , , and , characterizing the (inverse of) importance of ionizing photons, the dust content, and the radiation pressure, respectively. Throughout this paper, we take , , and as standard values, appropriate for H II regions formed around massive star clusters (see Appendix A).
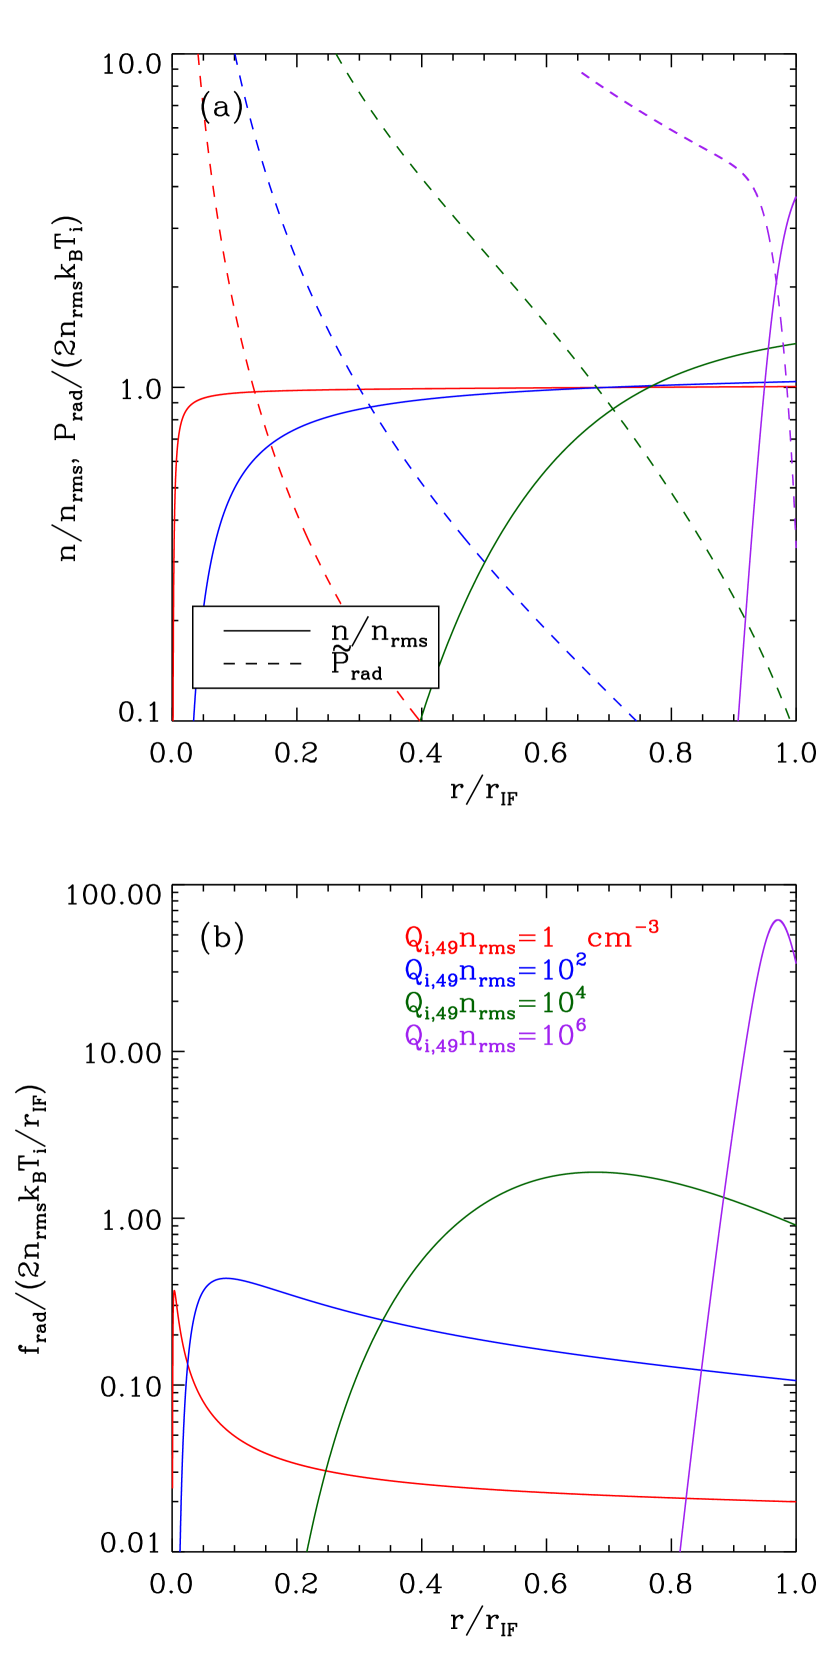
Figure 1 plots the radial profiles of the normalized gas density and radiation pressure in the upper panel, and the radiation force per unit volume in the lower panel, for , where . For , the internal structure is dominated by gas pressure, except in the very central regions where , resulting in an almost flat density distribution with . In this case, the dust optical depth up to is less than unity, indicating that a large fraction of non-ionizing radiation survives absorption by dust. For , on the other hand, radiation pressure is crucial in controlling the density structure. Gas close to the center is pushed out to large radii, forming a central cavity and an outer ionized shell, making the density at the ionization front larger than .111Dust-deficient H II regions with do not possess a cavity (Dr11, Yeh & Matzner 2012). Note that although in the cavity, the gas density there is too small to attenuate radiation significantly. Consequently, the radiation force exerted on the gas is almost negligible in the central cavity and rises only in the outer parts of the H II region, as Figure 1(b) illustrates. In fact, Equation (5) shows that achieves its maximum at the position of the steepest density gradient (see also Lopez et al., 2011, 2014). Thus, radiation strongly modifies the interior of the H II regions such that both gas and radiation forces are applied primarily in the outer portion.
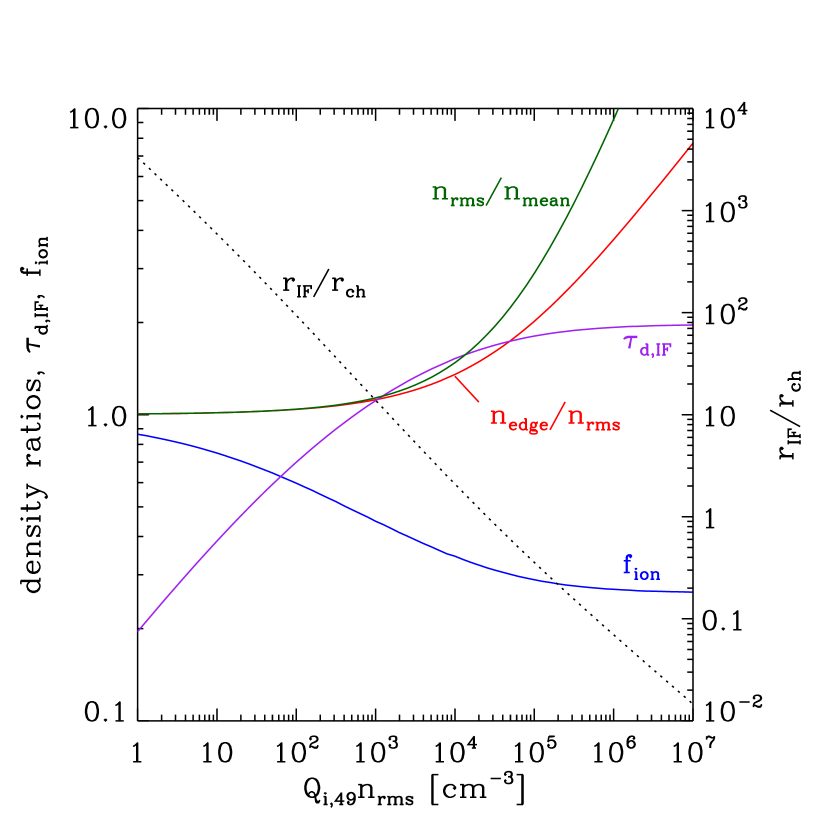
Figure 2 plots the dependence on of , , , and , where is the mean density. Note that and saturate to finite values ( and ) as increases. This is consistent with the results of Yeh & Matzner (2012) who showed that Equations (3)–(5) yield
| (6) |
| (7) |
| (8) |
in the limit of . The saturation of and occurs because the radiation-induced ionized shell near has such large density that neutral hydrogen produced by recombinations can compete with dust in absorbing ionizing photons. This is in contrast to the classical case of uniform-density H II regions without radiation pressure, for which , as (Petrosian et al., 1972). Since the ionized shell has a saturated column , the gas mass within a dusty H II region in this limit depends on as , as opposed to classical H II regions for which and for given .
3. Expansion of Dusty H II Regions
The high pressure in the interior of an H II region compared to the ambient levels leads to radial expansion. Spitzer (1978) provides approximate solutions for this expansion in the case where just gas pressure is included, under the assumption that ambient gas is swept up into a thin shell surrounding the ionized interior (see also Franco et al. 1990; Shu 1992). In this section, we explore expansion of spherically-symmetric, dusty H II regions driven by both thermal and radiation pressures, making a thin-shell approximation. Here we ignore pressure resulting from diffuse recombination radiation, which is negligible in comparison to gas pressure (e.g., Henney & Arthur 1998; \al@KM09,Dr11; \al@KM09,Dr11). We also assume that the shell is optically thin to IR photons emitted by dust grains, the effect of which will be examined in Section 4.3. Expansion models by KM09 and MQT10 adopted the assumption that all of the radiation is absorbed only by the shell, while ionizing radiation produces a uniform pressure, uniform density interior. Here, we relax these assumptions and calculate the direct outward forces based on the Dr11 solutions.
3.1. Model
We consider a spherical neutral cloud with density distribution
| (9) |
where and are the density and radius of a flat core, respectively, and is an index of a surrounding power-law envelope.222While GMCs do not appear to possess density stratification on a global scale (McKee & Ostriker, 2007), the density distribution of clumps within them is well described by a power-law profile including a central core (see e.g., Franco et al., 1990; Hillenbrand & Hartmann, 1998). A star cluster with total mass , total luminosity , and total ionizing power is born instantly at the cloud center. Copious energetic photons emitted by the cluster begin to ionize the surrounding medium, causing the ionization front to advance to the initial Strömgren radius, , within a few recombination timescales ( for ). The overpressured, ionized gas creates a shock front that moves radially outward, sweeping up the ambient neutral medium into a dense shell. We assume that the H II region remains in internal quasi-static equilibrium throughout its dynamical expansion, which is reasonable since the sound-crossing time over the ionized region is sufficiently small compared to the expansion timescale. We further assume that all of the swept-up gas resides in a thin shell of mass located at . Since we are interested in the evolution of the shell well after the formation phase, we may take in describing shell expansion in a power-law envelope.
The momentum equation for the shell is
| (10) |
where is the expansion velocity of the shell, and and denote the outward and inward forces acting on the shell, respectively. The inward force is due to the cluster gravity and shell self-gravity, given by
| (11) |
so that the cluster gravity and gaseous self-gravity depend on as and , respectively. The radiation and thermal pressures give rise to the total outward force
| (12) |
Note that is the contact force acting on the surface immediately outside the ionization front. Only non-ionizing photons reach the neutral shell and exert the outward force, if the shell is optically thick to them.333The condition that the dusty shell should be opaque to UV photons can be expressed as , where (Thompson et al., 2015).
In Equation (10), we neglect the reaction force on the shell exerted by evaporation flows away from the ionization front because it is not significant for embedded H II regions. The thrust term would be important in driving expansion of classical, blister-type H II regions for which ionization fronts are kept D-critical (Matzner 2002; Krumholz et al. 2006; KM09). We also ignore the slowdown of the shell caused by turbulent ram pressure of the external, neutral medium (e.g., Tremblin et al. 2014; Geen et al. 2015), which is difficult to model within our spherically-symmetric, one-dimensional model.
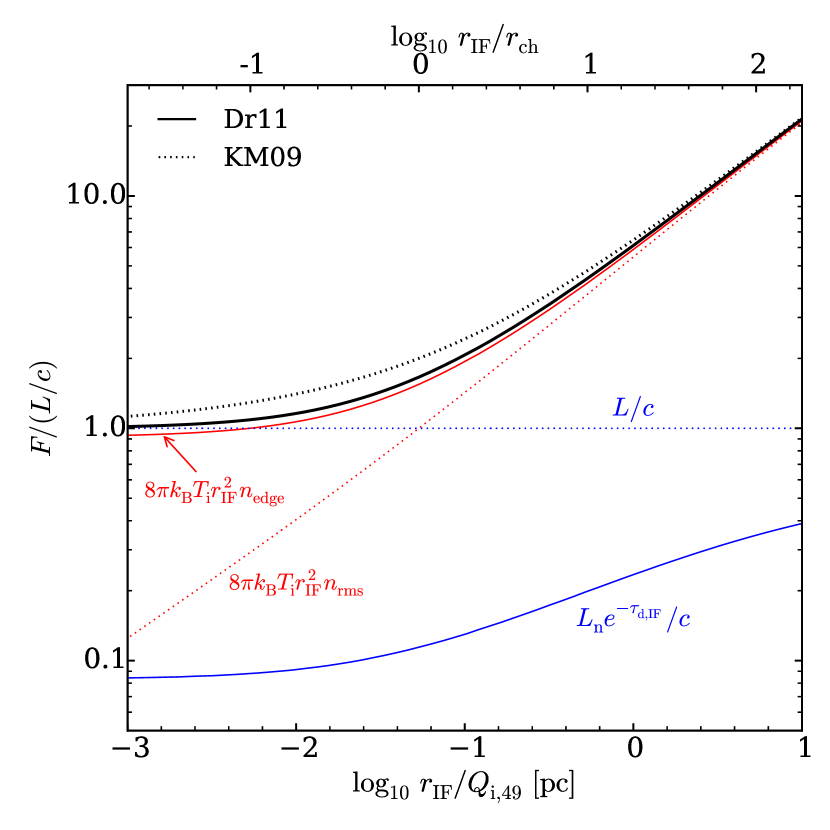
Figure 3 plots as well as the respective contributions of radiative and thermal pressures against the shell radius , taken to equal , as the black, blue, and red solid lines, respectively, utilizing the Dr11 solutions with and . Apparently, the thermal term dominates the radiative term by non-ionizing photons over the whole range shown in Figure 3. This should not be interpreted as an indication that radiation is unimportant for the shell expansion. Rather, the effect of the radiation force is indirectly communicated to the shell by increasing the ionized gas density above , with the limiting ratio given by the factor in Equation (8) when .
The behavior of the outward forces for varying can be readily understood in comparison with the usual approximation adopted by previous authors (e.g., Harper-Clark & Murray 2009; \al@KM09,MQT10; \al@KM09,MQT10). Assuming that all the photons from the source are absorbed by the shell, that the H II region has uniform interior density , and that infrared photons re-radiated by dust freely escape the system, the effective outward forces on the shell from direct radiation and gas pressure are taken as
| (13) |
and
| (14) |
respectively, where is given in terms of , , and using Equation (1). These together with the total effective force are plotted as dotted lines in Figure 3. Evidently, agrees well (within 20%) with from Equation (12). Comparison of the thermal term in Equation (12) with Equation (14) shows that the enhanced thermal force for small radius is due to increased , which is caused by radiation pressure in the Dr11 solutions. At sufficiently small radius, the total outward force is in fact equal to .444Combining Equations (1), (8), and (12), one can show that in the limit of .
Since , while remains constant, one can write
| (15) |
with the characteristic radius at which defined by (KM09)
| (16) |
where is for our fiducial parameters and .555KM09 adopted a constant value of for both and for their approximate treatment. Expansion is driven predominantly by radiation in the regime with , while ionized-gas pressure is more important for . Thus, the relative importance of radiation pressure within an H II region can be assessed by the ratio
| (17) |
shown as a black dotted line in Figure 2 as a function of . Thus, shell expansion is dominated by radiation pressure when .
3.2. Non-gravitating Similarity solutions
In the absence of the inward gravitational forces () and in the limit of negligible core radius, it is straightforward to show that Equations (10) and (15) yield the similarity solutions
| (18) |
in the limit of , and
| (19) |
in the limit of , where is regarded as a constant and is the mean atomic mass per hydrogen and is the mean number density interior to (e.g., Krumholz et al. 2006; KM09). Therefore, the shell radius and velocity vary with time as and in the radiation-pressure driven limit, and and in the gas-pressure driven limit. KM09 presented an analytic approximation valid in both limits by combining Equations (18) and (19). Note that for , the velocity approaches a constant at sufficiently late time.
3.3. Valid Range of
When a cloud has too steep a density gradient, the shell mass becomes smaller than the ionized gas mass within the ionization front. In this case, the thin shell approximation we adopt would no longer be valid. For instance, Franco et al. (1990) found that for a thermally-driven H II region formed in a cloud with , the shock front moves twice as fast as than the ionized sound speed, without significant mass accumulation in the shocked shell. For , an H II region becomes “density bounded” and develops “champagne” flows rather than forming a shell (see also self-similar solutions by Shu et al. 2002). To be consistent with our thin-shell approximation, therefore, we consider clouds only with in the following analysis for shell expansion.
3.4. Shell Expansion
When stellar gravity is included, we can relate to through , where is the conversion factor representing the ionizing photon output per unit stellar mass. The corresponding light-to-mass ratio is . Obviously, these quantities depend on and vary from cluster to cluster, especially for low-mass ones due to stochastic fluctuations in the stellar population. In Appendix A, we perform Monte-Carlo simulations for the spectra of coeval populations using the SLUG code (Krumholz et al., 2015) to find spectral properties as functions of . Equations (A1) and (A2) provide the fits to the resulting median values of and . While and saturate to constant values for , they decrease sharply as decreases below , due to a rapid decrease in the number of O-type stars in the realizations of low-mass clusters. In this work, we use Equation (A1) for conversion between and , while fixing to and : we have checked that varying and does not affect our results much.
To integrate Equation (10), we first choose a set of values for , , , , and . We then specify from the Dr11 solutions and from Equation (1). At , a shell with a zero velocity is located at . The outside density profile is taken as for and the shell mass at any radius is given by .
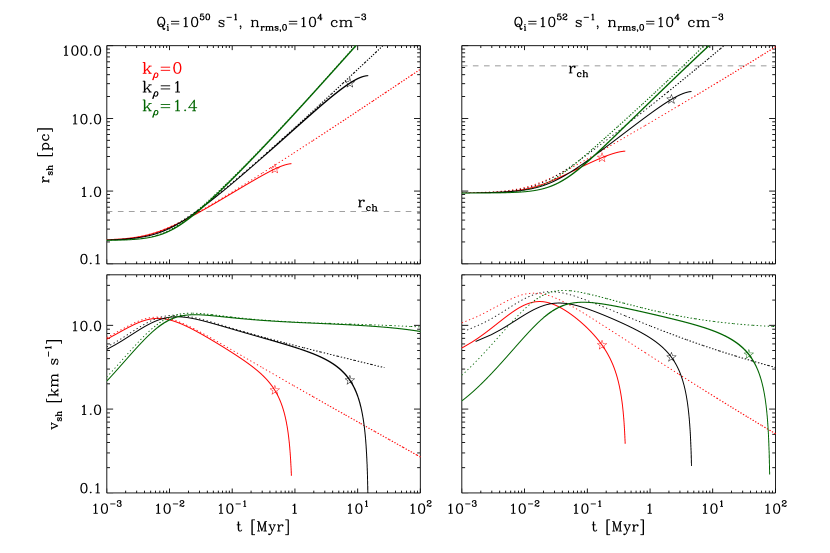
As illustrative examples, we fix , , and , and vary and . Figure 4 plots as solid lines the temporal behavior of the shell radius (upper panels) and velocity (lower panels) for (left) and (right). The solutions without gravity are compared as dotted lines. The cases with , 1, and 1.4, plotted in red, black, and green, respectively, show that the shell expansion is faster in an environment with a steeper density profile, because the shell mass increases more slowly for larger . The horizontal dashed lines mark the the characteristic radii, and for and , respectively, inside (outside) of which shell expansion is driven primarily by radiation (gas) pressure. The star symbols mark the radius where , beyond which expansion is slowed down by the shell self-gravity significantly.
The solutions converge to the asymptotic power-law solutions discussed in Section 3.2 (Equations (18) and (19)), although strong stellar gravity in the case with makes the shell expansion deviate from the non-gravitating solutions early time. Self-gravity of the swept-up shell becomes important in the late stage, eventually halting the expansion. The maximum shell velocity is only mildly supersonic with respect to the ionized gas owing to the rapid increase in the shell mass. Note that when , the driving force changes from radiation to gas pressure at small , while shell expansion is always dominated by radiation pressure when .
3.5. Comparison with Numerical Simulations
So far we have used a very simple model to study dynamical expansion of a spherical shell surrounding an H II region. In order to check how reliable our results are, we run direct numerical simulations using the Athena code in spherical geometry (Stone et al., 2008), as described in Appendix B. As an initial state, we consider a source of radiation at the center of a radially stratified cloud with . To handle the transfer of radiation from the source, we adopt a ray-tracing technique explained in Mellema et al. (2006) and Krumholz et al. (2007). While gas inside the H II region is evolved self-consistently, we ensure that the outer envelope unaffected by radiation maintains its initial hydrostatic equilibrium.
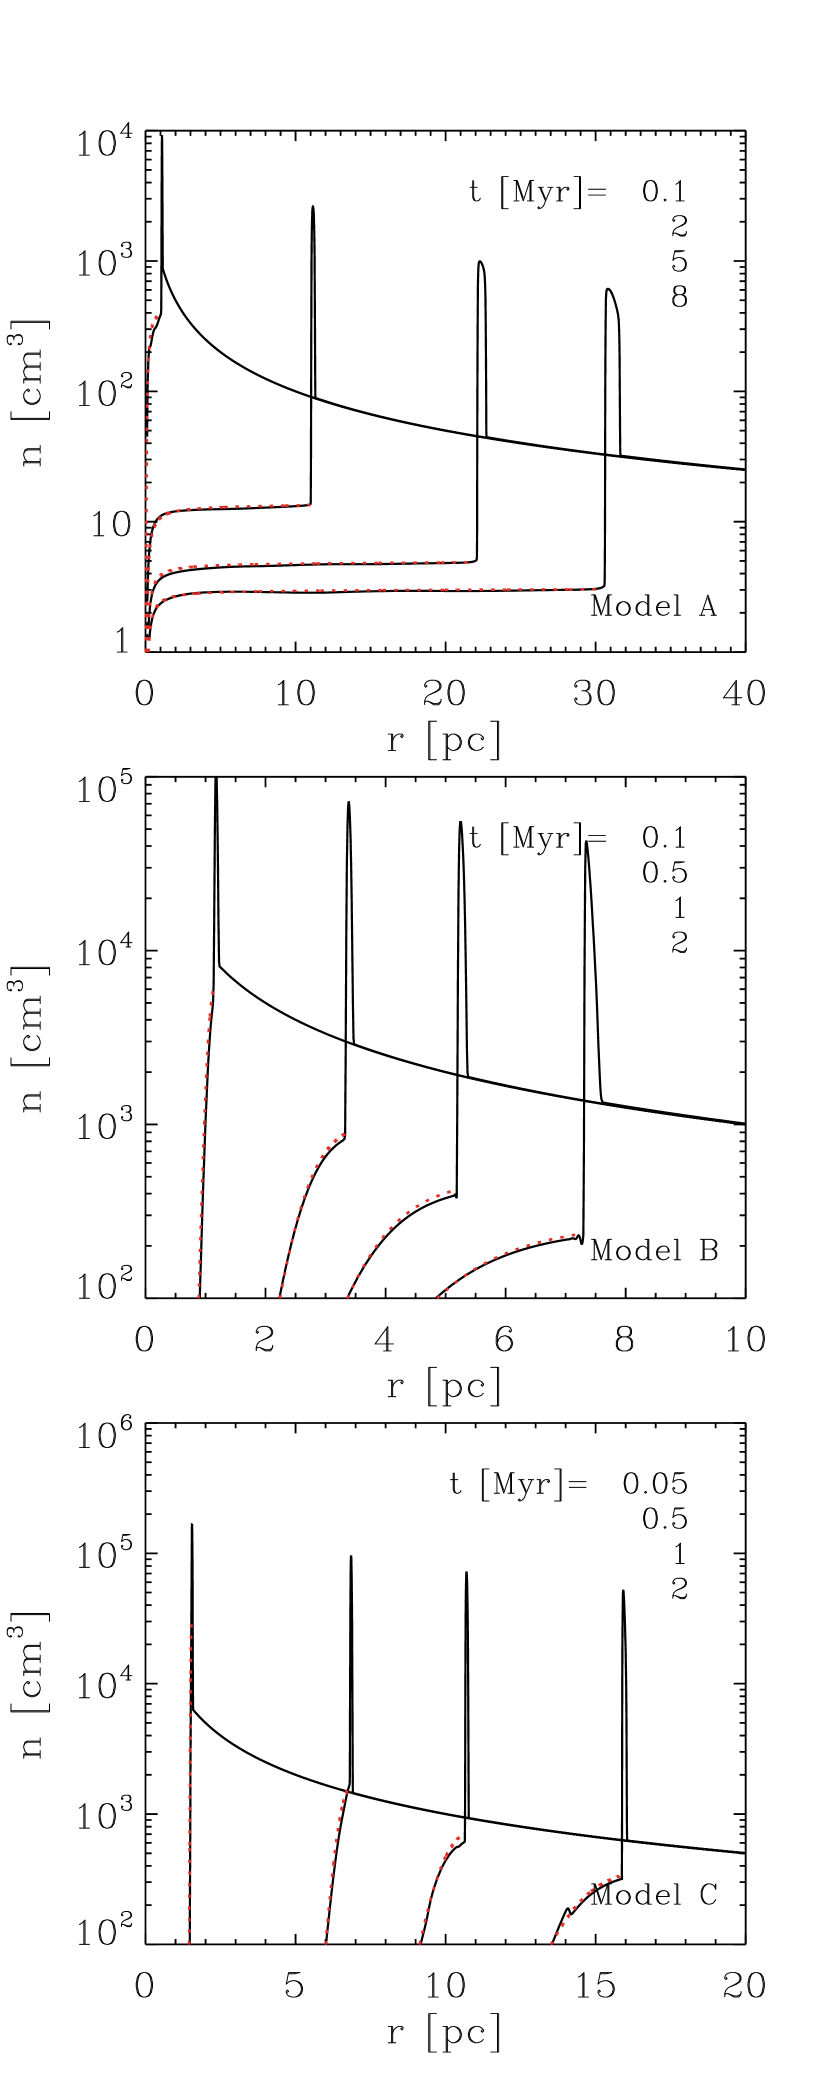
Figure 5 plots as solid lines the radial density distributions at a few epochs for Model A (with and ; top), Model B (with and ; middle), and Model C (with and ; bottom), all with and . In Model A, the effect of radiation on shell expansion is almost negligible since . Its overall expansion is in good agreement with the classical picture of thermally driven expansion (e.g., Spitzer, 1978). As soon as the ionization front reaches the initial Strömgren radius (), an isothermal shock wave forms and propagates outward. At the same time, rarefaction waves excited at the ionization front propagate radially inward (e.g., Arthur et al., 2011), gradually turning into acoustic disturbances that travel back and forth between the ionization front and the center. In this model, the density profile in the ionized region is nearly flat.
On the other hand, Model C is dominated by radiation. Gas at small is pushed out supersonically to create a central cavity together with an ionized shell within .666Assuming that the dust absorption dominates over the photoionization, the acceleration on dusty gas at is given by . Then, the timescale for a gas parcel to travel over a distance in the ionized region is roughly , where is the recombination timescale (Arthur et al., 2004). After the shell formation, the gas in the ionized region relaxes into a quasi-static equilibrium state within a sound crossing time across the H II region. In Model B, the shell expands mostly due to radiation pressure until it reaches at , after which the driving force switches to ionized-gas pressure.
Figure 5 also plots as red dashed lines the corresponding Dr11 quasi-static solutions inside the ionization front, which are in good agreement with the results of the time-dependent simulations. This not only confirms that the static solutions of Dr11 are applicable even for expanding H II regions, but also validates our ray-tracing treatment of radiation in the numerical simulations.
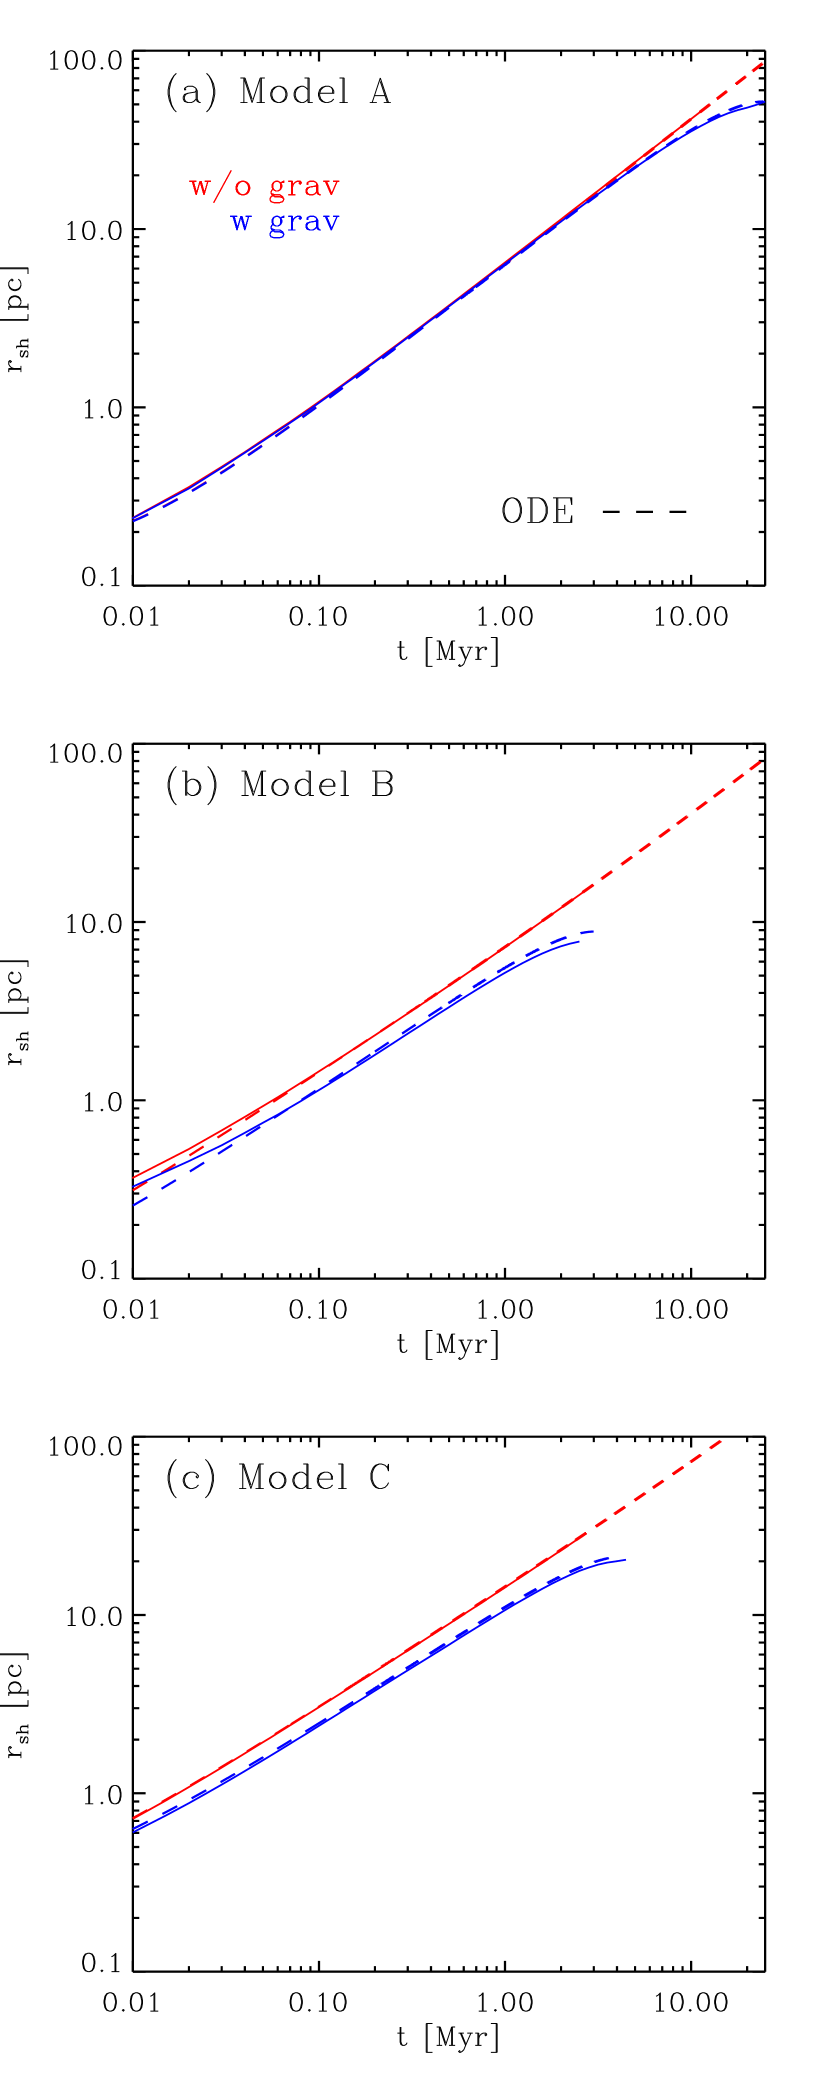
Figure 6 plots the temporal changes (solid lines) of the shell radius from the simulations in comparison with the solutions (dashed lines) of Equation (10). The cases with and without gravity are plotted in blue and red, respectively. Small differences at early time between the results from the different approaches are caused mainly by the assumption of a vanishing shell velocity at in solving Equation (10), while the shell in simulations has a non-zero velocity when it first forms. Nevertheless, semi-analytic and numerical solution agree with each other within after , suggesting that our semi-analytic model of shell expansion is quite reliable. Although the inclusion of gravity does not make significant changes in the internal structure of the ionized region, it is self-gravity that makes the swept-up shell decelerate and eventually stall at when in Model A. Gravity becomes more significant for larger , stopping the shell expansion at – in Models B and C, despite correspondingly stronger outward forces.
4. Minimum Efficiency of Star Formation for Cloud Disruption
Consider a star cluster comprising a mass fraction of its birth cloud, and located at the cloud center. The H II region produced by the luminous cluster launches an expanding shell that sweeps up the bulk of the gas in the cloud as it grows. (see also, e.g., Harper-Clark 2011; MQT10). If it is luminous enough, the cluster is able to disrupt the entire parent cloud. For a low-mass cluster, on the other hand, only a small volume near the center is affected by the shell expansion, with the major portion of the cloud remaining intact. Therefore, there exists a minimum star formation efficiency such that a cloud with is not disrupted and will undergo further star formation, while a cloud with will be disrupted completely, with no further star formation. In real turbulent clouds, both star formation and gas mass loss occur continuously (e.g., Dale et al. 2012, Skinner & Ostriker 2015, Raskutti et al. 2015), and one can expect increases with time until at which point feedback is able to destroy or evacuate all the remaining gas (see Section 5.2 for more discussion).
In this section, we use the simple model of shell expansion described in Section 3 to evaluate . Fall et al. (2010) studied how gas removal due to various feedback processes regulates the efficiency of star formation, and estimated for massive, compact protoclusters by considering only the radiation pressure. Our model extends their work by including both ionized gas pressure and gravity. MQT10 integrated equations for shell expansion due to radiation pressure, gas pressure, stellar winds, and protostellar outflows, etc., as applied to several specific cases of massive GMCs. Our aim here is to find the systematic dependence of on cloud parameters such as mass, surface density, and density profile, etc., which will be useful to assess the effectiveness of H II region feedback in a wider range of physical conditions.
4.1. Fiducial Case
Let us consider an isolated spherical cloud with mass , radius , and mean surface density . We assume the cloud is gravitationally bound with the one-dimensional turbulent velocity dispersion , where is the usual virial parameter of order unity (e.g., Bertoldi & McKee, 1992). At , the cloud forms a star cluster with mass instantaneously at its center. The remaining gas mass is distributed according to Equation (9) with within the cloud radius ; we have checked that the choice of the core radius has little influence on the resulting as long as it is sufficiently small. The cluster emits ionizing photons at a rate , producing a shell at , which we determine by substituting for in Equation (1).
To determine , we first take a trial value of and integrate Equation (10) over time until the shell reaches the cloud boundary. At , we check if the shell meets one of the following four disruption criteria: (1) , corresponding to a vanishing total (kinetic plus gravitational) energy of the shell (cf. Matzner, 2002; Krumholz et al., 2006)777As a disruption criterion, Matzner (2002) and Krumholz et al. (2006) took , which is the escape speed of an unbound test particle, rather than the minimum speed for unbinding a thin shell at .; (2) , corresponding to a stalling of the shell expansion by turbulent pressure inside the cloud (e.g., Matzner 2002; KM09; Fall et al. 2010); (3) equal to a large-scale turbulent ISM velocity dispersion, (Heiles & Troland, 2003), corresponding to merging of the shell with the diffuse ISM; and (4) , corresponding to a balance between gravity and outward forces (e.g., Ostriker & Shetty 2011; MQT10). If none of these conditions are satisfied or if is unable to expand to , we return to the first step and repeat the calculations by changing .
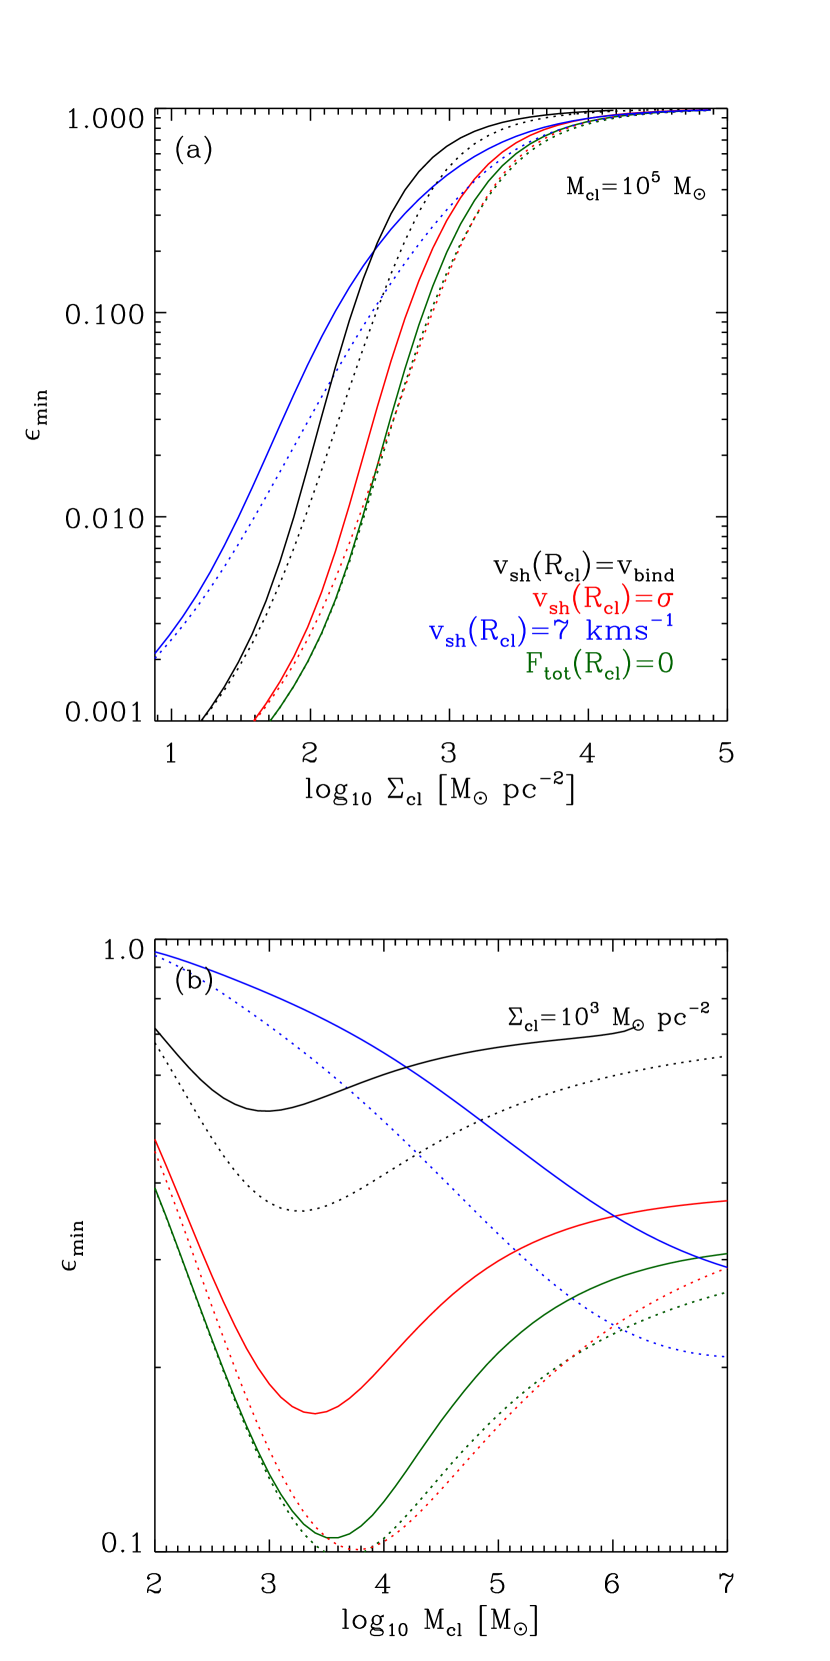
We take , , , and for our fiducial parameters. Figure 7 plots as solid lines (a) as a function of for clouds with and (b) as a function of for clouds with , for the four disruption criteria given above. As expected, clouds with smaller surface density are more easily destroyed by feedback, while more compact clouds need to have increasingly closer to unity for disruption. The minimum efficiency depends more sensitively on than . In the case of the condition , for instance, rises rapidly from to as increases from to for fixed , whereas it changes less than a factor of two over for fixed . Furthermore, a criterion based on a higher shell velocity at the cloud boundary results in higher .
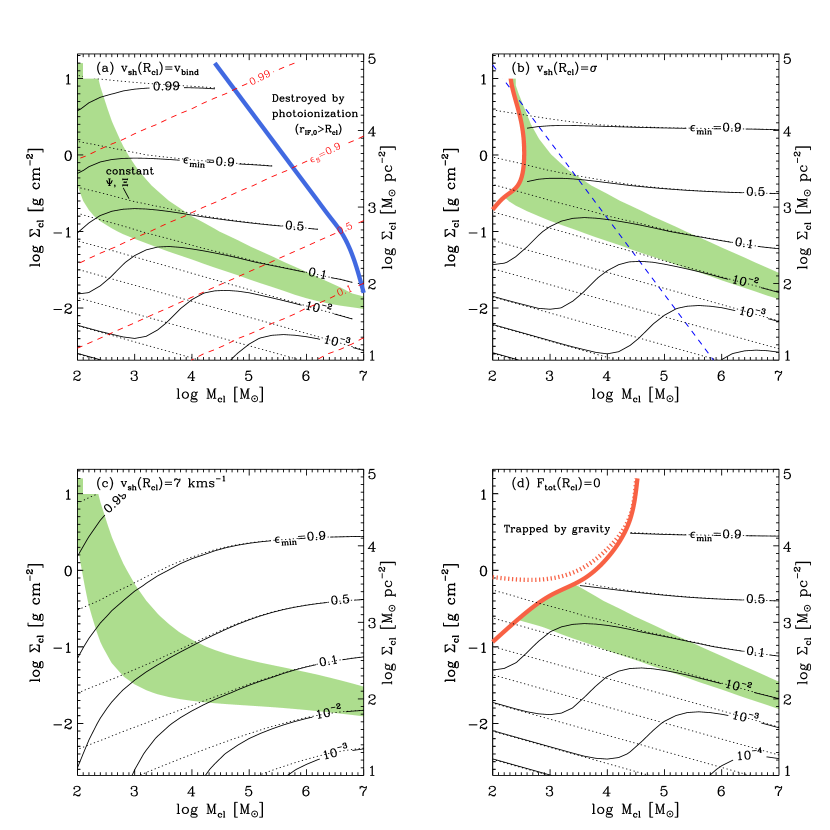
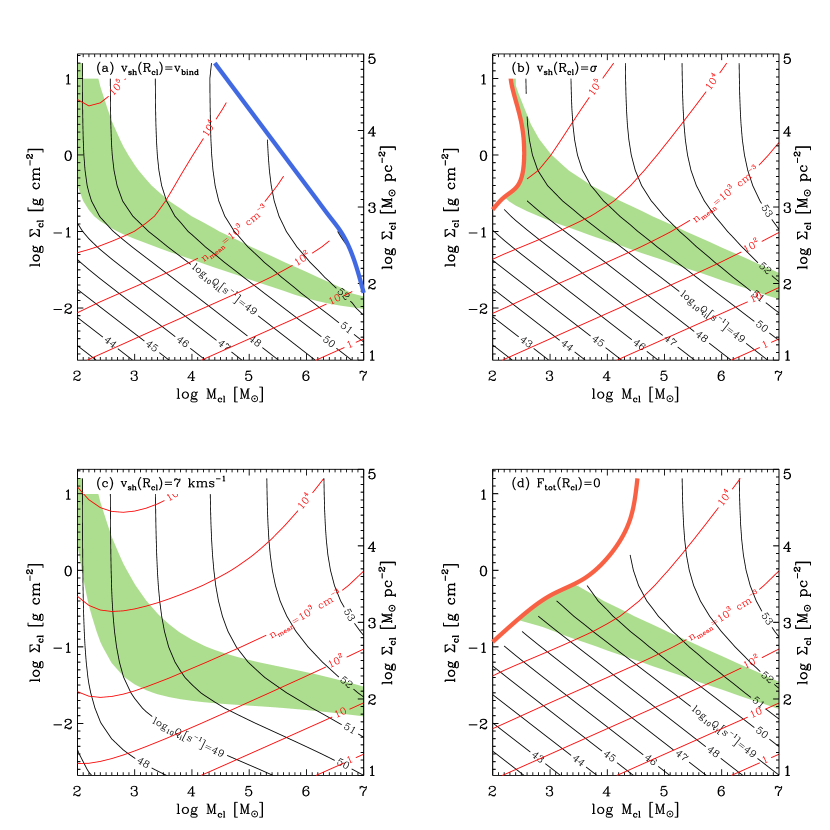
Figure 8 plots the contours of on the – plane for the various criteria. The solid curves draw the results for the variable light-to-mass ratio (see Equations (A1) and (A2)), while the case of constant and are shown as dotted curves. The difference between the solid and dotted contours is caused by an incomplete sampling of the initial mass function (IMF) which lowers for low-mass clusters and thus yields higher for . For the criterion , typical GMCs with and in the Milky Way could be destroyed by a handful of O stars () with efficiency of . On the other hand, denser and more compact cluster-forming clouds or clumps with require the star formation efficiency larger than for disruption.
In our model, the gas density is proportional to and the ionizing rate is proportional to , so that the size of the H II region becomes increasingly larger for higher . It is thus possible to have , indicating that the whole cloud is completely photoionized from the beginning. The upper right part above the thick blue line in Figure 8(a) corresponds to these clouds destroyed by photoionization without involving shell expansion. This can be seen more quantitatively by considering the critical efficiency that makes the initial Strömgren radius equal to , for which Equation (1) and
| (20) |
yield
| (21) |
where
| (22) |
The red dashed contours in Figure 8(a) plot , demonstrating that the photodestruction boundary corresponds to the loci of . For the other criteria, for the ranges of and shown in Figure 8.
The region bounded by a thick red line (solid and dotted lines for varying and fixed and , respectively) in the upper left corner of Figure 8(b) and (d) corresponds to clouds with from the beginning or somewhere before reaching the cloud boundary, indicating that a shell undergoes infall rather than expansion due to strong gravity. In order for the outward force to overcome gravity and drive expansion all the way to the cloud surface, clouds in these regions must have star formation efficiency higher than required by the respective criterion. To describe these “trapped” H II regions correctly, one needs to consider accretion flows as well as gas rotation in a flattened geometry, as in Keto (2002, 2003, 2007), which is beyond the scope of the present paper.
Once we calculate the minimum efficiency required for cloud disruption, we are positioned to derive various properties of H II regions and their host clouds. Figure 9 plots contours of (black) as well as the mean gas number density in the cloud (red) corresponding to for the various disruption criteria. Clearly, larger is necessary to destroy more massive and compact clouds. The shaded regions shown in Figures 8 and 9 that run roughly diagonally from the upper left to lower right corners correspond to H II regions that make a transition from the radiation-dominated to thermally-dominated regime in the course of the expansion before disruption ().888The upper and lower boundaries of the shaded regions correspond to clouds with and , respectively, for . For clouds with parameters above (below) the shaded area, radiation (thermal) pressure plays the dominant role throughout the expansion. As a demarcation line between thermal and radiation pressure dominated H II regions, Fall et al. (2010) suggested by taking constant . This is plotted as a blue dashed line in Figure 8(b). As will be shown below, the condition of at results in in our model. Therefore, since is a function of and instead of a fixed value as assumed by Fall et al. (2010), the shaded demarcation differs from their proposal.
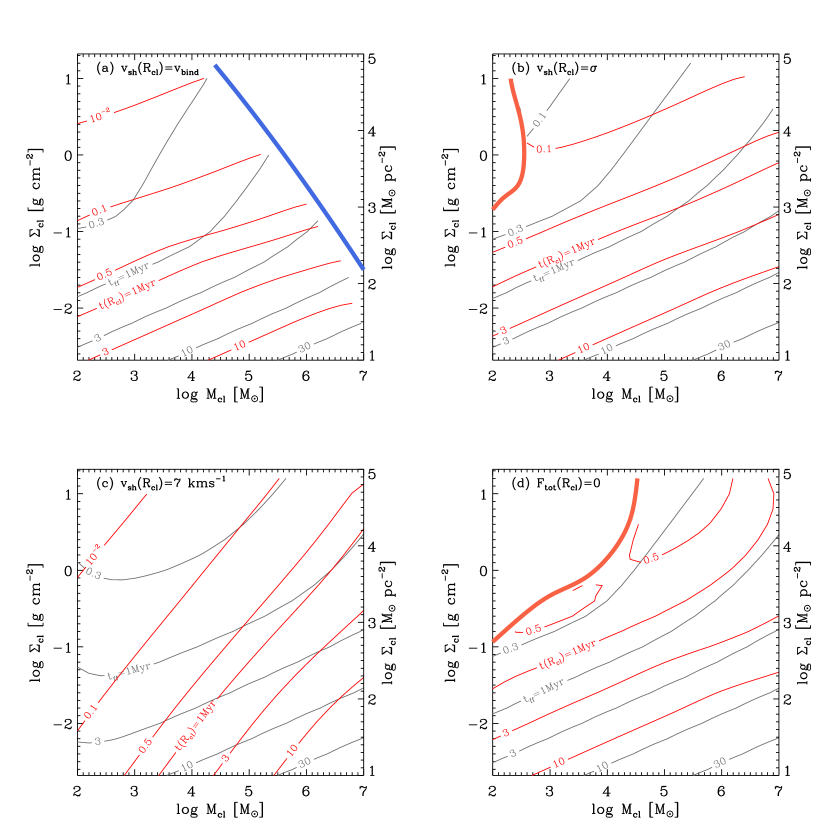
We also calculate the time for the shell to move from to , plotted in Figure 10 as red contours. Note that is comparable to or smaller than the gas free-fall time shown as gray contours. This is naturally expected for virialized clouds with or since the shell velocity approximately follows a power-law in time as before gravity takes over (see Figure 4), with an exponent for , yielding . This suggests that cloud disruption by an expanding H II region is rapid, occurring roughly over the free-fall timescale, provided the star formation efficiency is larger than the minimum value. For the condition of , the slopes of the -contours are different since . Nevertheless, the shell expansion takes less than the free-fall time, except for clouds with very large or very large .
4.2. Analytic Estimates
One can deduce an approximate result for the minimum efficiency analytically by utilizing the effective outward force given in Equation (15). Multiplying both sides of Equation (10) by and integrating the resulting equation over time, we obtain
| (23) |
where is the shell momentum. Assuming , , and as , Equation (23) yields an expression for the shell velocity at the cloud boundary as
| (24) |
where , , , , and . Note that the total force on the shell at is approximately given by
| (25) |
The first and second terms in the right-hand-side of Equation (25) represent the radiative and thermal pressure forces, respectively, while the last term comes from the total gravity. The ratio of the first to second term is proportional to , suggesting that the relative role of radiation pressure to thermal pressure depends not only on the cloud mass and size but also on the star formation efficiency. The relation in Equation (24) may be combined with the disruption criterion , , and to obtain estimates for . Similarly, Equation (25) may be used with the disruption criterion . The estimates for the minimum efficiencies are plotted as dotted lines in Figure 7. At high and low , the analytic estimates are very close to the solutions of the ODE (integrating Equation (10)), although they can depart by up to a factor of two between .
4.2.1 Radiation-pressure-driven Limit
When the expansion is dominated by radiation pressure, we can keep only the first term in the right-hand-side of Equation (24) to obtain
| (26) |
and
| (27) |
These clearly show that the minimum efficiency increases with the mean surface density, independent of the mass. This is consistent with the results of Fall et al. (2010), although their effective outward force includes the trapping factor accounting for hot stellar winds and dust-reprocessed radiation. Similarly, a criterion based on radiation-gravity force balance at the cloud boundary in Equation (25) yields
| (28) |
independent of again (see also MQT10 and Raskutti et al. 2015).
4.2.2 Gas-pressure-driven Limit
4.3. Effects of and Trapped Infrared Radiation
In Section 4.1, we considered a stratified cloud with and assumed that infrared photons emitted by dust freely escape the cloud. Here we relax these two constraints to calculate in more general situations.
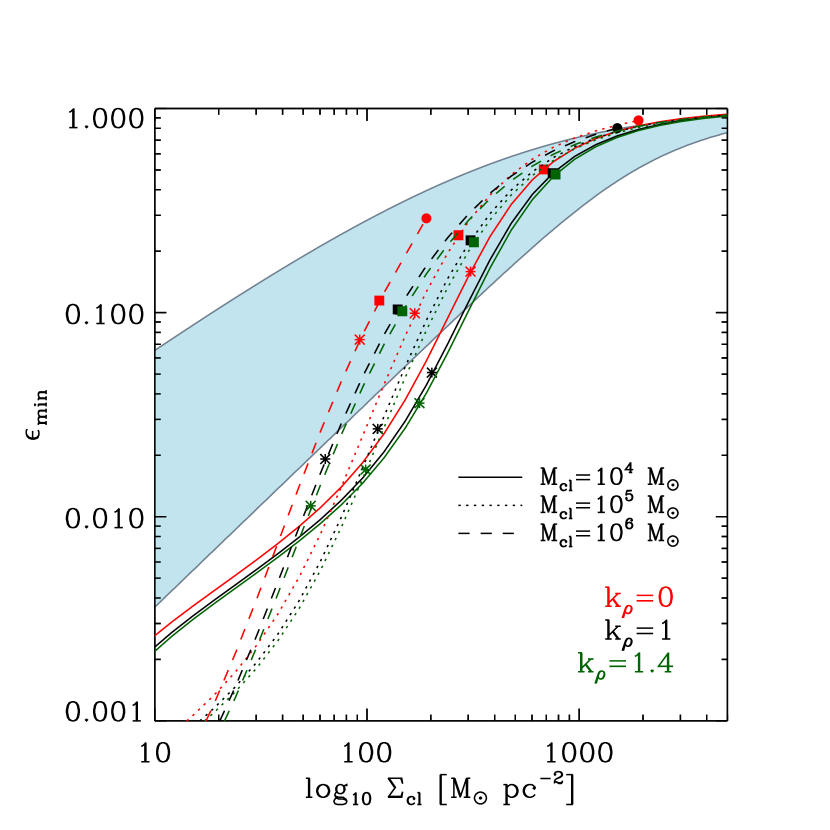
First, we explore the cases with differing . H II regions in clouds with a larger central density tend to be denser and smaller in size initially. As a result, the radiation pressure becomes more important in the initial expansion phase for larger . Figure 11 plots as a function of for , 1, and 1.4 in the case of the disruption criterion . Three cloud masses are chosen. Although clouds with steeper density profile have smaller and are thus more readily disrupted, does not exhibit strong dependence on . In fact, Equation (24) suggests that the shell momentum depends weakly on only through the coefficients.
Next, we examine the effect of dust reprocessed infrared radiation. In a high-column cloud optically thick to infrared radiation, dust-reprocessed radiation can be trapped within the cloud, providing significant boost to H II region expansion (e.g., \al@KM09, MQT10; \al@KM09, MQT10; Hopkins et al. 2011; Ostriker & Shetty 2011; Skinner & Ostriker 2015). For the momentum injection rate by the trapped radiation, we adopt the usual simple prescription
| (32) |
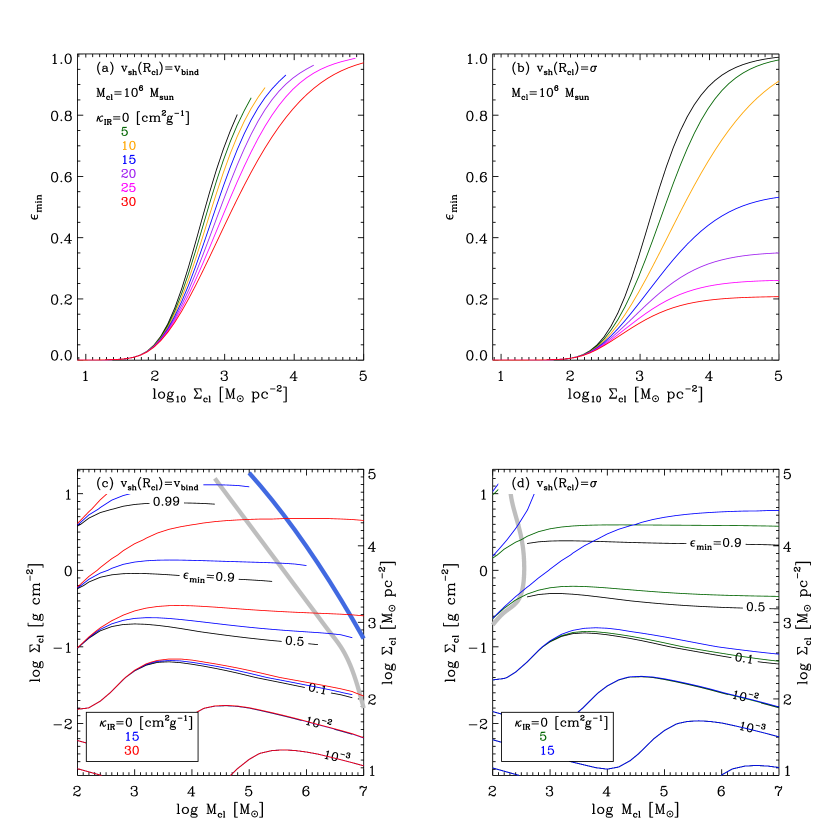
applicable to smooth and spherical clouds. Here, is the infrared optical depth through the cloud, with being the Rosseland mean dust opacity (treated as a constant for simplicity).999The reader is referred to Skinner & Ostriker (2013) for a more rigorous treatment of spherical shell expansion driven by trapped radiation (without gravity). Note that we include the contribution to from the portion of the cloud outside the shell as well, corresponding to the maximum possible efficiency of feedback by the trapped radiation. As increases, experiences a moderate decrease (by a factor of three from to for ).
We integrate Equation (10) by adding to . Figure 12 plots , determined from two disruption criteria, (left panels) and (right panels), for several different values of , as functions of for (upper panels) and as contours in the – plane (lower panels). The other parameters are the same as in the fiducial case. Clearly, tends to reduce since clouds are more easily disrupted. But, its effect is significant only for sufficiently large and/or sufficiently massive, high-column clouds so as to have and . When appropriate for solar-metallicity gas (Semenov et al., 2003), is insensitive to . For larger values of , the minimum efficiency is reduced considerably and the photodestruction regime becomes less extended, as Figure 12(c) shows. For clouds with , the trapped radiation dominates the direct radiation (). In this case, computed from the criterion becomes close to , a prediction from the force balance between and gravity (Ostriker & Shetty, 2011). The simulations of Skinner & Ostriker (2015) consider the evolution of turbulent clouds in the limit where reprocessed radiation dominates direct radiation.
5. Summary and Discussion
5.1. Summary
Young massive stars have dramatic effects on the surrounding ISM through ionizing radiation, winds, and supernova explosions. H II regions created by ionizing radiation from young star clusters embedded in molecular clouds are able to destroy their natal clouds under some circumstances, preventing further star formation in them. In this paper we have used a simple semi-analytic model as well as hydrodynamic simulations to study dynamical expansion of a dusty H II region around a star cluster and its role in cloud disruption. Our expansion model is one-dimensional, assuming spherical symmetry, and treats the structure of the ionized region using the solution of Dr11. We assume that as the H II region expands, the swept-up shell formed at the interface between the ionized region and surrounding neutral neutral gas remains very thin. We solve the shell’s temporal evolution subject to outward contact forces arising from radiation and thermal pressures, and inward gravity from the cluster and the shell.
In our model, radiation pressure affects the shell expansion indirectly through the enhanced thermal pressure at the ionization front, a feature of the Dr11 solutions. The total outward contact force in our detailed model agrees within with the combination of the effective radiation force and the effective gas pressure force used in the simplified model KM09 (see Figure 3). Since is constant while depends on the shell radius as (apart from the weak dependence on ), expansion is driven primarily by radiation pressure when (or equivalently when ), and by thermal pressure when . Here is the characteristic radius where (Equation (16)). We note that in practice, radiation forces are conveyed to the surrounding neutral shell indirectly, by compressing the ionized gas strongly to the outer portion of the H II region and increasing the density immediately interior to the shell. The cluster gravity is important in the early phase of shell expansion, especially in the radiation-driven limit, while shell self-gravity eventually halts expansion, after about the free-fall timescale of the whole cloud.
To validate the assumptions used in our expansion model, we also perform direct numerical simulations of expanding spherical H II regions for sample cases. We find that despite the presence of small-amplitude acoustic disturbances, the radial density structure of the ionized region in our numerical simulations is overall in good agreement with the static equilibrium solutions of Dr11 throughout the shell expansion. This justifies the use of the Dr11 solutions even for expanding H II regions. The temporal changes in the shell position and velocity in our expansion model also agree with the results of the numerical simulations until gravity completely stops the expansion (Figures 5 and 6).
Using our expansion model, we explore requirements for cloud disruption by an expanding H II region around a star cluster in diverse star-forming environments, as characterized by the total cloud mass and the mean surface density . We also allow for power-law internal density profiles in the cloud. As criteria of cloud disruption, we consider the following four conditions: (1) the shell velocity at the cloud boundary is reduced to , corresponding to a vanishing total energy; (2) , the one-dimensional internal velocity dispersion of the cloud; (3) , the mean turbulent velocity dispersion of the diffuse ISM; and (4) the net force on the shell at the cloud boundary is zero. As a function of and , we calculate the minimum efficiency of star formation needed to satisfy each of the four conditions above (Figures 7 and 8). Using the effective outward forces, we also derive analytic expressions for in the radiation- and gas-pressure-driven limits (Section 4.2).
Based on the first criterion, (see Figure 8a), GMCs in normal disk galaxies (typically and –) can be destroyed with . For and , expansion is primarily due to gas pressure, whereas both gas and radiation pressure are important at larger and . Disruption of cluster-forming clumps ( and , from Fig. 1 of Tan et al. 2014) requires a significantly higher efficiency of , and is mainly driven by radiation pressure. Massive clouds in starbursts ( and ) would need to convert most of their gas into stars () for the H II region to achieve disruption by direct radiation forces. The minimum efficiency for the criterion is only slightly higher than that required from , implying that the gravity is already taking over when the shell velocity drops to , naturally expected for a virialized cloud.
Star clusters with masses below are likely to have fewer OB stars and thus a smaller light-to-mass ratio than the predictions of a fully sampled IMF (see Appendix A). The required increases accordingly for these low-mass systems. Since the size of H II regions increases with increasing efficiency, there exists a critical efficiency (Equation (21)) at which the initial Strömgren radius is equal to the cloud size. Clouds with are regarded as being disrupted by photoionization rather than shell expansion. Such clouds are located in the upper right corner in the – plane in the case of the criterion (Figure 8(a)). Under the criterion or , shells in the upper left corner are subject to gravitational infall rather than expansion. For clouds disrupted by shell expansion, the disruption time is typically comparable to or smaller than the gas free-fall time (Figure 10), implying that the disruption is rapid once an H II region is formed.
We also examine the effect of differing cloud density profiles by varying the power-law density index . When all other quantities are held fixed, momentum deposition is only slightly larger for clouds with larger (Figure 11). Therefore, disruption is quite insensitive to the degree of density concentration. Finally, we explore the effect of trapped IR radiation using a usual spherical symmetry prescription in which the associated radiation force is taken proportional to the IR optical depth through a whole cloud (see Figure 12). The minimum efficiency is lowered only slightly for a dust opacity of ; a substantial reduction in requires , appropriate for dust-enriched environments.
5.2. Discussion
In this paper, we have calculated required for cloud disruption. Our results strongly suggest that GMCs are able to end their lives within a single internal crossing time after the formation of a large H II region with stellar mass . While this is a minimum, it would also be a reasonable estimate for the net star formation efficiency (at least in the idealized spherical case) for the following reasons. Consider a cloud with . Since it cannot be destroyed by shell expansion, it will continue to form stars, and will increase. However, once reaches , if the disruption is rapid compared to the free-fall time, the efficiency would not increase much beyond this value.
Similarly to our study, MQT10 obtained for five GMCs in various galactic environments. However, there are several notable differences between their and our expansion models. First, MQT10 made a distinction between the star formation efficiency of the GMC and that of cluster-forming gas at the center, the latter of which was fixed to 50%, assuming that a half of the “cluster gas” turns into stars and the other half goes into the initial shell mass. Second, the shell expansion in MQT10 begins at a radius (typically a few parsecs) that follows the observed mass-radius relations of star clusters, whereas our model starts from the initial Strömgren radius. Third, MQT10 included an additional inward force, of order , due to turbulent pressure, which is not considered in our models. We omit this term as turbulent pressure is dominated by the largest scales, and is difficult to model; swept-up gas may add either inward or outward momentum to the shell. The expanding shells in MQT10 have a higher surface density and stronger inward force initially than in our model, which is partly compensated by the outward forces they include to represent protostellar outflows and direct/dust-reprocessed radiation. Despite these differences, the conclusions of MQT10 that the increases with surface density and that the disruption takes place in about a free-fall time of the cloud are all qualitatively consistent with our results.
Murray (2011) estimated star formation efficiency of Galactic star forming complexes by matching a WMAP sample of luminous free-free sources to host GMCs with typical mass and typical surface density , finding on average, for the luminosity limited samples (see his Figure 2). These observed star formation efficiencies are in the same range as our minimum efficiencies for the destruction criterion shown in Figure 8(a), suggesting that these clouds may be in the process of disruption by expanding H II regions. Indeed, most of these star forming complexes show evidence for expanding, bubble-like morphologies in infrared and radio recombination lines, in excess of turbulent motions (Rahman & Murray, 2010; Lee et al., 2012). Murray (2011) also compared inward and outward forces to find and , suggesting that expansion is driven by radiation in many of their samples. García et al. (2014) presented a catalog of GMCs in the inner southern Galaxy and estimated star formation efficiency of those associated with ultracompact H II regions. In their study, stellar mass was inferred from far-IR luminosity from IRAS point-like source catalog assuming that far-IR luminosity traces OB stellar population with an age of less than . They found the average star formation efficiency of 3%. While these observations are roughly consistent with our results, the data need to be interpreted with caution, because of selection bias (Murray, 2011), neglect of extended emission (García et al., 2014), difficulty in identifying the boundary of a cloud that is being destroyed, and uncertainties involved in lifetime of stellar tracers. Also, it is important to distinguish between net star formation efficiency and observational estimates of “current” star formation efficiency, the latter of which does not allow for the gas inflow/outflow experienced in the past as well as future star formation before cloud destruction (e.g., Matzner & McKee, 2000; Feldmann & Gnedin, 2011).
Whether dust-reprocessed radiation can be effective in dispersing star-forming clouds or not has been actively debated (e.g., \al@KM09, MQT10; \al@KM09, MQT10, Skinner & Ostriker 2015). Because the mean free path of infrared photons can often be comparable to the system size, the non-local nature of radiation makes it difficult to obtain the solution of the radiative transfer equation. It is only in recent years that the usage of the simplified prescription for has been tested by numerical simulations. For example, Krumholz & Thompson (2012, 2013) used a flux limited diffusion scheme to investigate matter-radiation interaction in a radiation-supported dusty atmosphere. They found that the photon trapping efficiency can be greatly reduced by radiation-induced Rayleigh-Taylor instabilities that provide channels for photons to escape, resulting in an anti-correlation between matter and radiation. Using a more advanced (variable Eddington tensor) algorithm, Davis et al. (2014) revisited these calculations and found a reduced anti-correlation, corresponding to stronger matter-radiation coupling. More recently, Skinner & Ostriker (2015) adopted the M1 closure relation to run simulations of turbulent GMC disruption by reprocessed radiation feedback, self-consistently including self-gravitating collapse to produce sources of radiation. This work showed that the usual trapping factor based on the dust optical depth overestimates the radiation momentum deposition rate by a factor of –, in part due to matter-radiation anticorrelation, and in part due to the cancellation of radiation forces where sources are distributed rather than centrally concentrated. Skinner & Ostriker (2015) also showed that reprocessed radiation is able to limit collapse only when the opacity is large, . Here, we also find that reprocessing only significantly affects the minimum efficiency when is large.
While in this paper we exclusively focus on the effects of H II region expansion, diverse feedback mechanisms with different degrees of importance are believed to operate in star-forming environments (MQT10; Fall et al. 2010; Krumholz et al. 2014; Matzner & Jumper 2015). For example, outflows and jets from protostars feed turbulent motions within cluster-forming clumps, prevent global collapse, and reduce star formation efficiency therein (e.g., Matzner & McKee, 2000; Matzner, 2007; Wang et al., 2010). They are a dominant source of momentum injection before massive stars form, but are unlikely to be capable of destroying the intermediate-mass and massive clumps (e.g., Matzner, 2002; Fall et al., 2010; Nakamura & Li, 2014). Supernova explosions are regarded as the most powerful feedback mechanism for driving turbulence in the ISM (Joung & Mac Low, 2006), providing vertical pressure support against gravity and regulating the star formation rates in galactic disks (e.g., Ostriker & Shetty, 2011; Kim et al., 2013). Supernovae may also significantly impact or destroy molecular clouds if they are not dispersed by other feedback processes during the lifetime of massive cluster stars (e.g., Hennebelle & Iffrig, 2014; Geen et al., 2015; Walch & Naab, 2015). Indeed, observations of mixed-morphology supernova remnants suggest that this is often the case (e.g., Rho & Petre, 1998).
Traditionally, thermal pressure of hot gas created by shocked stellar winds is thought to dominate expansion of ionized bubbles (Castor et al., 1975; Weaver et al., 1977; Koo & McKee, 1992). The pressure of hot gas trapped within the H II region would push the inner boundary of the H II region outward, indirectly doing mechanical work on the swept-up shell. A semi-analytic spherical model by Martínez-González et al. (2014) suggests that shocked wind pressure is more important than radiation pressure in driving H II region expansion. However, observed -ray luminosity is lower than the theoretical prediction of hot confined gas, casting doubt on the effectiveness of stellar winds in controlling the dynamics of gas around star clusters (Harper-Clark & Murray, 2009; Yeh & Matzner, 2012; Rosen et al., 2014). Estimates of wind energy lost via various mechanisms suggest that leakage of hot gas through holes in the shell and/or turbulent mixing at hot–cold interfaces can explain the observed low luminosity (Rosen et al., 2014). The approximate calculation by KM09 shows that a shocked wind brings only a modest increase in effective outward force on a porous shell, with a wind trapping factor of order unity. The star formation efficiencies we present here are the minimum for disruption solely by dynamical expansion of an H II region, but other feedback process could reduce .
We now comment on caveats of the present study in various aspects. First, we have assumed that the ionizing luminosity remains constant during the shell expansion. For most clouds, this is acceptable as the expansion time is shorter than , a typical main-sequence lifetime of ionizing stars (McKee & Williams, 1997; Krumholz et al., 2006). For clouds located in the lower right corner in the – plane (Figure 10), however, the ionizing output may experience a significant drop before cloud disruption. With a decrease in the outward force, the shell expansion would be slowed down and possibly fall back due to gravity, implying that higher is required than in our models. Second, while we assume spherical symmetry, expanding shells may be subject to various non-radial instabilities such as ionization front instability (Vandervoort, 1962; Kim & Kim, 2014), Rayleigh-Taylor instability, and Vishniac instability (Garcia-Segura & Franco, 1996; Whalen & Norman, 2008) in the early phase, and gravitational instability assisted by external pressure in the late phase (Wünsch et al., 2010; Iwasaki et al., 2011; Kim et al., 2012). At the nonlinear stage, the shell may break up into pieces and create holes through which photons and ionized gas can leak out, reducing feedback efficiency. Moreover, any shell that forms in an inhomogeneous cloud would itself be inhomogeneous, such that acceleration would be nonuniform (see below).
Third, our model considers a situation where the shell expansion is driven solely by a single embedded H II region, as in Fall et al. (2010) and MQT10. In reality, however, star formation in a molecular cloud may be distributed spatially with a population of subclusters (McKee & Williams, 1997). This results in expanding H II regions of various sizes interacting with each other. In early stage of expansion, the momentum injection by individual subclusters may not simply add up to the total due to cancelation; this effect is evident in the simulations of Skinner & Ostriker (2015). But once a main shell created by the most luminous H II region expands to a volume large compared to that of most ionizing sources (assuming some degree of subcluster concentration within the cloud), the effective radiation source is the same as for a single central cluster.
More importantly, we have ignored blister-type H II regions that can effectively vent ionized gas through low density regions. Since real turbulent clouds have a log-normal density distribution characterized by many clumps and holes, even an initially fully embedded H II region is likely to transform into blister-type. The analytic model of Matzner (2002) in which all H II regions are taken to be blister-type showed that photoevaporative mass loss from small subclusters (dominated by those around turnover in the cluster luminosity function (McKee & Williams 1997)) alone can limit star formation efficiency of galactic GMCs to below , with the photodestruction time scale decreasing as a function of the cloud mass. When both mass loss mechanisms are considered, dynamical disruption by shell expansion is more frequent than photodestruction alone, but significant photoevaporative mass loss also occurs prior to disruption if clouds survive for several free-fall times (Krumholz et al., 2006). However, these analyses of photoevaporation did not allow for the reduced surface area that gas confined in dense filaments presents to radiation, which tends to reduce photoevaporation. Indeed, Dale et al. (2012, 2013) found that less than 10% of the gas is photoionized in their simulations. The reduced effective area of clumpy clouds also reduces radiation forces (Thompson & Krumholz, 2016; Raskutti et al., 2015). The relative importance of the mass loss mechanisms in inhomogeneous clouds is difficult to assess and would require numerical simulations (but see Matzner & Jumper (2015)).
In inhomogeneous turbulent clouds, gas dispersal would take place in a gradual, rather than impulsive, fashion. Both analytic and numerical investigations of radiation-only feedback models show that broad distributions of surface density and/or radiation flux cause locally low-column, super-Eddington gas parcels to be ejected from the system early on, while higher surface density parcels are ejected only later, when the total luminosity of stars has increased. (e.g., Raskutti et al. 2015; Thompson & Krumholz 2016). For example, the blue shaded region in Figure 11 shows the range of net star formation efficiency of turbulent clouds with width of lognormal surface density distribution in the range , predicted from the analytic model of Raskutti et al. (2015) (see their Equation (21)), which considers just radiation pressure on dust from non-ionizing radiation. Stellar mass grows until there is little gas above the critical surface density, making increase beyond what is expected from uniform case (lower bound). Note also that the inclusion of gas pressure in our model is responsible for the dramatic difference in efficiency for low clouds.
Because the current models consider only uniform spherical shells of gas rather than a broadened surface density probability distribution function, we underestimate the luminosity and hence required to eject the denser clumps in a cloud via direct radiation forces. However, the direct photoevaporation enabled by star formation close enough to the cloud periphery would also tend to lower . Additional star formation can also in principle be triggered in shocked shells by the collect and collapse process (e.g., Elmegreen & Lada, 1977; Hosokawa & Inutsuka, 2006; Dale et al., 2007; Iwasaki et al., 2011; Dale et al., 2013). To address these complex issues, it is necessary to perform three-dimensional radiation hydrodynamic simulations of star cluster formation in a turbulent cloud with both ionizing and non-ionizing radiation.
Appendix A Light-to-mass ratio of Star Clusters
The photon output produced per unit stellar mass can differ greatly from cluster to cluster at the low-mass end owing to stochastic fluctuations in the stellar populations (da Silva et al., 2012), and/or due to the correlation between cluster mass and the maximum stellar mass (Weidner & Kroupa, 2006). To assess the likely magnitude of this effect, we use a new version of the SLUG code (Krumholz et al., 2015) to simulate spectral properties of star clusters as a function of mass. In its simplest setup, SLUG can simulate coeval stellar populations of finite mass and predict a full spectrum based on libraries of stellar evolutionary tracks and stellar atmosphere models. We use the IMF of Chabrier (2003), Starburst99 setting for spectral synthesis (which uses the stellar atmosphere model for OB stars by Pauldrach et al. (2001)), and the Geneva library for stellar evolutionary tracks.
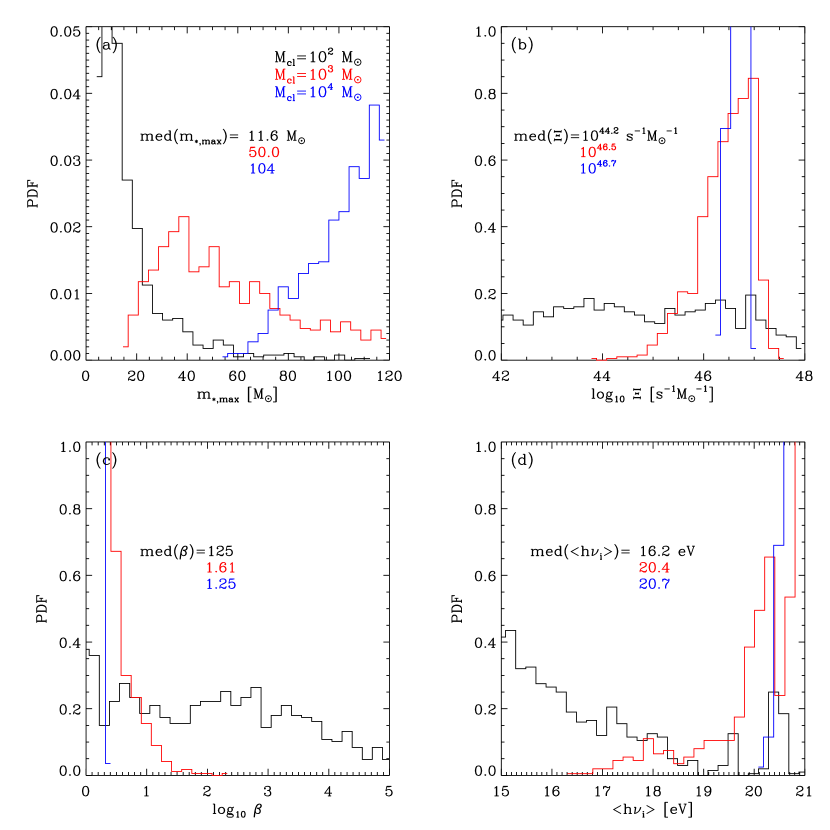
We ran 1000 simulations for different cluster mass bins logarithmically spaced by 0.2 dex. Figure 13 shows probability distributions of the maximum stellar mass in a cluster, the spectral parameter , the ionizing photon rate per stellar mass , and the mean ionizing photon energy at after birth. The cases with the total cluster mass of , , and are shown as black, red, and blue histograms, respectively. The median values of , , , and are given in each panel. As expected, of massive clusters with is close to the theoretical maximum , whereas low-mass clusters with hardly contain O-type stars more massive than . In the latter case, the distributions of and span several orders of magnitude due to high stochasticity.
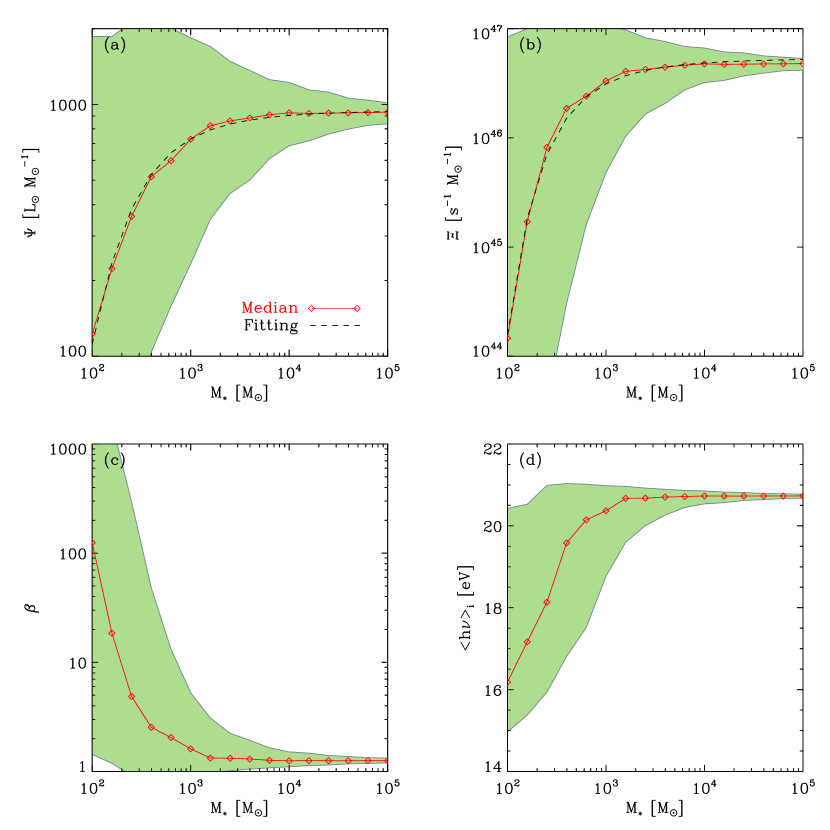
Figure 14 plots the median values (red solid lines with diamonds) and the 10–90th percentile range (green shade) of , , , and as functions of the cluster mass. We fit the median values to and using
| (A1) |
and
| (A2) |
where , which are drawn as dashed lines in Figure 14.
For , and , suitable for massive clusters that fully sample the IMF (see also Murray & Rahman, 2010). But, both and decrease rapidly for clusters less massive than . When , for example, is smaller by more than two orders of magnitude compared to the fully sampled case. This is because a large number of samples with small do not have (O-type) stars massive enough to emit ionizing photons.
Appendix B Method of Numerical Simulations
Here we describe the method of direct numerical simulations for the internal structure and expansion of an H II region. The equations of hydrodynamics we solve in spherical symmetry are
| (B1a) | |||
| (B1b) | |||
| (B1c) |
where is the total gas density, is the neutral gas density, is the radial velocity, and is the gas pressure with the ionization fraction . The source terms in Equation (B1b) include the gravitational acceleration () and radiative force (see Section 2). In Equation (B1c), and refer to the recombination rate and ionization rate, respectively. We evolve Equations (B1a)–(B1c) using a modified version of the Athena code in spherical coordinates (Stone et al., 2008). Athena is an Eulerian code for magnetohydrodynamics based on a directionally unsplit Godunov method. We use the van Leer algorithm for time integration, a piecewise linear method for spatial reconstruction, and the HLLC Riemann solver to compute the fluxes.
In order to handle radiation hydrodynamics coupled with non-equilibrium chemistry, we implement a simple radiative transfer algorithm based on the methods suggested by Mellema et al. (2006) and Krumholz et al. (2007). As in the Dr11 model, we regard the radiation as being dichromatic, consisting of ionizing and non-ionizing photons. Let () and () be the fractions of the ionizing (non-ionizing) photons per second arriving at the inner and outer boundaries of -th cell, respectively. The photon consumption rate of ionizing radiation at the -th shell is then computed as , where is the shell volume and is the optical depth across the -th cell. Here, and is the neutral and total density of the -th cell, respectively, and is the mean photoionization cross-section. The volumetric photoionization rate of the -th cell is then . The calculation for non-ionizing radiation is carried out in a similar way, with dust being the lone source of opacity.
We set the gas temperature according to the ionization fraction as
| (B2) |
with and (Henney et al., 2005). Clearly, for and for . The timestep for the radiation update is chosen by the requirement that the relative changes in and should be less than 10%. Since this timestep is usually much shorter than that for the hydrodynamic update, we subcycle the radiation update. The radiative force at the -th cell is added to the momentum flux explicitly at the end of every subcycle. To ensure accuracy of hydrodynamics, we impose an additional constraint on the hydrodynamic timestep such that the temperature and ionization fraction should not change by more than a factor of 4 between the hydrodynamic updates.
In all models, we fix the spatial resolution to and place the inner boundary at . The location of the outer boundary is chosen large enough to cover the stalling radius of an expanding shell. We adopt the outflow boundary conditions at both inner and outer radial boundaries of the simulation domain. We have tested our implementation of the ionization chemistry against a standard problem for supersonic (R-type) propagation of an ionization front in a dustless, static medium (e.g., Test 1 in Iliev et al. 2006), confirming that our numerical results reproduce the analytic solutions within errors of 3%. We then apply the code to our main problem, namely, expansion of a dusty H II region in a stratified cloud with and . Without star formation and feedback, the cloud is supposed to be in force balance between gravity and turbulent pressure. Since our one-dimensional models are unable to handle turbulence properly, we enforce the hydrostatic balance in the outer envelope unaffected by shell expansion. This is done effectively by turning off all body forces and taking outside the shock front. Section 3.5 presents our numerical results for models with fixed and , and varying density and .
References
- André et al. (2014) André, P., Di Francesco, J., Ward-Thompson, D., Inutsuka, S.-I., Pudritz, R. E., & Pineda, J. E. 2014, Protostars and Planets VI, 27
- Arthur et al. (2011) Arthur, S. J., Henney, W. J., Mellema, G., de Colle, F., & Vázquez-Semadeni, E. 2011, MNRAS, 414, 1747
- Arthur et al. (2004) Arthur, S. J., Kurtz, S. E., Franco, J., & Albarrán, M. Y. 2004, ApJ, 608, 282
- Ashman & Zepf (2001) Ashman, K. M., & Zepf, S. E. 2001, AJ, 122, 1888
- Banerjee & Kroupa (2015) Banerjee, S., & Kroupa, P. 2015, arXiv:1512.03074
- Bertoldi & McKee (1992) Bertoldi, F., & McKee, C. F. 1992, ApJ, 395, 140
- Carpenter (2000) Carpenter, J. M. 2000, AJ, 120, 3139
- Castor et al. (1975) Castor, J., McCray, R., & Weaver, R. 1975, ApJ, 200, L107
- Chabrier (2003) Chabrier, G. 2003, PASP, 115, 763
- Da Rio et al. (2014) Da Rio, N., Tan, J. C., & Jaehnig, K. 2014, ApJ, 795, 55
- da Silva et al. (2012) da Silva, R. L., Fumagalli, M., & Krumholz, M. 2012, ApJ, 745, 145
- Dale et al. (2007) Dale, J. E., Bonnell, I. A., & Whitworth, A. P. 2007, MNRAS, 375, 1291
- Dale et al. (2012) Dale, J. E., Ercolano, B., & Bonnell, I. A. 2012, MNRAS, 424, 377
- Dale et al. (2013) —. 2013, MNRAS, 430, 234
- Dale et al. (2013) —. 2013, MNRAS, 431, 1062
- Davis et al. (2014) Davis, S. W., Jiang, Y.-F., Stone, J. M., & Murray, N. 2014, ApJ, 796, 107
- Dobbs et al. (2014) Dobbs, C. L., et al. 2014, Protostars and Planets VI, 3
- Draine (2011) Draine, B. T. 2011, ApJ, 732, 100 (Dr11)
- Draine (2011) Draine, B. T. 2011, Physics of the Interstellar and Intergalactic Medium by Bruce T. Draine. Princeton University Press, 2011
- Elmegreen (1983) Elmegreen, B. G. 1983, MNRAS, 203, 1011
- Elmegreen & Efremov (1997) Elmegreen, B. G., & Efremov, Y. N. 1997, ApJ, 480, 235
- Elmegreen & Lada (1977) Elmegreen, B. G., & Lada, C. J. 1977, ApJ, 214, 725
- Elmegreen & Scalo (2004) Elmegreen, B. G., & Scalo, J. 2004, ARA&A, 42, 211
- Evans et al. (2009) Evans, II, N. J., et al. 2009, ApJS, 181, 321
- Fall et al. (2010) Fall, S. M., Krumholz, M. R., & Matzner, C. D. 2010, ApJ, 710, L142
- Feldmann & Gnedin (2011) Feldmann, R., & Gnedin, N. Y. 2011, ApJ, 727, L12
- Franco et al. (1990) Franco, J., Tenorio-Tagle, G., & Bodenheimer, P. 1990, ApJ, 349, 126
- Franco et al. (1994) Franco, J., Shore, S. N., & Tenorio-Tagle, G. 1994, ApJ, 436, 795
- García et al. (2014) García, P., Bronfman, L., Nyman, L.-Å., Dame, T. M., & Luna, A. 2014, ApJS, 212, 2
- Garcia-Segura & Franco (1996) Garcia-Segura, G., & Franco, J. 1996, ApJ, 469, 171
- Geen et al. (2015) Geen, S., Rosdahl, J., Blaizot, J., Devriendt, J., & Slyz, A. 2015, MNRAS, 448, 3248
- Geen et al. (2015) Geen, S., Hennebelle, P., Tremblin, P., & Rosdahl, J. 2015, MNRAS, 454, 4484
- Genzel et al. (2010) Genzel, R., et al. 2010, MNRAS, 407, 2091
- Goldbaum et al. (2011) Goldbaum, N. J., Krumholz, M. R., Matzner, C. D., & McKee, C. F. 2011, ApJ, 738, 101
- Goodwin (1997) Goodwin, S. P. 1997, MNRAS, 284, 785
- Harper-Clark (2011) Harper-Clark, E. 2011, PhD thesis, University of Toronto (Canada)
- Harper-Clark & Murray (2009) Harper-Clark, E., & Murray, N. 2009, ApJ, 693, 1696
- Heiles & Troland (2003) Heiles, C., & Troland, T. H. 2003, ApJ, 586, 1067
- Hennebelle & Iffrig (2014) Hennebelle, P., & Iffrig, O. 2014, A&A, 570, A81
- Henney & Arthur (1998) Henney, W. J., & Arthur, S. J. 1998, AJ, 116, 322
- Henney et al. (2005) Henney, W. J., Arthur, S. J., Williams, R. J. R., & Ferland, G. J. 2005, ApJ, 621, 328
- Hillenbrand & Hartmann (1998) Hillenbrand, L. A., & Hartmann, L. W. 1998, ApJ, 492, 540
- Hills (1980) Hills, J. G. 1980, ApJ, 235, 986
- Hopkins et al. (2011) Hopkins, P. F., Quataert, E., & Murray, N. 2011, MNRAS, 417, 950
- Hosokawa & Inutsuka (2006) Hosokawa, T., & Inutsuka, S.-i. 2006, ApJ, 646, 240
- Iliev et al. (2006) Iliev, I. T., et al. 2006, MNRAS, 371, 1057
- Iwasaki et al. (2011) Iwasaki, K., Inutsuka, S.-i., & Tsuribe, T. 2011, ApJ, 733, 16
- Joung & Mac Low (2006) Joung, M. K. R., & Mac Low, M.-M. 2006, ApJ, 653, 1266
- Kennicutt & Evans (2012) Kennicutt, R. C., & Evans, N. J. 2012, ARA&A, 50, 531
- Keto (2002) Keto, E. 2002, ApJ, 580, 980
- Keto (2003) Keto, E. 2003, ApJ, 599, 1196
- Keto (2007) —. 2007, ApJ, 666, 976
- Kim et al. (2013) Kim, C.-G., Ostriker, E. C., & Kim, W.-T. 2013, ApJ, 776, 1
- Kim et al. (2012) Kim, J.-G., Kim, W.-T., Seo, Y. M., & Hong, S. S. 2012, ApJ, 761, 131
- Kim & Kim (2014) Kim, J.-G., & Kim, W.-T. 2014, ApJ, 797, 135
- Koo & McKee (1992) Koo, B.-C., & McKee, C. F. 1992, ApJ, 388, 93
- Kroupa & Boily (2002) Kroupa, P., & Boily, C. M. 2002, MNRAS, 336, 1188
- Krumholz et al. (2012) Krumholz, M. R., Dekel, A., & McKee, C. F. 2012, ApJ, 745, 69
- Krumholz et al. (2015) Krumholz, M. R., Fumagalli, M., da Silva, R. L., Rendahl, T., & Parra, J. 2015, MNRAS, 452, 1447
- Krumholz & Matzner (2009) Krumholz, M. R., & Matzner, C. D. 2009, ApJ, 703, 1352 (KM09)
- Krumholz et al. (2006) Krumholz, M. R., Matzner, C. D., & McKee, C. F. 2006, ApJ, 653, 361
- Krumholz & McKee (2005) Krumholz, M. R., & McKee, C. F. 2005, ApJ, 630, 250
- Krumholz et al. (2007) Krumholz, M. R., Stone, J. M., & Gardiner, T. A. 2007, ApJ, 671, 518
- Krumholz & Tan (2007) Krumholz, M. R., & Tan, J. C. 2007, ApJ, 654, 304
- Krumholz & Thompson (2012) Krumholz, M. R., & Thompson, T. A. 2012, ApJ, 760, 155
- Krumholz & Thompson (2013) —. 2013, MNRAS, 434, 2329
- Krumholz et al. (2014) Krumholz, M. R., et al. 2014, Protostars and Planets VI, 243
- Lada & Lada (2003) Lada, C. J., & Lada, E. A. 2003, ARA&A, 41, 57
- Lee et al. (2012) Lee, E. J., Murray, N., & Rahman, M. 2012, ApJ, 752, 146
- Leroy et al. (2013) Leroy, A. K., et al. 2013, AJ, 146, 19
- Lopez et al. (2011) Lopez, L. A., Krumholz, M. R., Bolatto, A. D., Prochaska, J. X., & Ramirez-Ruiz, E. 2011, ApJ, 731, 91
- Lopez et al. (2014) Lopez, L. A., Krumholz, M. R., Bolatto, A. D., Prochaska, J. X., Ramirez-Ruiz, E., & Castro, D. 2014, ApJ, 795, 121
- Martínez-González et al. (2014) Martínez-González, S., Silich, S., & Tenorio-Tagle, G. 2014, ApJ, 785, 164
- Mathews (1967) Mathews, W. G. 1967, ApJ, 147, 965
- Matzner (2002) Matzner, C. D. 2002, ApJ, 566, 302
- Matzner (2007) —. 2007, ApJ, 659, 1394
- Matzner & Jumper (2015) Matzner, C. D., & Jumper, P. H. 2015, arXiv:1511.03269
- Matzner & McKee (2000) Matzner, C. D., & McKee, C. F. 2000, ApJ, 545, 364
- McKee & Ostriker (2007) McKee, C. F., & Ostriker, E. C. 2007, ARA&A, 45, 565
- McKee & Williams (1997) McKee, C. F., & Williams, J. P. 1997, ApJ, 476, 144
- Meier et al. (2002) Meier, D. S., Turner, J. L., & Beck, S. C. 2002, AJ, 124, 877
- Mellema et al. (2006) Mellema, G., Iliev, I. T., Alvarez, M. A., & Shapiro, P. R. 2006, New A, 11, 374
- Murray (2011) Murray, N. 2011, ApJ, 729, 133
- Murray et al. (2010) Murray, N., Quataert, E., & Thompson, T. A. 2010, ApJ, 709, 191 (MQT10)
- Murray & Rahman (2010) Murray, N., & Rahman, M. 2010, ApJ, 709, 424
- Myers et al. (1986) Myers, P. C., Dame, T. M., Thaddeus, P., Cohen, R. S., Silverberg, R. F., Dwek, E., & Hauser, M. G. 1986, ApJ, 301, 398
- Nakamura & Li (2014) Nakamura, F., & Li, Z.-Y. 2014, ApJ, 783, 115
- Osterbrock (1989) Osterbrock, D. E. 1989, Astrophysics of Gaseous Nebulae and Active Galactic Nuclei (Mill Valley, CA, University Science Books)
- Ostriker & Shetty (2011) Ostriker, E. C., & Shetty, R. 2011, ApJ, 731, 41
- Pauldrach et al. (2001) Pauldrach, A. W. A., Hoffmann, T. L., & Lennon, M. 2001, A&A, 375, 161
- Petrosian et al. (1972) Petrosian, V., Silk, J., & Field, G. B. 1972, ApJ, 177, L69
- Rahman & Murray (2010) Rahman, M., & Murray, N. 2010, ApJ, 719, 1104
- Raskutti et al. (2015) Raskutti, S., Ostriker, E. C., & Skinner, M. A. ApJ, submitted
- Rho & Petre (1998) Rho, J., & Petre, R. 1998, ApJ, 503, L167
- Rosen et al. (2014) Rosen, A. L., Lopez, L. A., Krumholz, M. R., & Ramirez-Ruiz, E. 2014, MNRAS, 442, 2701
- Scoville et al. (2001) Scoville, N. Z., Polletta, M., Ewald, S., Stolovy, S. R., Thompson, R., & Rieke, M. 2001, AJ, 122, 3017
- Semenov et al. (2003) Semenov, D., Henning, T., Helling, C., Ilgner, M., & Sedlmayr, E. 2003, A&A, 410, 611
- Shu (1992) Shu, F. H. 1992, The physics of astrophysics. Volume II: Gas dynamics., by Shu, F. H.. University Science Books, Mill Valley, CA (USA), 1992
- Shu et al. (2002) Shu, F. H., Lizano, S., Galli, D., Cantó, J., & Laughlin, G. 2002, ApJ, 580, 969
- Skinner & Ostriker (2013) Skinner, M. A., & Ostriker, E. C. 2013, ApJS, 206, 21
- Skinner & Ostriker (2015) Skinner, M. A., & Ostriker, E. C. 2015, ApJ, 809, 187
- Spitzer (1978) Spitzer, L. 1978, Physical processes in the interstellar medium
- Stone et al. (2008) Stone, J. M., Gardiner, T. A., Teuben, P., Hawley, J. F., & Simon, J. B. 2008, ApJS, 178, 137
- Tan et al. (2006) Tan, J. C., Krumholz, M. R., & McKee, C. F. 2006, ApJ, 641, L121
- Tan et al. (2014) Tan, J. C., Beltrán, M. T., Caselli, P., Fontani, F., Fuente, A., Krumholz, M. R., McKee, C. F., & Stolte, A. 2014, Protostars and Planets VI, 149
- Thompson et al. (2015) Thompson, T. A., Fabian, A. C., Quataert, E., & Murray, N. 2015, MNRAS, 449, 147
- Thompson & Krumholz (2016) Thompson, T. A., & Krumholz, M. R. 2016, MNRAS, 455, 334
- Tremblin et al. (2014) Tremblin, P., Anderson, L. D., Didelon, P., et al. 2014, A&A, 568, A4
- Turner et al. (2015) Turner, J. L., Beck, S. C., Benford, D. J., Consiglio, S. M., Ho, P. T. P., Kovács, A., Meier, D. S., & Zhao, J.-H. 2015, Nature, 519, 331
- Vandervoort (1962) Vandervoort, P. O. 1962, ApJ, 135, 212
- Walch & Naab (2015) Walch, S., & Naab, T. 2015, MNRAS, 451, 2757
- Wang et al. (2010) Wang, P., Li, Z.-Y., Abel, T., & Nakamura, F. 2010, ApJ, 709, 27
- Weaver et al. (1977) Weaver, R., McCray, R., Castor, J., Shapiro, P., & Moore, R. 1977, ApJ, 218, 377
- Weidner & Kroupa (2006) Weidner, C., & Kroupa, P. 2006, MNRAS, 365, 1333
- Whalen & Norman (2008) Whalen, D. J., & Norman, M. L. 2008, ApJ, 672, 287
- Whitworth (1979) Whitworth, A. 1979, MNRAS, 186, 59
- Williams & McKee (1997) Williams, J. P., & McKee, C. F. 1997, ApJ, 476, 166
- Wünsch et al. (2010) Wünsch, R., Dale, J. E., Palous, J., & Whitworth, A. P. 2010, MNRAS, 407, 1963
- Yeh & Matzner (2012) Yeh, S. C. C., & Matzner, C. D. 2012, ApJ, 757, 108