Local SDSS galaxies in the Herschel Stripe82 survey: A critical assessment of optically-derived star-formation rates
Abstract
We study a set of 3319 galaxies in the redshift interval with far-infrared (FIR) coverage from the Herschel Stripe 82 survey (HerS), and emission-line measurements, redshifts, stellar masses and star-formation rates (SFRs) from the SDSS (DR7) MPA/JHU database. About 40% of the sample are detected in the Herschel/SPIRE 250 m band. Total infrared (TIR) luminosities derived from HerS and ALLWISE photometry allow us to compare infrared and optical estimates of SFR with unprecedented statistics for diverse classes of galaxies. We find excellent agreement between TIR-derived and emission line-based SFRs for H II galaxies. Other classes, such as active galaxies and evolved galaxies, exhibit systematic discrepancies between optical and TIR SFRs. We demonstrate that these offsets are attributable primarily to survey biases and the large intrinsic uncertainties of the – and colour–based optical calibrations used to estimate the SDSS SFRs of these galaxies. Using a classification scheme which expands upon popular emission-line methods, we demonstrate that emission-line galaxies with uncertain classifications include a population of massive, dusty, metal-rich star-forming systems that are frequently neglected in existing studies. We also study the capabilities of infrared selection of star-forming galaxies. FIR selection reveals a substantial population of galaxies dominated by cold dust which are missed by the long-wavelength WISE bands. Our results demonstrate that Herschel large-area surveys offer the means to construct large, relatively complete samples of local star-forming galaxies with accurate estimates of SFR that can be used to study the interplay between nuclear activity and star-formation.
keywords:
Galaxies – surveys – galaxies: active – infrared: galaxies – methods: data analysis1 Introduction
The Herschel Space Observatory (Pilbratt et al. 2010), now in its archival phase, has redefined our knowledge of dusty star-formation in our Galaxy and out to the distant cosmos. As part of its legacy, Herschel targeted large areas of the sky for extragalactic science. This capability was thanks in part to the sensitivity and large field-of-view of the SPIRE imaging instrument (Griffin et al. 2010), which quickly approached the confusion limit in its range of operating wavelengths ( m) even with sky-scan rates as high as 60” sec-1.
While much of the effort from Herschel extragalactic surveys have concentrated on galaxy populations in the distant Universe (Lutz 2014), wide-area mapping programs are also suited to studies of more nearby galaxies. For example, the largest Herschel survey of the extragalactic sky is the Herschel-ATLAS (Eales et al. 2010). With its total area of 550 deg2, it spans a co-moving volume of 0.35 Gpc3 out to , approximately that of the largest dark matter simulations currently available, such as the Millennium simulation (Springel et al. 2005). As we will demonstrate, confusion-limited photometry of SPIRE images can detect the far-infrared (FIR) dust emission in the majority of local massive star-forming galaxies from such surveys. In addition, the SPIRE PSF (FWHM ”) is broad enough to allow the treatment of all but the very nearest galaxies as point sources, easing the process of photometric characterisation. But it is also narrow enough to prevent significant blending of galaxies even in compact groups. Therefore Herschel wide-area photometric catalogs combined with local galaxy surveys, such as the SDSS Main Galaxy sample, offer an ideal dataset to explore the star-formation and dust properties of normal galaxies over cosmologically interesting volumes.
The FIR also has unique value as a reliable tracer of the star-formation rate (SFR) in active galaxies, in which the emission from active galactic nuclei (AGN) can otherwise significantly contaminate or overpower optical, UV or emission line tracers. The long-wavelength FIR ( m) has been demonstrated to arise primarily from dust that is unaffected by the intense radiation from the nucleus, even in galaxies that host luminous AGN (Netzer et al. 2007; Mullaney et al. 2011; Rosario et al. 2012). Studies of star-formation in active galaxies from the SDSS generally rely on the calibration of the SFR or others that involve spectral indices (Section 2.2). These can be critically appraised and, if needed, replaced by direct calorimetric tracers such as the FIR luminosity.
Despite these motivations, only few studies in the existing literature have looked at the Herschel view of the local Universe beyond the very nearest, resolved systems which have been targeted individually in large programs such as HRS (Boselli et al. 2010) and KINGFISH (Kennicutt et al. 2011). Lam et al. (2013) studied the relationships between total infrared (TIR) and H luminosities for emission line galaxies from the SDSS in the 14 deg2 science demonstration release of the Herschel-ATLAS. These two tracers were well correlated, though the tightness of the correlation grew increasingly worse towards longer FIR wavelengths. At high emission line luminosities, active galaxies deviated from the typical correlations due to the component of AGN-ionised gas.
With another modest sample of SDSS galaxies in smaller area deep extragalactic fields ( deg2), Domínguez Sánchez et al. (2014) used multi-wavelength tracers, including Herschel/PACS 100 and 160 m photometry, to systematically compare the performance of various star-formation indicators, finding broad consistency between them. They also examined the location of Herschel-detected galaxies on the plane of star-formation rate (SFR) and stellar mass (M⋆), confirming that these galaxies lie on the so-called Main Sequence of star-formation, a ridgeline feature in this plane which defines the location of most star-forming galaxies (e.g. Noeske et al. 2007; Elbaz et al. 2007; Salim et al. 2007; Speagle et al. 2014).
While breaking new ground, these studies are limited by their small sample sizes, which especially limits conclusive results for rare populations, such as active galaxies. In addition, a full contextual study of FIR flux-limited samples also requires a treatment of the galaxies that are not detected in the FIR.
In this work, we study the properties of galaxies from the SDSS that lie within the Herschel Stripe 82 survey, including a full characterisation of the subset of about 1300 galaxies that are detected in the FIR. We examine their redshift distributions, classifications, TIR luminosities and detection rates, and compare optical- and infrared-based SFR calibrations, including the important limitations set by the large systematic uncertainties on SFRs from spectral index and SED-fitting techniques. This study is the first part of a two paper series on the star-forming properties of narrow-line selected AGN in the SDSS and serves to introduce our dataset and key measurements that will be used in the second paper.
We adopt a standard -CDM Concordance cosmology, with km s-1 Mpc-1 and . Stellar masses reported in this study are estimated with a Chabrier (2003) IMF. Luminosities are quoted in erg s-1 and SFRs in M⊙/yr, unless otherwise stated.
2 Datasets and Methods
In this section, we describe the datasets and methods used for the analyses in the rest of this work. We draw on the extensive set of measurements (redshifts, stellar masses, line fluxes, etc. ) available from the SDSS/MPA-JHU database to define and classify our sample of galaxies for study, and to understand their range of observed properties. Where possible, we employ Herschel and WISE photometry to constrain the TIR using SED fits, and GALEX FUV photometry to correct for stellar emission not absorbed by dust. These data are brought to bear on the cross-assessment of infrared (IR), ultraviolet (UV) and optical SFRs in later sections.
2.1 The Herschel Stripe 82 survey
The Herschel Stripe82 survey (HerS; Viero et al. 2014) consists of 250, 350 and 500 m Herschel/SPIRE maps over a total area of 79 deg2 in the RA range of 13∘ to 37∘ and a Declination range of -2∘ to 2∘. The field was covered using two sets of incompletely overlapping, nearly orthogonal scans, leading to some variation in depth. The large SPIRE PSF (FWHM of 18.2”, 25.2”, 36.3” at 250, 350 and 500 m respectively) ensures that almost all galaxies are point sources in HerS. The maps are deep enough to approach the confusion limit at 250 m, and confusion noise is a substantial factor in the source detection limit of the survey.
We make use of the public survey catalog available from the HerS website 111http://www.astro.caltech.edu/hers/HerS_Home.html. A detailed treatment of the source detection and characterisation is available in (Viero et al. 2014), and we summarise main aspects here. The catalog is 250 m selected to a depth of 28-31 mJy, depending on the local coverage of the map. Source detection was performed using the STARFINDER package (Diolaiti et al. 2000) on a high-pass filtered version of the 250 m map, designed to remove extended Galactic emission while not strongly influencing the PSF of point sources. Nearby extended sources were also removed from this catalog. The DESPHOT method of Roseboom et al. (2010) optimised for SPIRE was used for photometry of the detected sources in all bands. This technique deals with deblending of SPIRE sources effectively and uses 250 m sources as priors for photometry from the lower resolution 350 and 500 m bands. As a figure-of-merit, the approximate 250 m depth of mJy is sufficient to detect a galaxy at with a SFR of M⊙/yr, making it a valuable tool to study obscured and dusty star-formation in the local Universe.
2.1.1 Infrared SED templates
Galaxies vary in the relative amounts of warm and cold dust (e.g., Dale et al. 2001; Dale & Helou 2002; Ciesla et al. 2014), which affects the MIR-to-FIR luminosity in their infrared (IR) spectral energy distributions (SEDs). Dale & Helou (2002) present a family of IR SED templates that encapsulate much of this variation among galaxies in the local Universe. The library of templates is parameterised by , the power-law index of the radiation intensity () incident on the dust grains. From Dale et al. (2001), is given by:
| (1) |
where is the mass of dust heated by radiation of intensity U. We work with a subset of 48 templates with , since the rest of the templates are indistinguishable from the template with in the IR bands used for our SED fits.
is closely related to the temperature distribution of the grains. Approximating the Dale & Helou (2002) SEDs as modified black bodies with a characteristic dust temperature , Magnelli et al. (2014) have calculated a monotonic conversion between and . Readers interested in the dust temperatures of galaxies in this work can consult Figure 2 in which both and are presented.
2.2 SDSS measurements
By design, HerS overlaps with the Stripe 82 of the Sloan Digital Sky Survey (SDSS) over about 70 deg2. The Stripe 82 was the target of multiple imaging passes in the five SDSS bands. The imaging is considerably deeper than over the regular survey, making the Stripe 82 particularly useful for detailed structural studies of galaxies in the Local Universe. The SDSS spectroscopic survey covers Stripe 82 with high areal sampling completeness (%), and the SDSS spectrograph has provided moderate resolution spectra of the central parts of galaxies through the 3” diameter of its fibre apertures. We consider galaxies from the SDSS Main Galaxy sample (Strauss et al. 2002), with and confirmed redshifts in the range of . The redshift interval covers the majority of SDSS spectroscopic targets but is small enough to keep redshift-dependent selection and aperture effects manageable, and reduces the need to account for galaxy evolutionary trends which become non-negligible by . A total of 3319 SDSS galaxies that satisfy the main selection criteria lie in the HerS footprint, and we refer to them collectively as the working sample. For reference, the comoving volume spanned by our sample is Mpc3, considerably larger than those of modern cosmological hydrodynamic simulations such as Illustris (Vogelsberger et al. 2014) or EAGLE (Schaye et al. 2015).
We adopt emission line fluxes, aperture corrections, stellar masses and star-formation rates (SFRs) from the MPA-JHU SDSS Data Release 7 (DR7; Abazajian et al. 2009) database222http://www.mpa-garching.mpg.de/SDSS/DR7/ of galaxy measurements. We summarise the methodology for estimating these quantities, but further details may be found on the database webpages and in related publications (Kauffmann et al. 2003; Brinchmann et al. 2004; Salim et al. 2007).
Line fluxes were measured from the SDSS spectra after subtraction of a model for the stellar continuum of the galaxy. For those galaxies with line spectra dominated by the emission from H II regions (i.e., H II galaxies), calibrations based on multi-line ionisation models were used to determine the dust extinction-corrected SFR within the fibre. In other galaxies, such as those with weak line fluxes or those influenced by ionisation from AGN or other sources besides young stars, a different calibration was employed to derive fibre SFRs, based on a relation between the line-based specific star-formation rate (sSFR) and the optical index in H II galaxies. We will use the term ‘ calibration’ to refer to this method later in the paper.
The SDSS photometry beyond the fibre aperture was calculated by subtracting simulated photometry extracted from their spectra. The SFRs of all galaxies beyond the fibre were estimated from this photometry in a uniform fashion, using SED models calibrated against UV-optical tracers based on the study of Salim et al. (2007). The total SFRs of a galaxy is the sum of the individual fibre and outer SFRs. The total SFR is usually much higher than the fibre SFR – the median ratio is with considerable scatter. The total SFRs are mostly influenced by the component outside the fibre, which is estimated using the same methodology for all classes of galaxy.
Stellar masses were estimated from the total SDSS five-band photometry using the same SED models used to estimate the SFRs, both within and outside the fibre aperture. The MPA-JHU database specifically excludes galaxies with clear broad AGN lines; therefore, all AGN in this study are “narrow-line” systems, i.e., their nuclear continuum emission is strongly obscured. This ensures that the stellar mass estimates are not significantly contaminated by AGN light. Corrections for the emission line fluxes were applied to the fibre photometry before estimating the fibre masses, so the high equivalent width of narrow emission lines from ionised regions around powerful AGN do not bias their masses.
SDSS sources were linked to the HerS catalog using a simple closest distance crossmatch with a maximum tolerance of 5”. The choice of this tolerance was based on the distribution of separations between HerS and SDSS sources singly matched with a circular tolerance of 20”, larger than the 250 m PSF size. From the working sample, 1349 galaxies are matched to a 250 m–selected HerS counterpart, with no multiple matches or duplicate matches; a FIR detection rate of 40%. Of these, 756 galaxies are detected at 350 m, and 165 galaxies are also detected at 500 m.
2.3 WISE 22 m photometry
The Wide-field Infrared Survey Explorer (WISE, Wright et al. 2010) has mapped the entire sky in four MIR bands at 3.4 m, 4.6 m, 12 m and 22 m. A public catalog is available consisting of photometry from the all-sky survey atlas of all point-like and extended sources detected with a S/N in at least one of the four WISE bands. The catalog is not uniform, since the depth of the WISE imaging varies considerably across the sky. The astrometry accuracy of the catalog, tied to the 2MASS coordinate system, is better than 200 mas.
We crossmatched the working sample with the ALLWISE all-sky survey catalog available from the IPAC/IRSA service, using a simple cone search with a tolerance of 2”. About 96% have a counterpart in the WISE survey, consistent with the success rate of other studies (e.g., Rosario et al. 2013a). We rely on the photometry performed by the ALLWISE survey pipeline, details of which may be found in the Data Release Supplement (http://wise2.ipac.caltech.edu/docs/release/allwise/expsup/). The pipeline provides several different photometric measurements for sources in all four WISE bands. The primary photometry is performed by PSF decomposition of sources, which assumes that pipeline targets are composed of blends of point sources (the ‘profile-fitting’ or PRO photometry). A maximum-likelihood model of the source plane is simultaneously fit in all four bands for contiguous batches of sources, while as many as two PSF components are allowed per source. In addition, various flavours of circular and elliptical aperture photometry are also provided by the survey pipeline.
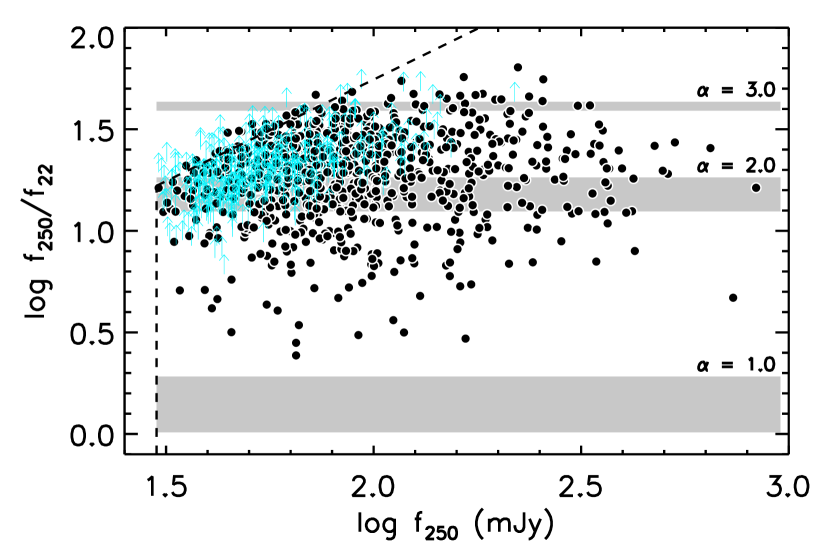
In this work, we only employ photometry in the longest wavelength W4 band (22 m), covering a continuum-dominated part of the thermal IR beyond the bands emitted by polycyclic aromatic hydrocarbons (Rosario et al. 2013a). The FWHM of the WISE PSF in the W4 band is . We use the ALLWISE profile-fit at 22 m as a way to identify if the image of a source in that band is likely to be extended (see the Data Release Supplement and the discussion in Rosario et al. 2013a). All the galaxies in our working sample are consistent with being point sources in the W4 band, allowing us to adopt their PRO photometry. 830 galaxies from the HerS-detected working sample (%) are detected in W4 with SNR. This SNR threshold is lower than what one may traditionally adopt for detection, but since we only use WISE photometry for sources with a firm 250 m prior detection, we use the lower significance measurements from ALLWISE for our SED fits (Section 2.4).
The WISE pipeline also provides an estimate of the W4 flux limit for every source based on the results of the PSF decomposition. These limits have typical value of 2.5 mJy (3), but there is a considerable tail of shallower limits as a consequence of confusion in the WISE atlas images.
While the flux density limit of the 22 m catalog is about an order of magnitude deeper than HerS at 250 m, the detection rate of our working sample in ALLWISE W4 is considerably lower than in HerS. The reason for this can be appreciated through Figure 1. At the W4 flux limit, a population of galaxies with Jy and high (cold dust-dominated SEDs) are missed in ALLWISE but detectable in HerS. This effect also presents an important corollary relevant for MIR studies of local galaxies (e.g., Lee, Hwang & Ko 2013): galaxy samples selected purely from the thermal MIR are biased towards warm dust SEDs, while selections based on FIR photometry over the Rayleigh-Jeans (R-J) tail of the cold dust emission, span the full range in dust SED shapes.
2.4 GALEX FUV photometry
The Herschel and WISE datasets sample the thermal IR SEDs and measure the dust-reprocessed UV and optical luminosity of the SDSS galaxies in HerS. However, a fraction of the UV output from star-formation does escape unextinguished, which may be recovered from direct UV photometry. In this work, we use GALEX far-UV (FUV) data from the Medium Imaging Survey (MIS) which covers a substantial part of the Stripe82. The SDSS/DR7-GALEX/GR7 cross-matched subcatalog, available from the GALEX CasJobs SQL interface (http://galex.stsci.edu/casjobs/), was queried to recover all GALEX sources over the HerS footprint with an SDSS counterpart. Associations were then made to the galaxies in our sample using the unique SDSS ObjIDs. To minimise spurious matches, we applied a somewhat tighter cross-match tolerance of 3” over that of the public SDSS-GALEX catalog (which matches counterparts out to 5”).
In our analysis, we employ photometry from the GALEX FUV channel which covers the 1350–1750 Å band, with a peak sensitivity at Å. Light at these wavelengths is particularly representatives of the emission from hot stars and this band has been successfully used to study unobscured star-formation in local galaxies (e.g. Salim et al. 2007; Hao et al. 2011).
The GALEX coverage over the Stripe82 area is very non-uniform. When comparing detection statistics of SDSS galaxies in GALEX and HerS (Section 4), we restrict ourselves to galaxies that lie in regions with GALEX exposures ksec. We determine these regions using a coverage map generated using the full MIS source catalog in the HerS footprint (also obtained from GALEX CasJobs), binned in boxes over the field. This approach ensures that varying FUV depths do not lead to inconsistent conclusions about the relative amount of obscured and unobscured star-formation.
Of the 3066 galaxies of the working sample with adequate GALEX coverage, 1832 (60%) are detected in the FUV band. K-corrections in the band are expected to be small (% to for the typical UV slope of galaxies). Therefore, we calculate FUV luminosities (LFUV) directly using the measured FUV fluxes.

In Table 1, we tabulate the Herschel/SPIRE, GALEX/MIS and WISE W4 photometry for all 3319 galaxies in the working sample. A minimum SNR of 3 is applied to all Herschel photometry, and a minimum SNR of 2 is applied to the WISE photometry. We do not apply a SNR threshold to the GALEX photometry, depending instead on the criteria used in the MIS catalog. However, we do apply a minimum GALEX coverage as discussed above.
| SDSS OBJID | ||||||||||
|---|---|---|---|---|---|---|---|---|---|---|
| (log Jy) | (log Jy) | (log Jy) | (log Jy) | (log Jy) | (log Jy) | (log Jy) | (log Jy) | (log Jy) | (log Jy) | |
| 588015509277573268 | – | – | – | – | – | – | – | – | – | – |
| 588015507667419322 | – | – | – | – | – | – | – | – | – | – |
| 588015507667419317 | – | – | – | – | – | – | – | – | – | – |
| 587731511538876510 | -4.27 | -5.67 | -2.66 | -3.05 | -1.23 | -1.97 | – | – | – | – |
| 587731513148047431 | – | – | – | – | – | – | – | – | – | – |
| 587731512069587131 | -4.83 | -5.92 | -2.15 | -2.76 | -0.71 | -1.98 | -1.06 | -1.99 | -1.48 | -1.97 |
| 587731512610324707 | – | – | -1.57 | -2.89 | -0.29 | -1.99 | -0.63 | -1.98 | -1.18 | -1.95 |
| 587731513142542498 | – | – | -1.99 | -2.76 | -0.81 | -1.98 | -1.18 | -1.99 | – | – |
| 587731512608292991 | -4.62 | -5.63 | -2.25 | -3.03 | -0.68 | -1.97 | -1.04 | -1.98 | -1.46 | -1.94 |
| 587731512069455963 | – | – | -2.33 | -3.05 | -0.83 | -1.96 | -1.10 | -1.98 | -1.36 | -1.95 |
| 587731512069587156 | – | – | -2.37 | -3.01 | -1.05 | -2.00 | -1.39 | -2.00 | – | – |
| 587731513144377525 | – | – | – | – | – | – | – | – | – | – |
| 587731514222510237 | -3.69 | -5.62 | -1.88 | -2.95 | -0.63 | -1.97 | -0.99 | -1.99 | -1.44 | -1.94 |
| 587731514222248063 | – | – | – | – | – | – | – | – | – | – |
| 587731514222182633 | -3.60 | -5.56 | -1.90 | -3.02 | -0.47 | -1.99 | -0.73 | -1.99 | -1.11 | -1.97 |
2.5 Infrared luminosities
In this work, the total infrared luminosity (TIR) of a galaxy is defined as its integrated IR luminosity between 8 and 1000 m. There are different standards in the literature for the range of wavelengths over which the TIR luminosity is integrated. For example, the recent review of Kennicutt & Evans (2012) define the TIR over 3–1100 m. We will instead use the older definition from Kennicutt (1998), which is more widespread in the existing literature. The MIR between 3 and 10 m can be affected in complex ways by emission from stellar photospheres and very hot dust from star-formation and AGN (e.g. Lu et al. 2003), and is therefore harder to constrain empirically.
The difference in the IR luminosity over 3–1100 m and 8–1000 m for the library of Dale & Helou (2002) templates used in this work ranges between 4% and 15%, and is therefore only a minor part of the TIR. We adopt a fixed difference of 10% (0.041 dex) to allow a conversion between these two standards when exploring the performance of multi-wavelength SFR calibrations in Section 4. This value is the median difference shown by galaxies from our working sample with constrained SED shapes based on the fits discussed below.
The TIR luminosities (LIR) of galaxies are estimated using fits to their thermal IR SEDs, as sampled by the SPIRE bands and the WISE 22 m band. The SEDs are fit to the library of IR galaxy templates from Dale & Helou (2002) using the the Levenburg-Markquardt least-squares algorithm as implemented in the IDL routine MPFIT.
Fits to SPIRE photometry alone do not allow any satisfactory discrimination of the full SED shape, since these bands span the R-J tail of dust emission. For the subset of galaxies with detections in both the SPIRE bands and WISE 22 m band, the larger baseline in wavelength gives more accurate constraints on the dust SED. For these galaxies, we estimated the uncertainty on LIR as the range in luminosities shown by IR templates that differed from the best-fit template by a reduced . This systematic term to the LIR uncertainty is generally larger than the pure statistical uncertainty from the IR photometry.
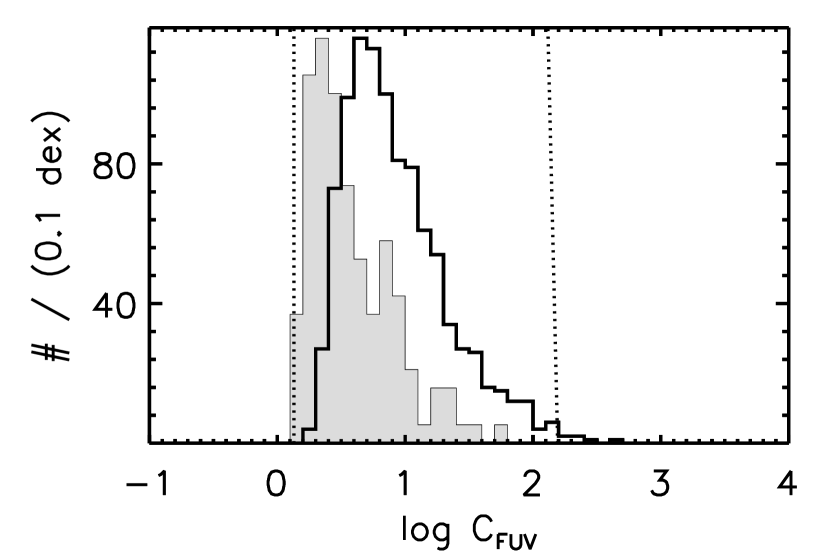
A histogram of best-fit for HerS- and ALLWISE-detected subset of the working sample is shown is Figure 2. It peaks sharply at or K, typical of normal star-forming galaxies (Dale et al. 2001). A small fraction of sources have a best-fit , an extreme value. There is very little variation in the long-wavelength shape of cold dust-dominated SEDs in the library and photometric scatter leads to some sources that are not well constrained in terms of their values. However, LIR is only weakly dependent on in this regime and it remains robust despite the uncertainty in .
We have demonstrated in Figure 1 that galaxies without WISE 22 m detections are likely to have cold SED shapes with characteristic . To estimate LIR in this subset, we fit the SPIRE photometry to a fixed template with . The systematic uncertainty is calculated as the span in LIR of the best-fit SEDs with in the range , a factor of 0.25 dex.
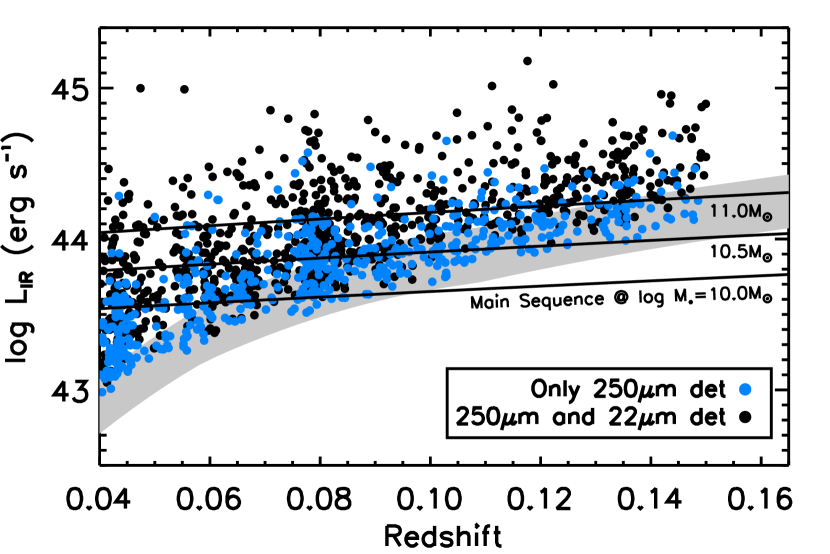
We plot our LIR estimates against redshift in Figure 3, distinguishing between galaxies detected at WISE 22 m (black points) and those with only FIR detections (blue points). The LIR are consistent with the range of limiting IR luminosities (grey band) calculated with the 250 m flux limit of mJy and SEDs spanning the width of the distribution in Figure 2. We also plot in the Figure a set of lines which mark the ridge-line value of the Main Sequence at three characteristic stellar masses following the parameterisation of Speagle et al. (2014). To , HerS can detect normal star-forming galaxies with masses lower than M⊙. Towards , HerS-detected galaxies are increasingly dominated by starbursts. For this reason that we restrict our working sample to redshifts below 0.15.
2.6 Galaxy classification
| Redshift bin | Dim | H II | Uncertain | Composite | AGN | Total |
|---|---|---|---|---|---|---|
| SDSS working sample | ||||||
| 697 | 955 | 302 | 173 | 153 | 2280 | |
| 434 | 273 | 210 | 70 | 52 | 1039 | |
| SDSS working sample - 250 m detected | ||||||
| 28 | 631 | 128 | 122 | 56 | 965 | |
| 15 | 213 | 95 | 44 | 17 | 384 | |
| SDSS working sample - 22 m and 250 m detected | ||||||
| 8 | 421 | 51 | 87 | 35 | 602 | |
| 2 | 144 | 35 | 35 | 12 | 228 | |
We classify galaxies in the SDSS sample using the popular emission-line ratio diagram of [O III]/H vs. [N II]/H (the BPT diagram; Baldwin, Phillips & Terlevich 1981; Veilleux & Osterbrock 1987). We follow the method outlined by Kewley et al. (2006); curves in the diagram are used to separate H II galaxies, AGN, and ‘Composite’ systems, which have line ratios intermediate to the first two classes. As a minimum requirement for a classification using the BPT diagram, we require an H measurement with a SNR, satisfied by 2188 objects in the working sample. Galaxies with weaker H are categorized as ‘Dim’. If all four lines of the BPT diagram are detected with SNR in the spectrum of a galaxy (35% of the working sample), the classification is made according to the galaxy’s line ratios with respect to the curves from Kewley et al. (2006). If any of the lines (other than H) are detected at a lower significance, a limiting value for the line is adopted, corresponding to , where is the uncertainty in the line measurement. The limit on a particular line is propagated into a limit on the corresponding line ratios that include that line, and a decision tree is used to identify if the limit on the ratio allows an unambiguous classification of the galaxy. For example, if H, H and [N II] are well-detected in a galaxy, but [O III] is weak, the limit leads to an upper limit on [O III]/H. If this limit lies below the curve separating H II galaxies from composite systems, the galaxy is unambiguously classified as an H II galaxy. If it lies above the curve, its classification is listed as ‘Uncertain’. A similar set of rules are applied to the other lines or combination of lines.
We use the term ‘AGN’ exclusively for those systems which show line ratios in their SDSS spectra characteristic of a hard ionising spectrum. Composite galaxies exhibit lower ionisation levels than AGN only because a majority contain an admixture of SF and AGN line emission within the SDSS fibre aperture. We use the broad term ‘active galaxies’ throughout this work to denote the combined population of AGN and Composites, which include all systems with detectable SMBH accretion. Those without clear signatures of high ionisation emission, H II, Dim and Uncertain galaxies, are lumped together under the category of ‘inactive galaxies’, though some may host obscured, diluted, or faint nuclear activity that is missed by emission line tracers (e.g., Trump et al. 2015).
The narrow-line active galaxies in our working sample do not include many luminous systems. In the assumption that the extinction-corrected [O III] luminosity only arises from ionisation by an accreting SMBH, the bolometric luminosities of the active nuclei are estimated, using a relationship from Trump et al. (2015), to be between erg s-1 to erg s-1, with a median value of erg s-1. At these luminosities, the MIR emission from hot dust in a putative torus would not even be detectable in the WISE 22 micron band for more than 90% of our active galaxies 333This is estimated using the L- relationship from Rosario et al. (2013a) and the mean AGN SED from Mor & Netzer (2012).. We can safely ignore any complications arising from AGN-heated dust in our SED fits.
There is some debate over whether the emission lines in low-ionisation AGN, so-called LINERs, may be primarily excited by sources unrelated to black hole accretion, such as shocks (Heckman 1980) or hot stars (Terlevich & Melnick 1985; Singh et al. 2013). We acknowledge that the AGN class may encompass a variety of physical processes. In the next paper in this series, which explores the relationships between star-formation and SMBH accretion, we examine the star-forming properties of LINERs in more detail.
Table 1 summarises the division of the SDSS working sample into the five classes considered in this work: Dim galaxies, H II galaxies, Uncertain classifications, composite galaxies and AGN. The sample is split into two redshift bins to minimise redshift-dependent effects and those due to large-scale clustering (Section 3.1).
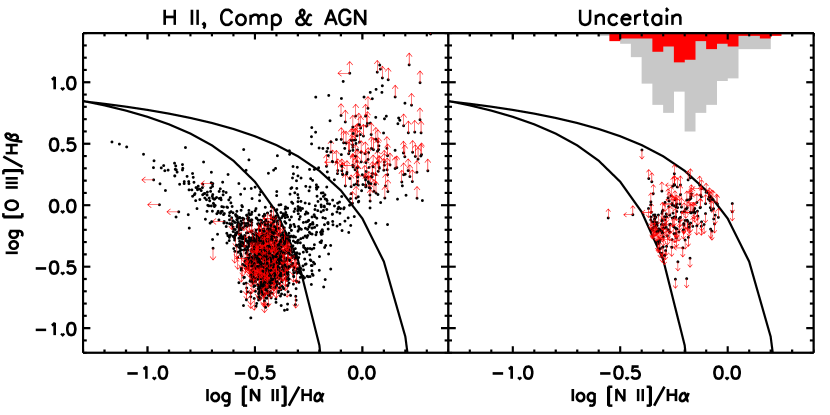
In Figure 4, we show a pair of BPT diagrams to illustrate the classification method, its results and some properties of the various populations. Unambiguous H II galaxies, Composites and AGN are shown in the left panel and Uncertain galaxies only on the right. Galaxies with a limit on one or both line ratios are indicated by red arrows with directions that show the nature of the limit. About 61% of AGN and 32% of H II galaxies have a limit in one or more BPT line ratio, but can be classified unambiguously. A requirement of high S/N detections on all four lines in the BPT diagram, frequently adopted in SDSS population studies, will miss substantial numbers of weak AGN and high metallicity H II galaxies, which we can recover by a simple method of folding in limits on the line ratios.
About 15% of galaxies are classified as Uncertain. Of these, 63% are undetected in both the [O III] and/or H lines, preventing any constraints along the ordinate of the BPT diagram. Their distribution in the [N II]/H line ratio is represented by the inverted histograms in the right panel of Figure 4, where the grey histogram shows the measured line ratio for galaxies with detected [N II] and the red histogram shows the distribution of upper limits on the line ratio for galaxies with SNR in [N II]. Most galaxies with such weak [O III] and H lines have high [N II]/H, implying high metallicities or levels of ionisation. The rest of the Uncertain class consists mainly of galaxies with limits in [O III] or H which place them in the Composite region of the BPT diagram. Taken together, Uncertain galaxies are mostly emission line-weak galaxies with a mix of star-formation and other ionisation sources contributing to their line spectra, and include many metal-rich galaxies with strong dust extinction, which preferentially extinguishes the bluer emission lines. When exploring the FIR properties of galaxies in the remainder of this paper, we treat Uncertain galaxies as a separate heterogeneous population and examine their properties in the context of the other four classes.
In our classification scheme, Dim galaxies are defined as those with a lack of detectable Balmer line emission. However, a small fraction (10%) of Dim galaxies have [O III] or [N II] measured with SNR. This implies the presence of a faint, high ionization emission line region in these systems. While we still include them in the Dim category, we consider their special nature in the discussion of FIR detection rates in Section 3.1.
3 Sample Properties

3.1 Redshifts and stellar mass distributions
In the lower panel of Figure 5, we plot the redshift distribution of the SDSS sample. Near-field large-scale structure over the HerS/Stripe82 field can be discerned, in particular the two sharp spikes at and . Beyond the distribution is smoother as the volume occupied by the field gets exponentially larger. The effects of the near-field substructure on the trends we study in this work through environmental covariances could be important. Therefore, as in Table 1 and when necessary, we check our results by splitting the working sample into two fiducial redshift bins: and .
The principal selection bias present in the sample relates to stellar mass (M⋆). It is evident from the upper panel of Figure 5 that the range of M⋆ spanned by galaxies in the working sample changes considerably over the redshift range of study due to the magnitude cut of the SDSS Main Galaxy sample. Consequently, the characteristic M⋆ of the sample increases by an order of magnitude from to . M⋆ is widely regarded as one of the prime determinants of galaxy properties, and the strong change in its distribution with redshift has to be taken into account when understanding trends from SDSS-selected galaxy populations.
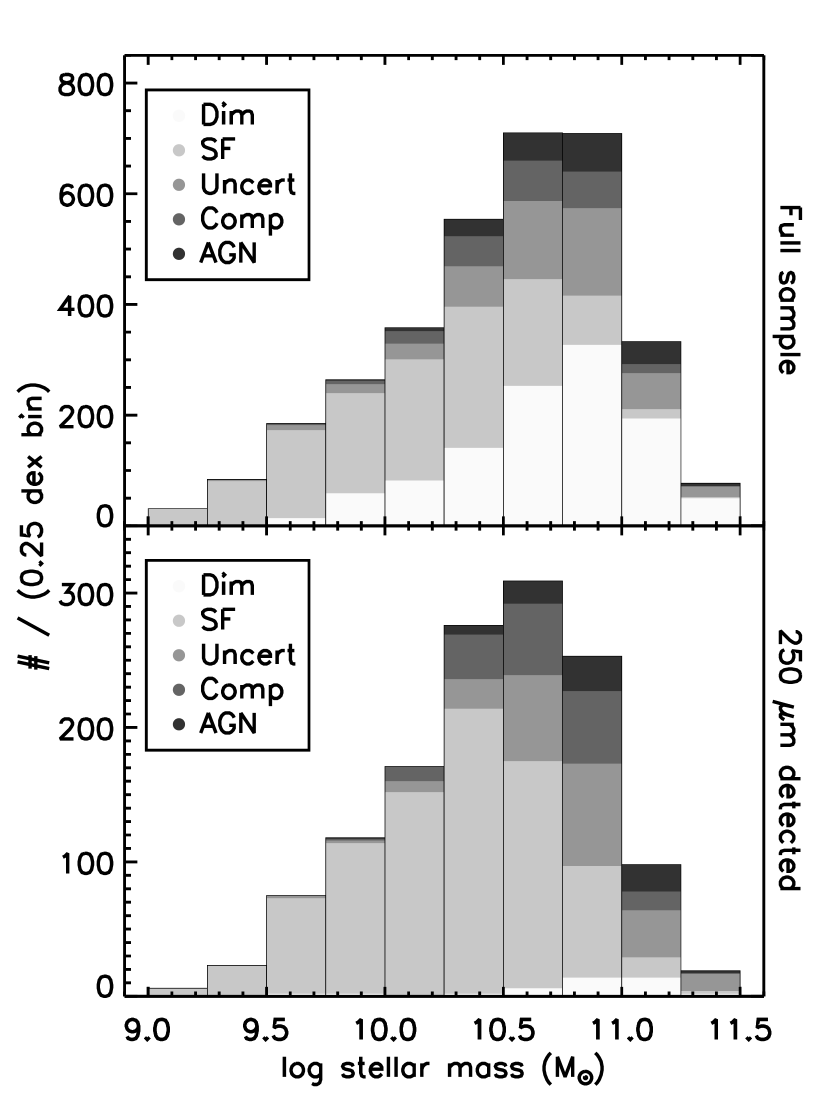
In the upper panel of Figure 6, we graphically present the break-up of the classes of galaxies in our working sample as a function of M⋆. H II galaxies tend to be of low to moderate masses, while Dim galaxies are among the most massive systems in the sample. AGN peak at M⋆ M⊙ and composite systems are found at slightly lower masses (M⋆ M⊙). Uncertain galaxies have a similar mass distribution as active galaxies; in terms of gross galaxy properties, they are a closer population to Composites and AGN than the general subset of H II galaxies.
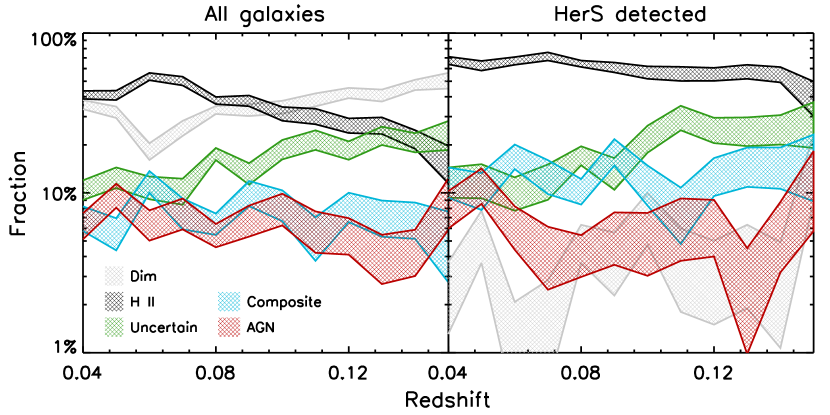
Further insight is available in the fractions of different classes of galaxies across redshift (Figure 7). In the full working sample (the left panel of the Figure), the predominant populations by number are H II galaxies and Dim galaxies, each accounting for 30-40% of the total. Though the majority at , the fraction of H II galaxies falls with redshift, while Dim galaxies and Uncertain galaxies increase. The latter class becomes as common as H II galaxies at . This apparent evolution is likely due to a combination of the emission line detection limit of the SDSS spectra and the redshift-dependent mass incompleteness of the Main Galaxy sample. Towards higher redshifts, an increasing fraction of galaxies have one or more undetected BPT lines, leading to an Uncertain classification, while more of the low mass H II systems are also excluded. In addition to the smooth decrease with redshift, the H II galaxy fraction shows a local peak at , likely due to the environmental effects of large-scale structure inhomogeneity.
AGN and Composites remain a fairly constant fraction of the population at several percent each across the redshift range. This is because active galaxies exhibit high M⋆ and do not suffer from strong mass incompleteness at any redshift considered here.
3.2 250 m detection rates
Applying a HerS detection criterion to the working sample results in a very different mix of galaxy types. In the lower panel of Figure 6, the break-up of the HerS-detected subset is shown as a function of stellar mass and the fractions of each class across redshift are plotted in the right panel of Figure 7. The most drastic consequence of applying a 250 m detection is the removal of almost all of the Dim galaxies. These drop from 34% of the full working sample to only 3% of the HerS detected subset. Even though ionised gas accounts for only a small fraction of the gas mass in galaxies, its presence is closely related to the radiation field that heats interstellar dust. Interestingly, of the few HerS-detected Dim galaxies, as many as half are also significantly detected in either [N II] or [O III], bolstering a link between the gaseous content of ionised emission line regions and heated dust. It is unclear whether the dust emission reflects low levels of residual star-formation or is heated by an interstellar radiation field arising from hot evolved stars. There is evidence from the SDSS that quiescent galaxies on the Red Sequence with LINER emission have younger stellar populations (Graves et al. 2007). Low levels of intermittent star-formation could be associated with the small gas reservoirs visible in some Dim galaxies through these emission line regions.
H II galaxies increase from 37% of the full sample to 62% of the HerS subset. Composites roughly double, while AGN and Uncertain galaxies remain mostly unchanged in their incidence. The fraction of H II galaxies also falls with redshift, though, due to the predominance of this class, the drop is not as pronounced as for the full working sample.
The very low HerS detection rates of the Dim galaxies and the complementary high occurrence of star-forming galaxies demonstrates that, at the sensitivity of the HerS survey, most of the FIR emission in inactive (or very weakly active) galaxies is produced by on-going star-formation.
| AGN | Mass weighted control | ||
|---|---|---|---|
| Pure AGN: | H II galaxies | ||
| Uncertain galaxies | |||
| Dim galaxies | |||
| All inactive | |||
| Composite: | H II galaxies | ||
| Uncertain galaxies | |||
| Dim galaxies | |||
| All inactive | |||
| All active: | H II galaxies | ||
| Uncertain galaxies | |||
| Dim galaxies | |||
| All inactive | |||
The lack of change in the pure AGN detection fraction between the full and FIR detected samples indicates that nuclear activity occurs both in star-forming and quiescent galaxies. The M⋆ distribution of AGN, peaks between those of H II galaxies and Dim galaxies, suggesting that their hosts are drawn from both these disparate populations. It is well established that the SFR and the fraction of quiescent galaxies in the local Universe is a strong function of stellar mass (Baldry et al. 2006; Salim et al. 2007). Therefore, for a better assessment of the relative number of star-forming and quiescent galaxies that contribute to the AGN population, we compare the 250 m detection fractions of AGN to the detection fractions of inactive galaxies after weighting the mass distribution of the inactive galaxies to match those of the AGN.
We only consider galaxies in the stellar mass range of M⊙ to M⊙ over which AGN are found in our working sample. The weighted detection fraction of inactive galaxies is calculated as follows:
| (2) |
where is the total number of inactive galaxies in the mass range, is the number of inactive galaxies detected at 250 m in the small bin in stellar mass , and
| (3) |
where and are the number of inactive galaxies and AGN from the working sample in stellar mass bin and is the total number of AGN in the mass range. We adopt a set of independent stellar mass bins, each 0.25 dex wide, contiguously spanning the stellar mass range. In Table 2, we summarise the detection fractions for pure AGN, composites and all active galaxies, and compare them to the fractions calculated for H II galaxies, Uncertain galaxies, Dim galaxies and all three populations of inactive galaxies combined.
Active galaxies have a significantly higher HerS detection fraction (53%) than the equally massive combined population of inactive galaxies (38%). Composites are detected in HerS at twice the rate of pure AGN, consistent with their nature as active galaxies with clear contributions to their emission line spectra from star-forming H II regions. However, even pure AGN are significantly more likely to be detected than inactive quiescent galaxies. Therefore, the lack of composite emission line signatures in an active galaxy does not mean that star-formation is absent in its host. In fact, the detection rate of pure AGN (36%) is identical to that of the combined inactive population with the same mass distribution (35%). This suggests that pure AGN are drawn from the massive galaxy population in proportion to the relative incidence of star-forming and quiescent inactive galaxies, while composite systems are strongly weighted to star-forming hosts.
4 Multi-wavelength calibrations of the SFR
In the assumption that all the IR luminosity in galaxies arises from the reprocessing of optical and UV light from continuously forming stellar populations, one may use the ratio of the IR and observed FUV luminosities to derive the extinction of the FUV light. This correction is weakly dependent on the age or the exact form of the star-formation history of the stellar populations, or on the extinction law of the dust.
Hao et al. (2011) calibrated the IR-based correction to the observed LFUV, which we have modified slightly due to the difference in the definition of the integration range for LIR between that work and ours (see Section 2.5 for details). From Equation 15 of Hao et al. (2011):
| (4) |
The scaling term is empirically determined from a local sample of normal star-forming galaxies. The intrinsic (i.e., extinction-corrected) FUV luminosity (L) can then be calculated as the product of and the observed LFUV.
Empirically, as demonstrated by Hao et al. (2011), normal star-forming galaxies display a tight relationship between L and the extinction-corrected H luminosity, with a scatter of dex. In fact, the IR-based correction yields a more accurate estimate of the extinction-corrected LFUV than the popular approach of using the UV slope itself.
In Figure 8, we plot the distribution of for the galaxies in the working sample that are detected both at 250 m and in the FUV band. They span the full range of shown by the galaxies in Hao et al. (2011) (between the dotted lines in the Figure). The characteristic value of from our sample is , implying that, on average, of the intrinsic FUV luminosity is absorbed. About 23% of FIR-detected sources do not have FUV detections. For these sources, the FUV flux limit at the threshold GALEX coverage adopted for this analysis (Section 2.4) corresponds to . For only % of the FIR-detected sample is the unabsorbed FUV light a substantial part (%) of their intrinsic FUV emission.
The simplest conclusion from the analysis of is that the escape fraction of FUV light is quite low among the HerS/SDSS galaxies. Of course, this conclusion is only valid if LIR is not strongly boosted by heating sources that are not related to star-formation, such as AGN or very old evolved stars. In Section 5.1, we test this assumption and find that most of the FIR can be attributed to star-formation in our galaxies. This is also consistent with elevated IR luminosities and detection rates among H II galaxies.
The SFR for galaxies detected jointly in the GALEX/MIS and HerS can be calculated from L using the calibration from Hao et al. (2011) or Kennicutt & Evans (2012), valid for a model stellar population with solar abundance which forms stars continuously for 100 Myr with a Chabrier (2003) IMF:
| (5) |
A crucial first check is to compare these multi-wavelength SFRs with those derived from the SDSS for the H II galaxy population. Their SDSS-based SFRs are mostly estimated from emission-line luminosities emitted by H II regions, widely considered the gold standard for prompt SFR tracers. In other classes of galaxies, the calibration is used, which can be quite uncertain. Therefore, we begin by ascertaining the accuracy of our multi-wavelength SFRs in H II galaxies, and apply them to other classes in following sections.

In the left panel of Figure 9, we plot the SFRs of H II galaxies from the SDSS against their SFRs estimated from multi-wavelength calibrations. The correspondence is excellent, with a uniform scatter about the 1:1 line and a standard deviation of 0.18 dex. This scatter is comparable to the uncertainties on the SDSS SFRs themselves.
Essentially all galaxies in the working sample have high values of , indicating that the bulk of the emission from young stars goes into the heating of dust. Therefore, we also consider the performance of a pure IR-based SFR calibration. Such a calibration has the advantage that it does not rely on the FUV, making it insensitive to contamination from non-stellar sources of UV light, in particular faint AGN which may be important in galaxies with accreting SMBHs.
In the limit that the FUV is completely absorbed by dust, Eqn. 4 & 5 can be combined to get:
| (6) |
The right panel of Figure 9 shows the SDSS SFRs of H II galaxies against their SFRs estimated purely from LIR. Not surprisingly, the correspondence is a bit worse, with a median offset of 0.08 dex (20%), though with only a slightly larger standard deviation of 0.2 dex. However, these differences are minor enough for our primary purpose of evaluating the SDSS-based SFRs of active galaxies. If we adopt a statistical correction of 0.08 dex to TIR-based SFRs from Equation 6 for the unabsorbed luminosity from star-formation, we can proceed to use SFRs derived purely from the TIR for HerS-detected galaxies to an accuracy of about a factor of 3. We estimate the error on the TIR-based SFRs as a quadrature sum of the errors on LIR and an additional constant uncertainty of 0.09 dex to account for the larger scatter of pure TIR SFRs with respect to SDSS SFRs among H II galaxies.
In Table 4, we compile a number of useful properties of all 3319 galaxies in our working sample, including estimates of LIR and pure TIR SFRs.
| SDSS OBJID | z | Class | M⋆ | SFR [SDSS]a | LIRb | c | SFR [TIR] |
| (log M⊙) | (log M⊙ yr-1) | (log erg s-1) | (log M⊙ yr-1) | ||||
| 588015509277573268 | 0.04494 | Dim | 10.29 | —– | – | – | |
| 588015507667419322 | 0.04456 | Dim | 9.88 | —– | – | – | |
| 588015507667419317 | 0.04608 | Dim | 10.17 | —– | – | – | |
| 587731511538876510 | 0.04068 | H II | 9.23 | 2.38 | -0.40 | ||
| 587731513148047431 | 0.04296 | Dim | 10.22 | —– | – | – | |
| 587731512069587131 | 0.05367 | H II | 10.74 | 2.38 | 0.35 | ||
| 587731512610324707 | 0.04521 | H II | 10.77 | 2.19 | 0.72 | ||
| 587731513142542498 | 0.04643 | AGN | 10.61 | 2.06 | 0.29 | ||
| 587731512608292991 | 0.05613 | H II | 11.13 | 2.75 | 0.33 | ||
| 587731512069455963 | 0.04473 | AGN | 10.79 | 2.62 | 0.03 | ||
| 587731512069587156 | 0.07735 | H II | 10.48 | 2.19 | 0.41 | ||
| 587731513144377525 | 0.08156 | Dim | 10.65 | —– | – | – | |
| 587731514222510237 | 0.04044 | H II | 10.05 | 2.12 | 0.31 | ||
| 587731514222248063 | 0.04162 | Dim | 9.84 | —– | – | – | |
| 587731514222182633 | 0.04237 | H II | 10.87 | 2.44 | 0.40 | ||
| a 16th percentile value median value 84th percentile value | |||||||
| b low best-fit high | |||||||
| c From Dale & Helou (2002). See Section 2.5 for details. | |||||||
4.1 FIR non-detections
Almost 48% of galaxies from the working sample that are detected in the GALEX/MIS in the FUV do not have a 250 m counterpart in HerS. It is important to understand the nature of these systems in the overall framework of multi-wavelength star-formation tracers, since this population will include galaxies with low values of which are not represented among the FIR-bright subsample detected in HerS. For example, the distribution of among the galaxies of the Herschel Reference Survey (HRS, Boselli et al. 2010) (shaded histogram in Figure 8) is shifted to a lower median value than either our sample or those from Hao et al. (2011). The HRS galaxies are primarily low mass systems in the very local Universe (15–25 Mpc away) and include a number of dwarf galaxies that are not found in the more distant SDSS/HerS sample. Despite this, the differences in the distributions in Figure 8 certainly indicate that galaxies with high FUV escape fractions do exist and should be found among the FIR-weak subset.
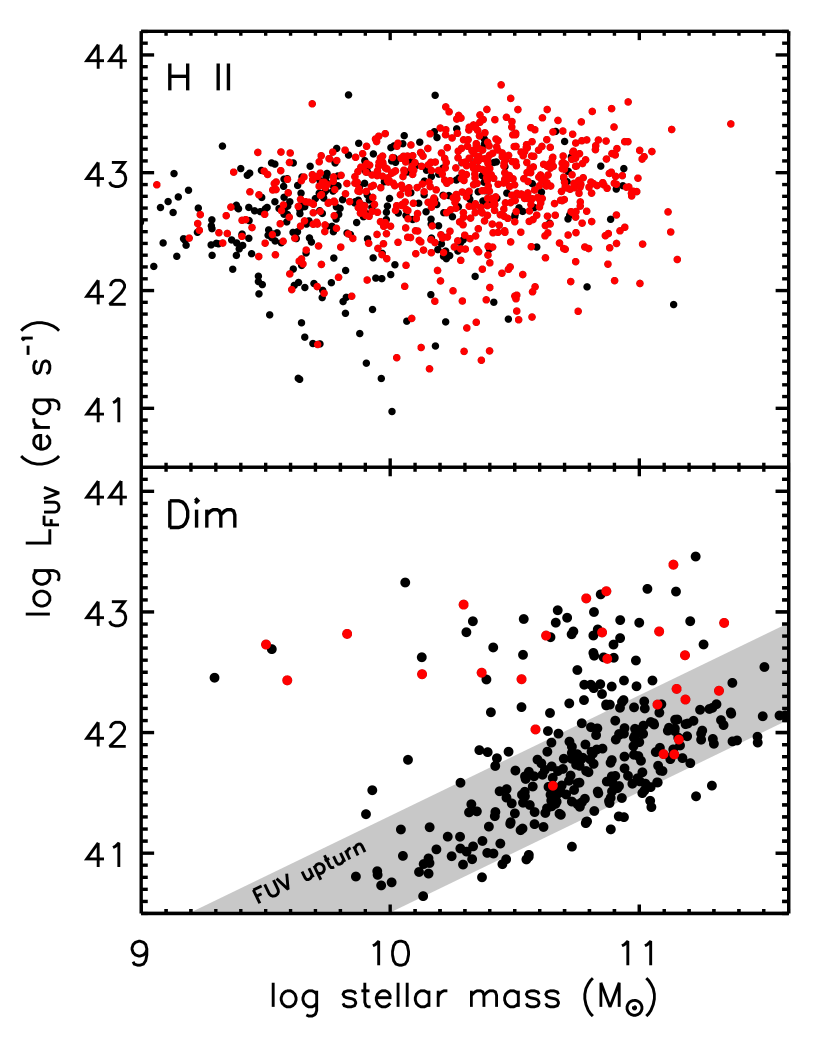
A particularly instructive diagram to help us understand the FIR undetected population is shown in Figure 10, in which LFUV is plotted against M⋆ separately for H II galaxies and Dim galaxies from the working sample. FIR-detected sources are marked with red symbols.
Among H II galaxies, the fraction with both GALEX and HerS counterparts is high (%) – the majority of these galaxies have . Regardless of their FIR properties, H II galaxies display only a weak correlation between LFUV and M⋆ with considerable scatter.
A surprisingly large fraction of Dim galaxies have FUV detections (%), though, in contrast to H II galaxies, very few of these (%) also have FIR counterparts. Since Dim galaxies comprise the largest subgroup from the working sample, the majority of FUV-detected galaxies that are not detected in HerS are in fact in the Dim category. Unlike the H II galaxy population, the bulk of Dim galaxies (75%) show a fairly narrow linear correlation between LFUV and M⋆, though they are typically an order of magnitude less UV luminous. The small number of Dim galaxies that are bright in the FUV lie in the same region of the diagram and show the same trends as H II galaxies. These may be misclassifications due to dust obscuration or other effects that affect the visibility of the H line.
The low FIR detection rate and weakness of the FUV emission in Dim galaxies suggests that the primary FUV-emitting sources in these systems are of a different nature from those in H II galaxies. The best explanation is the well-known ‘FUV upturn’ of early-type galaxies, believed to be produced primarily by extreme horizontal-branch stars (O’Connell 1999, and references therein). In the lower panel of Figure 10, we show with a shaded band the expected location of galaxies in the diagram due to the FUV upturn. This was calculated using the empirical range of colours of elliptical galaxies (O’Connell 1999, mag,) combined with a fixed -band stellar mass-to-light ratio of a 10 Gyr simple stellar population synthesis model from Han, Podsiadlowski & Lynas-Gray (2007). Clearly, the trend seen among most of the Dim galaxies is entirely consistent with the FUV upturn phenomenon. The evolved stars that drive the upturn are not related to star-formation and are not closely associated with ISM dust, which explains the low FIR detection rate of FUV-detected Dim galaxies.
Taking H II galaxies as the representative population of star-forming systems, our analysis of the distribution leads us to conclude that, in the range of masses and SFRs shown by our sample, more than 2/3 of galaxies have low FUV escape fractions. The IR, by and large, is a more complete tracer of the star-forming luminosity of our galaxies.
5 SFR comparisons
The FIR photometry from HerS allows us to probe down to equivalent IR-derived SFRs M⊙/yr. This sensitivity and the large sample size available from the HerS area is the main advance in this work. In the remaining part of the paper, we will use these SFRs to examine optically-derived SFRs from the SDSS/MPA-JHU, especially among classes such as active galaxies for which well-calibrated emission line indicators of SFR cannot be easily used. The assessment of SFR calibrations sets the stage for our second paper, which concentrates on the star-forming properties of the active galaxies.
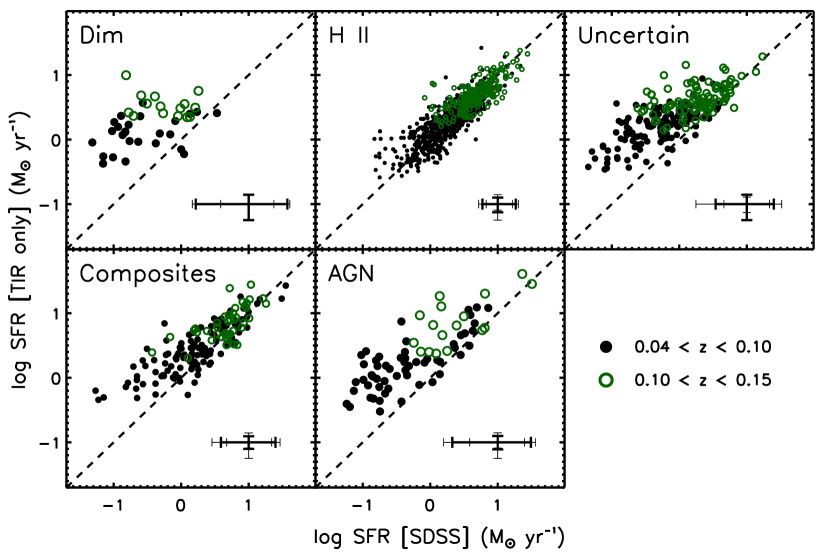
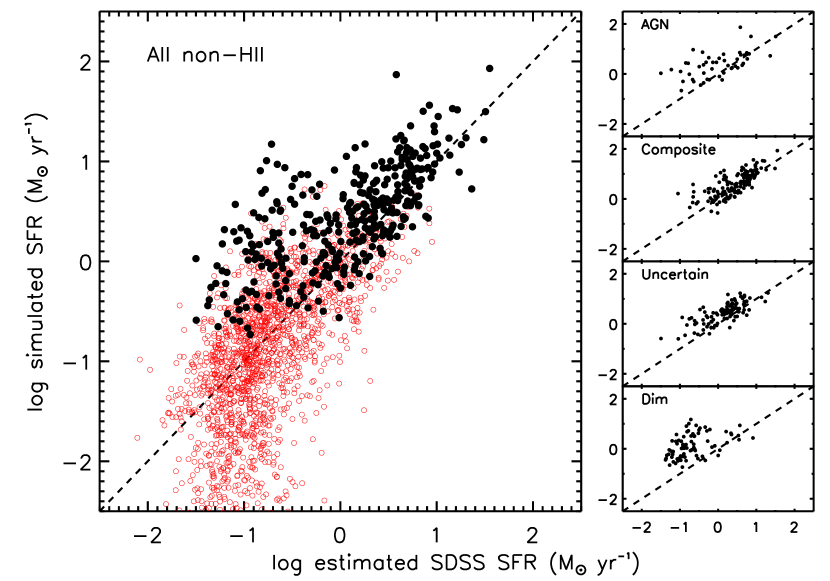
In Figure 11, we plot the SDSS SFR against TIR-based SFRs (using Equation 6 and a 0.08 dex correction) for galaxies from the working sample. For clarity, galaxies are split by classification, and objects in the two fiducial redshift bins are shown with different symbols and colors.
We also show the typical errors on the SFRs for the different classes of galaxies. The errors on the optical SFRs are directly from the MPA-JHU catalog. For H II galaxies, they reflect the uncertainties on H fluxes, extinction corrections, and corrections to SFRs for the parts of galaxies beyond the SDSS fiber aperture. For all other categories of galaxies, the errors combine uncertainties on outer SFRs, following the same systematics as H II galaxies, and the uncertainties of the -based calibration of SFRs within the fibre. Since this calibration has considerable real scatter (Brinchmann et al. 2004), the SFR errors for the active, Uncertain, and Dim galaxies can be considerably larger than those for H II galaxies, even at the same median SFR. These errors also tend to be asymmetric, with a larger spread to low SFRs, especially among Dim galaxies.
H II galaxies, which account for most of the HerS-detected galaxies (63%), are shown in the middle panel of the top row of Figure 11 (equivalent to the right panel of Figure 9. The close agreement between the two estimates of the SFR is shared by galaxies in both the fiducial redshift bins. Error-weighted orthogonal bisector regression tests show that there is a small deviation from a slope of unity, but this is driven primarily by Eddington bias about the HerS flux limit (see Section 5.2). The tightness of the correlation indicates that most of the TIR luminosity of the H II galaxy population arises in mildly-obscured star-formation which is also traced by emission lines.
In contrast to H II galaxies, all the other classes show a different behaviour in Figure 11. In general, the IR-derived SFRs for active galaxies (AGN & composites) and Uncertain galaxies are higher than their median optical SFRs. The difference is most pronounced for galaxies with low optical SFRs, where the offset is dex. However, even those with higher overall SFRs exhibit a small net offset of dex which is not seen among H II galaxies. Composite galaxies show smaller offsets, pure AGN and Uncertain galaxies show larger offsets, while the small number of Dim galaxies detected at 250 m have the most substantial offsets. In addition, all these classes also exhibit a significantly wider scatter about a median relationship than H II galaxies, pointing to a weaker correspondence between optically-derived and IR-derived SFRs.
The case for Dim galaxies is particularly interesting, since our analysis of their GALEX properties suggests that a small fraction (%) may actually be star-forming galaxies, given their large FUV luminosities. Among this subset of Dim galaxies, the 250 m detection fraction (21%) is much higher than the typical fraction for the Dim class, which further supports our claim that BPT-based classification in the SDSS misses a non-negligible population of relatively massive, star-forming galaxies. These misclassified Dim galaxies make up a major proportion of the points in the top left panel of Figure 11.
In the remaining part of this section, we investigate the nature of the offsets seen among some of the HerS-detected SDSS galaxies. We use the symbol to refer to these offsets in the following discussion.
5.1 The origin of the SFR offsets


The offsets between IR-based and optical SFRs could arise because the TIR luminosities of galaxies in our working sample have been overestimated, or because their FIR emission contains a contribution from dust that is not heated by star-forming regions. Alternatively, their SDSS SFRs could be systematically underestimated. Considering the large uncertainties of the SDSS SFRs for all classes except H II galaxies (Figure 11), the latter explanation seems most reasonable. Nevertheless, we devise some simple tests to check the other alternatives as well. These tests look for correlations between and other galaxy properties.
Detailed studies of dust emission in local galaxies have shown that a portion of the long-wavelength FIR luminosity arises in distributed cold dust which is heated by the diffuse interstellar radiation field (Lonsdale Persson & Helou 1987; Sauvage & Thuan 1992; Bendo et al. 2012). In quiescent galaxies, the interstellar radiation field may arise mostly from the light of evolved stars which are unrelated to star-formation (e.g., Groves et al. 2012). One may postulate that this ‘cirrus’ component of the FIR luminosity could be dominant in massive galaxies, since most of the stellar mass in such systems is locked in old stellar populations. If cirrus emission unrelated to current star-formation is the source of excess LIR, we expect that correlates with the total stellar mass of galaxies (Smith et al. 2012; Boselli et al. 2012).
We consider this in the Figure 12, where we have plotted the as a function of M⋆ for the HerS-detected galaxies, separating them into three broad categories: H II galaxies, AGN and composites, and the remaining Uncertain and Dim galaxies. H II galaxies, which do not typically show large , display no trend over 1.5 dex in M⋆. The other classes are more massive and show larger offsets. However, there is no significant correlation between and M⋆ for all non-H II galaxies. Given that substantial offsets are found over almost an order of magnitude in M⋆, it is unlikely that the dust-reprocessed light of evolved stars is a leading cause of the excess LIR in massive galaxies.
Another explanation is the heating of dust by alternate sources of UV and optical continuum, such as from an AGN or shocks. These sources also contribute disproportionately to the emission of high ionisation lines such as [O III], and we may expect, in such a situation, to find a trend between the extinction-corrected [O III] luminosity of galaxies and . As one may gather from Figure 13, no good correlation is evident between L and the offset, either among active galaxies or among the few Uncertain and Dim galaxies with detectable [O III]. H II galaxies, as expected, scatter uniformly around a zero offset.
Based on the absence of any significant trends, we conclude that excess cirrus emission or heating sources beyond star-formation are not responsible for the bulk of the observed offsets in SFR that we find in massive non-H II galaxies detected in HerS.
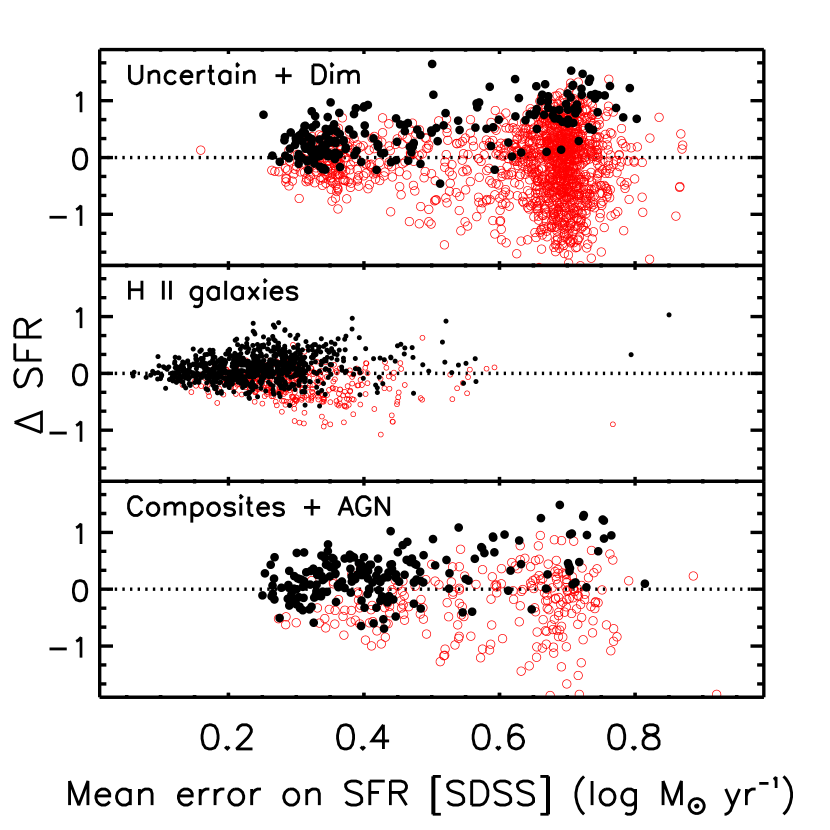
Having found no systematic issues with the IR luminosities, we now consider the SDSS SFRs as a possible source of the offsets seen in Figure 11. Surprisingly, we find that the strongest dependence of is not with any physical property of these galaxies, but with the estimated uncertainty of the SDSS SFRs. We demonstrate this in Figure 14. The error on the SDSS SFR for a galaxy is taken to be half the logarithmic difference (or the logarithm of the ratio) between the 84th and 16th percentile of the SFR likelihood distribution for that galaxy from the MPA-JHU catalogs. This quantity is equivalent to a 1 uncertainty for the special case of a normal likelihood distribution. Both active galaxies and inactive non-H II galaxies (Uncertain and Dim) display a strong correlation between and the error on the SDSS SFR. This correlation is not evident among H II galaxies, which tend to have smaller SFR uncertainties. Almost all galaxies with large also have very uncertain optically-derived SFRs. Conversely, galaxies with accurate optical SFRs show small , regardless of classification.
This behaviour can be understood as the consequence of standard Eddington bias. If a galaxy has a very uncertain SFR measurement, the true SFR can differ from the estimated SFR by a considerable amount. If this true SFR is higher than the estimated SFR and places the galaxy above the HerS detection limit, it will appear in Figure 14 with a large positive . On the other hand, if the true SFR is close to or below the estimated SFR, the galaxy would likely not be detected in the FIR and therefore not appear in the Figure. The increasing value of the offset with the SFR error is due to the fact that errors on the SFR are strongly anti-correlated with the magnitude of the optical SFR.
In the next subsection, we test this explanation by simulating Eddington bias in the SDSS galaxy population taking into account the redshift-dependent detection limits of the SDSS and HerS surveys.

5.2 The effects of SFR calibration uncertainties
The degree and asymmetry of the uncertainties on the optical SFRs, combined with the standard redshift-dependent luminosity and volume biases found in the flux-limited SDSS galaxy population, could potentially cause the large offsets between the observed and expected LIR seen in non-H II HerS-detected galaxies. Objects with the largest asymmetric uncertainties are those with the lowest SFRs. These are only detectable in HerS at lower redshifts. When combined with Eddington bias about the FIR flux limit this results in a one-sided scatter about the 1:1 line in Figure 11. At higher redshifts, Malmquist bias restricts us to the subsample with high SFRs, which exhibit more symmetric uncertainties and scatter. To test this, and to examine the accuracy of the SDSS SFR calibrations, we performed a simple simulation of the effects of SFR calibration uncertainties on the correspondence of optical and IR-based SFRs in HerS-detected galaxies.
We randomly varied the SFR of each galaxy in our working sample with a probability distribution following the calibrated uncertainty of the SFR from the MPA-JHU database, accounting for the asymmetry of the distribution. This resampled SFR, which we denote as , may be thought of as a ‘true’ SFR, which differs from the median SDSS estimate of the SFR because of its systematic uncertainty. was translated to a TIR luminosity () following Eqn. 6. For each galaxy, a limiting detectable TIR luminosity L was also estimated, as the luminosity of a source at the redshift of the galaxy with a randomly chosen SED shape following a probability distribution mirroring the measured distribution from Figure 2 and with a 250 m flux at the HerS detection limit of 30 mJy. This takes into account the scatter in SED shapes shown by normal star-forming galaxies. If L, the galaxy was flagged as detected in the simulation; if not, it was flagged as undetected. One hundred independent iterations of the simulation were performed.
If the likelihood distributions of the MPA-JHU SFR estimates are accurate, and if the majority of the TIR luminosity in HerS-detected galaxies is related to on-going star-formation, then we should expect the galaxies with detectable in the simulation to show the same distribution of as HerS-detected galaxies show in Figure 11. Additionally, the 250 m detection fraction of galaxies in the simulation should compare favourably with those empirically measured from HerS.
In the large left panel of Figure 15, we plot against the SDSS median SFRs of all non-H II galaxies from a single representative iteration of the simulation. Since we are interested here primarily in the effects of SFR calibration uncertainties in systems other than H II galaxies, we only show these populations in this Figure. With their accurately calibrated optical SFRs, H II galaxies show, as expected, a close correspondence between simulated and estimated SFRs (see middle panel of Figure 16, so we exclude them from Figure 15 for the sake of clarity.
From Figure 15, it is clear that the simulated detections (black points) are offset from the 1:1 line, and that this offset depends on the SFR of the galaxy. When combined with the non-detections (red points), the overall population shows a more symmetric scatter about the line of equality, though a small distinct offset is seen throughout. The larger offsets among the detections at lower SDSS SFR is because of the HerS flux limit, as discussed above. In addition, the spectroscopic flux limit of the SDSS Main Galaxy sample places a rough lower limit on the SFR of galaxies in the working sample of M⊙/yr. This limit results in the apparent vertical edge feature in the simulation at that value along the X-axis.
In the right panels of Figure 15, we split the population by their spectral classifications and only show the simulated detections. These plots compare favourably with the corresponding panels in Figure 11. Another representation of the behaviour of the different classes is shown Figure 16, in which the simulated from one of the iterations of the simulation is plotted against the optical SFR uncertainty. This Figure mirrors the empirical version from Figure 14, except that it also shows those galaxies with simulated LIR that would not be detectable in HerS. With increasing SFR error, galaxies display a larger spread in , producing the fan-shaped pattern that scatters about the zero offset line. Galaxies with detectable , shown as black solid points, tend to have positive and occupy the upper envelope of the pattern, leading to the apparent trends seen among the actual non-H II galaxy population (Figure 14).
Because of their accurate SFRs, calibrated mostly from emission-line luminosities, H II galaxies only show a mild scatter. There is a small tail of HerS-detected H II galaxies with low SFRs and modest SFR errors, and the action of Eddington bias on this subset can explain the mild deviations from the 1:1 line seen among the H II galaxy population in Figure 11.
| Class | |||
|---|---|---|---|
| H II | Observed | ||
| Simulated | |||
| Dim | Observed | ||
| Simulated | |||
| Uncertain | Observed | ||
| Simulated | |||
| Composite | Observed | ||
| Simulated | |||
| AGN | Observed | ||
| Simulated |
In Table 3, we list the 250 m HerS detection fraction of galaxies separated into the five categories and two redshift bins, both from our simulation and empirically from HerS. The uncertainties on the simulated fractions are determined from an analysis of all 100 iterations of the simulation. The observed detection fractions of H II and Dim galaxies are reproduced by the simulation to within a few percentage points. Among active and Uncertain galaxies, the simulated detection fractions are generally a bit lower than the observed ones, particularly in the lower redshift bin, suggesting that the uncertainties on the optical SFRs for these classes are underestimated. Alternatively, optical tracers may miss a proportion of heavily obscured SF in these types of galaxies. We will address this topic in more detail in a forthcoming paper on the molecular gas content of FIR-detected active galaxies in HerS. The broad consistency between the simulated and observed HerS detection fractions suggests that the SDSS/MPA-JHU calibrations of SFR that are widely used in there literature are accurate within their substantial uncertainties.
6 Discussion
6.1 Infrared selection of star-forming galaxies
With the depth and areal coverage of the HerS SPIRE photometry, we are able to detect cold dust emission in the FIR in % of galaxies at from the SDSS Main Galaxy sample in the HerS region. In contrast, only about 20% are detected in the WISE 22 m band () 444For the SED fits, we apply a lower threshold for detection in the WISE W4 band. This is suitable for photometric modeling since the primary selection is a significant detection in the SPIRE 250 m band. In this discussion, we are concerned with an assessment of selection strategy.. In addition, 23% of galaxies are only detected in the FIR with no significant MIR detection, while only 2% are pure MIR sources. As we demonstrate in Section 2.3 and Figure 1, there is a population of star-forming galaxies with SEDs dominated by cool dust which have relatively weak MIR emission. These galaxies are preferentially lost from WISE MIR-selected samples, but are recovered by Herschel FIR selection. Therefore, MIR-selected studies of star-formation may be systematically biased towards galaxies with warm dust SEDs. FIR-selected samples are more representative of the full population, by virtue of selection in a wavelength regime where star-formation heated dust emits most of its radiation.
6.2 Towards a complete view of star-forming galaxies
An approach frequently adopted in comparative studies of galaxies in the SDSS and other spectroscopic surveys is the use of the BPT diagram to differentiate between galaxies which are star-forming from other populations that exhibit emission lines, such as active galaxies. However, one or more of the four main BPT emission lines may be too faint to detect due to strong dust extinction, particularly among massive and metal-rich galaxies. Such galaxies have uncertain BPT classifications and are frequently overlooked or neglected in many studies. These Uncertain galaxies account for % by number and for % of the integrated SFR of massive galaxies ( M⊙) in the SDSS. About 40% are detected in HerS, indicating that they harbour enough star-formation to place them on or near the Main Sequence of star-forming galaxies. A full treatment of the star-forming properties of local massive galaxies should take this population into account. The calorimetric nature of the FIR as a measure of the SFR will allow us to finally do so over the substantial areas of sky covered by Herschel surveys. In a companion paper, we develop a full context for the frequently-overlooked population of Uncertain galaxies and show that they show many parallels to the host galaxies of AGN.
6.3 The reliability of SFR estimates from the SDSS
H II galaxies show a close correspondence between optical- and IR-derived SFRs (or multiwavelength SFRs), which argues that most of the cold dust emission in these systems is heated by SF. All other classes of galaxies, if detected in the FIR, exhibit higher TIR luminosities than expected from extrapolations based on their SDSS SFRs. In these latter categories, SDSS SFRs are evaluated using the optical calibration. Our analysis of the uncertainties of their optical SFRs strongly suggests that most of the differences are driven by systematics related to these calibrations, in combination with selection effects inherent to the SDSS and the HerS survey (Section 4.2). In other words, the apparent enhancements in LIR are, for the most part, not due to a dominant contribution from obscured SF, AGN-heated dust, or distributed cirrus emission in these galaxies.
The tightness of the relationship between optical SFRs, largely based on prompt emission line-based tracers, and IR SFRs, which trace dust emission, is quite remarkable. Resolved studies of the dust emission in galaxies (e.g., Bendo et al. 2012) have shown that the long-wavelength FIR is frequently more extended than the short-wavelength emission and does not correlate as well with star-forming regions. This has led to the suggestion that a substantial component of the cold dust luminosity is associated with a diffuse interstellar radiation field that could come from evolved stars. Even if the contribution from an old stellar population was not dominant, the FIR is not a prompt tracer of star-formation since dust can be heated by stars that are older than a few 100 Myrs (Kennicutt et al. 2009; Hao et al. 2011). Despite these considerations, the narrowness of the optical and IR SFR relationship that, among normal star-forming galaxies, the luminosity of cold dust emission is closely tied to the current level of star-formation. We consider a few explanations that may all play a role. a) The interstellar radiation field in galaxies may be largely produced by light leaking out from star-forming regions, in which case the diffuse cirrus emission will also reflect their average SFR. b) The typical star-formation history of galaxies may be constant for several 100s of Myr. c) The dust emission tracks the mass of dust, which is proportional to the total molecular gas mass in galaxies, and, through the galaxy integrated Kennicutt-Schmitt law, to the total SFR of galaxies (Kennicutt 1998). The last explanation would require a fairly fixed gas-to-dust ratio in galaxies to explain our observations, which is at odds with the typical scatter of dex found even at a fixed galaxy metallicity (Rémy-Ruyer et al. 2014). Regardless of the reason, our study indicates that, among massive galaxies (M⋆ M⊙), the TIR luminosity is a reliable measure of the SFR and should be preferred to methods based on age-dependent indicators such as .
Large area Herschel surveys, such as HerS, can provide accurate FIR-based SFRs for many thousands of galaxies in the nearby Universe. However, the confusion limit of Herschel maps will prevent direct FIR detections for galaxies fainter than a few 10s of mJy at 250 m. The Main Sequence at M⋆ M⊙ is detectable only out to . Across ‘local’ redshifts, Herschel-detected galaxies become increasingly dominated by the rarer star-bursting systems that lie well above the Main Sequence. Therefore, Herschel surveys do not provide a full census of SFR, even among local massive galaxies. At minimum, the known mass incompleteness of the SDSS and the redshift-dependent sampling of the Main Sequence must be taken into account for a consistent treatment of SF galaxies based on Herschel samples. As a trivial example, in a monolithic sample consisting of all star-forming galaxies from to with Herschel detections, star-bursts will be heavily over-represented compared to the true galaxy population.
6.4 The star-forming properties of active galaxies
As a population, active galaxies are detected at a higher rate in HerS than equally massive inactive galaxies (Section 3.3). Broadly, nuclear activity is preferentially found in star-forming galaxies, consistent with results for active galaxies selected by X-ray selection at higher redshifts (Silverman et al. 2009; Rosario et al. 2013b). While the hosts of nuclear activity are drawn from both the star-forming and quiescent populations, as well as quenching systems transitioning between them, accretion of cold gas on to SMBHs is also linked to the same reservoir of gas that fuels star-formation (e.g. Kauffmann et al. 2007; Rosario et al. 2013b; Vito et al. 2014). This is likely the primary link which connects star-formation and nuclear activity, especially among the low luminosity active galaxies in our sample. Recently, Trump et al. (2015) show that as many as 30% of active galaxies may be missed due to dilution of weak AGN lines by H II regions in the SDSS spectroscopic fibre aperture, implying that the co-eval connection between active star-formation and AGN may be even more pronounced that we find in this work.
Considering the two classes of active galaxies separately, the ‘pure’ AGN are detected in HerS at a rate that is identical to the general population of equally massive inactive galaxies (%), while the rate for composites is considerably higher (%). This is consistent with the common interpretation of composites as galaxies hosting AGN as well as concurrent star-formation. Table 1 shows that the HerS detection rate of composites is substantially lower than equally massive H II galaxies, indicating that composites are not simply H II galaxies with additional nuclear activity but probably include a number of galaxies with lower SFRs than the typical H II galaxy population. We examine the relative star-forming properties of H II galaxies, composites and AGN in the next paper in this series.
7 Conclusions
We have undertaken a critical comparison of infrared and optical constraints of the SFR of galaxies using a set of galaxies from the SDSS Main Galaxy sample at covered by the Herschel Stripe82 survey. Our conclusions are listed below:
-
1.
The FIR is a reliable measure of the SFR in normal star-forming galaxies (on the Main Sequence). SFRs derived from the infrared compare well with those from emission line tracers such as H. The systematic uncertainties on IR-derived SFRs are significantly lower than those from colour or spectral index–based methods, making them particularly valuable for active galaxies or dusty galaxies. Surveys that image the sky to the Herschel/SPIRE confusion limit are capable of detecting galaxies on the massive end of the Main Sequence out to z=0.15.
-
2.
The selection of star-forming galaxies based only on the long-wavelength MIR WISE bands is biased towards systems with warm dust temperatures, and will miss a population of faint galaxies dominated by cold dust SEDs. Herschel surveys can recover this population and offers a selection method that is relatively unbiased to dust temperature variation.
-
3.
Galaxies with one or more undetected BPT emission lines cannot be classified using the standard BPT diagram. These galaxies generally exhibit high masses and modest FIR detection rates. Their properties overlap considerably with those of active galaxies, and the populations may be related. Such Uncertain galaxies are frequently ignored or underrepresented in studies that rely purely on emission-line detected samples on the BPT diagram. We assert that a more complete picture of star-forming and active galaxies in the local Universe requires that these systems be fully considered in future studies.
8 Acknowledgements
We thank the anonymous referee for a rigorous and constructive review which has substantially improved the quality of this work. JRT acknowledges support from NASA through Hubble Fellowship grant #51330 awarded by the Space Telescope Science Institute, which is operated by the Association of Universities for Research in Astronomy, Inc., for NASA under contract NAS 5-26555. Some of the data presented in this paper were obtained from the Mikulski Archive for Space Telescopes (MAST). Support for MAST for non-HST data is provided by the NASA Office of Space Science via grant NNX09AF08G and by other grants and contracts. This research has made use of data from the HRS project, a Herschel Key Programme utilising Guaranteed Time from the SPIRE instrument team, ESAC scientists and a mission scientist. The HRS data was accessed through the Herschel Database in Marseille (HeDaM - http://hedam.lam.fr) operated by CeSAM and hosted by the Laboratoire d’Astrophysique de Marseille.
References
- Abazajian et al. (2009) Abazajian K. N. et al., 2009, ApJS, 182, 543
- Baldry et al. (2006) Baldry I. K., Balogh M. L., Bower R. G., Glazebrook K., Nichol R. C., Bamford S. P., Budavari T., 2006, MNRAS, 373, 469
- Baldwin, Phillips & Terlevich (1981) Baldwin J. A., Phillips M. M., Terlevich R., 1981, PASP, 93, 5
- Bendo et al. (2012) Bendo G. J. et al., 2012, MNRAS, 419, 1833
- Boselli et al. (2012) Boselli A. et al., 2012, A&A, 540, A54
- Boselli et al. (2010) Boselli A. et al., 2010, PASP, 122, 261
- Brinchmann et al. (2004) Brinchmann J., Charlot S., White S. D. M., Tremonti C., Kauffmann G., Heckman T., Brinkmann J., 2004, MNRAS, 351, 1151
- Chabrier (2003) Chabrier G., 2003, PASP, 115, 763
- Ciesla et al. (2014) Ciesla L. et al., 2014, A&A, 565, A128
- Ciesla et al. (2012) Ciesla L. et al., 2012, A&A, 543, A161
- Ciesla et al. (2015) Ciesla L. et al., 2015, A&A, 576, A10
- Dale & Helou (2002) Dale D. A., Helou G., 2002, ApJ, 576, 159
- Dale et al. (2001) Dale D. A., Helou G., Contursi A., Silbermann N. A., Kolhatkar S., 2001, ApJ, 549, 215
- Diolaiti et al. (2000) Diolaiti E., Bendinelli O., Bonaccini D., Close L. M., Currie D. G., Parmeggiani G., 2000, in Society of Photo-Optical Instrumentation Engineers (SPIE) Conference Series, Vol. 4007, Adaptive Optical Systems Technology, Wizinowich P. L., ed., pp. 879–888
- Domínguez Sánchez et al. (2014) Domínguez Sánchez H. et al., 2014, MNRAS, 441, 2
- Draine & Li (2007) Draine B. T., Li A., 2007, ApJ, 657, 810
- Eales et al. (2010) Eales S. et al., 2010, PASP, 122, 499
- Elbaz et al. (2007) Elbaz D. et al., 2007, A&A, 468, 33
- Graves et al. (2007) Graves G. J., Faber S. M., Schiavon R. P., Yan R., 2007, ApJ, 671, 243
- Griffin et al. (2010) Griffin M. J. et al., 2010, A&A, 518, L3
- Groves et al. (2012) Groves B. et al., 2012, MNRAS, 426, 892
- Han, Podsiadlowski & Lynas-Gray (2007) Han Z., Podsiadlowski P., Lynas-Gray A. E., 2007, MNRAS, 380, 1098
- Hao et al. (2011) Hao C.-N., Kennicutt R. C., Johnson B. D., Calzetti D., Dale D. A., Moustakas J., 2011, ApJ, 741, 124
- Heckman (1980) Heckman T. M., 1980, A&A, 87, 152
- Kauffmann et al. (2007) Kauffmann G. et al., 2007, ApJS, 173, 357
- Kauffmann et al. (2003) Kauffmann G. et al., 2003, MNRAS, 341, 54
- Kennicutt et al. (2011) Kennicutt R. C. et al., 2011, PASP, 123, 1347
- Kennicutt & Evans (2012) Kennicutt R. C., Evans N. J., 2012, ARA&A, 50, 531
- Kennicutt (1998) Kennicutt, Jr. R. C., 1998, ARA&A, 36, 189
- Kennicutt et al. (2009) Kennicutt, Jr. R. C. et al., 2009, ApJ, 703, 1672
- Kewley et al. (2006) Kewley L. J., Groves B., Kauffmann G., Heckman T., 2006, MNRAS, 372, 961
- Lam et al. (2013) Lam M. I., Wu H., Zhu Y.-N., Zhou Z.-M., 2013, Research in Astronomy and Astrophysics, 13, 179
- Lee, Hwang & Ko (2013) Lee J. C., Hwang H. S., Ko J., 2013, ApJ, 774, 62
- Lonsdale Persson & Helou (1987) Lonsdale Persson C. J., Helou G., 1987, ApJ, 314, 513
- Lu et al. (2003) Lu N. et al., 2003, ApJ, 588, 199
- Lutz (2014) Lutz D., 2014, ARA&A, 52, 373
- Magnelli et al. (2014) Magnelli B. et al., 2014, A&A, 561, A86
- Mor & Netzer (2012) Mor R., Netzer H., 2012, MNRAS, 420, 526
- Mullaney et al. (2011) Mullaney J. R., Alexander D. M., Goulding A. D., Hickox R. C., 2011, MNRAS, 414, 1082
- Netzer et al. (2007) Netzer H. et al., 2007, ApJ, 666, 806
- Noeske et al. (2007) Noeske K. G. et al., 2007, ApJ, 660, L43
- O’Connell (1999) O’Connell R. W., 1999, ARA&A, 37, 603
- Pilbratt et al. (2010) Pilbratt G. L. et al., 2010, A&A, 518, L1
- Rémy-Ruyer et al. (2014) Rémy-Ruyer A. et al., 2014, A&A, 563, A31
- Rosario et al. (2013a) Rosario D. J., Burtscher L., Davies R., Genzel R., Lutz D., Tacconi L. J., 2013a, ApJ, 778, 94
- Rosario et al. (2013b) Rosario D. J. et al., 2013b, ApJ, 771, 63
- Rosario et al. (2012) Rosario D. J. et al., 2012, A&A, 545, A45
- Roseboom et al. (2010) Roseboom I. G. et al., 2010, MNRAS, 409, 48
- Salim et al. (2007) Salim S. et al., 2007, ApJS, 173, 267
- Sauvage & Thuan (1992) Sauvage M., Thuan T. X., 1992, ApJ, 396, L69
- Schaye et al. (2015) Schaye J. et al., 2015, MNRAS, 446, 521
- Silverman et al. (2009) Silverman J. D. et al., 2009, ApJ, 696, 396
- Singh et al. (2013) Singh R. et al., 2013, A&A, 558, A43
- Smith et al. (2012) Smith M. W. L. et al., 2012, ApJ, 756, 40
- Speagle et al. (2014) Speagle J. S., Steinhardt C. L., Capak P. L., Silverman J. D., 2014, ApJS, 214, 15
- Springel et al. (2005) Springel V. et al., 2005, Nature, 435, 629
- Strauss et al. (2002) Strauss M. A. et al., 2002, AJ, 124, 1810
- Terlevich & Melnick (1985) Terlevich R., Melnick J., 1985, MNRAS, 213, 841
- Trump et al. (2015) Trump J. R. et al., 2015, ArXiv e-prints
- Veilleux & Osterbrock (1987) Veilleux S., Osterbrock D. E., 1987, ApJS, 63, 295
- Viero et al. (2014) Viero M. P. et al., 2014, ApJS, 210, 22
- Vito et al. (2014) Vito F. et al., 2014, MNRAS, 441, 1059
- Vogelsberger et al. (2014) Vogelsberger M. et al., 2014, MNRAS, 444, 1518
- Wright et al. (2010) Wright E. L. et al., 2010, AJ, 140, 1868
Appendix A Infrared SED fits: examples and tests
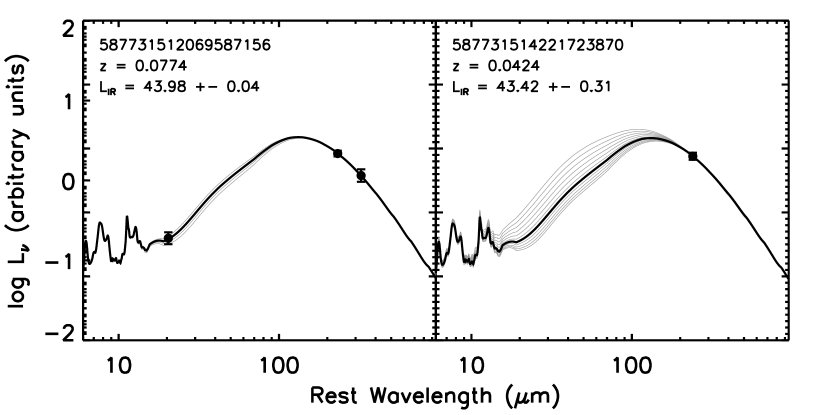
In this work, we used WISE and Herschel/SPIRE photometry of galaxies to estimate their total IR luminosity (LIR). Here we briefly examine the accuracy of LIR estimates based only on photometry that does not sample the peak of the IR SEDs of typical galaxies.

In Figure 17, we show two example fits. In both cases, the best-fit template from the Dale & Helou (2002) library is plotted as a black line, while the grey lines show the range of templates that determine the uncertainties on LIR (Section 2.5). When good photometry is available both in the MIR and FIR, the range in possible galaxy templates is small, as seen in the left panel. When no MIR photometry is available, the Herschel data itself does not adequately constrain the FIR SED shape. In these cases, as shown in the right panel, we adopt a nominal range in galaxy SED shapes to evaluate our uncertainty in LIR.
The accuracy of our LIR estimates depends critically on the validity of the Dale & Helou (2002) galaxy template library as a representation of the real diversity of IR SEDs of galaxies. We test this assumption using a set of 130 local galaxies from the Herschel Reference Survey (HRS; Boselli et al. 2010) with published IR photometry from Spitzer/MIPS (Bendo et al. 2012) and Herschel/SPIRE (Ciesla et al. 2012). We fit the MIPS 24 m (a close alternative to WISE 22 m) and SPIRE 250 m photometry of these galaxies using our template-based method. The resulting 3-1000 m IR luminosities were then compared to estimates published in Ciesla et al. (2015), in which all available MIPS and Herschel photometry of these galaxies, including coverage at 70 and 160 m, were fit with detailed dust models from Draine & Li (2007). Figure 18 shows this comparison. While more uncertain, our template-based fits recover the total IR luminosity of these galaxies very well. However, we do find small deviations from the 1:1 line at LIR erg s-1, at the luminosities that encompass most of our SDSS/HerS sample. Since HRS is a very local survey, it does not include many luminous and massive galaxies. Nevertheless, the success of our fitting technique in recovering the LIR of most of the HRS galaxies suggests that the Dale & Helou (2002) templates are a suitable way to capture the properties of real galaxy SEDs when only MIR and FIR photometry beyond the dust peak are available.