Two Massive White Dwarfs from NGC 2323
and the Initial-Final Mass Relation for Progenitors of 4 to 6.5 M1
Abstract
We have observed a sample of 10 white dwarf candidates in the rich open cluster NGC 2323 (M50) with the Keck Low-Resolution Imaging Spectrometer. The spectroscopy shows eight to be DA white dwarfs, with six of these having high S/N appropriate for our analysis. Two of these white dwarfs are consistent with singly evolved cluster membership, and both are high mass 1.07 M, and give equivalent progenitor masses of 4.69 M. To supplement these new high-mass white dwarfs and analyze the initial-final mass relation (IFMR), we have also looked at 30 white dwarfs from publicly available data that are mostly all high-mass (0.9 M). These original published data exhibited significant scatter, and to test if this scatter is true or simply the result of systematics, we have uniformly analyzed the white dwarf spectra and have adopted thorough photometric techniques to derive uniform cluster parameters for their parent clusters. The resulting IFMR scatter is significantly reduced, arguing that mass-loss rates are not stochastic in nature and that within the ranges of metallicity and mass analyzed in this work mass loss is not highly sensitive to variations in metallicity. Lastly, when adopting cluster ages based on Y isochrones, the slope of the high-mass IFMR remains steep and consistent with that found from intermediate-mass white dwarfs, giving a linear IFMR from progenitor masses between 3 to 6.5 M. In contrast, when adopting the slightly younger cluster ages based on PARSEC isochrones, the high-mass IFMR has a moderate turnover near an initial mass of 4 M.
1. Introduction
Performing stellar archeology on white dwarfs, by far the most common stellar remnant, provides valuable information for not only understanding stellar evolution and mass loss but also galactic evolution. One of the fundamental relations in the analysis of white dwarfs is the initial-final mass relation (hereafter IFMR), where the masses of white dwarfs are compared directly to the zero-age main sequence mass of their progenitors. This semi-empirical relation is critical to our understanding of integrated mass-loss over the lifetime of a star and how it changes with stellar mass. The IFMR has a variety of additional applications including predicting Type Ia supernovae rates (Pritchet et al. 2008; Greggio 2010) and overall stellar feedback in galaxy models (Agertz & Kravtsov 2014), interpreting the white dwarf luminosity function (Catalán et al. 2008), and providing a technique for measuring the age of the Galactic halo (Kalirai 2013).
Analysis of the IFMR began with Weidemann (1977), where it was shown that the models of the time greatly underestimated the observed stellar mass loss. Subsequent work on the IFMR by a number of groups (see Weidemann 2000 for review) resulted in a broad but sparsely populated relation that showed a clear trend with higher-mass main sequence stars producing increasingly more massive white dwarfs. In the past 15 years the amount of IFMR data has greatly increased (e.g., Claver et al. 2001; Dobbie et al. 2004, 2006a; Williams et al. 2004; Kalirai et al. 2005; Liebert et al. 2005; Williams & Bolte 2007; Kalirai et al. 2007; Kalirai et al. 2008; Rubin et al. 2008; Kalirai et al. 2009; Williams et al. 2009; Dobbie & Baxter 2010; Dobbie et al. 2012). These newer data retain the general trend of the previous IFMR work, but the scatter in the data remains significant. The source of this scatter may be attributable to several factors including the possible stochastic nature of mass loss, effects from variation in metallicity or environment, or systematic differences between the studies. One important systematic is the challenge in defining the ages of the clusters these white dwarfs belong to, which creates uncertainty in the derived lifetimes of their progenitor stars. Cummings et al. (2015; hereafter Paper I) began to analyze the important intermediate-mass IFMR (progenitor masses of 3-4 M) from the rich NGC 2099 (M37). This work strengthened the observational evidence that in this mass range the IFMR is steep, where the final white dwarf mass increases more rapidly with increasing progenitor mass. Comparison to the rich population of comparable mass white dwarfs in both the Hyades and Praesepe from Kalirai et al. (2014) showed strongly consistent IFMRs. This consistency also suggests that across this mass range the slightly metal-rich progenitor stars from the Hyades and Praesepe ([Fe/H]0.15) have no significant increase in mass-loss rates compared to those in the solar metallicity NGC 2099.
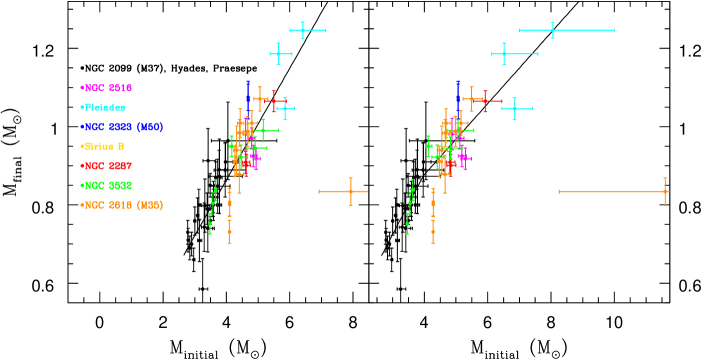
Expanding beyond Paper I, we now look at the challenging higher-mass region (M of 4–6.5 M) of the IFMR by focusing on white dwarfs in younger clusters. While younger clusters do not provide a broad mass range of white dwarfs, they provide several important advantages. First, the highest-mass white dwarfs are the most compact and lowest luminosity, and because they form first they remain bright only in the youngest clusters ( 200 Myr). Second, the cooling rates are far more rapid in young and hot white dwarfs and, as a result, errors in temperature lead to far smaller errors in both cooling age and luminosity. Third, high-mass white dwarfs (0.9 M) may be prone to be ejected from their parent population clusters, either due to dynamical interactions or potential velocity kicks due to asymmetric mass loss during their formation (Fellhauer et al. 2003; Tremblay et al. 2012). Therefore, the probability of finding high-mass white dwarfs still within their cluster population may decrease with age. These three reasons are why younger clusters provide far more advantages in analyzing high-mass white dwarfs with the best precision.
In this paper we begin our analysis with the rich, young, and nearby cluster NGC 2323 (M50). Based on population analysis, Kalirai et al. (2003) find that it is approximately three times as rich as the Pleiades, making it an excellent environment to search for the rare remnants of higher-mass stars. Additionally, to expand our sample we self-consistently reanalyze publicly available data on all published high-mass white dwarfs from clusters (Pleiades [M45], NGC 2516, NGC 2287, NGC 3532, and NGC 2168 [M35]) and Sirius B. To further limit systematics, we also self-consistently analyze the cluster parameters for all of the parent cluster populations based on published high-quality UBV photometry. To look at the broader picture, we connect these high-mass data to the moderate-mass data from Paper I and further analyze the broader characteristics of the IFMR.
The structure of this paper is as follows, in Section 2 we discuss the spectroscopic white dwarf observations of NGC 2323, the publicly available data we have used, and our reduction and analysis techniques. In Section 3 we discuss the UBV photometry based cluster parameters for our six open clusters being analyzed. In Section 4 we discuss the cluster membership of our white dwarf candidates in NGC 2323. In Section 5 we discuss the high-mass IFMR and compare to the intermediate-mass (3–4 M progenitors) IFMR from Paper I. In Section 6 we summarize our study.
2. Observations, Reductions & Analysis
Based on the deep BV photometric observations of NGC 2323 (Kalirai et al. 2003) with the Canada-France-Hawaii telescope and the CFH12K mosaic camera, a sample of white dwarf candidates in NGC 2323 were spectroscopically observed at Keck I using the Low Resolution Imaging Spectrometer (LRIS; Oke et al. 1995). In total, 10 of these candidates had sufficient signal to properly analyze their characteristics. The 400/3400 grism was used with 1” slits giving a spectral resolution of 6 Å, which provides us the wavelength coverage of 3000 to 5750 Å and a series of 5 Balmer lines (H, H, H, H, and H8). These observations were performed on 2008 December 23 and 24, on 2011 December 27 and 28, and on 2015 February 19. For spectral flux calibration, flux standards were observed each night.
Three independent LRIS masks were used in 2008 to observe white dwarfs candidates from NGC 2323. Mask 1 was observed for 40 minutes, Mask 2 was observed for 40 minutes, and Mask 3 was observed for 2 hours and 40 minutes. In 2011, individual longslit observations were performed for five different white dwarf candidates in NGC 2323 ranging from 20 minutes to 1 hour and 50 minutes. Lastly, in 2015 an additional 70 minutes was acquired on WD11, which is a white dwarf candidate of interest that only had 20 minutes of observation in 2011. We have reduced and flux calibrated our LRIS observations using the IDL based XIDL pipeline666Available at http://www.ucolick.org/xavier/IDL/. Of our total observed sample of 10 white dwarfs candidates, eight are DA white dwarfs and WD23 and WD38 have no clear spectral features.
To provide additional high-mass white dwarfs for comparison we have taken from the VLT Archive the observations of seven white dwarf members of NGC 3532, three white dwarf members of NGC 2287, and four white dwarf members of NGC 2516 (Based on observations made with ESO telescopes under Program IDs: 079.D-0490(A); 080.D-0654(A); 084.D-1097(A); PI: Dobbie). These observations were performed with FORS1 and FORS2 using the 600B grism (Appenzeller et al. 1998) giving comparable spectral resolution to our LRIS observations of 6 Å. Analysis of the parameters and membership for the white dwarfs of NGC 2287, NGC 2516, and NGC 3532 were originally published in Dobbie et al. (2009; 2012). Additionally, from the Keck Archive we have taken the observations of 11 white dwarf members of NGC 6128 (Program ID: U49L-2002B; U60L-2004A; U15L-2004B; U18L-2005B; PI: Bolte). Similar to our NGC 2323 observations, these observations were performed using LRIS with a majority of them using the 400/3400 grism and 1” slits, giving the same characteristics to our data. Analysis of the parameters and membership for the white dwarfs of NGC 6128 were original published in Williams et al. (2009).
We have performed our own reductions and analyses of these data from both the VLT and Keck, but we do not redetermine their membership status in this paper. The VLT data were reduced using the standard IRAF techniques for reduction of longslit data, while the Keck data were reduced using the same XIDL pipeline used to analyze our NGC 2323 data. As a test for our VLT data reduction, we were provided with the published spectrum of white dwarf J0646-203 (NGC 2287-4) (P.D. Dobbie; private communication 2014), and we found that there are no meaningful differences in our reduced spectra of the same data. Hence, there are no systematics caused by our spectral reduction techniques, and the systematic differences between our parameters and those presented in Dobbie et al. (2012) are due to differences in our applied white dwarf models and fitting techniques.
Table 0 - NGC 2323 White Dwarf Initial and Final Parameters
IDTlog gM Mt Y M PARSEC M M MS/N
(K) (M) (Myr) (M)(M)(M)(M)
Likely White Dwarf Cluster Members
NGC 2323-WD10 528001350 8.680.09 1.0680.045 10.360.19 1.6 4.69 5.07 4.98 4.45 85
NGC 2323-WD11 541001000 8.690.07 1.0750.032 10.360.13 1.3 4.69 5.07 4.98 4.45 130
White Dwarfs Inconsistent with Single Star Membership
NGC 2323-WD21 18200850 8.260.15 0.7790.096 11.330.25 170 – – – – 28
NGC 2323-WD7 16800250 7.900.05 0.5590.024 10.920.07 112 – – – – 122
NGC 2323-WD17 19800300 8.120.05 0.6940.028 10.970.07 96 – – – – 111
NGC 2323-WD12 17100400 7.880.07 0.5500.037 10.870.11 101 – – – – 60
Low Signal to Noise White Dwarfs
NGC 2323-WD22 244001550 8.080.22 0.6810.128 10.530.36 33 – – – – 13
NGC 2323-WD30 13400900 8.040.18 0.6290.106 11.520.28 290 – – – – 23
For the high-mass LB 1497, from the Pleiades, and Sirius B we have taken the T and log g parameters from Gianninas et al. (2011). We also have taken these parameters from Gianninas et al. (2011) for the supermassive GD50 and PG 0136+251 white dwarfs, where Dobbie et al. (2006b) used three-dimensional space velocities to argue that GD50’s progenitor was related to and coeval with the Pleiades cluster. Similarly, but based on only proper motions, Dobbie et al. (2006b) argued that PG 0136+251’s progenitor is likely consistent with coeval formation with the Pleiades. Gianninas et al. (2011) use white dwarf atmospheric models and fitting techniques equivalent to ours, and we adopt their T and log g in our analysis of these four white dwarfs.
For our spectroscopic analysis we adopted the same analysis techniques as those described in Paper I. In brief, we used the recent white dwarf spectroscopic models of Tremblay et al. (2011) with the Stark profiles of Tremblay & Bergeron (2009), and the automated fitting techniques described by Bergeron et al. (1992) to fit our Balmer line spectra and derive T and log g. However, for our derived parameters (mass, luminosity, and cooling age) we expand upon the methods of Paper I because our current sample has a far broader mass range. For deriving the parameters for white dwarfs of mass less than 1.10 M we applied our T and log g to the cooling models for a carbon/oxygen (CO) core composition with a thick hydrogen layer by Fontaine et al. (2001). For the highest-mass white dwarfs ( 1.1 M) we derived the parameters based on the oxygen/neon (ONe) core models of Althaus et al. (2005; 2007).
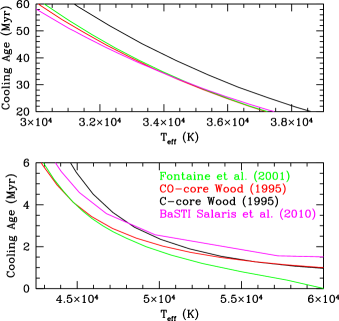
A discussion of our adopted models is warranted. First, we do not adopt the more recent white dwarf atmospheric models of Tremblay et al. (2013) because those focus only on 3D modeling of convective atmospheres (14,000 K), and our current analysis looks hot fully radiative white dwarfs. For our cooling models, while the Fontaine et al. (2001) models are widely used, we should acknowledge two limitations they have. First, they assume a 50/50 carbon and oxygen core composition, which based on full stellar evolutionary models is not accurate (e.g., Romero et al. 2013). The effect of this on the calculated cooling ages can be important, but for the relatively young white dwarfs we are analyzing this effect remains small. Second, these cooling models do not begin at the tip of the asymptotic giant branch (hereafter AGB) and instead begin at a T of 60,000 K. In comparison, the widely used Wood (1995) CO cooling models do begin at the tip of the AGB and they do not adopt a simple 50/50 carbon and oxygen core composition777Equation 1 of Wood (1995) gives their C/O ratio relation.. Unfortunately, their CO core models have an upper mass limit of 1.0 M, which limits their application in our analysis but they provide an important test for systematics. In Figure 1 we compare the cooling ages from the Fontaine et al. (2001) CO core models at 1.0 M to both the CO and pure-carbon core models of Wood (1995) and the BaSTI CO models from Salaris et al. (2010). The BaSTI CO cooling models adopted C/O ratio profiles based on the BaSTI scaled solar stellar evolution models. The lower panel of Figure 1 shows that at high T45,000 K all of the differences between these models never result in cooling age differences of more than 1.5 Myr. The upper panel of Figure 1 similarly shows that at cooler temperatures 30,000T40,000 K the CO models, irrespective of their adopted C/O ratios or starting points, all give strong agreement in cooling ages, but the systematic effects introduced from pure carbon core models (10 Myr) are now clearly seen.
For ultramassive white dwarfs, the mass at which they transition to ONe white dwarfs remains uncertain, and it also likely depends on metallicity (Doherty et al. 2015). Here we have adopted a somewhat conservative 1.10 M, but we note that the models of Garcia-Berro et al. (1997) argue that it may be as low as 1.05 M. Reassuringly, in this mass range the CO and ONe cooling ages at constant mass are consistent for such young white dwarfs, but for these white dwarfs the dependence of the mass-radius relationship on core-composition is very important. For example, applying the gravities of white dwarfs in the mass range of 1.05 to 1.10 M (based on CO-core models) to the ONe models derives masses 0.05 M lower and places them all below 1.05 M. Therefore, it is appropriate to adopt 1.10 M as the transition mass.
In Table 1 we present our white dwarf parameters for the eight DA white dwarfs from NGC 2323. For clarity in Table 1 we have distinguished between members and nonmembers, where membership is based on our comparisons of model based and observed photometry in addition to comparisons of cooling ages to the cluster age (see our detailed discussion of membership in Section 4). Additionally, we have considered S/N (per resolution element) and the resulting errors given in Table 1. The WD22 and WD30 spectra have low S/N and mass errors greater than 0.1 M. Therefore, their parameters are presented for reference but have been cut from our final analysis. This is because their membership determinations are unreliable, but their low masses do suggest they are field white dwarfs.
3. Cluster Parameters
With IFMR analysis, the parameters of the star clusters are as critical as the white dwarfs themselves. This is particularly true for the highest-mass white dwarfs, where the derived masses of their progenitors change rapidly with evolutionary time. Uniform photometric data sets are not available for these six clusters. But in Paper I we showed that for NGC 2099, the adopted isochrones and fitting techniques had as large, if not larger, of an effect on its cluster parameters as did any systematics between the cluster’s different photometry sets. This is best illustrated by the systematic effects on derived cluster ages, where the Yi et al. (2001; hereafter Y) and the Ventura et al. (1998) isochrones both gave our final adopted age of 520 Myr for NGC 2099. The PARSEC version 1.2S isochrones (Bressan et al. 2012) derived a comparable age of 540 Myr, and lastly the Girardi et al. (2000) and Bertelli et al. (1994) isochrones both gave significantly younger ages of 445 Myr. Between these isochrone sets there is nearly a 100 Myr range of derived ages when using identical photometry, and further systematics can be introduced based on how the isochrones are fit to the data.
In this paper we have redetermined as uniformly as possible the reddenings, distance moduli, and ages for these six clusters using available high-quality UBV photometry that covers up to the full turnoff. The Y isochrones provide our final adopted cluster ages, but to broaden our results we also determine ages with the PARSEC isochrones. These two isochrones give only slightly different cluster ages, but in these younger clusters the masses of the progenitor stars have a far more significant dependence on evolutionary time, and even a 20 Myr systematic has a significant effect on our results.
3.1. Color-Color Analysis
In our cluster photometric analysis we first make use of color-color diagrams (B-V vs U-B), which provide direct photometric information on the cluster reddening. The photometric metallicity can also be derived but it is quite sensitive to systematics in U magnitude, a concern considering the typically more complex standardization process for U magnitudes and the varying sources of our photometry. Therefore, in the case of the Pleiades, NGC 2168, and NGC 2516 we consider more detailed spectroscopic metallicities, but for NGC 2287, NGC 2323, and NGC 3532 we will simply adopt solar metallicity. However, we note that these adopted metallicities do show strong consistency with the observed photometry. Our color-color analysis adopts two techniques, the first is semi-empirical and based on the Hyades fiducial and the second is based directly on the Y isochrones, which reach to higher masses than those available in the Hyades fiducial. For both methods the reddening relation adopted is that of Cardelli et al. (1989) and the metallicity correction is based on that of the Y isochrones. The methods using the Hyades fiducial have been developed in Deliyannis et al. (in prep), where the fiducial was derived from single-star cluster members (see Perryman et al. 1998). The Hyades UBV photometry of Johnson & Knuckles (1955) was adopted with a cluster [Fe/H] of +0.15 and E(B-V) of 0.
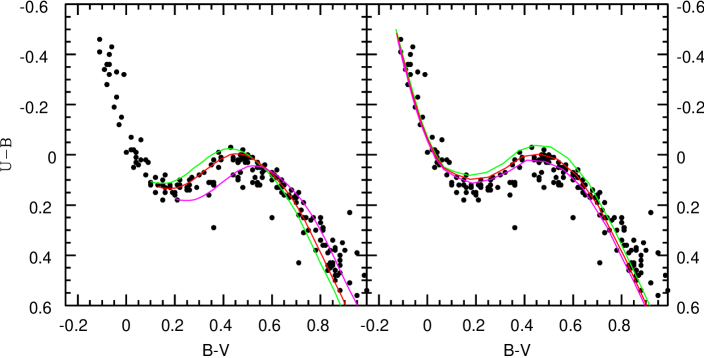
The Pleiades provides a good example for our color-color analysis techniques. In the left panel of Figure 2 we have plotted the photoelectric UBV photometry from Johnson & Mitchell (1958) with several reddening curves based on the Hyades fiducial, and we have applied a metallicity of [Fe/H]=0.01 (Z=0.0185) to match the reddening insensitive region where all of the reddening curves intersect near B-V of 0.6. Fitting by eye the blueward color-color trend we find that a reddening curve of E(B-V)=0.030.02 matches the Pleiades UBV photometry the best. Both this reddening and metallicity are consistent with the typically derived values and spectroscopic analyses of the Pleiades (e.g., [Fe/H]=0.010.02 Schuler et al. 2010; [Fe/H]=0.030.020.05 Soderblom et al. 2009) We also note that the Hyades fiducial ends at B-V0.1, where the older Hyades turnoff occurs.
In the right panel of Figure 2 we fit the higher-mass stars bluer than B-V=0.0 with three different 135 Myr Y isochrones of differing metallicity. All three metallicities fit a reddening of E(B-V)=0.03 in these bluest stars. This demonstrates that these higher-mass stars create a nearly linear trend that is insensitive to variations in metallicity. We note that the position of this blue linear trend is also insensitive to cluster age, where as we look at older clusters the trend only shortens in length and does not shift its position. Therefore, this linear trend’s position provides a reliable reddening measurement independent of all other cluster parameters.
In the upper left panel of Figure 3 we compare directly our Hyades fiducial fit and our Y fit for the Pleiades. There are systematic differences that are noted in the B-V range of 0.1-0.3, where it appears that the Y isochrones are too blue in U-B relative to both the data and the Hyades fiducial. However, when adopting a Y isochrone with an age consistent to the Hyades (650 Myr; not shown) the isochrone is nearly identical to that of the Hyades fiducial, so at these younger ages the isochrones appear to overestimate the U flux at this intermediate color range. At all other colors this does not seem to be a concern because, reassuringly, both the Hyades fiducial and the Y isochrones find the same reddening in their respective regions, and they also agree in the region sensitive to metallicity (B-V0.6) and redder. In regard to the PARSEC isochrones, they are not independently considered in our color-color analysis because their U-B colors do not fit the observations.
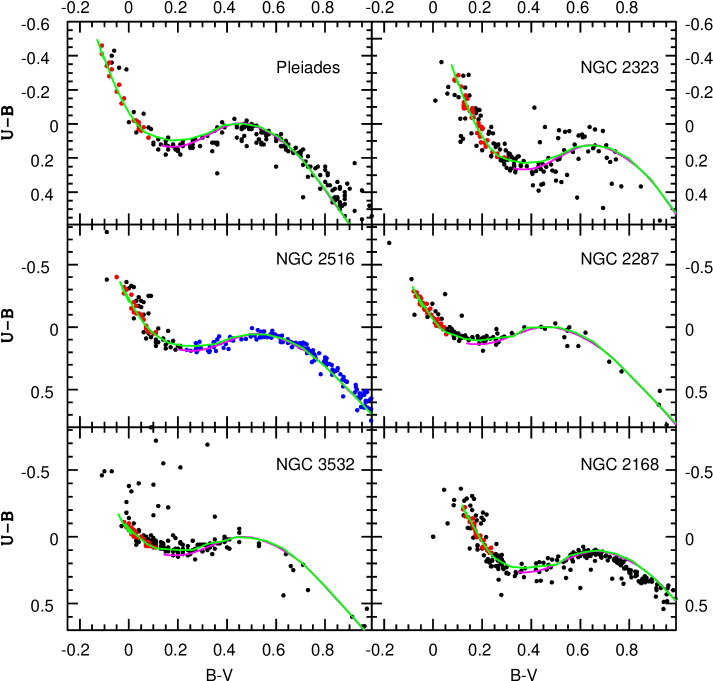
A key advantage to color-color analysis is that it can be used to clean young cluster turnoffs. Dating younger clusters is prone to several difficulties, including that turnoffs are relatively sparse even in the richest clusters and that these higher-mass turnoff stars have high binarity fraction (Kouwenhoven et al. 2007). Additionally, many higher-mass stars fall into the peculiar groups of blue stragglers or Be stars. For example, Mermilliod 1982a, 1982b, and Ahumada & Lapasset (2007) found that several of the brightest stars in the clusters being analyzed in this paper are blue stragglers that are far too blue or too bright, if not both, for their age. Lu et al. (2011) modeled the formation of blue stragglers on the short time scales necessary in these young clusters and found that they can rapidly be created through binary mass transfer. Identifying these peculiar stars can greatly improve the fit of the turnoff ages of these younger clusters. Mermilliod 1982b do find that when plotted in color-color space Be stars deviate from the approximately linear trend of the “normal” high-mass stars. Additionally, several of our clusters may have variable reddening, and fitting this high-mass linear trend identifies the richest group of cluster stars with consistent reddening. In the Pleiades shown in the upper-left panel of Figure 3, we mark in red the high-mass stars consistent with the trend, and several stars deviate from this trend that are likely peculiar. However, we do acknowledge that the brightest star in the Pleiades, Alcyone, does not deviate from this trend. Alcyone is a multiple system and has several peculiar characteristics like spectral emission and rapid rotation (Hoffleit & Jaschek 1991) and is commonly referred to as both a blue straggler and Be dwarf. This suggests that while this color-color method does identify many problematic stars, it does not remove all peculiar stars.
In the upper right panel of Figure 3 we have similarly plotted the NGC 2323 UBV photometry from Claria et al. (1998). We fit the bluest stars and see that independent of an assumed metallicity, we find a large reddening of E(B-V)=0.230.06 at (B-V)=0, where we deem this reddening large enough to account for the color dependence of reddening (see Fernie 1963 and our discussion in Paper I). When we have adopted a color dependent reddening we will define the reddening at (B-V)=0. Again, our selected final turnoff stars are shown in red.
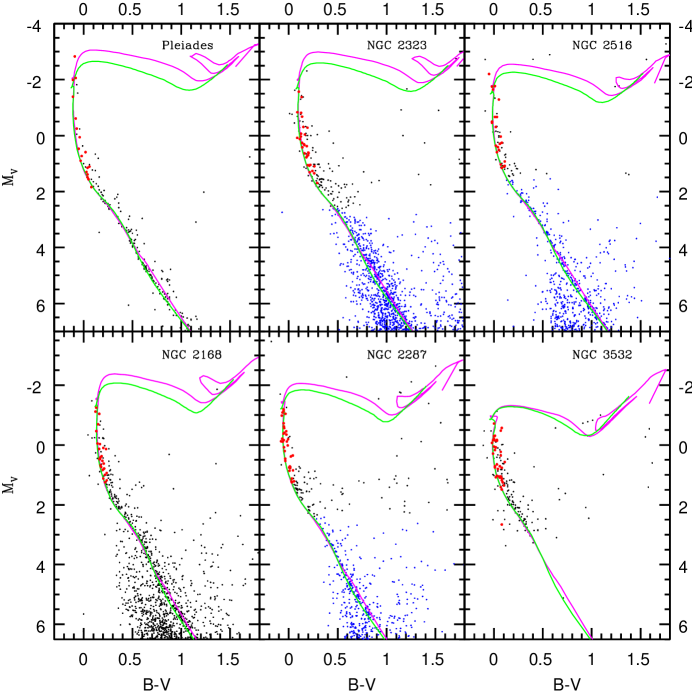
Table 0 - Open Cluster Parameters
Cluster E(B-V) (m-M) [Fe/H] Y Age (Myr) PARSEC Age (Myr) Photometric Sources
Pleiades 0.030.02 5.670.10 +0.01 13515 11015 1
NGC 2323 0.230.06 10.00.15 0.00 14020 11520 2,3
NGC 2516 0.100.03 8.200.12 +0.065 17020 15020 4,5
NGC 2168 0.250.04 9.660.10 -0.143 19020 17020 6
NGC 2287 0.0350.025 9.520.12 0.00 22030 20530 7,8
NGC 3532 0.040.025 8.460.14 0.00 32020 32520 9
Table 1 - Membership Data
IDM V (B-V) B-V t
(J2000) (J2000) (Model)(Obs.)(Model)(Obs.)(Myr)
NGC 2323 Likely Single Star White Dwarf Members
NGC 2323-WD10 7:02:41.02 -8:26:12.8 10.360.19 20.620.009 -0.3030.002 -0.0200.060 2.9
NGC 2323-WD11 7:03:22.14 -8:15:58.7 10.360.13 20.670.008 -0.3050.002 0.0500.025 2.6
White Dwarfs Inconsistent with Single Star Membership
NGC 2323-WD21 7:02:08.56 -8:25:48.0 11.330.25 21.910.026 -0.0130.022 0.1490.158 170
NGC 2323-WD7 7:02:47.87 -8:35:56.4 10.920.07 19.500.004 -0.0050.007 0.0780.004 112
NGC 2323-WD17 7:03:12.62 -8:30:53.6 10.970.07 20.960.010 -0.0570.007 0.1070.015 96
NGC 2323-WD12 7:03:17.79 -8:19:59.7 10.870.11 20.520.007 -0.0140.010 0.1160.079 101
Low Signal to Noise and Featureless White Dwarfs
NGC 2323-WD22 7:02:33.93 -8:31:04.3 10.530.36 21.890.024 -0.1350.025 0.1800.013 33
NGC 2323-WD30 7:03:22.56 -8:29:25.7 11.520.28 22.040.028 0.1110.026 0.4850.029 290
NGC 2323-WD38 7:03:31.87 -8:28:25.0 – 22.930.062 – 0.6450.058 –
NGC 2323-WD23 7:03:39.85 -8:28:16.7 – 21.420.016 – 0.3750.044 –
Our four additional clusters are also shown in Figure 3. In NGC 2516, we have used two UBV photometric studies, Dachs (1970) for the brightest stars and Sung et al. (2002) for the fainter stars shown in blue. For the moderately large reddening we fit a E(B-V) of 0.100.03 at (B-V)=0 and a [Fe/H]=0.065, and as with the Pleiades this is consistent with the typically adopted parameters and our spectroscopic analysis (Cummings 2011). For NGC 2287 we have used the UBV photometry of Ianna et al. (1987) and fit a E(B-V) of 0.0350.025 with an assumed solar metallicity. For NGC 3532 we have used the UBV photometry of Fernandez & Salgado (1980) and fit a E(B-V) of 0.040.025 with an assumed solar metallicity. Lastly, for NGC 2168 we have used the UBV photometry of Sung & Bessell (1999). We derive a E(B-V) of 0.250.04 at (B-V)=0 for this cluster and adopt a metal-poor [Fe/H] of -0.143 (Steinhauer & Deliyannis 2004), which provides a reliable fit to the bluest stars and follows the U-B range well but it appears that there is a systematic shift in B-V where the stars becoming increasingly too blue at redder colors. Otherwise, changes in either adopted metallicity or reddening cannot fit the full B-V color range.
3.2. Color-Magnitude Analysis
In Figure 4 we display our by eye turnoff age fits with Y isochrones in green when adopting from Figure 3 the reddenings, metallicities, and the cleaned turnoff stars shown in red. In magenta we similarly display the PARSEC isochrone fits, where we have adopted the same reddenings, distance moduli, and metallicities (Z). In Table 2 the derived cluster parameters and the photometric sources are listed. We note that in the youngest clusters the PARSEC isochrones systematically derive ages 25 Myr younger, while in the 320 Myr NGC 3532 they derive ages 5 Myr older, and lastly from Paper I the PARSEC isochrones derive an age 20 Myr older in the 520 Myr old NGC 2099. Therefore, these two isochrones not only have changing systematics at differing ages, but they are in opposite directions in young versus older clusters. The possible causes of the systematics between these two isochrones include the differences in their adopted opacities, equations of state, and solar compositions. While the Y isochrones do not consider evolution past the tip of the red giant branch (RGB), in these typically young clusters we cannot reliably fit the giants because their populations are very sparse or they have no giants at all. Therefore, we have chosen the Y isochrones for our final parameters because they more successfully fit both the color-color data and the the main sequence features.
These cluster ages provide several advantages over adopting literature values. 1) The ages are based on a uniform system of isochrones, while literature values adopt wide ranging models that have systematic differences that become more pronounced at younger ages. 2) The fitting techniques applied are by eye but consistent, while fitting techniques for literature values can greatly vary. 3) The difficulty of peculiar turnoff stars are addressed in a systematic way, while their consideration can have important differences in the literature values, if they are considered at all. We will not comment on the absolute accuracy of the various isochrone model ages, but in this study uniformity and precision is the goal. We must also reiterate two remaining limitations with our cluster parameters. First, all of our photometries are primarily from differing groups, which still may leave important systematics remaining in our parameter analyses. Additionally, uniformly measured spectroscopic metallicities are also needed to address the metallicity sensitivity in the turnoff isochrone fits.
Lastly, for Sirius B there is no parent cluster that we can self-consistently analyze for the total age, but the age of the Sirius system is well studied and here we adopt solar metallicity and the age of 237.512.5 Myr determined in Liebert et al. (2005).
4. White Dwarf Membership in NGC 2323

Cluster membership determination is key in analyzing the formation history of these white dwarfs and applying them to the IFMR. In the case of NGC 2323, we have the advantage that because it is such a young cluster, any hot and young high-mass white dwarfs observed in its field would already have reliable membership. For example, in the Sloan Digital Sky Survey sample of field white dwarfs, only 2.6% of DA white dwarfs have a mass greater than 1 M and less than 10% of these are young with a T20,000 K (e.g., Kleinman et al. 2013; Kepler et al. 2016). To further confirm cluster membership in NGC 2323, however, we have also performed magnitude and color analysis.
In Table 3 we list the observed photometry for these white dwarfs and also list their cooling age and model based M and (B-V). For our membership analysis we directly compare the model based and observed magnitudes and colors in Figure 5 to derive an effective distance modulus and reddening for each white dwarf. We define our 1 color and magnitude errors by adding in quadrature the respective model fitting errors, the observational errors, and in the case of magnitude the distance modulus errors or in the case of color the reddening errors. We select white dwarfs as consistent with membership if their effective distance modulus and reddening are within 2 of the cluster parameters derived in Section 3. Of our six high signal white dwarfs, only WD10, WD11, and WD21 have both magnitudes and colors consistent with membership. However, WD21 has a cooling age longer than the age of the cluster. Therefore, we do not consider it a member but a field white dwarf at comparable distance to NGC 2323.
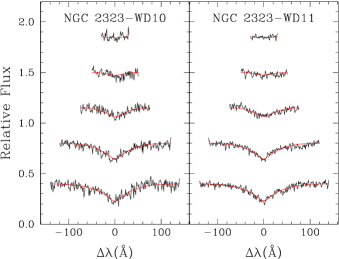
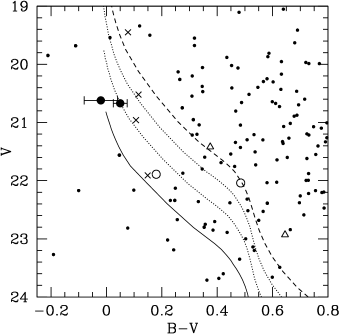
In Figure 6 we show the Balmer line fits of WD10 and WD11, the two cluster members. They both are high mass at 1.07 M and have very high temperature (50,000 K) with accordingly extremely short cooling times of 3 Myr. Their membership further suggests that all of our other observed white dwarfs, which all have both lower masses and longer cooling times are not consistent with NGC 2323 membership. In Figure 7 we display the CMD of all observed candidates relative to several white dwarf cooling models taken from http://www.astro.umontreal.ca/bergeron/CoolingModels/ (Holberg & Bergeron 2006, Kowalski & Saumon 2006, Tremblay et al. 2011, and Bergeron et al. 2011).
5. Initial-Final Mass Relation
Table 1 - Reanalyzed White Dwarf Initial and Final Parameters
IDTlog gM M t Y M PARSEC M S/N
(K) (M) (Myr) (M) (M)
NGC 2287-2 25900350 8.450.05 0.9090.028 11.010.09 76 4.61 4.81 150
NGC 2287-4 26500350 8.710.05 1.0650.027 11.440.10 127 5.50 5.93 130
NGC 2287-5 25600350 8.440.04 0.9010.028 11.020.08 77 4.63 4.83 170
NGC 2516-1 30100350 8.470.04 0.9250.027 10.740.08 42 4.85 5.19 160
NGC 2516-2 35500550 8.550.07 0.9810.040 10.580.13 24 4.61 4.88 90
NGC 2516-3 29100350 8.460.04 0.9180.027 10.780.08 48 4.94 5.31 170
NGC 2516-5 32200400 8.540.05 0.9700.027 10.730.09 38 4.80 5.12 170
NGC 3532-1 23100300 8.520.04 0.9500.026 11.330.08 131 4.17 4.13 240
NGC 3532-5 27700350 8.280.05 0.8040.028 10.570.08 31 3.57 3.55 220
NGC 3532-9 31900400 8.180.04 0.7520.026 10.130.07 9.3 3.48 3.46 210
NGC 3532-10 26300350 8.340.04 0.8380.027 10.780.08 51 3.66 3.64 200
NGC 3532-J1106-590 21100350 8.480.05 0.9220.031 11.430.09 163 4.46 4.41 110
NGC 3532-J1106-584 20200300 8.520.05 0.9450.029 11.580.09 197 4.91 4.83 120
NGC 3532-J1107-584 20700300 8.590.05 0.9900.028 11.660.09 211 5.16 5.07 180
Sirius B 26000400 8.570.04 0.9820.024 11.210.08 99 4.69 4.69 -
Pleiades-LB 1497 32700500 8.670.05 1.0460.028 10.940.09 54 5.86 6.85 170
Pleiades-GD50 42700800 9.200.07 1.2460.021 11.580.15 70 6.41 8.05 -
Pleiades-PG0136+251 41400800 9.030.07 1.1860.027 11.280.15 48 5.64 6.52 -
NGC 2168-LAWDS1 33500450 8.440.06 0.9110.039 10.470.11 19 4.27 4.48 95
NGC 2168-LAWDS2 33400600 8.490.10 0.9400.061 10.570.18 25 4.33 4.55 70
NGC 2168-LAWDS5 52700900 8.210.06 0.8010.031 9.490.10 1.0 4.10 4.28 210
NGC 2168-LAWDS6 573001000 8.050.06 0.7310.029 9.130.11 0.5 4.10 4.28 260
NGC 2168-LAWDS11 19900350 8.350.05 0.8340.035 11.310.09 149 7.93 11.60 100
NGC 2168-LAWDS12 34200500 8.600.06 1.0090.037 10.730.12 36 4.44 4.69 100
NGC 2168-LAWDS14 30500450 8.570.06 0.9880.038 10.890.12 54 4.67 4.98 100
NGC 2168-LAWDS15 30100400 8.610.06 1.0090.032 10.980.11 64 4.80 5.16 130
NGC 2168-LAWDS22 530001000 8.220.06 0.8070.035 9.500.11 1.0 4.10 4.28 250
NGC 2168-LAWDS27 30700400 8.720.06 1.0710.031 11.160.11 78 5.06 5.49 120
NGC 2168-LAWDS29 33500450 8.560.06 0.9840.034 10.700.11 34 4.42 4.67 120
NGC 2168-LAWDS30 29700500 8.390.08 0.8780.048 10.630.13 33 4.41 4.65 60