Modeling Eating Behaviors: the Role of Environment and Positive Food Association Learning via a Ratatouille Effect
Abstract
Eating behaviors among a large population of children are studied as a dynamic process driven by nonlinear interactions in the sociocultural school environment. The impact of food association learning on diet dynamics, inspired by a pilot study conducted among Arizona children in Pre-Kindergarten to 8th grades, is used to build simple population-level learning models. Qualitatively, mathematical studies are used to highlight the possible ramifications of instruction, learning in nutrition, and health at the community level. Model results suggest that nutrition education programs at the population-level have minimal impact on improving eating behaviors, findings that agree with prior field studies. Hence, the incorporation of food association learning may be a better strategy for creating resilient communities of healthy and non-healthy eaters. A Ratatouille effect can be observed when food association learners become food preference learners, a potential sustainable behavioral change, which in turn, may impact the overall distribution of healthy eaters. In short, this work evaluates the effectiveness of population-level intervention strategies and the importance of institutionalizing nutrition programs that factor in economical, social, cultural, and environmental elements that mesh well with the norms and values in the community.
1 Introduction
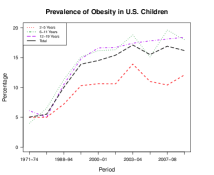
The prevalence of childhood obesity has doubled among 2-to-5-year-olds (5-7% to 10.4%) and tripled for both 6-to-11-year-olds (6.5% to 19.6%) and 12-to-19-year-olds (5% to 18.1%) from to [37]. Childhood obesity can increase risk of cardiovascular disease [3, 10, 36] and cancer [3, 9, 32], two leading causes of premature mortality and physical morbidity in adulthood [43]. Many national efforts, such as the United States Department of Agriculture’s (USDA) implementation of the “My Plate” guidelines [49] in schools, aim to alter the eating dynamics of young individuals [3]. These state-mandated guidelines impact the diets of those who eat lunch (60%) and breakfast (37%) at their schools [48], or 99% and 78% of public schools who participate in the National School Lunch and Breakfast Programs, respectively [23, 29]. In short, children, in the early stages of developing their eating habits, consume most of their daily food (19 to 50% or more) in schools [25, 29] and are members of a captive audience (10 years, 9 months, and 5 days per week) [1, 39]. Hence, a better understanding of the overall effectiveness of these programs and the access to a captive audience is necessary for improving the overall health of children.
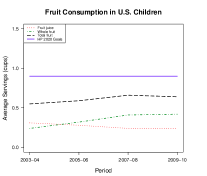
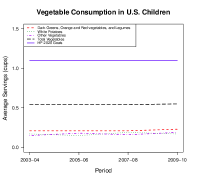
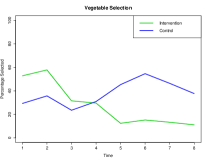
In this paper, we aim at shedding some light on the connections between key identified factors [3, 8, 30, 34] that shape eating behaviors at the population-level via contagion mathematical models, within a social-ecological framework [35]. Although schools are ideal for institutionalizing nutrition programs, a huge step in the fight against obesity-related illness, childhood obesity is still an issue and consumption of fruits and vegetables among children is low (see Figure 1). Using the film Ratatouille as a metaphor and the study by Wadhera et al., 2015b [], we investigate the significance of the “Ratatouille” effect, that is the impact of recreating ‘positive’ childhood eating experiences, memories, and their connection with the process of building healthy eating habits. Food preference learning has been identified as a possible influential method for developing healthier eating habits by modifying taste, the strongest predictor of children’s food consumption [5, 18, 41, 46]. Although well-studied in experimental settings, its impact is not well-understood at the population-level, and hence, we investigate this phenomenon on the diet dynamics of young individuals in this work.
2 Eating Behaviors in School Settings
The study of the diet dynamics of individuals at the population-level have been rarely addressed in the literature (but see [20, 24, 26, 28]). Building a population-level model from the knowledge that we have gathered on the daily decisions of individuals is rather challenging just as it is the construction of an epidemiological model from the study of an individuals immunological (level of the cell) response to a disease invasion. Our eating behaviors, that is, why we eat certain foods, how much to eat, when to eat, and how to eat these foods, are governed by biological, sociocultural, and psychosocial factors that are learned in a variety of settings. In this work, we assume that there are three population-level components involved on the diet-dynamics of individuals within a community. The first involves the impact of dietary programs (health awareness, communication, and skill-building) that tend to be temporary and often associated with high levels of recidivism [17, 18, 42]. The second would be the social environment, here modeled simply via the day-to-day interactions among individuals with different diets. The unpalatability of healthy foods make their systematic consumption difficult, however, social and behavior-based elements have been shown effective; such as, hands-on curriculum activities (classroom lessons, taste-testing, cooking lessons), parental involvement, school gardening, peer modeling, or rewards [3, 7, 33, 34, 41, 46]. The third includes the physical environment, here availability and accessibility of healthier foods changes due to the nutrition programs implemented in the schools [16, 40, 45, 50]. Despite our understanding of these factors, the efficacy of these interventions vary and so, more work is needed in order to fully assess their impact on the diet dynamics of young individuals.
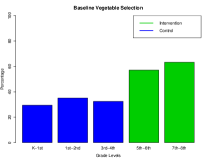
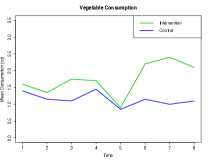
Building ‘positive’ childhood memories has been identified as a possibly influential force on the long-term eating behaviors of adults based on the study in [52]. Food preferences has been shown to increase with exposure, tasting (not just smelling or seeing), and a positive social experience [6, 4]. However, the unpalatability of healthier foods and the onset of neophobia, or the fear of trying something new, influences children s food choices and can ultimately lower both dietary variety [19, 21] and the consumption of fruits, vegetables, and meats [15, 27]. These issues have been addressed via exposure techniques (six to ten) [51], where familiarizing children with these foods can improve the liking for and intake of novel foods among preschool and school-aged children [31, 47]. An alternative approach for increasing liking for and consumption of vegetables is food association learning, in which, a classical conditioning paradigm is applied and considered successful when liking for a novel flavor occurs due to its pleasurable association with the calories or the liked flavor (flavor-flavor learning) it was paired repeatedly with [12]. Although few studies have shown that associative conditioning more effectively increases liking and consumption of vegetables, compared to exposure [13, 22, 51]; its impact has been minimally studied at the population-level. In our pilot study [Manuscript in progress], we studied the effect of associative conditioning among Arizona students. Among the Pre-Kindergarten to 8th grade participants, we found that our method of food association learning acted as a positive reinforcement for children who may be more likely to eat vegetables but did not improve selection or consumption for those who may be more reluctant to eat vegetables (see Figure 2). These results are utilized as an initial exploration of food association and food preference learning in schools.
The prevalence of childhood (10.4%) and adult (25.9%) obesity in Arizona is only slightly lower than national estimates [2, 38]; and the 2012 Behavior Risk Factor Surveillance Survey (BRFSS) estimated 60% overweight or obese adults, 37.5% of obese adults living in households with food assistance (WIC, SNAP, and/or Free and Reduced Lunch), and increased adult obesity risk among non-daily consumers of fruits and vegetables (30.3% and 31.7%) compared to daily consumers (24.6% and 25.6%) [2]. Although these health disparities are not studied here explicitly, the study of nutrition programs is essential for improving the overall health of Arizona residents. In U.S. children, obesity was higher among Mexican-American (28.8% boys and 17.4% girls) and non-Hispanic black (19.8% boys and 29.2% girls) than non-Hispanic white (16.7% boys and 14.5% girls) [37]. Arizona residents comprises demographic characteristics (age, gender, income, education, and employment status) generalizable to the nation [11]. However, the presence of food deserts and the economical and environmental barriers puts vulnerable population, or 14.3% of low-income children, Hispanic (29.9% in A.Z. and 16.6% in the U.S.), and American Indian or Alaska Native (4.0% in A.Z. and 0.7% in the U.S.) [11] residents, at increased risk for insufficient consumption of essential nutrients or overconsumption of unhealthier foods high in saturated and trans fats.
Though multiple levels of detail and heterogeneity can be incorporated, such an approach could invariably lead to highly complex nonlinear models that would be difficult to analyze. In this first effort, we proceed to study the impact of the three stated factors: dietary programs, social environment, and the physical environment on the distribution of eating patterns. This effort by no means attempts to minimize or underpinned the complexities and challenges associated with understanding the forces behind the dynamics of obesity. What we are trying to do is to introduce a framework for the study of the impact of these three components on the dynamics of obesity under highly simplified conditions at the population-level. We don’t expect the results of these caricature models to offer solutions. Our hope is that the population-level framework introduced, its analysis, and the interpretation of the model results would inspire others to expand and improve on this work so that a solid and tested framework would be eventually developed.
3 The Mathematical Modeling Framework
We develop two models to shed some light on how the interactions among individual factors, the sociocultural environment, and nutrition programs impact the dynamics of eating behaviors and distribution of eaters in school settings. A typical school population can be considered to be composed of two types of students: moderately healthy individuals, denoted , or those who eat a ‘moderate’ amount of fruits, 100% fruit juice, or vegetables (FJV) (25- 50% of “My Plate” guidelines) and the ‘less’ healthy individuals, denoted , or those who eat a ‘low’ amount of FJV (less than 25% of “My Plate” guidelines). The first model considers the simplest scenario, where school nutrition programs influence some -eaters to modify their diets to become -eaters but remain in the same environment. However, prior field studies suggest the impact of nutrition education is low and hence this recovery is temporary, suggesting that -eaters can break their ‘good’ diet, a form of recidivism. The second model, incorporates the impact of ‘positive’ food association learning via a Ratatouille effect. Both - and -eaters can enter a program, in which, some students learn food association techniques, denoted , where eventually some proportion will develop sustainable food preferences, denoted . In these next subsections, we describe each model, corresponding results, and the conditions under which the diet dynamics are altered.
3.1 Absence of Food Association, Brief Recovery, and Recidivism
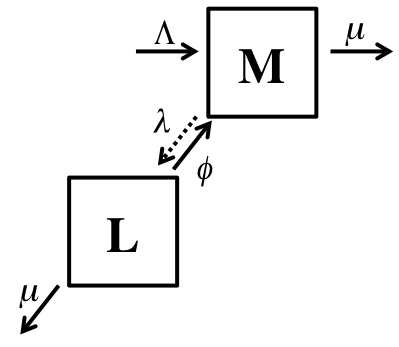
The total population of students, denoted , is made up of - and -eaters. The average time that a student spends in Pre-Kindergarten to 8th grades (10 years) is denoted . A proportion of -eaters can shift to -eaters after exposure to a nutrition program, denoted , which means that -eaters shift to -eaters but do not change eating environments. The average time that an individual spends in the -eater state before returning to the -eater state is . However, the diet changes are temporary due to recidivism since -eaters can shift back to -eaters (see Figure 3 for a schematic diagram and Table 1 for variable and parameter definitions). This system is governed by the following equations,
| (1) |
where , represents the fraction of -eaters in the population that interact with -eaters, which in turn, lead to the conversion of - into -eaters at the rate , via a social ‘contagion’ process. The contagion process would be considered successful as long as the interactions between and lead to an increase in the number of ’s. The number of new students entering the school per year is denoted by .
| Parameter | Value | Unit | Description |
|---|---|---|---|
| 0.9 | dimensionless | Proportion of ‘Moderately’ healthy individuals | |
| (consume 25-50% of “My Plate” guidelines) | |||
| 0.1 | dimensionless | Proportion of ‘Less’ healthy individuals | |
| (consume less than 25% of “My Plate” guidelines) | |||
| 1.8 | Peer influence rate shifting a - to an -eater | ||
| varies | Exposure to nutrition programs | ||
| 0.10 | Per-capita student entry and removal rate |
The control reproduction number, , is a threshold value permitting the assessment of true success of a nutrition education program. Here, it is defined as a function of the nutrition education program rate ,
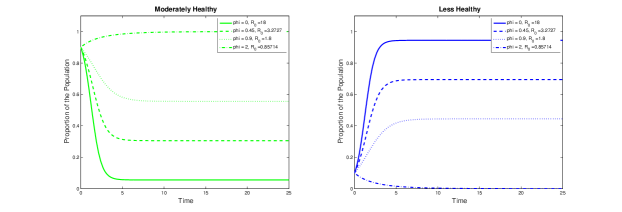
where represents the total average time spent in the district as an -eater before shifting to an -eater following a nutrition education program. When there is no nutrition education program, that is , then becomes, that is, the threshold becomes the product of , the effective conversion rate per , and , the average time a student remains in the education system. The above simplistic model will not be used to highlight the effectiveness or lack thereof of nutrition education on altering the prevalence of -eaters. However, this model assumes that the educational effort (per person) modelled by remains part of the culture and it is continuously implemented. Our pilot data [Manuscript in Progress] suggested that (i.e., 70%), hence at equilibrium and . With and years, we can estimate , or . Using these values, model simulations show that increasing the nutrition programs, , will decrease the proportion of eaters (see Figure 4). A sociocultural environment with mostly -eaters is achieved for large values of . If , then the amount of -eaters would increase with the proportion of non-converts decreasing. In the long-term, the model would achieve a steady state, that is, the student population will settle into a ‘fixed’ proportion of -eaters () and -eaters (). If , then the population would consist of mostly -eaters instead of -eaters in the long-run. The system is rescaled such that , , and . There are two equilibrium points (in proportions) are: the diet-problem-free state
and the diet-problem-endemic state
The prime ′ here denotes vector transpose. We claim that is globally asymptotically stable if and only if while is globally asymptotically stable whenever it exists (i.e., if and only if ). Hence, the inequality is equivalent to
This means that the shorter the average time spent in the -eater state is, the better chance we have to eliminate the diet problem at the population-level.
3.2 Ratatouille Effect
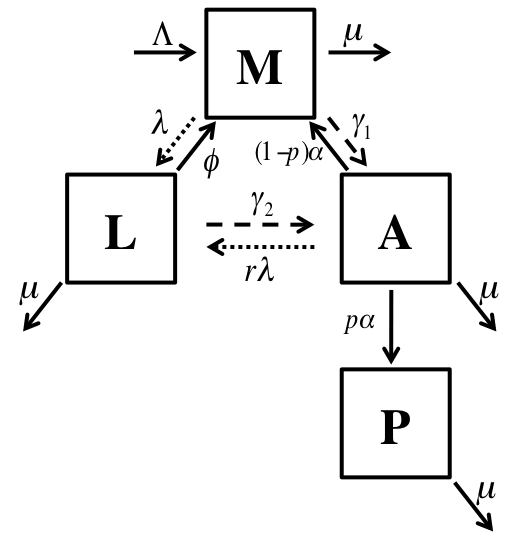
A slightly modified version of Model (1) permits the study of food association learning with varying levels of effectiveness. Here, -eaters will enter the food association learning program at the per-capita rate . After association learning, a portion will become food preference learners (-eaters) at the combined rate , in which, we consider the food association learning program successful. Recidivism of -eaters, where they return to old ways of eating as -eaters, occurs at the rate or as -eaters after social interactions with -eating peers at rate , where . The -eaters who do not enter the food association program would either maintain current eating habits or by social interactions with peers, , they would become -eaters. Finally, -eaters can shift to -eaters at rate or they join the food association program and therefore transit to -eaters at rate (see Table 2 for variable and parameter definitions and Figure 5 for a schematic diagram). This new model is governed by the following equations,
| (2) | |||||
where the total population is and student school entry rate is
| Parameter | Value | Unit | Description |
|---|---|---|---|
| 0.4 | dimensionless | Proportion of ‘Moderately’ healthy individuals | |
| (consume 25-50% of “My Plate” guidelines) | |||
| 0.1 | dimensionless | Proportion of ‘Less’ healthy individuals | |
| (consume less than 25% of “My Plate” guidelines) | |||
| 0.2 | dimensionless | Proportion of food association learners | |
| 0.3 | dimensionless | Proportion of food preference learners | |
| 1.8 | Peer influence rate shifting a - to an -eater | ||
| 0.35 | Entry rate into food association program as an -eater | ||
| 0.06 | Entry rate into food association program as an -eater | ||
| varies | dimensionless | Proportion those who become ”preference learners” | |
| 0.4 | Effectiveness rate of food association learning | ||
| 0.6 | Recidivism rate from a - to an -eater | ||
| 0.1 | dimensionless | Denotes the relative susceptibility of -eaters with respect | |
| to -eaters who shift to an -eater | |||
| 0.10 | Per-capita student entry and removal rate |
Model (2) is rescaled in terms of sub-population proportions: , and . The diet-problem-free equilibrium is , where
It is locally asymptotically stable if and only if , where is the control reproduction number for the model with the ratatouille effect. The proportion, , represents the reduction in the control reproduction number due to the application of the education association program. The analysis reveals further that the rescaled model shows the existence of subcritical endemic states (backward bifurcation phenomenon) if and only if the following set of inequalities is held
| (3) |
that is, if is small enough, the susceptibility is within some pre-specified range, and the proportion of preference learners is high enough where
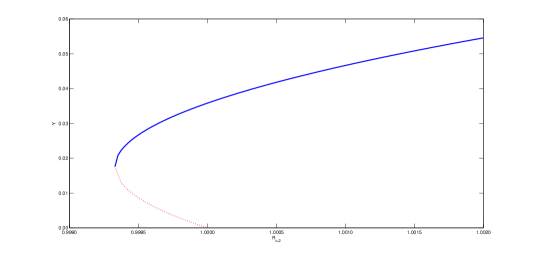
Thus, if Condition (3) holds, then the model has two diet-problem-endemic equilibria for . Figure 6 shows the bifurcation diagram for the ratatouille model in the plane , where the solid curve corresponds to a diet-problem-endemic equilibrium with higher level of the endemic prevalence of -eaters and the dotted curve corresponds to a diet-problem-endemic equilibrium with lower level of -eaters’ endemic prevalence, and both exist when . Further, as decreases, both curves approach each other until reaching the turning point [44] at which both of them coalesce. The value of the control reproduction number at this turning point is given by , where
| (4) |
and
In fact, the value is, a threshold value, that determines the nonexistence and existence of diet-problem-endemic states. If at least one of the conditions (3) is not satisfied, then the model shows the existence of forward bifurcation (supercritical endemic state), in which, a unique diet-problem-endemic equilibrium exists and is stable for , while no endemic state exists for . Hence, is the threshold level that indicate the nonexistence and existence of diet-problem-endemic states. Thus, we summarize the above results as follows: the critical control reproduction number below which diet-problem-endemic equilibria do not exist is given by
| (5) |
Diet-problem containment possibility
Addressing the possibility of containing (getting rid of) the diet problem is certainly of utmost importance. Here, we discuss the existence of necessary and sufficient conditions required to eliminate the diet-endemic problem based on the implementation of a food association program with effectiveness . In the literature of mathematical epidemiology, the basic reproduction number is a key concept, the public health cornerstone used to determine the minimum effort required to eliminate an infection when the model doesn’t exhibit the existence of multiple endemic equilibria. However, in the last two decades several models exhibited bistable endemic states, where backward bifurcation and hysteresis phenomena are shown to exist. In such cases, is a necessary but not sufficient condition for eliminating the infection. For a model with backward bifurcation, it has been shown in [44] that the ratio could be interpreted as a reproduction number and so, reducing this ratio to below one ensures an effective control of the infection. Thus, if we solve the inequality in terms of the probability , we get
| (6) |
where
and
Formula (6) determines the critical probability () of effectiveness of a food association program above which the diet-problem-endemic state(s) disappear. Figure 7 shows the critical level of the food association effectiveness as a function of the contact rate . The vertical line separates between nonexistence and existence of a backward bifurcation. Therefore, for , the curve separates between existence and nonexistence of diet-problem-endemic equilibria. Thus, a probability of effectiveness slightly above ensures an effective control of the diet-endemic problem. However, if , then backward bifurcation exists and is the threshold above which diet-problem-endemic equilibria do not exist. Thus, a food association program with probability of effectiveness slightly higher than exhibits a die-out of the diet-endemic problem, where
Here, the level represents the value at which hits the upper bound . Thus, for , there is no feasible value of that ensures a wash out of the diet-endemic problem and we may seek another control strategy to first reduce the contact rate to below and then apply a food association program with high enough probability of effectiveness. This ensures an effective control of the diet-problem.
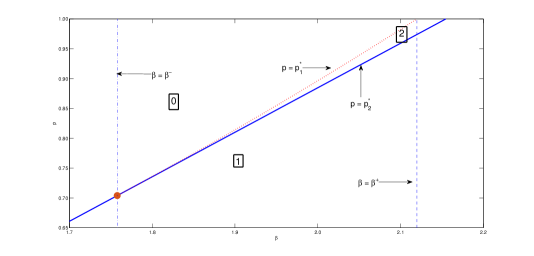
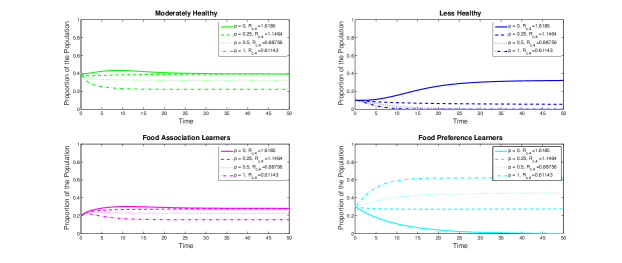
Figure 8 shows a time series analysis for the model for a fixed and four different levels of . The proportion of -eaters approaches zero when and , while when and , it approaches a constant value. This implies that if the efficacy of the program is 50% or greater, then the - and -eaters are reduced, while -eaters approach zero, and -eaters are largest, compared to a program with lower efficacy (). Hence, a food association program that leads to food preference learning can be an effective nutrition intervention strategy. However, this would require knowledge on the culture, norms, and values of the community to create and implement such a program.
4 Discussion
The goals of many nutrition programs are to instill healthy and sustainable eating habits among young individuals. Since food association learning has been identified as a more effective approach, we study its potential impact through use of mathematical models. Two models were developed in order to study eating behavior learning and the resulting diet dynamics of young individuals. The first model considered the case when there is no food association learning program and the second incorporated food association and food preference learning. Results of Model 1 indicate that some nutrition program at schools are better than none at all. If effective, or large enough, then the food association learning program is a potential impactful strategy at reducing the proportion of -eaters shown by the results of Model 2. These results demonstrates the importance of nutrition education curriculum, learning, and socialization in schools. However, more work is needed to understand how to create and implement an effective program so that it incorporates the culture, norms, and values of the community, supporting the conclusions of other studies [1, 39, 40, 45]. Future work would more effectively incorporate data from the literature. The parameter values we chose (see Tables 1 and 2) were qualitatively estimated based on observations from this pilot study and the literature but more work is needed to quantify these values.
References
- ADA, [1999] ADA (1999). Statement. promoting healthy eating behaviors: The role of school environments.
- ADHS, [2012] ADHS (2012). Brfss summary. http://www.azdhs.gov/phs/bnp/nupao/documents.
- Ammerman et al., [2002] Ammerman, A. S., Lindquist, C. H., Lohr, K. N., and Hersey, J. (2002). The efficacy of behavioral interventions to modify dietary fat and fruit and vegetable intake: a review of the evidence. Preventive medicine, 35(1):25–41.
- Birch, [1987] Birch, L. (1987). The role of experience in children’s food acceptance patterns. Journal of the American Dietetic Association, 87(9 Suppl):S36–40.
- Birch, [1979] Birch, L. L. (1979). Preschool children’s food preferences and consumption patterns. Journal of Nutrition Education, 11(4):189–192.
- Birch et al., [1980] Birch, L. L., Zimmerman, S. I., and Hind, H. (1980). The influence of social-affective context on the formation of children’s food preferences. Child development, pages 856–861.
- Birnbaum et al., [2002] Birnbaum, A. S., Lytle, L. A., Story, M., Perry, C. L., and Murray, D. M. (2002). Are differences in exposure to a multicomponent school-based intervention associated with varying dietary outcomes in adolescents? Health Education & Behavior, 29(4):427–443.
- Blanchette and Brug, [2005] Blanchette, L. and Brug, J. (2005). Determinants of fruit and vegetable consumption among 6–12-year-old children and effective interventions to increase consumption. Journal of human nutrition and dietetics, 18(6):431–443.
- Block et al., [1992] Block, G., Patterson, B., and Subar, A. (1992). Fruit, vegetables, and cancer prevention: a review of the epidemiological evidence. Nutrition and cancer, 18(1):1–29.
- Boeing et al., [2012] Boeing, H., Bechthold, A., Bub, A., Ellinger, S., Haller, D., Kroke, A., Leschik-Bonnet, E., Müller, M. J., Oberritter, H., Schulze, M., et al. (2012). Critical review: vegetables and fruit in the prevention of chronic diseases. European journal of nutrition, 51(6):637–663.
- Bureau, [2015] Bureau, U. C. (2015). State and County QuickFacts. Data derived from Population Estimates. http://quickfacts.census.gov/qfd/states/04000.html. [Last Revised: Tuesday, 31-Mar-2015].
- Capaldi, [1996] Capaldi, E. D. (1996). Why we eat what we eat: The psychology of eating. American Psychological Association.
- Capaldi-Phillips and Wadhera, [2014] Capaldi-Phillips, E. D. and Wadhera, D. (2014). Associative conditioning can increase liking for and consumption of brussels sprouts in children aged 3 to 5 years. Journal of the Academy of Nutrition and Dietetics, 114(8):1236–1241.
- CDC, [2014] CDC (2014). Progress on children eating more fruit, not vegetables. http://www.cdc.gov/vitalsigns/pdf/2014-08-vitalsigns.pdf.
- Cooke, [2007] Cooke, L. (2007). The importance of exposure for healthy eating in childhood: a review. Journal of human nutrition and dietetics, 20(4):294–301.
- Cullen et al., [2003] Cullen, K. W., Baranowski, T., Owens, E., Marsh, T., Rittenberry, L., and de Moor, C. (2003). Availability, accessibility, and preferences for fruit, 100% fruit juice, and vegetables influence children’s dietary behavior. Health Education & Behavior, 30(5):615–626.
- Cullen et al., [1998] Cullen, K. W., Bartholomew, L. K., Parcel, G. S., and Koehly, L. (1998). Measuring stage of change for fruit and vegetable consumption in 9-to 12-year-old girls. Journal of behavioral medicine, 21(3):241–254.
- Domel et al., [1993] Domel, S. B., Baranowski, T., Davis, H., Leonard, S. B., Riley, P., and Baranowski, J. (1993). Measuring fruit and vegetable preferences among 4th-and 5th-grade students. Preventive medicine, 22(6):866–879.
- Dovey et al., [2008] Dovey, T. M., Staples, P. A., Gibson, E. L., and Halford, J. C. (2008). Food neophobia and picky/fussy eating in children: A review. Appetite, 50(2):181–193.
- Evangelista et al., [2004] Evangelista, A. M., Ortiz, A. R., Rios-Soto, K., and Urdapilleta, A. (2004). Usa the fast food nation: Obesity as an epidemic. T-7, MS B, 284.
- Falciglia et al., [2000] Falciglia, G. A., Couch, S. C., Gribble, L. S., Pabst, S. M., and Frank, R. (2000). Food neophobia in childhood affects dietary variety. Journal of the American Dietetic Association, 100(12):1474–1481.
- Fisher et al., [2012] Fisher, J. O., Mennella, J. A., Hughes, S. O., Liu, Y., Mendoza, P. M., and Patrick, H. (2012). Offering dip promotes intake of a moderately-liked raw vegetable among preschoolers with genetic sensitivity to bitterness. Journal of the Academy of Nutrition and Dietetics, 112(2):235–245.
- Fox et al., [2004] Fox, M., Hamilton, W., and Lin, B. (2004). Effects of food assistance and nutrition programs on health and nutrition. Food Assistance and Nutrition Research Report, 3(19-3).
- Frerichs et al., [2013] Frerichs, L. M., Araz, O. M., and Huang, T. T.-K. (2013). Modeling social transmission dynamics of unhealthy behaviors for evaluating prevention and treatment interventions on childhood obesity. PloS one, 8(12):e82887.
- Gleason et al., [2001] Gleason, P., Suitor, C., Food, U. S., and Service, N. (2001). Children’s diets in the mid-1990s: Dietary intake and its relationship with school meal participation, special nutrition programs.
- Gonzalez-Parra et al., [2010] Gonzalez-Parra, G., Jodar, L., Santonja, F. J., and Villanueva, R. J. (2010). An age-structured model for childhood obesity. Mathematical Population Studies, 17(1):1–11.
- Howard et al., [2012] Howard, A. J., Mallan, K. M., Byrne, R., Magarey, A., and Daniels, L. A. (2012). Toddlers food preferences. the impact of novel food exposure, maternal preferences and food neophobia. Appetite, 59(3):818–825.
- Jódar et al., [2008] Jódar, L., Santonja, F. J., and González-Parra, G. (2008). Modeling dynamics of infant obesity in the region of valencia, spain. Computers & Mathematics with Applications, 56(3):679–689.
- Kaphingst and French, [2006] Kaphingst, K. M. and French, S. (2006). The role of schools in obesity prevention. The Future of Children, 16(1):109–142.
- Katz, [2009] Katz, D. L. (2009). School-based interventions for health promotion and weight control: not just waiting on the world to change. Annual review of public health, 30:253–272.
- Liem and De Graaf, [2004] Liem, D. G. and De Graaf, C. (2004). Sweet and sour preferences in young children and adults: role of repeated exposure. Physiology & behavior, 83(3):421–429.
- Lipkin et al., [1999] Lipkin, M., Reddy, B., Newmark, H., and Lamprecht, S. A. (1999). Dietary factors in human colorectal cancer. Annual review of nutrition, 19(1):545–586.
- Lowe et al., [2004] Lowe, C., Horne, P. J., Tapper, K., Bowdery, M., and Egerton, C. (2004). Effects of a peer modelling and rewards-based intervention to increase fruit and vegetable consumption in children. European journal of clinical nutrition, 58(3):510–522.
- Lytle and Achterberg, [1995] Lytle, L. and Achterberg, C. (1995). Changing the diet of america’s children: what works and why? Journal of Nutrition Education, 27(5):250–260.
- McLeroy et al., [1988] McLeroy, K. R., Bibeau, D., Steckler, A., and Glanz, K. (1988). An ecological perspective on health promotion programs. Health Education & Behavior, 15(4):351–377.
- Ness and Powles, [1997] Ness, A. R. and Powles, J. W. (1997). Fruit and vegetables, and cardiovascular disease: a review. International Journal of epidemiology, 26(1):1–13.
- Ogden and Carroll, [2010] Ogden, C. L. and Carroll, M. D. (2010). Prevalence of obesity among children and adolescents: United states, trends 1963-1965 through 2007-2008. http://www.cdc.gov/nchs/data/hestat/obesity_child_07_08/obesity_child_07_08.pdf.
- Ogden et al., [2014] Ogden, C. L., Carroll, M. D., Kit, B. K., and Flegal, K. M. (2014). Prevalence of childhood and adult obesity in the united states, 2011-2012. Jama, 311(8):806–814.
- Pérez-Rodrigo and Aranceta, [2001] Pérez-Rodrigo, C. and Aranceta, J. (2001). School-based nutrition education: lessons learned and new perspectives. Public Health Nutrition, 4(1a):131–139.
- Perez-Rodrigo and Aranceta, [2003] Perez-Rodrigo, C. and Aranceta, J. (2003). Nutrition education in schools: experiences and challenges. European Journal of Clinical Nutrition, 57:S82–S85.
- Perry et al., [2004] Perry, C. L., Bishop, D. B., Taylor, G. L., Davis, M., Story, M., Gray, C., Bishop, S. C., Mays, R. A. W., Lytle, L. A., and Harnack, L. (2004). A randomized school trial of environmental strategies to encourage fruit and vegetable consumption among children. Health education & behavior, 31(1):65–76.
- Pyle et al., [2006] Pyle, S. A., Sharkey, J., Yetter, G., Felix, E., Furlong, M. J., and Poston, W. (2006). Fighting an epidemic: the role of schools in reducing childhood obesity. Psychology in the Schools, 43(3):361–376.
- Reilly and Kelly, [2011] Reilly, J. and Kelly, J. (2011). Long-term impact of overweight and obesity in childhood and adolescence on morbidity and premature mortality in adulthood: systematic review. International journal of obesity, 35(7):891–898.
- Safan et al., [2006] Safan, M., Heesterbeek, H., and Dietz, K. (2006). The minimum effort required to eradicate infections in models with backward bifurcation. Journal of mathematical biology, 53(4):703–718.
- Story et al., [2008] Story, M., Kaphingst, K. M., Robinson-O’Brien, R., and Glanz, K. (2008). Creating healthy food and eating environments: policy and environmental approaches. Annu. Rev. Public Health, 29:253–272.
- Story et al., [2002] Story, M., Neumark-Sztainer, D., and French, S. (2002). Individual and environmental influences on adolescent eating behaviors. Journal of the American Dietetic Association, 102(3):S40–S51.
- Sullivan and Birch, [1990] Sullivan, S. A. and Birch, L. L. (1990). Pass the sugar, pass the salt: Experience dictates preference. Developmental psychology, 26(4):546.
- USDA, [2014] USDA (2014). Nutrition assistance programs. www.fns.usda.gov/fns/.
- USDA, [2015] USDA (2015). Choosemyplate.gov. http://www.choosemyplate.gov/vegetables.
- Van Der Horst et al., [2007] Van Der Horst, K., Oenema, A., Ferreira, I., Wendel-Vos, W., Giskes, K., van Lenthe, F., and Brug, J. (2007). A systematic review of environmental correlates of obesity-related dietary behaviors in youth. Health education research, 22(2):203–226.
- [51] Wadhera, D., Capaldi-Phillips, E. D., and Wilkie, L. M. (2015a). Teaching children to like and eat vegetables. Appetite.
- [52] Wadhera, D., Phillips, E. D. C., Wilkie, L. M., and Boggess, M. M. (2015b). Perceived recollection of frequent exposure to foods in childhood is associated with adulthood liking. Appetite, 89:22–32.