Multiwavelength Observations of the Redback Millisecond Pulsar J10482339
Abstract
We report on radio timing and multiwavelength observations of the 4.66 ms redback pulsar J1048+2339, which was discovered in an Arecibo search targeting the Fermi-LAT source 3FGL J1048.6+2338. Two years of timing allowed us to derive precise astrometric and orbital parameters for the pulsar. PSR J1048+2339 is in a 6-hour binary, and exhibits radio eclipses over half the orbital period and rapid orbital period variations. The companion has a minimum mass of 0.3 , and we have identified a variable optical counterpart in data from several surveys. The phasing of its mag modulation at the orbital period suggests highly efficient and asymmetric heating by the pulsar wind, which may be due to an intrabinary shock that is distorted near the companion, or to the companion’s magnetic field channeling the pulsar wind to specific locations on its surface. We also present gamma-ray spectral analysis of the source and preliminary results from searches for gamma-ray pulsations using the radio ephemeris.
1 Introduction
Data from the Large Area Telescope (LAT) on the Fermi Gamma-ray Space Telescope have shown definitively that millisecond pulsars (MSPs) are gamma-ray emitters similar to young pulsars (Abdo et al., 2009), and more than a quarter of all known MSPs outside of globular clusters were discovered in radio searches targeting Fermi unidentified sources only within the past six years (Ray et al., 2012). Fermi has been especially successful in uncovering MSPs in black widow and redback binary systems, where the pulsar’s intense particle wind gradually ablates the companion. The main difference between the two classes is the mass and type of the companion. While in black widow systems the companion is degenerate, with a mass of 0.01–0.05 , redback pulsars have non-degenerate companions whose mass is an order of magnitude larger (Roberts et al., 2011). Both types are believed to be transitional between accreting low-mass X-ray binaries (LMXBs), rotation-powered binary MSPs, and isolated MSPs. Nineteen of 25 known black widows and nine of 13 known redbacks in the Galactic field were discovered in radio searches of Fermi unidentified sources.
Black widows and redbacks are relatively rare objects because they are selected against in undirected (“all sky”) surveys due to their intrinsic properties (radio eclipses, high line-of-sight acceleration from orbital motion) and because this stage in MSP evolution is short compared to an MSP’s lifetime. Consequently, there is much still to be learned about the details of the transition between accreting and rotation-powered MSPs (Roberts et al. 2011, Roberts et al. 2013). This is especially true of redback pulsars, as they are the rarer and more recently discovered type.
In this paper we present a detailed multiwavelength study of PSR J1048+2339, a redback radio pulsar found in a Fermi source by Cromartie et al. (2015). The pulsar’s prolonged radio eclipses around superior conjunction as well as “mini-eclipses” at other orbital phases are reminiscent of the redback class archetype, PSR J1023+0038, whose transition from LMXB to radio MSP was observed almost in real time (Archibald et al. 2009, Archibald et al. 2013). In addition, PSR J1048+2339 exhibits significant orbital period variations similar to those observed in the redbacks PSR J1023+0038, PSR J23390533 (Pletsch & Clark, 2015), and the original black widow pulsar B1957+20 (Arzoumanian et al., 1994).
2 Radio Observations
PSR J1048+2339 was discovered in a search at 327 MHz with the Arecibo telescope of high-latitude Fermi unidentified sources from a preliminary version of the 3FGL Fermi LAT source catalog (Cromartie et al., 2015). The source selection criteria were (1) non-variability in gamma-rays, (2) pulsar-like gamma-ray spectrum, and (3) an error box 15′ across or smaller, corresponding to the diameter of the Arecibo beam at 327 MHz. The pulsar was discovered in a 15-minute observation targeting the Fermi source 3FGL J1048.6+2338 on 2013 August 4. PSR J1048+2339 has a pulse period of 4.66 ms and a dispersion measure (DM) of 16.65 pc cm-3. According to the NE2001 model of electron density in the Galaxy (Cordes & Lazio, 2002), this DM corresponds to a distance of 0.7 kpc.
We performed timing observations of PSR J1048+2339 at 26 epochs between 2013 August 4 and 2015 September 20 using the Arecibo radio telescope at 327 MHz. The observations used the PUPPI backend in “fast4k” mode, with 4096 channels and a 81.92 s sampling time. Since the minimum bandwidth provided by PUPPI, 100 MHz, is larger than the receiver bandwidth of 68 MHz, only 2680 channels were recorded to disk, corresponding to the part of the PUPPI band covering the receiver bandwidth. After deriving a timing solution in 2015 July, we observed PSR J1048+2339 at 1430 MHz at two epochs in coherent folding, full-Stokes mode using PUPPI with a bandwidth of 700 MHz, 448 channels, and a 64 s sampling time.
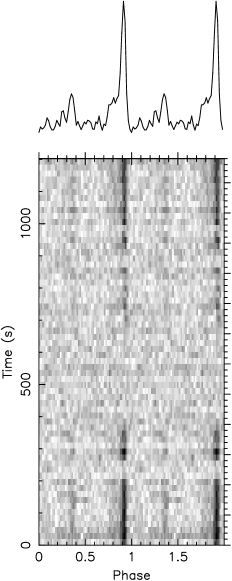
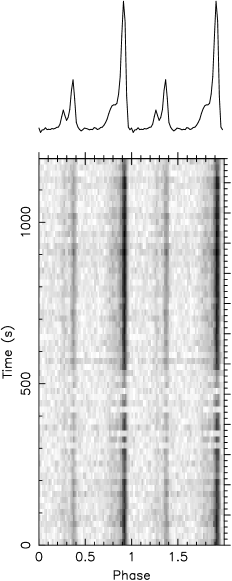
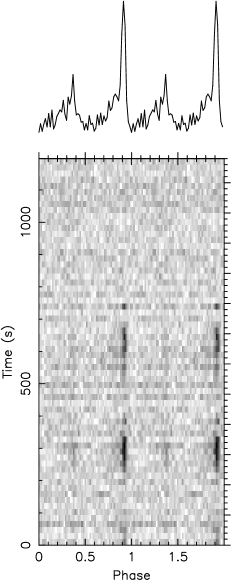
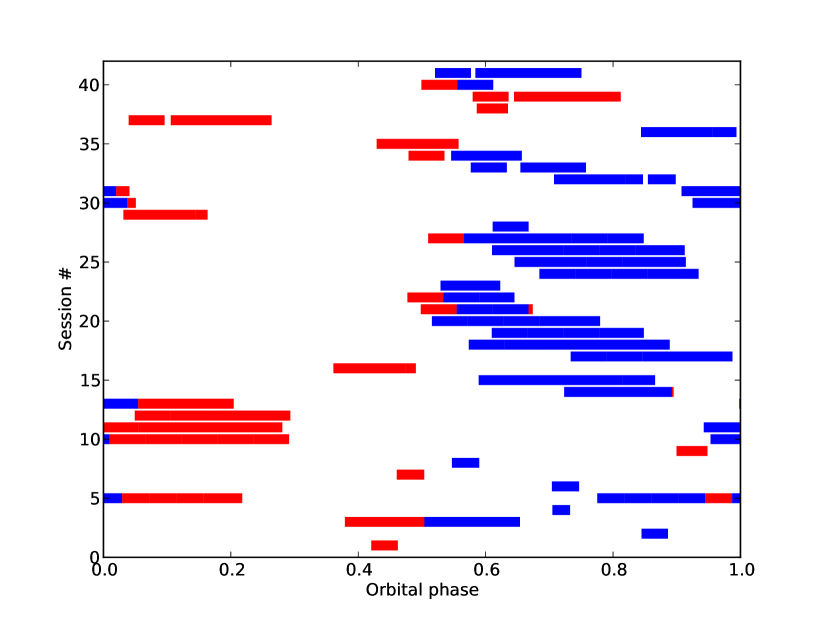
Many observations spanned eclipse ingress, egress, or showed significant short-timescale emission variations, especially near ingress (Fig. 1). We did not detect any radio emission in the orbital phase range 0.02–0.49, corresponding to the main eclipse when the pulsar is near superior conjunction with respect to the companion. Sporadic “mini-eclipses” occur frequently at other orbital phases and their duration ranges from tens to hundreds of seconds. At two epochs we did not detect the pulsar even at orbital phases where it is normally visible, 0.6–0.8 (MJD 57343 and 57345; sessions 36 and 37 in Fig. 2), indicating that the pulsed radio emission may be obscured by dense ionized gas for extended periods of time.
2.1 Timing Solution
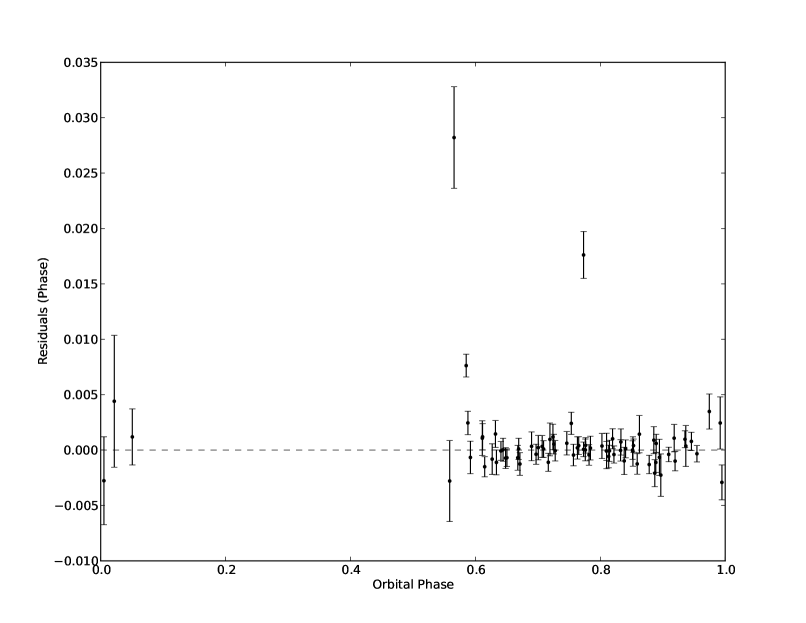
In order to derive a phase-connected timing solution that accounts for every rotation of the pulsar between observations, we extracted times-of-arrival (TOAs) from folded 327 MHz data using a pulse profile template consisting of four Gaussian components, two each for the main pulse and interpulse. We used the Tempo software package111http://tempo.sourceforge.net and the BTX binary model (Blandford & Teukolsky 1976; D. J. Nice, unpublished) to perform least-squares fitting of various pulsar parameters by minimizing the square of the differences between expected and measured TOAs, after excluding three points with large, apparently dispersion-induced delays. We scale the TOA uncertainties by a factor of 1.47 in order to bring the reduced of the fit to unity. The resulting best-fit parameters and other derived pulsar properties are listed in Table 1. Figure 3 shows the timing residuals for all 327 MHz observations. There are no significant trends in the remaining timing residuals, indicating that at the current timing precision and for the current data set, the ephemeris presented in Table 1 describes the TOAs. The most unusual timing property of J1048+2339 is its orbital period variation necessitating the fitting of five orbital period derivatives in order to obtain a timing model that fits the data well over the full time span of radio observations ( years).
The relatively short span of the solution and the large number of orbital period derivatives required to model the data mean that there are significant correlations between some of the timing parameters (e.g. the astrometric and orbital parameters). As a result, the Tempo uncertainties of the celestial coordinates are significantly underestimated (see Section 6.2).
Two TOAs near eclipse egress (orbital phase ) show an extra delay indicating that pulses are passing through the outer layers of the companion. One TOA near orbital phase also shows an extra delay. Such features are common in systems where gas turbulence and outflows may introduce short-lived dispersive delays in the radio emission at various orbital phases. We note that this feature is present in only one of several observations spanning that part of the orbit. We calculate that the extra delays observed for these three TOAs correspond to a DM excess of 0.008, 0.003, and 0.005 pc cm-3. Assuming that the DM excess is incurred over a linear distance equivalent to the projected semimajor axis of the orbit (or the radius of the companion, which is of the same order of magnitude), we obtain an intra-binary electron density on the order of cm-3. In comparison, Nice & Thorsett (1992) find an intra-binary electron density of cm-3 for the eclipsing MSP B174424A, and Ransom et al. (2004) find a similar value for PSR J21402310A.
2.2 Polarimetry and Profile Evolution
We performed three observations of PSR J1048+2339 using the Arecibo L-wide receiver and the PUPPI backend with a bandwidth of 700 MHz centered on 1430 MHz. One of the observations was in search mode, for a duration of 15 minutes. The remaining two observations were in coherent dedispersion full-Stokes mode, for 40 minutes each.
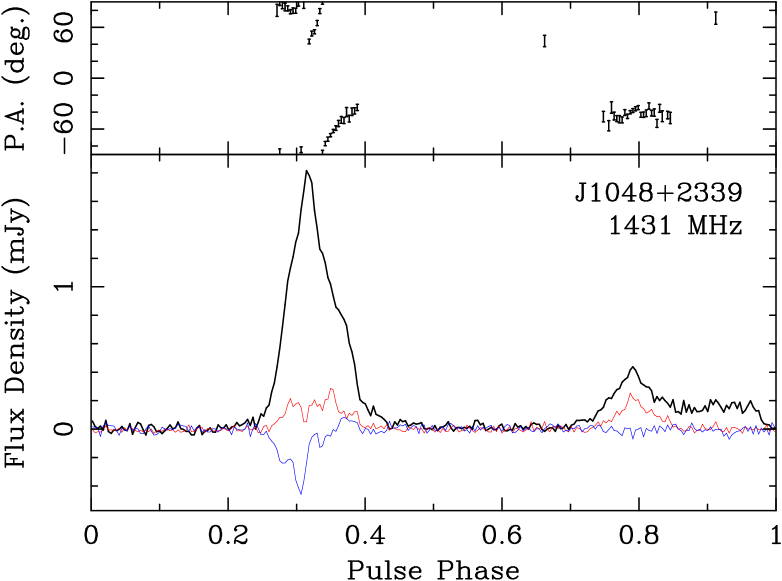
The coherently dedispersed L-wide data were analyzed with PSRCHIVE (Hotan et al., 2004) and Figure 4 shows the calibrated full-Stokes pulse profile averaged from the two observations. The brightest component of the main pulse exhibits significant circular polarization, while the interpulse is linearly polarized. The pulse profile and linear polarization vector position angle are consistent between the two observations. The calibrated period-averaged flux densities are mJy and mJy, assuming a 20% uncertainty. The estimated rotation measure is rad m-2, consistent with zero.
We computed the flux density from our search-mode observations at other frequencies (where calibrated flux density measurements were not available) using the radiometer equation (Lorimer & Kramer, 2012). At 327 MHz, out of 80 data sets we excluded those spanning ingress, egress, or containing “mini-eclipses” and calculated a period-averaged flux density from each of the remaining 47 data sets. The 327 MHz Arecibo receiver has gain K/Jy222http://www.naic.edu/~astro/RXstatus/rcvrtabz.shtml. Nominal receiver temperature is 95 K, including spillover333http://www.naic.edu/~phil/cal327/327Calib.html. Scaling the 408 MHz sky temperature (Haslam et al., 1982) to 327 MHz yields K. Overall, K. The range of flux density values we obtain is 0.5–5.3 mJy, with a mean of 1.6 mJy and a standard deviation of 1.1 mJy.
We also analyzed two Robert C. Byrd Green Bank Telescope (GBT) observations at 820 MHz from an earlier search of the Fermi source 3FGL J1048.6+2338 where the pulsar was not detected in a blind periodicity search, but a pulsed signal became evident after the data were folded with our radio ephemeris. The observations used the GUPPI backend with a bandwidth of 200 MHz. The 820 MHz receiver has K/Jy and K444http://wwwlocal.gb.nrao.edu/gbtprops/man/GBTpg/node14_mn.html. The observation times are 10 and 99 minutes, and we obtain period-averaged flux densities of and 0.11 mJy, respectively.
The difference in flux densities between observations at each of the three observing frequencies indicates significant scintillation and/or variability. Because of this, and the fact that we have only two observations at 820 MHz and three at 1430 MHz, we refrain from calculating a spectral index, but it appears compatible with that of a typical pulsar.
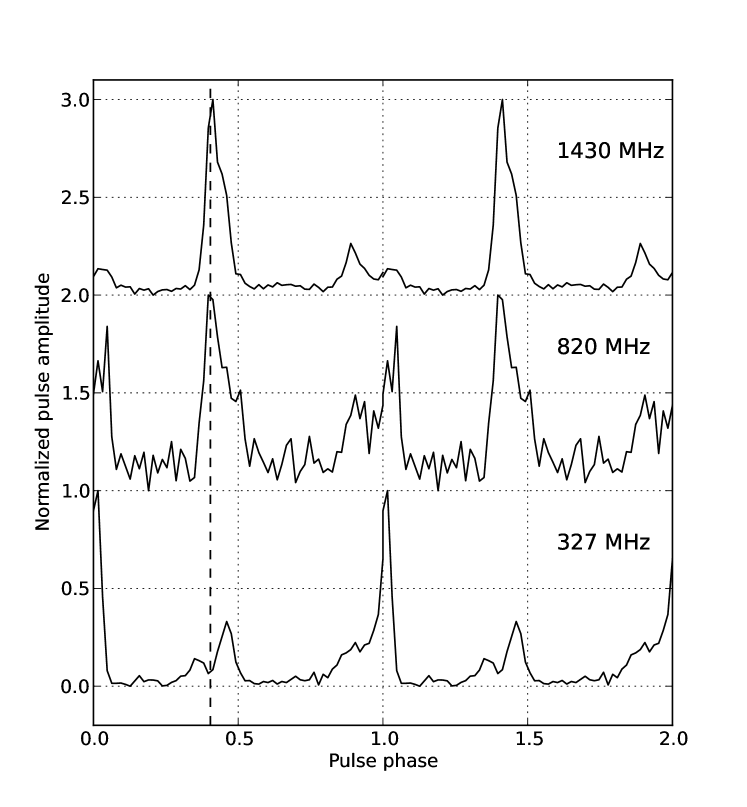
Figure 5 shows averaged pulse profiles at 327, 820, and 1430 MHz aligned in phase using the radio ephemeris. There is significant profile evolution with frequency: the pulse at phase is brighter at 327 MHz but becomes weaker than the interpulse as the frequency increases. Within the interpulse at phase in Figure 5, the trailing component is brighter at 327 MHz but the leading component dominates at the higher frequencies.
3 Optical Observations
3.1 Catalina Real Time Transient Survey
Using the radio timing position, we identified a 20th magnitude candidate optical counterpart to PSR J1048+2339 in the Catalina Real-Time Transient Survey (CRTS, Drake et al. 2009) second data release. The Catalina ID number of the star is 1123054021805.
We extracted 8 years of CRTS data on this star, consisting of 403 observations on 119 nights from 2005 April 10 to 2013 June 3 (Figure 6a). On a typical night, four unfiltered 30 s exposures of a field are taken within 30 minutes, and the photometry is expressed as magnitudes (discussed in Section 6.3). The limiting magnitude is as we infer from those points whose error bars are mag.
We first transformed the times of the data to barycentric dynamical time for consistency with the radio pulsar ephemeris. Magnitudes were converted to fluxes, which were normalized by the variance of the data (Horne & Baliunas, 1986), and a Lomb-Scargle periodogram (Scargle, 1982) was calculated around the radio pulsar’s orbital period. In this analysis we omitted high points that are clear outliers from the mean light curve, because they add noise at all frequencies. This was done crudely by excluding the 25 points with . Although some may just be statistical fluctuations, 19 of them can be considered confirmed outliers because there are at least two on the same night. Examples of excluded points are the four brightest in Figure 6a, with magnitudes 18.12–17.59 on MJD 54536 (2008 March 11). They clearly represent some sort of flare, a non-stationary process. This simple procedure may cause us to underestimate the normal maximum flux, and it does not account for smaller flares that may occur during fainter phases of the orbit; i.e., we do not iterate the selection of outliers based on their phase in the folded light curve.
A strong signal (Figure 6b) is detected at d, consistent with the more precise orbital period of the radio pulsar, d. The noise power in the periodogram is measured to be exponentially distributed with a mean of 2.06 (not 1 as expected for white noise, due to the closely correlated times of the nightly points), so the peak power of 42.0 has a single-trial chance probability of .
Since the optical search found a period consistent with the radio pulsar’s orbital period, we folded the data on the precise radio ephemeris. More precisely, we used the orbital period and time of ascending node, but not the period derivative(s), as the latter are known to wander on long timescales in such systems and can become either positive or negative, as seen in Arzoumanian et al. (1994) and Pletsch & Clark (2015). For the purpose of displaying the folded data (Figure 7a), we restored the high points previously omitted as flares in the periodogram analysis. Finally, we calculated a mean light curve by averaging the points (by flux, but not weighted by error bars) in 30 bins in orbital phase while excluding the flaring points. The mean light curve is displayed in the inset of Figure 7a.
3.2 Palomar Transient Factory
We also extracted observations of PSR J1048+2339 from the Palomar Transient Factory (PTF, Law et al. 2009; Rau et al. 2009). Only nine -filter measurements were made over 2012 March 23–27, but they fortuitously cover a large fraction of the orbit, with smaller errors than CRTS. As shown in Figure 7b, the shape of the modulation is very much like the mean CRTS light curve, and has the same total amplitude of mag.
3.3 Sloan Digital Sky Survey
The Sloan Digital Sky Survey (SDSS, Ahn et al. 2012) photometric catalog lists the optical counterpart of PSR J1048+2339 at position (J2000.0) R.A., decl.. The observation occurred on 2005 February 4 (MJD 53405.39) at phase 0.96 of the binary orbit. The SDSS PSF magnitudes are . We used the equations of Lupton (2005)555https://www.sdss3.org/dr8/algorithms/sdssUBVRITransform.php#Lupton2005 to transform these to the Johnson system, giving . This is useful, as the CRTS unfiltered magnitude is not a good approximation to Johnson for red stars. Knowing the color, a more precise calibration of CRTS is given as (Drake et al., 2013). At , from the binned light curve in Figure 7a, therefore , in excellent agreement with from the SDSS. The total range of the light curve, neglecting any color changes, is then . In principle, one could get some information about the color variation around the orbit by comparing the CRTS and PTF light curves. But the sparseness of the PTF data, and the poor sensitivity of the CRTS data around the minimum of the light curve, do not enable such a variation to be measured robustly.
3.4 Pan-STARRS
PSR J1048+2339 was also detected by the Pan-STARRS PS1 survey (Chambers et al., 2006; Kaiser et al., 2006). The Pan-STARRS survey has been photometrically calibrated using a two-stage approach. In the first stage, photometrically stable nights are identified and the system zero points and a modest number of other parameters are determined based on the relative photometry overlaps, resulting in systematic uncertainties of (, , , , ) = (8.0, 7.0, 9.0, 10.7, 12.4) mmag (Schlafly et al., 2012). In the second stage, the resulting zero points are used to tie the remainder of the data to this internal system (Magnier et al., 2013), with the overall photometric system tied to the AB system via spectrophotometric standards (Tonry et al., 2012).
There have been to date three image processing pipeline versions, designated PV1, PV2, and PV3. PV2 is currently the most reliable astrometrically, but yields fewer total detections than PV3 because it covers fewer epochs. The shorter wavelengths give smaller uncertainties in position. Using 16 detections in the and filters (mean epoch MJD 55674) and assuming a 50 mas error radius to allow for unknown systematics, we find (J2000.0) R.A., decl..
PV3 is preferred for photometry, being better calibrated and more complete. For PSR J1048+2339, PV3 yields 75 useful detections (by a point-spread function goodness-of-fit criterion), typically obtained on 6–8 nights per filter, and spanning MJD (2010 February 15 – 2015 January 21). Figure 8 shows the light curves of PSR J1048+2339 in all five bands, with orbital phase calculated using the same method as for the CRTS and PTF data (see Section 3.1). Phase coverage is non-uniform in all filters. Nevertheless, it is evident that the amplitude of modulation is a decreasing function of wavelength; and span more than 1.0 mag, while the other bands are less variable. This is expected for a heating effect, where brighter regions are hotter. In all filters, the minimum occurs at and the maximum at . On the filter data in Figure 8 we superpose the mean unfiltered CRTS light curve from the inset of Figure 7, without any renormalization. These two light curves bear some resemblance, although both and have considerably higher amplitude of modulation than CRTS. The small number but high accuracy of the Pan-STARRS points leaves an impression that intrinsic variation may be frequent, while it is smoothed out in the CRTS mean light curve that comprises a much larger number of less precise measurements.
4 Gamma-ray Counterpart
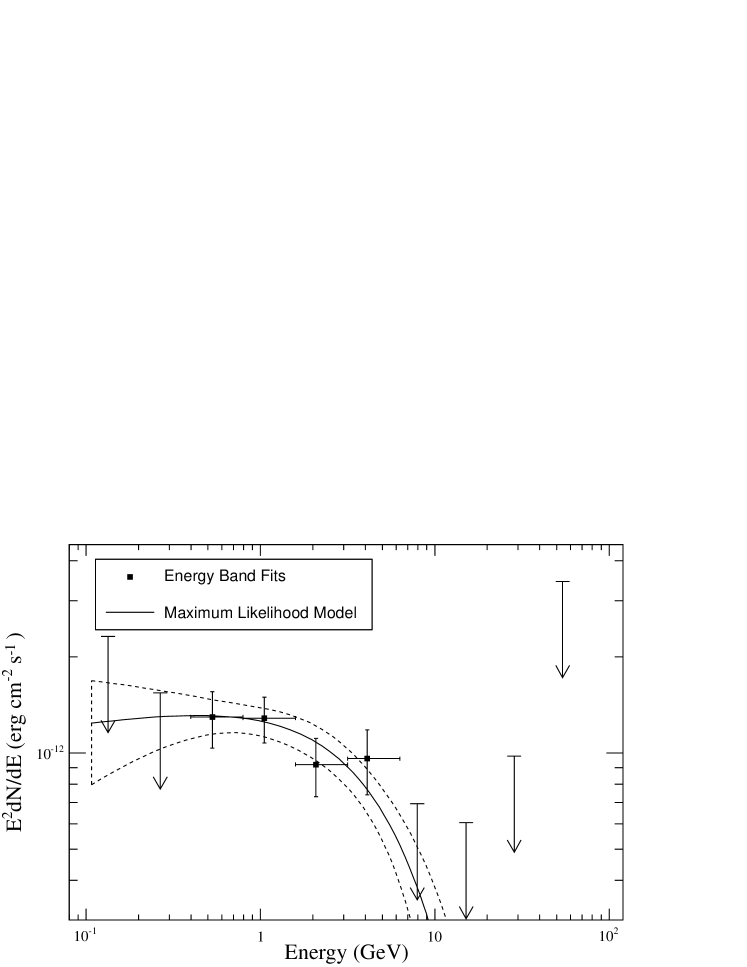
We performed a spectral analysis of the gamma-ray source 3FGL J1048.6+2338 to characterize its spectrum and perform an optimized pulsation search using the weighted H-test (Kerr et al., 2011). We used a subset of the recently released Pass 8 LAT data set starting from 2013 August 4 (the beginning of our phase-connected radio timing solution) and extending through 2015 July 15 (MET 397267203 – 458611204). We selected SOURCE class events (evclass = 128 and evtype = 3) only during the intervals of good science data (DATA_QUAL=1 and LAT_CONFIG=1) and restricted our events to those with a zenith angle less than 90 and energies from 100 MeV to 100 GeV. We selected events from a 15 radius around the source and performed a binned likelihood analysis over a region with 0.1 pixels. The initial model we used was based on the 3FGL catalog (Acero et al., 2015). We modified the spectral model for the target source to be an exponentially cutoff power law of the form
| (1) |
To perform the maximum likelihood fit, we used the P8R2_SOURCE_V6 instrument response functions with the Fermi Science Tools version 10-00-05 and the NewMinuit fitting function. In the initial fit, we held all parameters fixed at the 3FGL catalog values except for the spectral parameters for the target source, and the normalization for sources within 6 of the target or flagged in the 3FGL catalog as being variable. With the exponentially cutoff power-law (ECPL) model, the source is detected with a test statistic (TS) of 228, corresponding to 15 (Mattox et al., 1996). Integrating the spectral model over the range 100 MeV to 100 GeV yields a photon flux of ph cm-2 s-1 and an energy flux of erg cm-2 s-1. The photon spectral index is and the cutoff energy is GeV. Figure 10 shows the spectral fit. When we fit with a simple power law and integrate over the same energy range, we find a photon flux of ph cm-2 s-1, an energy flux of erg cm-2 s-1, and a spectral index of . The ECPL model is weakly preferred with the cutoff detected at a significance of only 1.3 .
For the gamma-ray timing analysis, we selected photons from a region of radius 2 around the pulsar and assigned weights based on the best-fit spectral model. We compute a pulse phase for each selected LAT photon using the fermi plugin for Tempo2 (Ray et al., 2011) and the best-fit radio timing model. The resulting weighted H-test value was 18.8, corresponding to a significance of 3.45, not enough for a high-confidence claim of a pulsed detection. It is not feasible to extend the span of gamma-ray timing analysis earlier than the start of our radio timing solution due to the significant orbital period variations that are the hallmark of PSR J1048+2339. However, the H-test value improves as the radio timing solution and correspondingly the gamma-ray timing span are extended forward with the accumulation of more radio observations. This suggests that a confident detection of gamma-ray pulsations is likely with more years of radio timing data and an improved timing model that includes proper motion and possibly higher-order orbital period derivatives.
5 No X-ray Detection
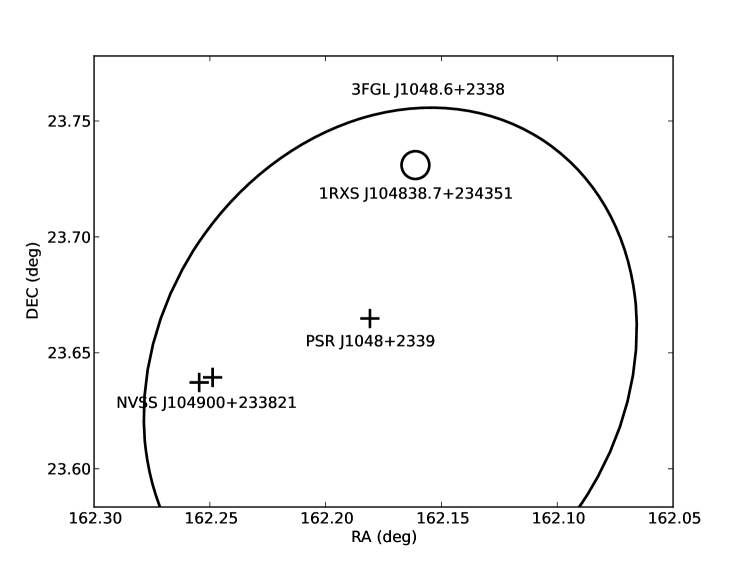
A single Swift XRT observation exists of the field in Figure 9, taken on 2011 January 19 in Photon Counting mode for an exposure of 1.2 ks (ObsID 00041540001). The mid-time of the exposure falls at , which is near the maximum in the optical light curves. Only three counts were detected inside a circular radius 47′′ around the position of PSR J1048+2339 which is consistent with a non-detection of any X-ray source. We derive an absorbed 0.5–3.0 keV 3- upper limit of erg s-1 cm-2 for a 0.2 keV blackbody neutron star surface with the estimated Galactic hydrogen column density for the pulsar position, cm-2 (Kalberla et al., 2005). For the AGN NVSS J104900+233821 we derive an upper limit of erg s-1 cm-2 for an assumed X-ray power-law index of 1.8 and the same Galactic hydrogen column density.
The X-ray source 1RXS J104838.7+234351, also shown in Figure 9, is within the error ellipse of the Fermi source 3FGL J1048.6+2338. Since the position uncertainties for both the X-ray source and PSR J1048+2339 are much smaller than the distance between the two objects, an association can be ruled out.
6 Discussion
6.1 Association with the Gamma-ray Source
The sources for our radio search were selected from a preliminary version of the Fermi 3FGL catalog (Cromartie et al., 2015). In the final version of this catalog (Acero et al., 2015), the source 3FGL J1048.6+2338 is listed as associated with the BL Lac active galactic nucleus NVSS J104900+233821. However, the association was made by a pipeline based on positional proximity and the radio flux density distribution of NVSS sources. While most pulsars exhibit gamma-ray spectra that can be fitted by a power law with an exponential cutoff, for weaker gamma-ray sources the spectrum shape may be ambiguous and be equally well-fitted with a power law, which is typical of AGNs. The discovery of PSR J1048+2339 well within the Fermi source error ellipse (Figure 9) means that the AGN association is likely spurious. A secure detection of gamma-ray pulsations from this pulsar will confirm the identification with 3FGL J1048.6+2338 and allow a search for emission from the NVSS source by gating the data to include only the off-pulse phase of the pulsar.
6.2 Position, Proper Motion, and Pulsar Energetics
The SDSS and Pan-STARRS optical positions are (J2000.0) R.A., decl. at epoch 2005 and (J2000.0) R.A., decl. at epoch 2011, respectively. While they are consistent within their respective uncertainties, the radio timing position in Table 1, with end figures (1) and , is offset from them by mas.
The PPMXL catalog (Roeser et al., 2010) includes the optical counterpart of PSR J1048+2339, with components of proper motion mas yr-1, mas yr-1. The APOP catalog of proper motions outside of the Galactic plane (Qi et al., 2015) also has an entry for this object, with mas yr-1, mas yr-1. The discrepancies between these results give some idea of the systematic errors involved, since they both derive from the same plate material, the Palomar Observatory Sky Survey.
The pulsar position, proper motion, and orbital period derivatives are highly covariant in the timing analysis. Despite having two years of radio timing data on PSR J1048+2339, we are still not able to confidently fit for proper motion along with the five orbital period derivatives listed in Table 1. This means that any actual proper motion is subsumed in the fits for and position. The timing solution in Table 1 uses the APOP proper motion as a fixed parameter and results in the smallest rms residual. However, we are also able to obtain phase-connected timing solutions using several alternative sets of free parameters: (1) position, proper motion, and , (2) position, , and , and (3) position, , , and . Based on the spread of position fits between these timing solutions, we conclude that the position in the timing solution listed in Table 1 is consistent with the SDSS and Pan-STARRS optical positions within a remaining systematic error of mas.
The present-epoch error ellipse for the PPMXL position, taking into account the proper motion uncertainty, encompasses best-fit positions from all of our attempted timing solutions described above. The present-epoch error ellipse for the APOP position is within our systematic error of mas from the best-fit positions of all timing solutions. When it becomes possible to fit confidently for proper motion in our timing solution, the resulting position will very likely converge to that of the optical counterpart.
The observed rotation period derivative includes a kinematic component (Shklovskii, 1970), where is the total proper motion. At the NE2001-estimated distance of 0.7 kpc, we calculate s s-1 using PPMXL and s s-1 using APOP total proper motions, which contribute, respectively, 4% or 12% of the observed s s-1. Given the evident systematic errors, we assume only an upper limit on proper motion of mas yr-1, corresponding to a tangential velocity km s-1 at kpc. This would imply a % reduction to the apparent pulsar spin-down luminosity of erg s-1 ().
The gamma-ray luminosity can be computed following Abdo et al. (2013), equation 15. Assuming , and using the DM distance of 0.7 kpc, the gamma-ray luminosity is erg s-1. This yields an efficiency of 2.4%. This is consistent with, but on the low end of the distribution of, efficiencies observed for LAT-detected MSPs (Abdo et al., 2013). Any kinematic corrections to the spin-down will serve to increase the efficiency.
6.3 Interpreting the Optical Modulation
The most consistent feature of the optical light curves is the minimum at . This accords with the expectation for pulsar wind heating of the companion star, as phase 0.25 corresponds to inferior conjunction of the companion, when we are viewing its cold side. The consistent alignment also implies that a constant radio period serves well to extrapolate the orbital phase over the previous 9 yr. On the other hand, the light curves do not have the symmetric heating maximum around expected in this scenario. Rather, the flux is higher at and decreases toward . This resembles a similar sloping feature in the optical and X-ray light curves of the transitioning millisecond pulsar PSR J1023+0038 when in its radio-pulsar state (Woudt et al., 2004; Bogdanov et al., 2011). It could indicate that the heating is asymmetric because it does not come directly from the pulsar, but is mediated by an intrabinary shock that has a skewed shape near the companion. Alternatively, the shape of the light curve may be affected by the magnetic field of the companion directly channeling the pulsar wind to localized regions on its surface (Tang et al., 2014; Li et al., 2014).
Spectral hardening around seen in the Pan-STARRS data is generally consistent with heating due to irradiation from the pulsar. The amplitude of modulation is about 0.8 magnitudes in , , and , but it increases to magnitudes in and . The departure from the expected symmetry around in the Pan-STARRS data is even more pronounced than in CRTS, which, because of the smaller number of Pan-STARRS points, may indicate that stochastic variability is prevalent. Some measurements in the same filter differ by as much as magnitudes at the same orbital phase.
There may be some significance to the fact that the peak in the apparent heating effect is displaced toward orbital phases earlier than 0.75 in both CRTS and Pan-STARSS. An earlier peak implies that the trailing side of the companion, seen while it is moving away from the observer, is hotter than the leading side. This may indicate where the intrabinary shock is closest to the surface of the companion and illuminating it with the greatest geometrical covering factor. In his prediction for “hidden” millisecond pulsars of type II, Tavani (1991) argued that the wind ablated from the companion would be displaced in the direction of orbital motion (leading) due to the Coriolis force. This would force the shock away from the companion in the leading direction, possibly leaving the more efficient heating to the trailing side.
Any more detailed interpretation of the optical modulation is hampered by the evident intrinsic variability in the CRTS and Pan-STARRS data on timescales that are not yet fully explored. However, it would be interesting with new data to relate well-sampled optical light curves to the orbital phase distribution of the radio eclipses, to see if both can be explained by the geometry of the ablated wind.
In addition to heating, there may be some modulation due to our changing view of the tidally distorted surface of the companion, nearly filling its Roche-lobe. Such ellipsoidal modulation produces maxima of equal height at and 0.5, and unequal minima at and 0.75, the latter one being lower. This effect dominates the light curve of the 5 hr period redback PSR J16283205 (Li et al., 2014) and others, e.g., Bellm et al. (2013); Hui et al. (2015). However, the maximum ellipsoidal amplitude is only expected to be mag, while the mean light curve of PSR J1048+2339 varies by mag. Also, the two local minima in the mean CRTS light curve are not separated by 0.5 in phase, but more like 0.6. It is possible that ellipsoidal modulation is a small contributor even though it cannot explain the gross features of the light curve of PSR J1048+2339.
6.4 The Companion Star
We would like to know the intrinsic colors of the companion star to estimate its spectral type and radius. While the Pan-STARRS photometry represents the best broad-band spectral information currently available on this object, its sparse observations, together with the substantial variability of the source, both orbital and random, prevents a reliable color from being obtained from those exposures, which were taken more than 16 minutes apart. In contrast, the single-epoch SDSS photometry was acquired within 5 minutes, which is why we used the magnitudes transformed from the SDSS to calibrate the CRTS light curve approximately (see Section 3.3). The conclusions that follow from this are tentative, and must be tested with detailed temperature measurements and modeling of the orbital light curve.
Assuming that we are viewing the orbit nearly edge-on (), at represents the unheated side of the companion. At the DM distance of kpc, the interstellar extinction measured from Pan-STARRS and 2MASS photometry is (Green et al., 2015), so the extinction-corrected apparent magnitude is and the absolute magnitude is , suggesting a main-sequence star of spectral type M4, which has a radius of and an effective temperature of K. (If , the phase of minimum light represents a mixture of spectral types both hotter and cooler than M4.) But the SDSS colors at , near quadrature, correspond to an earlier spectral type, around K6. Therefore, we can assume that the heated side of the companion is, on average, hotter than a K6 star, or .
Given the pulsar’s apparent spin-down luminosity, erg s-1 corrected for proper motion, we can estimate the efficiency of pulsar heating during the bright phase of the optical light curve. Assuming an average K for the heated half of the star, its extra luminosity at phase 0.75 can be expressed in terms of the heating efficiency of an assumed isotropic pulsar wind as , where is the orbital separation. (Other authors use a factor of here instead of our .) For an assumed NS mass of and an orbital inclination of , and . Therefore, pulsar heating is only marginally able to power the observed peak luminosity, because the needed efficiency is .
There are a number of theoretical reasons that should not exceed 0.5, as summarized by Li et al. (2014). However, Breton et al. (2013) estimated an efficiency in the range for the four systems they modeled, while Schroeder & Halpern (2014) found for the black widow PSR J1810+1744. Romani et al. (2015b) modeled the redback PSR J2215+5135 with , and Romani et al. (2015a) found for the black widow PSR J13113430. So more complex physical effects are clearly having an important influence. One way to reduce the inferred efficiency is to assume that the pulsar wind is beamed in the orbital plane in this system, or channeled by the intrinsic magnetic field of the companion.
With an estimated from its optical properties, the companion appears to significantly underfill its Roche lobe, which has radius (Eggleton et al., 1983) for . This would reduce any ellipsoidal modulation. If we could double the distance to 1.4 kpc, then the companion could be an M2 star with K and fill its Roche lobe. But the difficulty of pulsar wind heating would not be ameliorated much because would become only slightly smaller, , for the same used above. However, these conclusions are sensitive to the effective and the inclination , both of which remain to be measured.
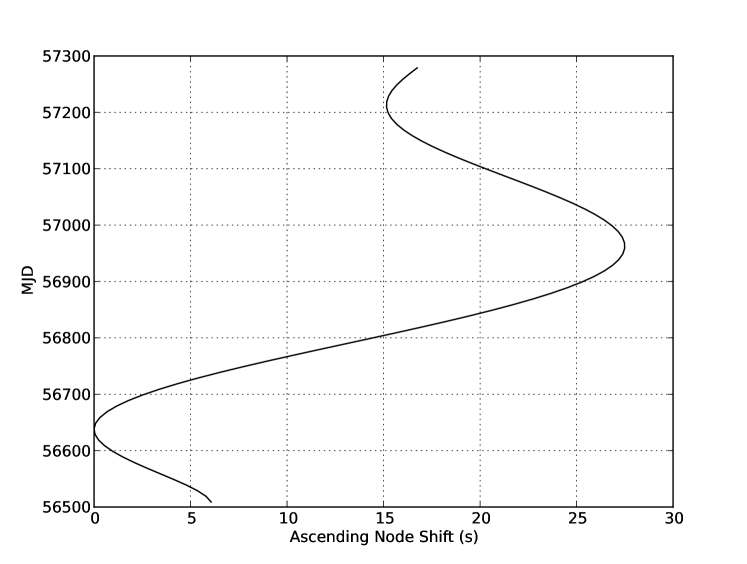
6.5 Orbital period variations
Figure 11 illustrates the orbital period variations of PSR J1048+2339. Large orbital period variations are known to occur in other redback systems such as PSR J1023+0038 (Archibald et al., 2013) and J23390533 (Pletsch & Clark, 2015). Quasi-periodic changes in the gravitational quadrupole moment of the companion have been proposed to explain observations showing the orbital period to oscillate (Matese & Whitmire, 1983). Several other effects can contribute to orbital period variations: (1) energy dissipation via gravitational wave emission, (2) mass loss, and (3) Doppler shifts due to the Shklovskii effect (Shklovskii, 1970) or Galactic rotation. However, they would result in a monotonic change in and therefore cannot adequately explain the observed orbital period variations.
Applegate (1992) relates oscillations in the gravitational quadrupole moment of a non-degenerate companion star to a cycle of magnetic activity similar to the 11-year Solar cycle. The changing magnetic field generates a variable torque between the convective outer layer and radiative inner layer of the star. The torque causes angular momentum to be exchanged between the layers in a quasi-periodic manner, causing changes in the differential rotation between the layers and therefore in the shape of the star. Spin-up of the outer layer corresponds to the star becoming more oblate and to an increase in the gravitational quadrupole moment. Since the total angular momentum in the binary system is conserved, this causes a decrease in the orbital period. Pletsch & Clark (2015) give an overview of the literature and apply the Applegate model to the orbital period variations of PSR J23390533. We note that since this model relies on convective and radiative layers being present and stars with mass are fully convective, it implies that the companion of PSR J1048+2339 is more massive than the minimum companion mass and the orbital inclination is .
Following the same procedure as Pletsch & Clark (2015), we obtain a modulation of with a period of years and amplitude s-1. Using , and estimated companion radius (Section 6.4), we derive the change in the luminosity of the companion that would account for the energy needed for angular momentum transfer, erg s-1 (Eqn. 13 from Pletsch & Clark 2015). Based on the estimated companion effective temperature K (Section 6.4), its total luminosity is erg s-1. Since the energy budget for the angular momentum transfer is only of the companion’s intrinsic luminosity, the companion has sufficient energy output to generate the orbital period fluctuations even if the orbital inclination (assumed to be 90∘) is overestimated, or or are underestimated.
7 Conclusions
The discovery of the redback pulsar J1048+2339 in a Fermi unassociated source and the interesting phenomenology in this binary system add a valuable data point for studies of this still not very well understood class of pulsars. Our radio observations show extensive eclipses around superior conjunction as well as sporadic “mini-eclipses” at other orbital phases and an occasional long-term absence of pulsed radio emission even near inferior conjunction. This indicates that the ionized gas environment in the system is very dynamic and changes significantly on time scales of hours to days. The radio timing solution that best predicts pulse arrival times includes a fixed proper motion from the APOP catalog (Qi et al., 2015) and five orbital period derivatives. A likely explanation of the rapid orbital period variations is quasi-periodic changes in the gravitational quadrupole moment of the companion due to a magnetic torque mechanism similar to that at play in the 11-year Solar cycle.
PSR J1048+2339 has a 20th magnitude optical counterpart detected by SDSS, CRTS, PTF, and Pan-STARRS, whose intensity modulation matches the pulsar orbital period. Its magnitude and colors are consistent with those of an M4 main-sequence star on the “night” side. While the optical light curve has the expected minimum at , corresponding to inferior conjunction of the companion, it does not exhibit a well-defined maximum at . This can be explained by heating not directly from the pulsar but from an asymmetric intra-binary shock. Alternatively, the companion magnetic field may be channeling the pulsar wind to specific regions on the companion’s surface that get heated preferentially.
We did not find an X-ray counterpart in an existing short Swift observation of the field containing PSR J1048+2339. The two-year span of the radio ephemeris does not allow a confident detection of gamma-ray pulsations. Due to the rapid orbital period variations, for the gamma-ray timing analysis we can use only Fermi data taken within the radio ephemeris time limits. However, the H-test value of a potential gamma-ray pulsation detection improves as the span of the radio timing solution grows, indicating that detection of gamma-ray pulsations is likely as we extend and improve the PSR J1048+2339 timing solution within the next 1–2 years.
J.S.D. was supported by the Chief of Naval Research and a Fermi Guest Investigator grant. The Arecibo Observatory is operated by SRI International under a cooperative agreement with the National Science Foundation (AST-1100968), and in alliance with Ana G. Méndez-Universidad Metropolitana, and the Universities Space Research Association. The Green Bank Telescope is part of the National Radio Astronomy Observatory, a facility of the National Science Foundation operated under cooperative agreement by Associated Universities, Inc.
The CSS survey is funded by the National Aeronautics and Space Administration under Grant No. NNG05GF22G issued through the Science Mission Directorate Near-Earth Objects Observations Program. The CRTS survey is supported by the U.S. National Science Foundation under grant AST-0909182. The Pan-STARRS Surveys (PS1) have been made possible through contributions of the Institute for Astronomy, the University of Hawaii, the Pan-STARRS Project Office, the Max-Planck Society and its participating institutes, the Max Planck Institute for Astronomy, Heidelberg and the Max Planck Institute for Extraterrestrial Physics, Garching, The Johns Hopkins University, Durham University, the University of Edinburgh, Queen’s University Belfast, the Harvard-Smithsonian Center for Astrophysics, the Las Cumbres Observatory Global Telescope Network Incorporated, the National Central University of Taiwan, the Space Telescope Science Institute, the National Aeronautics and Space Administration under Grant No. NNX08AR22G issued through the Planetary Science Division of the NASA Science Mission Directorate, the National Science Foundation under Grant No. AST-1238877, the University of Maryland, and Eotvos Lorand University (ELTE) and the Los Alamos National Laboratory.
The Fermi-LAT Collaboration acknowledges generous ongoing support from a number of agencies and institutes that have supported both the development and the operation of the LAT as well as scientific data analysis. These include the National Aeronautics and Space Administration (NASA) and the Department of Energy in the United States, the Commissariat à l’Energie Atomique and the Centre National de la Recherche Scientifique/Institut National de Physique Nucléaire et de Physique des Particules in France, the Agenzia Spaziale Italiana and the Istituto Nazionale di Fisica Nucleare in Italy, the Ministry of Education, Culture, Sports, Science and Technology (MEXT), High Energy Accelerator Research Organization (KEK) and Japan Aerospace Exploration Agency (JAXA) in Japan, and the K. A. Wallenberg Foundation, the Swedish Research Council and the Swedish National Space Board in Sweden. Additional support for science analysis during the operations phase is gratefully acknowledged from the Istituto Nazionale di Astrofisica in Italy and the Centre National d’Études Spatiales in France.
References
- Abdo et al. (2009) Abdo, A. A., et al. 2009, Science, 325, 848
- Abdo et al. (2013) Abdo, A. A., et al. 2013, ApJS 208, 17
- Acero et al. (2015) Acero, F., et al. 2015, ApJS, 218, 23
- Ahn et al. (2012) Ahn, C. P., et al. 2012, ApJS, 203, 21
- Applegate (1992) Applegate, J. H. 1992, ApJ, 385, 621
- Archibald et al. (2009) Archibald, A. M., Stairs, I. M., Ransom, S. M., et al. 2009, Science, 324, 1411
- Archibald et al. (2013) Archibald, A. M., et al. 2013, arXiv:1311.5161
- Arzoumanian et al. (1994) Arzoumanian, Z., Fruchter, A. S., & Taylor, J. H. 1994, ApJL, 462, L85
- Bates et al. (2013) Bates, S. D., Lorimer, D. R., & Verbiest, J. P. W. 2013, MNRAS, 431, 1352
- Bellm et al. (2013) Bellm, E., Djorgovski, S. G., Drake, A., et al. 2015, arXiv:1510.00721
- Blandford & Teukolsky (1976) Blanford, R., & Teukolsky, S. A. 1976, ApJ 205, 580
- Breton et al. (2013) Breton, R. P., van Kerkwijk, M. H., Roberts, M. S. E., et al. 2013, ApJ, 769, 108
- Bogdanov et al. (2011) Bogdanov, S., Archibald, A. M., Hessels, J. W. T., et al. 2011, ApJ, 742, 97
- Chambers et al. (2006) Chambers, K., & the Pan-STARRS Team 2006, AMOS Conf. Proc., 386-393
- Cordes & Lazio (2002) Cordes, J. M., & Lazio, T. J. W. 2002, arXiv:astro-ph/0207156
- Cromartie et al. (2015) Cromartie, H. T., Camilo, F., Kerr, M., et al. 2015, ApJ, submitted
- Drake et al. (2009) Drake, A. J., Djorgovski, S. G., Mahabal, A., et al. 2009, ApJ, 696, 870
- Drake et al. (2013) Drake, A. J., Catelan, M., Djorgovski, S. G., et al. 2013, ApJ, 763, 32
- Eggleton et al. (1983) Eggleton, P. P. 1983, ApJ, 268, 368
- Green et al. (2015) Green, G. M., Schlafly, E. A., Finkbeiner, D. P., et al. 2015, ApJ, 810, 25
- Haslam et al. (1982) Haslam, C. G. T., Salter, C. J., Stoffel, H., & Wilson, W. E. 1982, A&AS, 47, 1
- Horne & Baliunas (1986) Horne, J. H., & Baliunas, S. L. 1986, ApJ, 302, 757
- Hotan et al. (2004) Hotan, A. W., van Straten, W., & Manchester, R. N. 2004, PASA, 21, 302
- Hui et al. (2015) Hui, C. Y., Hu, C. P., Park, S. M., et al. 2015, ApJL, 801, L27
- Kaiser et al. (2006) Kaiser, N., & the Pan-STARRS Team 2006, AMOS Conf. Proc., 376-385
- Kalberla et al. (2005) Kalberla, P. M. W. et al. 2005, A&A, 440, 775
- Kerr et al. (2011) Kerr, M., et al. 2011, ApJ, 732, 38
- Law et al. (2009) Law, N. M., Kulkarni, S. R., Dekany, R. G., et al. 2009, PASP, 121, 1395
- Li et al. (2014) Li, M., Halpern J. P., & Thorstensen, J. R. 2014, ApJ, 795, 115
- Lorimer & Kramer (2012) Lorimer, D. R., & Kramer, M. 2012, “Handbook of Pulsar Astronomy”, Cambridge University Press
- Magnier et al. (2013) Magnier, E. A., et al. 2013, 205, 20
- Matese & Whitmire (1983) Matese, J. J., & Whitmire, D. P. 1983, A&A, 117, L7
- Mattox et al. (1996) Mattox, J. R., Bertsch, D. L., Chiang, J., et al. 1996, ApJ, 461, 396
- Nice & Thorsett (1992) Nice, D. J. & Thorsett, S. E. 1992, ApJ, 397, 249
- Pletsch & Clark (2015) Pletsch, H. J., & Clark, C. J. 2015, ApJ, 807, 18
- Qi et al. (2015) Qi, Z., et al. 2015, AJ, 150, 137
- Ransom et al. (2004) Ransom, S. M., Stairs, I. H., Backer, D. J. et al. 2004, ApJ, 604, 328
- Rau et al. (2009) Rau, A., Kulkarni, S. R., Law, N. M., et al. 2009, PASP, 121, 1334
- Ray et al. (2011) Ray, P. S., Kerr, M., Parent, D., et al. 2011, ApJS, 194, 17
- Ray et al. (2012) Ray, P. S. 2012, Fermi Symposium Proceedings, arXiv:1205.3089
- Reich & Reich (1988) Reich, P. & Reich, W. 1988, A&A, 196, 211
- Roberts et al. (2011) Roberts, M. S. E., et al. 2011, AIP Conf. Proc., 1357, 127
- Roberts et al. (2013) Roberts, M. S. E., et al. 2013, IAU Proc., 291, 127
- Roeser et al. (2010) Roeser, S., Demleitner, M., & Schilbach, E. 2010, AJ, 139, 2440
- Romani et al. (2015a) Romani, R. W., Filippenko, A. V., & Cenko, S. B. 2015a, ApJ, 804, 115
- Romani et al. (2015b) Romani, R. W., Graham, M. L., Filippenko, A. V., & Kerr, M. 2015b, ApJL, 809, L10
- Scargle (1982) Scargle, J. 1982, ApJ, 263, 835
- Schlafly et al. (2012) Schlafly, E. F., et al. 2012, ApJ, 756, 158
- Schroeder & Halpern (2014) Schroeder, J., & Halpern, J. 2014, ApJ, 793, 78
- Shklovskii (1970) Shklovskii, I. S. 1970, SvA, 13, 562
- Tang et al. (2014) Tang, S., Kaplan, D. L., Phinney, S., et al. 2014, ApJL, 791, L5
- Tavani (1991) Tavani, M. 1991, ApJL, 379, L69
- Tonry et al. (2012) Tonry, J. L., et al. 2012, ApJ, 750, 99
- Woudt et al. (2004) Woudt, P. A., Warner, B., & Pretorius, M. L. 2004, MNRAS, 351, 1015
| Parameter | ValueaaNumbers in parentheses are 1- uncertainties reported by Tempo. |
|---|---|
| Timing Fit Parameters | |
| Right ascension, (J2000) | bbCorrelations between the orbital variability parameterization and the astrometric parameters result in a systematic uncertainty in the timing position of 250 mas (see Section 6.2). |
| Declination, (J2000) | bbCorrelations between the orbital variability parameterization and the astrometric parameters result in a systematic uncertainty in the timing position of 250 mas (see Section 6.2). |
| Proper motion in (mas yr-1) | ccThe APOP catalog (Qi et al., 2015) value was used as fixed parameter. |
| Proper motion in (mas yr-1) | ccThe APOP catalog (Qi et al., 2015) value was used as fixed parameter. |
| Spin frequency, (Hz) | 214.35478538736(7) |
| Spin frequency derivative, (Hz s-1) | |
| Epoch of timing solution (MJD) | 56897.0 |
| Dispersion measure, DM (pc cm-3) | 16.6544(1)ddDetermined from fit to 327 MHz data only. |
| Time of passage through ascending node, (MJD) | 56637.598177(1) |
| Projected semi-major axis, (lt-s)ee, where is the pulsar orbit semi-major axis and is the inclination angle. | 0.836122(3) |
| Eccentricity | 0 |
| Orbital frequency, (Hz) | |
| 1st orbital frequency derivative, (Hz s-1) | |
| 2nd orbital frequency derivative, (Hz s-2) | |
| 3rd orbital frequency derivative, (Hz s-3) | |
| 4th orbital frequency derivative, (Hz s-4) | |
| 5th orbital frequency derivative, (Hz s-5) | |
| Planetary Ephemeris | DE421 |
| Time Units | TDB |
| Timing span (MJD) | 56508–57285 |
| Number of observation epochs | 26 |
| Number of points in timing fit | 72 |
| Weighted rms post-fit residual (s) | 4.2 |
| Derived Parameters | |
| Galactic longitude, (deg) | 213.17 |
| Galactic latitude, (deg) | 62.139 |
| Mass function () | 0.00100 |
| Surface magnetic field, (G)f,gf,gfootnotemark: | |
| Spin-down luminosity, (erg s-1)g,hg,hfootnotemark: | |
| Characteristic age, (Gyr)g,ig,ifootnotemark: | 2.5 |
| Distance, (kpc)jjBased on DM, sky position, and the NE2001 model of ionized gas in the Galaxy (Cordes & Lazio, 2002). | 0.7 |