11email: marilia.carlos@usp.br 22institutetext: Aarhus University, Stellar Astrophysics Centre, Department of Physics and Astronomy, Ny Munkegade 120, DK–8000 Aarhus C, Denmark
Correlation between lithium abundances and ages of
solar twin stars
††thanks: Based on data products from observations made with ESO Telescopes at
the La Silla Paranal Observatory,
(observing programs 072.C-0488, 183.C-0972, 188.C-0265, and 0.88.C-0323).
Abstract
Aims. We want to determine the lithium abundances of solar twin stars as a function of stellar age to provide constraints for stellar evolutions models and to investigate whether there is a connection between low Li abundance and the occurrence of planets.
Methods. For a sample of 21 solar twins observed with the HARPS spectrograph at high spectral resolution (R 115.000) and very high signal-to-noise ratio (600 S/N 2400), precise lithium abundances were obtained by spectral synthesis of the Li i 6707.8 line and compared to stellar ages, masses, and metallicities determined from a spectroscopic analysis of the same set of HARPS spectra.
Results. We show that for the large majority of the solar twins there is a strong correlation between lithium abundance and stellar age. As the age increases from 1 to 9 Gyr, the Li abundance decreases by a factor of 50. The relation agrees fairly well with predictions from non-standard stellar evolution models of Li destruction at the bottom of the upper convection zone. Two stars deviate from the relation by having Li abundances enhanced by a factor of 10, which may be due to planet engulfment. On the other hand, we find no indication of a link between planet hosting stars and enhanced lithium depletion.
Key Words.:
stars: abundances – stars: evolution – stars: planetary systems1 Introduction
Lithium is destroyed in the inner layers of stars via proton capture () at temperatures near to 2.5x10⁶ K. Because Li burning happens when the element is transported to the innermost and hotter regions through convective motions in the star, Li abundance studies offer an excellent opportunity to understand the extent of the mixing processes within and below the stellar convective zone and, therefore, are important for constraining transport mechanisms in stars.
Since the amount of lithium burning depends on the convective zone thickness, which depends on mass and metallicity, we can improve our understanding of the structure and evolution of a star by analyzing the lithium abundance dependence of these variables. It is important to note that the lithium content could also have other dependencies such as planets around a star; for instance, planetary formation could change the initial angular momentum of the star, which, according to Takeda et al. (2010) and Gonzalez et al. (2010), increases the lithium burning. Another alternative to an anomalous Li abundance is planet engulfment, which may lead to an increase in the Li abundance of a star (Montalbán & Rebolo, 2002; Sandquist et al., 2002).
Although several factors control the level of lithium burning, there is a debate regarding the lithium depletion in solar twin stars. There are two main interpretations. One is that the degree of lithium depletion primarily depends on stellar age, in the sense that older stars have lower Li abundances than younger ones as has been shown by Baumann et al. (2010), Monroe et al. (2013), Meléndez et al. (2014), and Tucci Maia et al. (2015). This is supported by several models such as Andrássy & Spruit (2015), Charbonnel & Talon (2005), Denissenkov (2010), Do Nascimento et al. (2009), and Xiong & Deng (2009). The second interpretation is that enhanced Li depletion is due to the presence of planets (Israelian et al., 2009; Sousa et al., 2010; Delgado Mena et al., 2014; Figueira et al., 2014; Gonzalez, 2015) and that the degree of lithium depletion does not depend on age for stars older than Gyr (Sousa et al., 2010; Delgado Mena et al., 2014).
In this paper we revisit the discussion on lithium abundance depletion in solar twin stars and its correlations with stellar age, metallicity, mass, and planet occurrence based on new, very precise Li abundances derived from HARPS spectra of 21 solar twins with ages between 0.7 and 8.8 Gyr.
2 Spectra and stellar parameters
The solar twin stars included in this paper have been applied by Nissen (2015) to study trends of abundance ratios as a function of stellar age and elemental condensation temperature. The stars were selected from Sousa et al. (2008) to have effective temperatures (), surface gravities (log ), and metallicities ([Fe/H]) close to the solar values and to have HARPS spectra (Mayor et al., 2003) with a signal-to-noise ratio after combination of spectra available in the ESO Science Archive. Furthermore, a solar flux HARPS spectrum observed in reflected sunlight from the asteroid Vesta is available. This spectrum has and was used in a differential analysis of the stars relative to the Sun.
Details about how the HARPS spectra were normalized and used to determine stellar parameters and abundances by a model atmosphere analysis of equivalent widths are given in Nissen (2015). Here we just mention that and log were determined by requesting that the iron abundances derived have no systematic dependence on excitation and ionization potential of the lines applied. The estimated errors of the parameters are K and dex, and abundances were determined with a typical precision of dex. Such extremely high precision is obtainable when high-resolution spectra of solar twin stars with are analyzed strictly differentially (line-by-line) relative to a spectrum of sunlight reflected from an asteroid observed with the same spectrograph as the stars (Bedell et al., 2014).
As seen from Table 1, the solar twin stars range from 5690 to 5870 K in , 4.25 to 4.50 dex in log , and to +0.11 dex in [Fe/H]. Hence, they lie in a region of the - log diagram, where isochrones are not well separated (see Fig. 5 in Nissen, 2015). Still, the small errors of and log make it possible to derive precise ages by comparing with the Yonsei-Yale set of isochrones (Yi et al., 2001; Kim et al., 2002). These ages are given in Table 1 together with stellar masses estimated from the evolutionary tracks of Yi et al. (2003). A precision of is estimated for the masses.
As seen from Table 1, the errors of the ages range from 0.4 to 0.8 Gyr. A comparison with ages derived by Ramírez et al. (2014) from independent high spectra of 14 of the stars shows good agreement within these estimated errors (see Fig. 6 in Nissen, 2015). Furthermore, the abundance ratio [Y/Mg] shows a tight correlation with stellar age in a way that can be explained from the nucleosynthesis of these elements, i.e., delayed production of yttrium in low-mass AGB stars and prompt formation of magnesium in high mass, core collapse supernovae (Nissen, 2015). This correlation supports that the estimated age errors are realistic in a relative sense; the absolute ages for the youngest and the oldest stars could be more uncertain.
3 Analysis
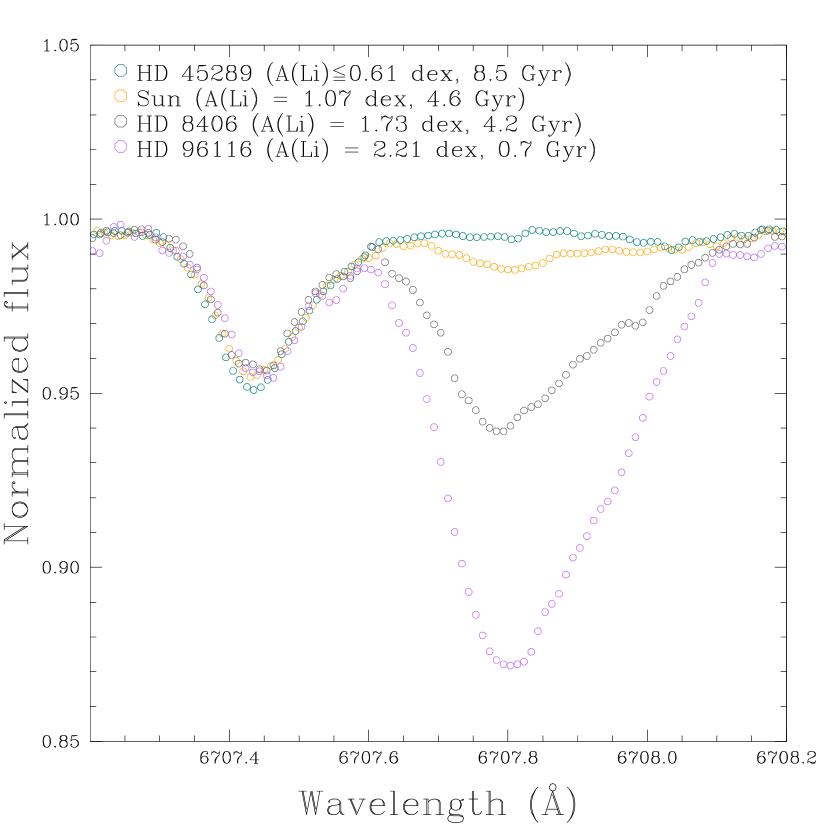
An inspection of the observed spectra (Fig. 1) shows that there is a clear weakening of the Li feature with increasing ages.
In order to obtain the lithium abundances, first we had to estimate the macroturbulence and rotational velocity broadening. The macroturbulence velocity was determined by the equation km s-1 as given in Tucci Maia et al. (2015). From our analysis of the HARPS solar spectrum we estimated km s-1, adopting km s-1 . The projected rotational velocity was calculated by analyzing the line profiles of the Fe I 6027.050 , 6093.644 , 6151.618 , 6165.360 , 6705.102 , and Ni I 6767.772 lines. Notice that the instrumental broadening was also included.
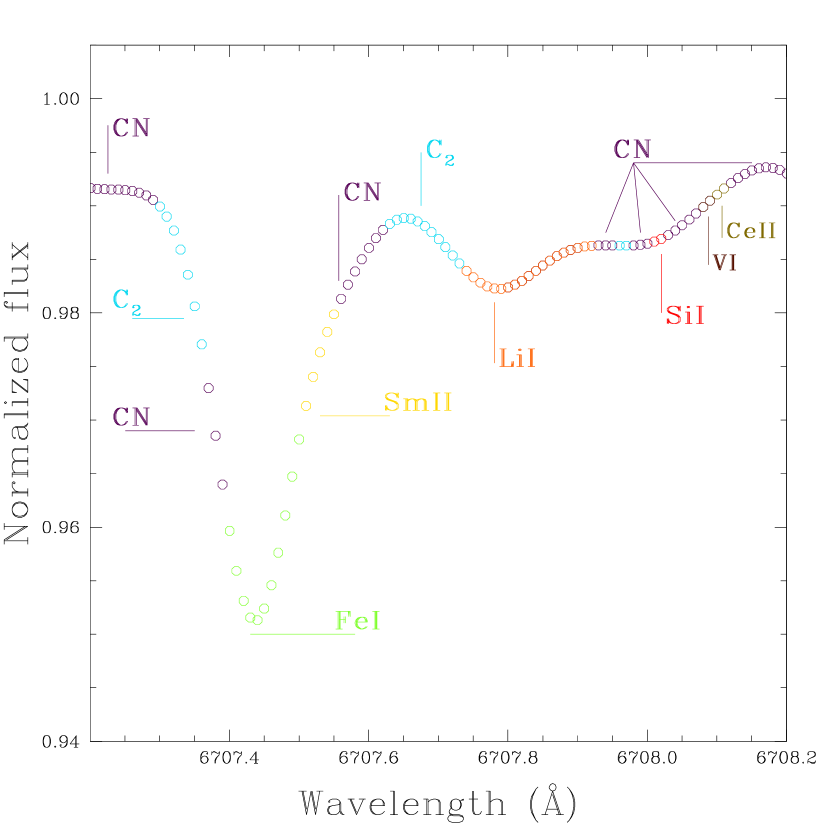
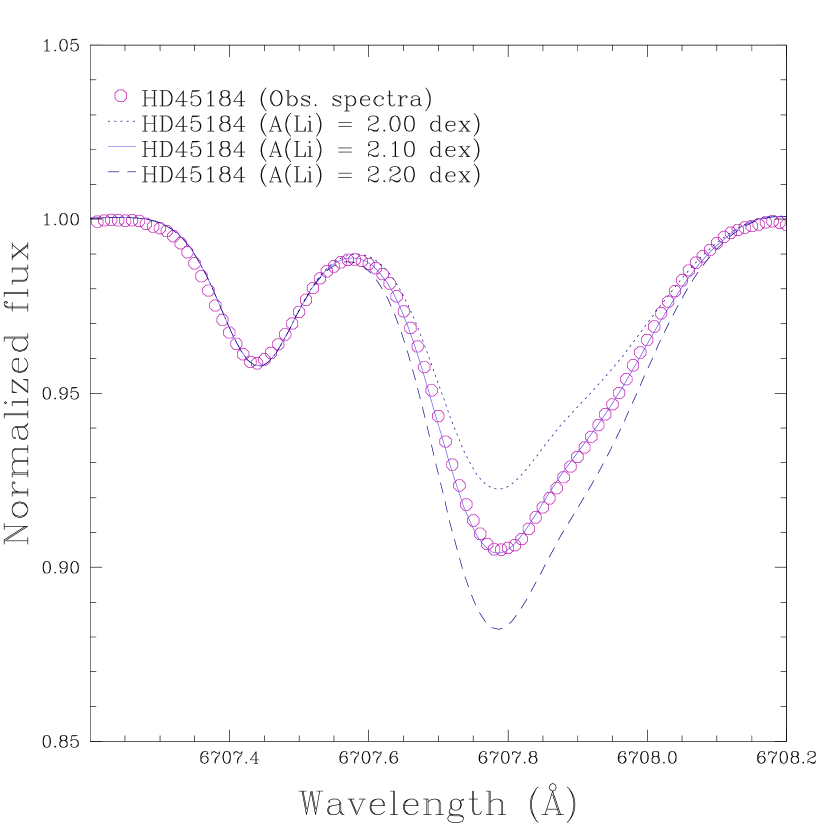
The lithium abundances were estimated by spectral synthesis in the region of the 6707.75 Li i line using the July 2014 version of the 1D LTE code MOOG (Sneden, 1973) and the Kurucz new grid of ATLAS9 model atmospheres (Castelli & Kurucz, 2004). The line list adopted for the Li region is from Meléndez et al. (2012), and includes blends from atomic and molecular (CN and C2) lines; the dependence of the different species is shown in Fig. 2. An example of spectral synthesis for HD 45184 is shown in Fig. 3, where it can be seen that the Li line profile changes very significantly for an abundance difference of 0.1 dex.
The abundances were derived assuming LTE and then NLTE results were obtained with the aid of the INSPECT database111www.inspect-stars.com (version 1.0)., based on NLTE calculations by Lind et al. (2009). The errors were obtained taking into account uncertainties in the continuum setting, the rms deviation of the observed line profile relative to the synthetic profile, and the stellar parameters. Both LTE and NLTE values of (Li) = log( + 12 with their respective errors are shown in Table 1.
| Star |
|
|
|
|
|
|
|
|
||||||||||||||||
|---|---|---|---|---|---|---|---|---|---|---|---|---|---|---|---|---|---|---|---|---|---|---|---|---|
| HD 2071 | 1.39 | 1.43 | 3.5 | 0.8 | 0.97 | 5724 | 4.490 | 0.084 | ||||||||||||||||
| HD 8406 | 1.69 | 1.73 | 4.2 | 0.8 | 0.96 | 5730 | 4.479 | 0.105 | ||||||||||||||||
| HD 20782a𝑎aa𝑎aDetected planet with 1.8 (Jones et al., 2006). | 0.67 | 0.71 | 7.5 | 0.4 | 0.97 | 5776 | 4.345 | 0.058 | ||||||||||||||||
| HD 27063 | 1.67 | 1.71 | 2.6 | 0.6 | 1.04 | 5779 | 4.469 | 0.064 | ||||||||||||||||
| HD 28471 | 0.86 | 0.90 | 7.0 | 0.4 | 0.97 | 5754 | 4.380 | 0.054 | ||||||||||||||||
| HD 38277 | 1.56 | 1.58 | 7.3 | 0.4 | 1.01 | 5860 | 4.270 | 0.070 | ||||||||||||||||
| HD 45184b𝑏bb𝑏bDetected planet with 0.04 (Mayor et al., 2011). | 2.08 | 2.10 | 2.7 | 0.5 | 1.06 | 5871 | 4.445 | 0.047 | ||||||||||||||||
| HD 45289∗∗footnotemark: ∗ | 0.57 | 0.61 | 8.5 | 0.4 | 1.00 | 5718 | 4.284 | 0.020 | ||||||||||||||||
| HD 71334 | 0.58 | 0.62 | 8.1 | 0.4 | 0.94 | 5701 | 4.374 | 0.075 | ||||||||||||||||
| HD 78429 | 0.59 | 0.63 | 7.5 | 0.4 | 1.04 | 5756 | 4.272 | 0.078 | ||||||||||||||||
| HD 88084 | 0.96 | 1.00 | 6.0 | 0.6 | 0.96 | 5768 | 4.424 | 0.091 | ||||||||||||||||
| HD 92719 | 1.88 | 1.90 | 2.7 | 0.6 | 0.99 | 5813 | 4.488 | 0.112 | ||||||||||||||||
| HD 96116 | 2.19 | 2.21 | 0.7 | 0.7 | 1.05 | 5846 | 4.503 | 0.006 | ||||||||||||||||
| HD 96423 | 1.88 | 1.93 | 6.0 | 0.4 | 1.03 | 5714 | 4.359 | 0.113 | ||||||||||||||||
| HD 134664 | 2.08 | 2.11 | 2.3 | 0.5 | 1.07 | 5853 | 4.452 | 0.093 | ||||||||||||||||
| HD 146233 | 1.58 | 1.62 | 3.8 | 0.5 | 1.04 | 5809 | 4.434 | 0.046 | ||||||||||||||||
| HD 183658 | 1.24 | 1.28 | 5.0 | 0.5 | 1.03 | 5809 | 4.402 | 0.035 | ||||||||||||||||
| HD 208704 | 1.05 | 1.08 | 6.9 | 0.4 | 0.98 | 5828 | 4.346 | 0.091 | ||||||||||||||||
| HD 210918∗∗footnotemark: ∗ | 0.67 | 0.71 | 8.5 | 0.4 | 0.96 | 5748 | 4.319 | 0.095 | ||||||||||||||||
| HD 220507∗∗footnotemark: ∗ | ¡0.50 | ¡0.55 | 8.8 | 0.4 | 1.01 | 5690 | 4.247 | 0.013 | ||||||||||||||||
| HD 222582c𝑐cc𝑐cDetected planet with 7.8 (Butler et al., 2006). | 0.89 | 0.93 | 6.5 | 0.4 | 1.01 | 5784 | 4.361 | 0.004 | ||||||||||||||||
| Sun | 1.03 | 1.07 | 4.6 | – | 1.00 | 5777 | 4.438 | 0.000 |
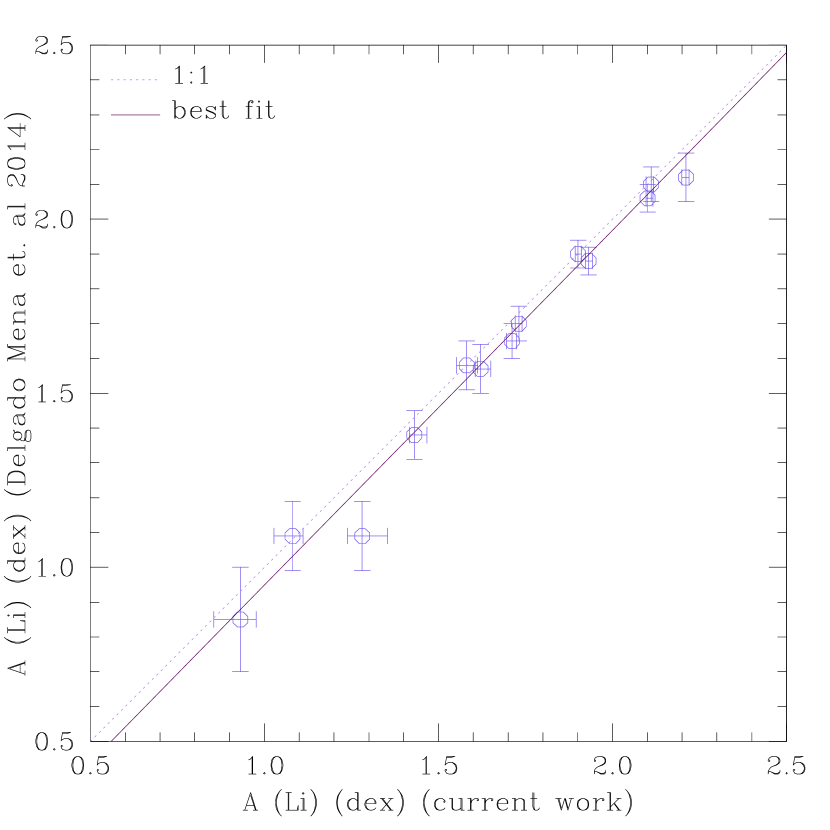
It is important to note that our results in LTE compare well with the large study by Delgado Mena et al. (2014), as shown in Fig. 4. Compared to previous works on solar twins (Monroe et al. (2013) for 18 Sco and HIP 102152, Meléndez et al. (2012) for HIP 56948, Meléndez et al. (2014) for HIP 114328333A new better spectrum of HIP 114328 has been recently acquired by one of the authors (J.M.). The stellar parameters are T K, log = 4.33 0.04 dex and [Fe/H]=-0.050 0.014 dex, resulting in an age of Gyr and mass equal to 1.00 0.01 M⊙. Considering these new results the star fits better now the Li-age trend. and Ramírez et al. (2011) for 16 Cyg A and 16 Cyg B), our results, now in NLTE, follow the same lithium age trend, as illustrated in Fig. 5. The effective temperatures and surface gravities of the stars in these papers were determined in the same way as in Nissen (2015), i.e., by a differential analysis of Fe lines relative to the Sun, and ages were also obtained by interpolating between Yonsei-Yale isochrones. Hence, we expect that the Li abundances and ages are on the same system as in the present paper.
4 Discussion
The results for the whole sample can be seen in Fig. 5, where we notice a strong connection between lithium abundance and stellar age. 16 Cyg A and two stars in our sample, namely HD 96423 and HD 38277, have higher abundances than expected in comparison to both models and the other stars. A possible explanation for this Li enhancement could be planet engulfment as described in Montalbán & Rebolo (2002) and Sandquist et al. (2002).
Another interesting result is that the -enhanced stars (represented by teal blue filled circles in Fig. 5) fall on the same Li-age sequence as the thin disk solar twins. Two of these -enhanced stars (HD 45289 and HD 210918) have thick-disk kinematics, while the third one (HD 220507) has thin-disk kinematics like the rest of the stars (Nissen, 2015), but this latter star has a chemical abundance pattern consistent with the other two thick disk stars.
Considering all stars in our sample for which a Li abundance has been derived (i.e., excluding stars with only an upper limit), the Li-age correlation has about a 10 significance; we performed a Spearman test and found a Spearman rank coefficient and a probability of of our results arising by pure chance. Therefore, even when the two deviant stars are considered the correlation between Li and age is very strong.
Excluding the anomalous stars HD 96423 and HD 38277, the Li-age correlation for 17 stars in our sample that have firm detections of the Li line is at the 23 significance level and has a very small probability of not being real () with a Spearman rank coefficient , meaning an almost perfect Spearman correlation. This is in contrast to the poor correlation found by Delgado Mena et al. (2014) (their Fig. 8). Notice, however, that they include stars with masses significantly lower and higher than the Sun’s and they also include stars in a broader metallicity range. The wider interval in both metallicity and mass apparently blurs the strong correlation that we find.
In Fig. 5 we compare our Li-age results with Li depletion models for a one solar mass star with solar metallicity (Xiong & Deng, 2009; Do Nascimento et al., 2009; Charbonnel & Talon, 2005; Denissenkov, 2010; Andrássy & Spruit, 2015) that take into account physics not included in the standard solar model. Different transport mechanisms are explored in these models, including meridional circulation, diffusion (gravitational settling and radiative acceleration), turbulence, gravity waves, convective overshooting, and convective settling. Overall, all models have a reasonable qualitative agreement with the data, as expected because they were calibrated using the Sun or earlier observations of solar twins. With the data presented here, the models above could be improved. However, such refinements should take into account that the initial Li abundance of stars probably have increased in time due to Galactic evolution, i.e., Li production in AGB stars and novae (Chen et al., 2001; Romano et al., 2001; Lambert & Reddy, 2004; Ramírez et al., 2012). The models assume an initial Li abundance of (Li) = 3.3 as in meteorites, but according to the chemical evolution model of Izzo et al. (2015), the initial Li abundance has increased from about (Li) = 2.8 for the oldest disk stars to about (Li) = 3.6 for the youngest. Taking this into account would make the (Li) - age relation predicted by the models steeper than shown in Fig. 5.
For models including rotational induced mixing, variations of the initial rotational velocity cause a considerable scatter in (Li) at a given age; according to Charbonnel & Talon (2005) a change in from 15 km s-1 to 110 km s-1 decreases (Li) by about 1 dex for the oldest stars. Differences in the initial rotational velocity may, therefore, contribute to the scatter seen in Fig. 5, although very large differences in are needed to explain the outliers.
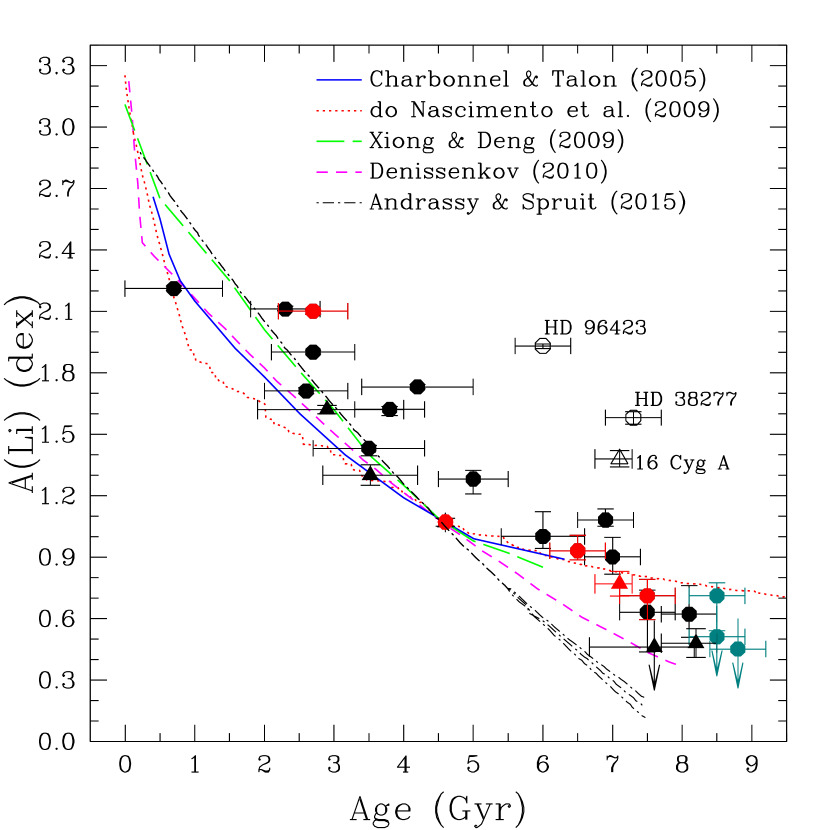
An alternative explanation for enhanced lithium depletion is the presence of planets. Israelian et al. (2009) suggest that planet hosting stars have less lithium than stars without planets, but Baumann et al. (2010) contest this result claiming that the sample of the former work is biased in metallicity and includes stars of different evolutionary stages. In agreement with Baumann et al. (2010), Fig. 5 shows a lack of connection between lithium depletion and presence of planets. There is no significant segregation between stars without planets (black filled symbols) and planet hosting stars (red filled symbols) in this figure.
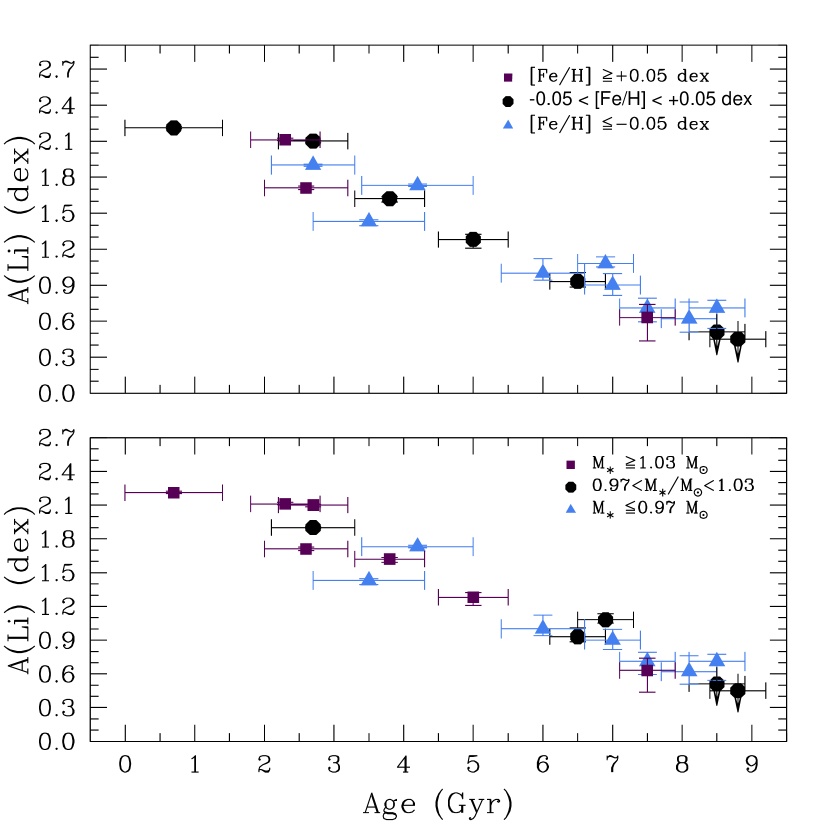
As shown in Fig. 6, where the stars in our sample have been divided into three metallicity groups (upper panel) and three mass groups (lower panel), there is no obvious indication of a dependence of lithium depletion on metallicity and mass at a given age. An unweighted linear least squares fit to (Li) as a function of age (in Gyr) for stars with a detected Li line (including the Sun) leads to
| (1) |
Fitting the residuals of (Li) relative to this equation as a function of [Fe/H] and mass results in the relation
| (2) |
Although, the coefficients have the expected sign, i.e., increasing Li depletion with increasing metallicity and decreasing mass (e.g., Castro et al., 2009), the dependence is hardly significant, i.e., a 1.7 correlation with metallicity and a 1.6 correlation with mass. Furthermore, the mass dependence is smaller than predicted from models (Xiong & Deng, 2009; Castro et al., 2009), and also smaller than inferred from Li abundance measurements for stars in the open cluster M67, which suggests a mass coefficient on the order of 10 for stars (Pace et al., 2012). Apparently, the short mass range for our sample (from 0.94 to 1.07 ) in combination with errors in age, mass, and Li abundance make it difficult to estimate the dependence of Li abundance on mass based on our sample. We note, however, that according to our results, it is unlikely that the large difference in (Li) between 16 Cyg A and 16 Cyg B is due to the difference in mass (0.05 ) as suggested by Ramírez et al. (2011). Instead, the high Li abundance in 16 Cyg A may be due to a recent accretion of a Jupiter sized planet, which is consistent with the fact that no such planet has been detected for 16 Cyg A, whereas 16 Cyg B has a giant planet with a minimum mass of 1.5 (Cochran et al., 1997). A related evidence supporting the planet engulfment scenario could be the enhanced abundances for all elements in 16 Cyg A relative to 16 Cyg B (Ramírez et al., 2011; Tucci Maia et al., 2014), and in particular for the refratory elements (Tucci Maia et al., 2014).
5 Conclusions
Based on HARPS spectra with very high signal-to-noise () we were able to determine high-precision lithium abundances for 21 solar twin stars for which isochrone ages have been estimated from the - log diagram. Excluding two outliers, we see a strong correlation between stellar ages and lithium abundances, with a 23 significance and a Spearman test coefficient of . In addition, five solar twins for which high-precision lithium abundances and ages were previously derived (Monroe et al., 2013; Meléndez et al., 2012, 2014; Ramírez et al., 2011) and the Sun itself fit the relation very well. Over an age range from 1 to 9 Gyr, the Li abundance decreases by almost 2 dex, which we interpret as being due to gradual destruction of lithium near the bottom of the outer convection zone. Thus, the new data can be used to constrain non-standard models of Li depletion, and therefore to understand better the transport mechanisms inside stars.
Two stars deviate from the main trend between (Li) and age by having Li abundances enhanced by a factor of 10. A similar enhancement of Li is present for 16 Cyg A relative to 16 Cyg B even though the two stars have the same age and nearly the same mass and metallicity. We suggest that these enhancements of Li are connected to the accretion of Jupiter sized planets.
We find no evidence for a link between planet hosting stars and enhanced Li destruction as suggested in some recent works. Three stars with planets of different masses in our sample, 16 Cyg B with a Jupiter sized planet (Ramírez et al., 2011), and the Sun show no systematic deviation from the (Li)-age relation for stars without planets.
Acknowledgements.
The referee is thanked for important comments, that helped to improve this paper. M.C. would like to acknowledge support from CAPES. P.E.N. acknowledges support from the Stellar Astrophysics Centre funded by The Danish National Research Foundation (Grant agreement no.: DNRF106) and from the ASTERISK project (ASTERoseismic Investigations with SONG and Kepler) funded by the European Research Council (Grant agreement no.: 267864). J.M. would like to acknowledge support from FAPESP (2012/24392-2) and CNPq (Bolsa de Produtividade).References
- Andrássy & Spruit (2015) Andrássy, R. & Spruit, H. C. 2015, A&A, 579, A122
- Baumann et al. (2010) Baumann, P., Ramírez, I., Meléndez, J., Asplund, M., & Lind, K. 2010, A&A, 519, A87
- Bedell et al. (2014) Bedell, M., Meléndez, J., Bean, J. L., et al. 2014, ApJ, 795, 23
- Butler et al. (2006) Butler, R. P., Wright, J. T., Marcy, G. W., et al. 2006, ApJ, 646, 505
- Castelli & Kurucz (2004) Castelli, F. & Kurucz, R. L. 2004, ArXiv Astrophysics e-prints [astro-ph/0405087]
- Castro et al. (2009) Castro, M., Vauclair, S., Richard, O., & Santos, N. C. 2009, A&A, 494, 663
- Charbonnel & Talon (2005) Charbonnel, C. & Talon, S. 2005, Science, 309, 2189
- Chen et al. (2001) Chen, Y. Q., Nissen, P. E., Benoni, T., & Zhao, G. 2001, A&A, 371, 943
- Cochran et al. (1997) Cochran, W. D., Hatzes, A. P., Butler, R. P., & Marcy, G. W. 1997, ApJ, 483, 457
- Delgado Mena et al. (2014) Delgado Mena, E., Israelian, G., González Hernández, J. I., et al. 2014, A&A, 562, A92
- Denissenkov (2010) Denissenkov, P. A. 2010, ApJ, 719, 28
- Do Nascimento et al. (2009) Do Nascimento, Jr., J. D., Castro, M., Meléndez, J., et al. 2009, A&A, 501, 687
- Figueira et al. (2014) Figueira, P., Faria, J. P., Delgado-Mena, E., et al. 2014, A&A, 570, A21
- Gonzalez (2015) Gonzalez, G. 2015, MNRAS, 446, 1020
- Gonzalez et al. (2010) Gonzalez, G., Carlson, M. K., & Tobin, R. W. 2010, MNRAS, 403, 1368
- Israelian et al. (2009) Israelian, G., Delgado Mena, E., Santos, N. C., et al. 2009, Nature, 462, 189
- Izzo et al. (2015) Izzo, L., Della Valle, M., Mason, E., et al. 2015, ApJ, 808, L14
- Jones et al. (2006) Jones, H. R. A., Butler, R. P., Tinney, C. G., et al. 2006, MNRAS, 369, 249
- Kim et al. (2002) Kim, Y.-C., Demarque, P., Yi, S. K., & Alexander, D. R. 2002, ApJS, 143, 499
- Lambert & Reddy (2004) Lambert, D. L. & Reddy, B. E. 2004, MNRAS, 349, 757
- Lind et al. (2009) Lind, K., Asplund, M., & Barklem, P. S. 2009, A&A, 503, 541
- Mayor et al. (2011) Mayor, M., Marmier, M., Lovis, C., et al. 2011, ArXiv e-prints [arXiv:1109.2497]
- Mayor et al. (2003) Mayor, M., Pepe, F., Queloz, D., et al. 2003, The Messenger, 114, 20
- Meléndez et al. (2012) Meléndez, J., Bergemann, M., Cohen, J. G., et al. 2012, A&A, 543, A29
- Meléndez et al. (2014) Meléndez, J., Schirbel, L., Monroe, T. R., et al. 2014, A&A, 567, L3
- Monroe et al. (2013) Monroe, T. R., Meléndez, J., Ramírez, I., et al. 2013, ApJ, 774, L32
- Montalbán & Rebolo (2002) Montalbán, J. & Rebolo, R. 2002, A&A, 386, 1039
- Nissen (2015) Nissen, P. E. 2015, A&A, 579, A52
- Pace et al. (2012) Pace, G., Castro, M., Meléndez, J., Théado, S., & do Nascimento, Jr., J.-D. 2012, A&A, 541, A150
- Ramírez et al. (2012) Ramírez, I., Fish, J. R., Lambert, D. L., & Allende Prieto, C. 2012, ApJ, 756, 46
- Ramírez et al. (2014) Ramírez, I., Meléndez, J., Bean, J., et al. 2014, A&A, 572, A48
- Ramírez et al. (2011) Ramírez, I., Meléndez, J., Cornejo, D., Roederer, I. U., & Fish, J. R. 2011, ApJ, 740, 76
- Romano et al. (2001) Romano, D., Matteucci, F., Ventura, P., & D’Antona, F. 2001, A&A, 374, 646
- Sandquist et al. (2002) Sandquist, E. L., Dokter, J. J., Lin, D. N. C., & Mardling, R. A. 2002, ApJ, 572, 1012
- Sneden (1973) Sneden, C. A. 1973, PhD thesis, THE UNIVERSITY OF TEXAS AT AUSTIN.
- Sousa et al. (2010) Sousa, S. G., Fernandes, J., Israelian, G., & Santos, N. C. 2010, A&A, 512, L5
- Sousa et al. (2008) Sousa, S. G., Santos, N. C., Mayor, M., et al. 2008, A&A, 487, 373
- Takeda et al. (2010) Takeda, Y., Honda, S., Kawanomoto, S., Ando, H., & Sakurai, T. 2010, A&A, 515, A93
- Tucci Maia et al. (2015) Tucci Maia, M., Meléndez, J., Castro, M., et al. 2015, A&A, 576, L10
- Tucci Maia et al. (2014) Tucci Maia, M., Meléndez, J., & Ramírez, I. 2014, ApJ, 790, L25
- Xiong & Deng (2009) Xiong, D. R. & Deng, L. 2009, MNRAS, 395, 2013
- Yi et al. (2001) Yi, S., Demarque, P., Kim, Y.-C., et al. 2001, ApJS, 136, 417
- Yi et al. (2003) Yi, S. K., Kim, Y.-C., & Demarque, P. 2003, ApJS, 144, 259