Global High-resolution -body Simulation of Planet Formation I.
Planetesimal Driven Migration
Abstract
We investigated whether outward Planetesimal Driven Migration (PDM) takes place or not in simulations when the self gravity of planetesimals is included. We performed -body simulations of planetesimal disks with large width (0.7 - 4AU) which ranges over the ice line. The simulations consisted of two stages. The first stage simulations were carried out to see the runaway growth phase using the planetesimals of initially the same mass. The runaway growth took place both at the inner edge of the disk and at the region just outside the ice line. This result was utilized for the initial setup of the second stage simulations in which the runaway bodies just outside the ice line were replaced by the protoplanets with about the isolation mass. In the second stage simulations, the outward migration of the protoplanet was followed by the stopping of the migration due to the increase of the random velocity of the planetesimals. Due to this increase of random velocities, one of the PDM criteria derived in Minton and Levison (2014) was broken. In the current simulations, the effect of the gas disk is not considered. It is likely that the gas disk plays an important role in planetesimal driven migration, and we plan to study its effect in future papers.
1 Introduction
In the current planet formation theory, the formation of the terrestrial planets and gas giant cores have been explained in the following way (e.g. Morbidelli et al. 2012). First, the runaway accretion of the planetesimals takes place and the runaway bodies, sometimes called embryos or protoplanets, are formed (Wetherill & Stewart 1989, Kokubo & Ida 1996). They heat up the random velocities of surrounding planetesimals. This increase of random velocities causes the slowing down of the growth rate of both protoplanets themselves and the surrounding planetesimals. Thus, multiple protoplanets are formed and they grow keeping their distance to 10 Hill’s radius. This phase is called the oligarchic phase (Kokubo & Ida 1998) and it continues until their mass reaches the isolation mass. The isolation mass is about the Mars mass in the terrestrial planet region. After most of the disk gas has been dissipated, the orbits of protoplanets cross with each other. As a result, protoplanets collide with each other to form terrestrial planets.
This scenario has been investigated using -body simulations which included the self-gravity of the planetesimals: Runaway growth (e.g. Kokubo & Ida 1996), oligarchic growth (Kokubo & Ida 1998), and the formation of planets form protoplanets through giant impact phase (e.g. Kominami & Ida 2002).
In these simulations, the radial width of the planetesimal disk ranged from to AU which is narrow compared with the size of solar system ( AU). One of the reasons why the planetesimal disks of previous simulations were narrow was the limitation of a number of particles could be used. For example, the number of particles used in Kokubo & Ida (2002) was about 10000. If larger number of particles were used, the simulating time would not be practical.
Although such simulations of narrow disks had been useful to study individual process, it is important to study wider planetesimal disks, at least ranging from terrestrial planet region to the Jovian planet region. For instance, there is the ice line at which the solid surface density increases by a factor of a few. It would affect the growth of planetesimals. Water delivery from outside the ice line to the inner region of the ice line has been considered (Walsh et al. 2011, Raymond et al. 2012). Migration mechanisms of planets such as type-I migration (Tanaka et al. 2002) and planetesimal driven migration (Ida et al 2000, Minton & Levison 2014) have crucial effect on the formation of the planetary systems. In order to understand planetary formation processes which include such mechanisms, one needs to consider the disks extending AU to AU. Such simulations of disks with wide radial range requires the number of particles such as several times . We have developed a parallel -body code which enables us to simulate several times particles for years in a reasonable time (Kominami et al. 2016). Our ultimate goal is to follow the planetary formation process from planetesimals to final planets directly with a single -body simulation which includes the effects of gas drag, type-I migration and collisional fragmentation, to understand how terrestrial and outer planets are formed. In the forthcoming papers, we will study the effects of gas drag, type-I migration and collisional fragmentation, step by step.
In this paper, we focus on the mechanism called planetesimal driven migration (PDM, Kirsch et al. 2009, Ormel et al. 2012, Minton & Levison 2014) which can move the planets outward in a planetesimal disk. PDM is triggered by the formation of asymmetry in the density structure in the planetesimal disk around the protoplanets. The asymmetric density structure results in the asymmetric net torque on the protoplanets. The torque makes the protoplanet migrate to one direction. On the plane of semimajor axis and the random velocity, individual planetesimals within the horseshoe region in the radially outside are scattered to the region radially inside when a protoplanet moves outward, transporting angular momentum to the protoplanet. PDM has been studied semi-analytically (Ida et al. 2000, Kirsch et al 2009, Minton & Levison 2014). Minton and Levison (2014, hereafter ML14) also studied PDM using test particle simulations, in which the interaction between the large protoplanets and surrounding planetesimals are included but interactions between planetesimals are neglected. They derived criteria for PDM to take place. The criteria are (1) the mass ratio criterion, (2) the mass resolution criterion, (3) the disk eccentricity criterion, (4) the crowded criterion and (5) the growth timescale criterion. In order for PDM to start, the criterion (2) indicates that the mass of surrounding planetesimals has to be small () compared to the mass of the protoplanet. If we consider a Mars-sized protoplanet, individual planetesimals has to be g or less, and the number of planetesimals is several times if we consider a region of several AU.
Although the effect of the self gravity is not considered in previous studies, it might play an important role in the PDM process because of the following reasons. As shown in criterion (3) of ML14, the velocity dispersion of the planetesimals should be small enough for PDM to take place and to continue. It is expected that this decrease of angular momentum might eventually halt PDM. The self gravity might change the way PDM works. Thus, we believe it is important to study the PDM process using the simulations with the self gravity of planetesimals.
In this paper, we performed simulations in two-stages. In the first stage simulations, we started with equal mass planetesimals distributed in a disk extending from 0.7 AU to 4.0 AU with particles. Runaway growth took place at the inner edge and at right outside the ice line. Since we did not include the effect of the gas drag, the velocity dispersion of planetesimals would increase to unrealistic values if we continued the simulation. In order to save the simulation time and to avoid the unrealistic increase of the velocity dispersion, we introduced the assumption that the two largest protoplanets grow to the size of about the isolation mass. After we increased the mass of these two protoplanets, we restarted the simulation as the second stage simulation.
In the second stage simulations, the outer protoplanet, which was initially at AU, moved outward and reached AU. The viscous stirring among the planetesimals increased the random velocity of the planetesimals and the outward migration was eventually halted. To our knowledge, this is the first -body simulation with self-gravity of the planetesimals in which PDM took place.
One of the critical issues of the planetary accretion theory is the formation timescale of the cores of ice giants in our Solar system. The in-situ formation timescale of the core of Neptune is estimated to be longer than the age of the Solar system (Kokubo & Ida 2002). We can expect that PDM would solve this issue, since it enables the core formation of gas giants and icy planets in the inner region of the disk.
In section 2, we describe the method of the simulation. The result of the first stage of the simulation is presented in section 3, and that of the second stage is in section 4. Section 5 is devoted to discussion and summary.
2 Numerical Method
For our -body simulations, we used Kninja (Kominami et al. 2016), which is a parallelized -body simulation code developed for K computer. It uses the 4th order Hermite scheme (Makino & Aarseth 1992) with block timestep and the two-dimensional Ninja algorithm (Nitadori et al. 2006) which provides good load balance between cpus and excellent scalability. Perfect accretion is assumed for collisions between the particles. Typically, in our simulations, the relative energy error is after integration of years. Since we include the planetesimal-planetesimal gravitational interaction, there is no approximation for gravitational interaction between the particles in our simulations. In addition, since the scheme we use is the 4th order Hermite scheme, we can achieve sufficient accuracy for long term orbital evolution. Second order integrators are not sufficient for such simulations (Carter et al. 2015).
Our simulations consist of two stages. First stage simulations start with equal mass planetesimals. The physical density of the planetesimals and the protoplanets is . Using the results of the first stage simulations, we constructed the initial conditions of the second stage simulations. The two of the largest runaway bodies outside the ice line which was formed in the first stage simulations were replaced by the protoplanets. The summary of simulations is listed in table 1. Since the time to simulate planetesimals for years using 1024 nodes was about 10 days including the waiting period, the computational (wall clock) time for the runaway bodies to grow to the size of without gas drag would be about several months.
3 First Stage Simulations : until the Runaway Growth
3.1 Setup for the First Stage Simulations
Our setup of the first stage simulations is almost the same as those used in Kokubo & Ida (2002) except that we extended the planetesimal disk so that it includes the region outside the ice line. We distributed planetesimals with equal mass of g from 0.7 AU to 4.0 AU. The distribution of planetesimals in radial direction obeys the solid surface density of Minimum Mass Solar Nebula (MMSN) which is given by (Hayashi et al. 1985)
| (1) | |||||
| (2) |
Thus, the number density of the planetesimals is larger outside the ice line. Initial distribution of the eccentricity() and the inclination() of the planetesimals are given by the Rayleigh distribution with
| (3) |
where is the reduced Hill radius (Kokubo & Ida 1998). The initial number of planetesimals in the disk is 82362. We carried out two simulations with different initial condition of particles (position and velocity), which are generated with different seeds of random numbers (S1a and S1b). We used the radius enhancement factor, , which is used to accelerate the growth of planetesimals (Kokubo & Ida 1996) in this first stage simulations. We used in the first stage simulations to save the computational time. Note that we did not use the enhancement factor in second stage simulations (i.e. ).
The ice line is at 2.7 AU in our present Solar system. However, it was pointed out that the ice line might have been closer to the Sun due to the viscous accretion of the gas and due to the stellar evolution of the central star (Oka et al. 2011). Therefore, we placed the ice line at 2.0 AU in our simulations.
3.2 Emergence of Runaway Bodies
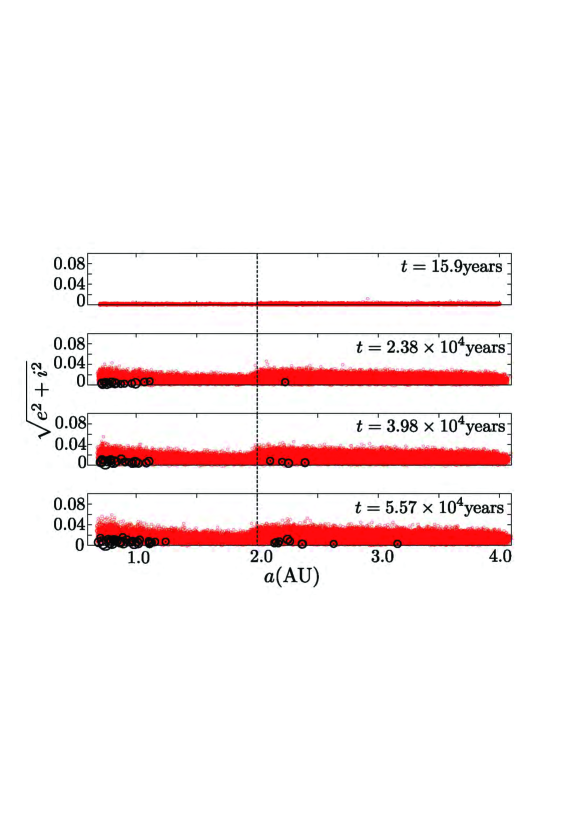
Figure 1 shows the snapshots of run S1a on the plane of the semimajor axis (denoted by ) and the random velocity (). The size of circles indicates the mass of a planetesimal. When the mass of a planetesimal grows to more than ten times its initial mass, we call it a runaway body. It is shown in a black circle. As seen in figure 1, the runaway bodies are formed not only at the inner edge of the disk but also at the region just outside the ice line ( 2AU, described as the dashed line). This is due to the fact that the increase of the solid surface density at the ice line enhances the collision probability, which accelerates the growth of the planetesimals. Meanwhile, such large bodies outside the ice line did not emerge in previous simulations without ice line (Kokubo & Ida 2002).
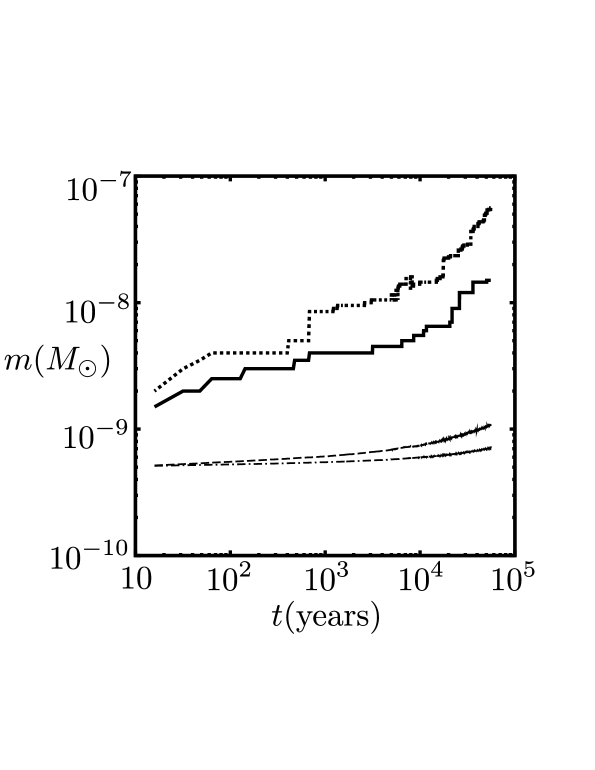
Figure 2 shows the mass evolution of the largest runaway bodies from 2.0 to 2.5 AU (solid curve) and in the region from 0.7 to 1.0 AU (dotted curve). The average mass excluding the largest one in each region is shown as the dashed curve and in the dot-dashed curve, respectively. The mass ratio of the largest protoplanet to the average mass excluding the largest one becomes more that 100 at the end of the simulation.
Here we estimate the growth timescale of the runaway protoplanets. The growth timescale () for the planetesimal to reach the mass of is empirically derived in Kokubo & Ida (2002) and written as
| (4) | |||||
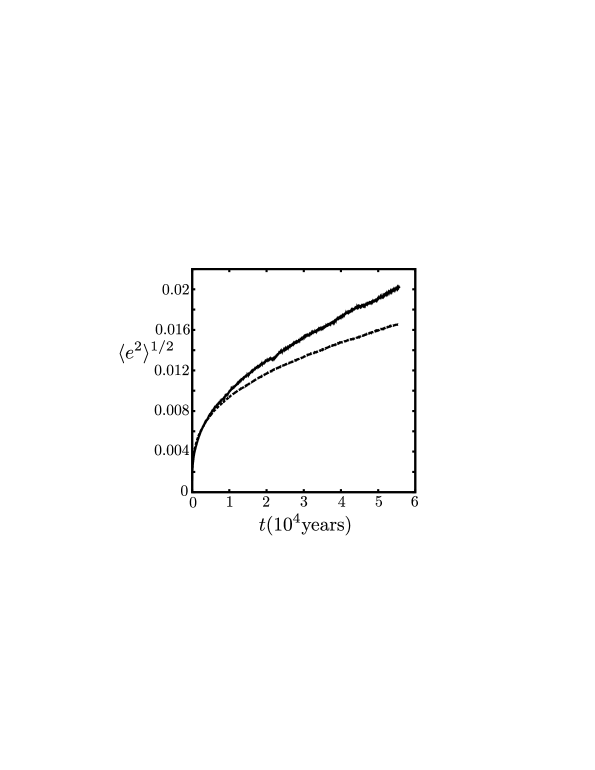
where is the accretion acceleration factor of a few that reflects the effects of the eccentricity and inclination distributions of planetesimals and the Solar gravity, is the radius enhancement factor, is the physical density and is the mass of the central star. The largest protoplanet outside the ice line of the last panel of figure 1 has the mass of g. In order to estimate the growth timescale of the runaway bodies using eq.(4), we plot the root-mean-square (RMS) eccentricity evolution of the planetesimals (figure 3). The RMS eccentricity of the planetesimals in 0.7 - 1.0 AU is plotted in the solid curve, and in 2.0 -2.5 AU in the dotted curve. Using the values in the solid curve, the growth time scale can be estimated as years for g at AU if the radius enhancement factor is 3 and . In S1a, the runaway bodies outside the ice line grow to mass of g at years, which is consistent with the result of previous works (Kokubo & Ida 1996, 1998, 2002).
4 Second Stage Simulations : Migration of the Protoplanets
4.1 Criteria for PDM
ML14 listed five criteria that have to be satisfied simultaneously in order for PDM to take place. We briefly go over those criteria and discuss the importance of the self gravity of the planetesimals and how it would affect the PDM. The criteria are the following. (1) The mass ratio criterion; the amount of planetesimals within of the protoplanet at should be larger than three times the protoplanet’s mass . (2) The mass resolution criterion; the mass ratio between the protoplanet and the planetesimal () has to be larger than for the migration to be monotonic in one direction. (3) The disk eccentricity criterion; the eccentricity of the planetsimals surrounding the protoplanet has to be less than for the migration to take place. (4) The crowded criterion; other growing bodies near the protoplanet can distract the migration. (5) The growth timescale criterion; if a migrating body encounters with a protoplanet of similar size, the migration halts. The migration rate depends strongly on the first three criteria. By carrying out self-consistent -body simulations, the evolution of the random velocity and the mass of the planetesimals can be followed. Viscous stirring of the planetesimals can increase the random velocity of the planetesimals. This increase might affect the criterion (3). Criteria (1) and (2) may be altered if the growth of the planetesimals are considered as well. Here we would like to see how first three criteria change when -body simulations which include the self-gravity of the planetesimals are performed.
4.2 Setup for the Second Stage Simulations
Here we briefly describe how we set up the initial condition for the second stage simulations. We replaced the largest two runaway bodies outside 2AU that emerged in the first stage simulation with the mass of the protoplanet. These bodies emerged at years, and reached a mass of . We parametarized and investigated three different cases; (S2aM0.1), (S2aM0.3) and (S2aM0.03). As noted in section 3, we did not use the radius enhancement factor in second stage simulations.
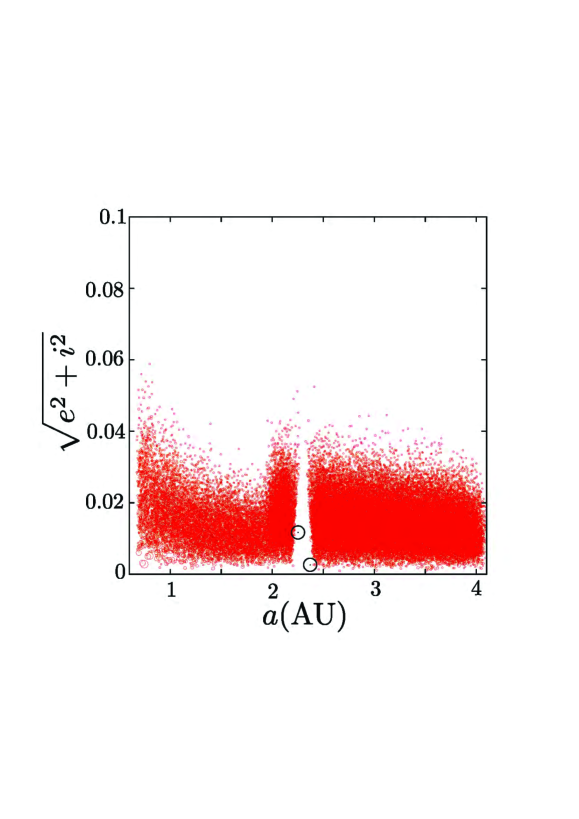
In run S2aM0.1, the planetesimals within the distance of from were removed from the system as shown in figure 4. The Hill radius is written as
| (5) |
where is the reduced Hill radius of the protoplanet and is the semimajor axis of the protoplanet (Ida 1990, Kokubo & Ida 1998). In order to see only the effect of the different , we uses the same distribution of planetesimals for runs S2aM0.1, S2aM0.3 and S2aM0.03.
Following is the justification for replacing the runaway bodies outside 2AU with . In the gas-free case, if we wait for the runaway bodies to grow to the mass of , it would take years (Kokubo & Ida 2002). The eccentricity of the planetesimals would increase to (Ida 1990, Kokubo & Ida 1998). However, such increase of the random velocity is not realistic if the gas drag is taken into account. In order to avoid the unreasonable increase of the random velocity of the planetesimals, we replaced the runaway bodies with in early phase when the random velocity of the planetesimals were not significantly increased. If the gas drag is included, the eccentricity of the planetesimals would be about (Kokubo & Ida 2002) which is about the same value as that at the moment we increased the mass of runaway bodies.
The total mass of the planetesimals removed is 0.18 and the total mass of the two new protoplanets is 0.2 . Thus, the total mass is approximately conserved in the case of S2aM0.1 and S2bM0.1.
4.3 Radial Migration of the protoplanets
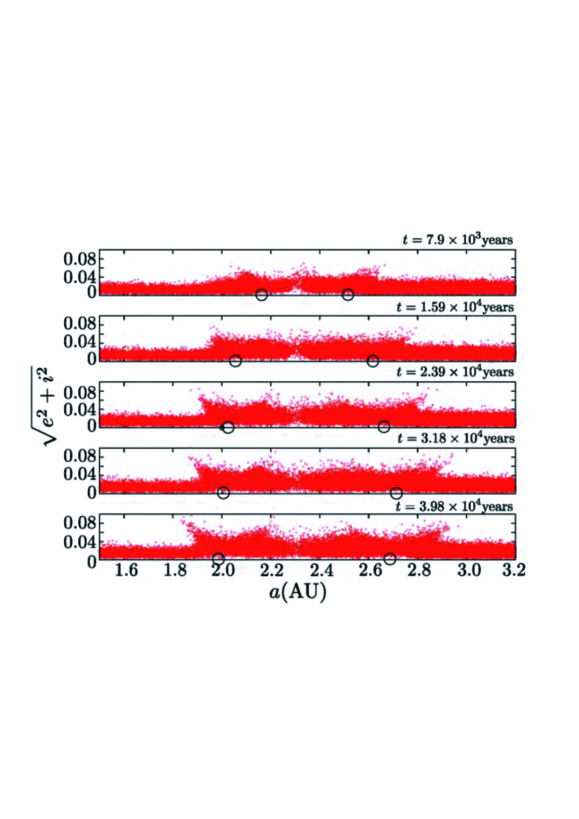
Figure 5 shows the snapshots of run S2aM0.1 on the plane of and . The protoplanets with initial mass of (in this case ) are shown in black circles. The outer protoplanet moves outward to 2.7AU and the inner protoplanet moves inward to 2AU. The displacement of the outer protoplanet is AU. After the protoplanet reaches AU, it moves back a little.
The random velocity of the planetesimals surrounding the protoplanet increases as shown in figure 5. The planetesimals with Jacobi energy close to 0 are scattered in V-like direction around the protoplanet (Nakazawa & Ida 1988). This increase shows that the protoplanet stirs the surrounding planetesimals as in Ida & Makino (1993). The stirring of the planetesimals into the gap that is formed in the planetesimal disk serves as a “kick” for the PDM to start.
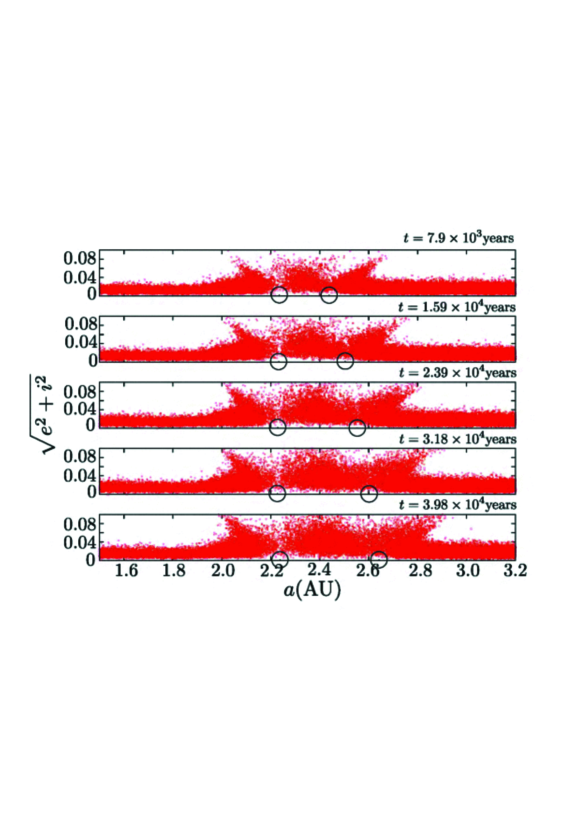
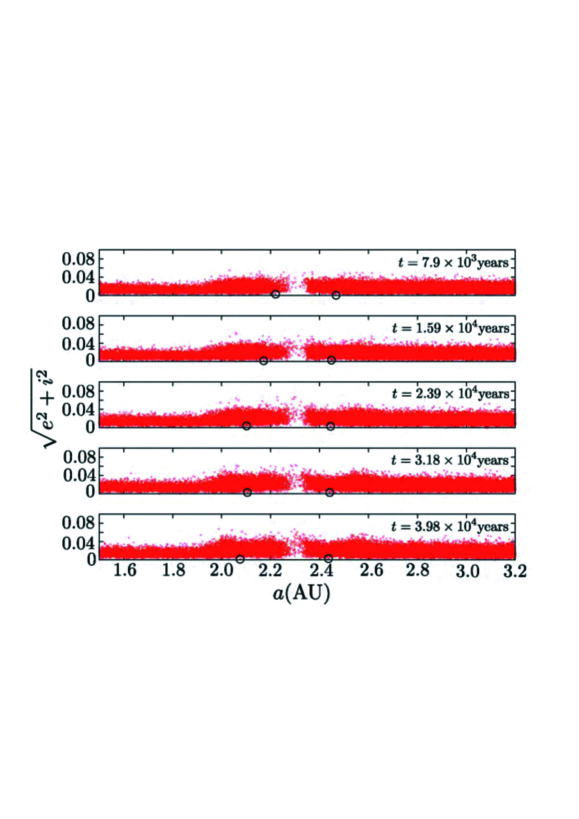
Figure 6 shows the case of run S2aM0.3. Outward migration is apparent. In this case, the mass ratio between the protoplanet and a planetesimal is . The migration of the outer protoplanet was from 2.45AU to 2.65AU. The migration speed is slow compared to that in the case of run S2aM0.1. Figure 7 shows the case of (S2aM0.03). The displacement of the protoplanet is small. The outer protoplanet stays at 2.45 AU. The inner protoplanet moves inward a little bit from 2.2AU to 2.1AU.
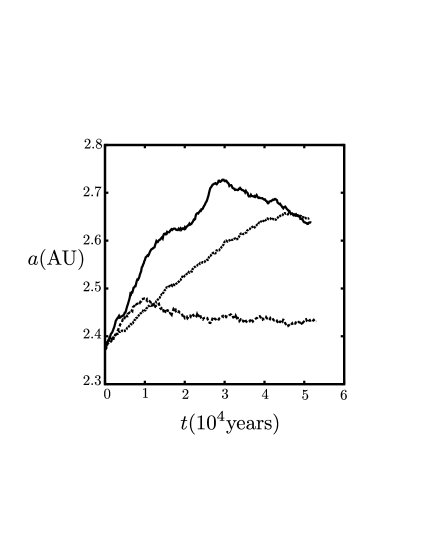
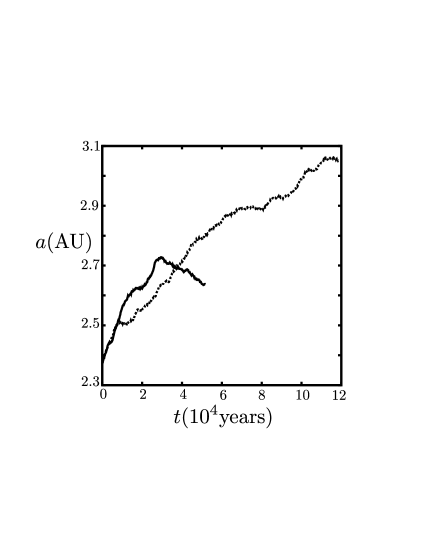
The evolution of the semimajor axis of the outer protoplanets in runs S2aM0.03, S2aM0.1 and S2aM0.3 is shown in figure 8. Constant migration is observed in runs S2aM0.1 and S2aM0.3, although the migration rate is lower in run S2aM0.3. In the case of S2aM0.03, the radial migration is very small, except for the first years.
The migration rate from Kirsh et al. (2009) is about AU/year if our parameters are used. Our simulations resulted in somewhat faster migration in some cases. The reason may be the size of the kick and the stochastic nature of PDM. This is one of the reasons we need to carry out more simulations to obtain statistically reliable results.
In addition to run S2aM0.1, we performed run S2bM0.1 in order to investigate how the results depends on the initial random seed. We utilized the outcome of run S1b to generate the initial condition of S2bM0.1. Figure 9 shows the evolution of the semimajor axis of the outer protoplanets for runs S2aM0.1 and S2bM0.1. The migration continued up to AU in run S2bM0.1. The amount of migration can change by about AU just because of random seeds. We need to carry out more simulations to obtain statistically reliable results.
4.4 Comparison with Criteria of ML14
In this section, in order to investigate the criteria for PDM to start/halt, we checked whether the criteria of ML14 are satisfied or not in our simulations. We actually looked at the first three criteria only, since the last two are related to the cases where there are multiple outgoing protoplanets.
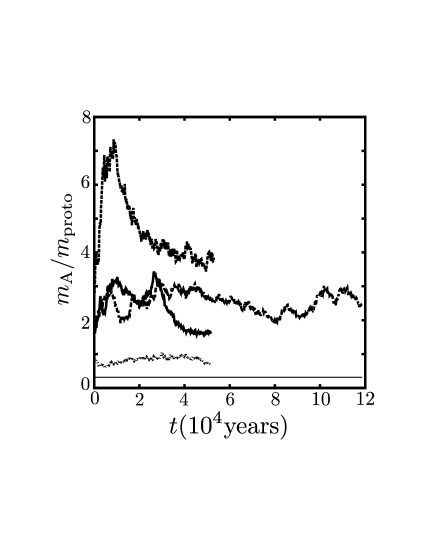
Criterion (1) of ML14 tells us that the amount of planetesimals within outside the protoplanet at semimajor axis should be larger than three times the mass of the protoplanet in order for the monotonic migration to take place. To see whether criterion (1) is satisfied or not, we plot the total mass of planetesimals in front of the outgoing protoplanet in figure 10. Here we define the total mass of planetesimals () with the semimajor axis of outside the outgoing protoplanet. The reason we incorporated is because the region in which the planetesimals are scattered in the horseshoe region is around of the protoplanet (Nakazawa & Ida 1988). The vertical axis in figure 10 is normalized by . The thin line of shows the criterion (1) of ML14. All of our simulations resulted in the value above the line. Hence, the criteria (1) is always satisfied in our simulations.
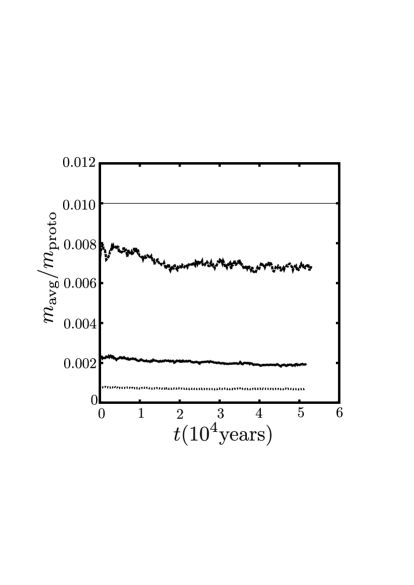
Criterion (2) of ML14 states that the mass ratio between the protoplanet and the planetesimal () has to be larger than for the migration to be monotonic in one direction. In order to compare our results with ML14, we plot the time evolution of the averaged planetesimal mass normalized by within outside of the outer protoplanet in figure 11. Criterion (2) of ML14 is satisfied in all three runs, and the mass ratio becomes large in all runs due to the growth of the protoplanet. Thus, criterion (2) is always satisfied in our simulations.
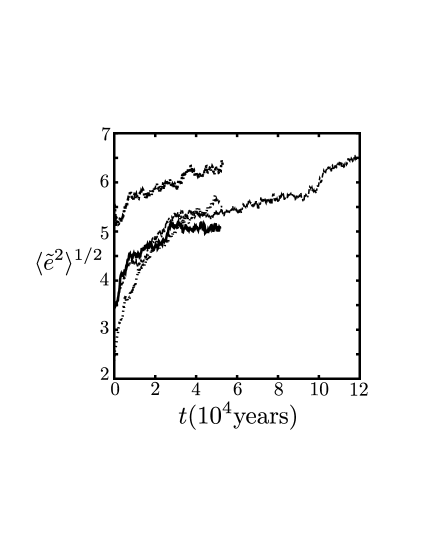
Criterion (3) of ML14 states that the random velocity of the planetesimals should be less than . In order to see the random velocity evolution of the planetesimals in our simulations, we plot the eccentricity evolution (RMS of the eccentricity) of the planetesimals within outside the outward migrating protoplanet in figure 12. The migration stops when the eccentricity of the planetesimals exceeds the value of in all four cases (figure 8). Thus, as far as our runs are concerned, criterion (3) of ML14, namely the disk eccentricity criterion determines if the PDM continues or not.
As seen in figure 5, the inner protoplanet loses the angular momentum throwing the planetesimals from the inner region to the outer region in the same manner as the outer protoplanet moves outward throwing the planetesimals from the outer region to the inner region. The inward migration stops at the ice line probably due to the decrease of the number of planetesimals in the disk. We will investigate the inward movement further in the next paper.
5 Summary and Discussion
5.1 Summary of -body Simulations
In this paper, we carried out high resolution -body simulations of planetesimal disk which includes the self-gravity of the planetesimals with radial extent from 0.7 AU to 4.0 AU, including the ice line. The initial number of planetesimals is . The simulations consist of two stages. The first stage simulations start with the planetesimals only to see the emergence of the runaway bodies. Due to the increase of the solid surface density outside the ice line, growth of the planetesimals is accelerated. Thus, the runaway bodies form not only in the inner edge of the disk, but also at just outside the ice line. In the second stage simulations, we replaced the runaway bodies outside the ice line with protoplanets of mass . We assumed that the planetesimals within of are eaten and that a gap is formed in the planetesimal disk. We restarted the simulation with two protoplanets and the planetesimal disk from 0.7 AU to 4.0 AU. The outer protoplanet moves outward and the inner protoplanet moves inward due to PDM if necessary conditions are satisfied.
5.2 Effect of Self gravity on Criteria of ML14
ML14 investigated PDM using test particles. They derived criteria for PDM to continue. In this study, we carry out -body simulations which include the self gravity of the planetesimals and investigate the criteria of PDM. The inclusion of the self gravity of the planetesimals resulted in the increase of random velocity of the planetesimals due to viscous stirring. This increase of the random velocity was not included in ML14. We investigated whether the criteria of ML14 are satisfied or not in our simulations. The amount of planetesimals in front of the outgoing protoplanet clearly affects the migration speed but in our simulations, criterion (1) was always satisfied in our simulations, and the criterion may be necessary. For the mass resolution criterion, the criterion was satisfied in our simulations. Hence, we conclude that the criterion (2) may be necessary as well. The random velocity of the planetesimals increased in our simulations due to the viscous stirring. Since the migration stopped as the eccentricity of the planetesimals exceeded , we conclude that the criterion (3), which is the eccentricity criterion, determines whether PDM continues or not.
5.3 Effect of Gas and Fragmentation
In reality, the planetesimal accretion proceeds in the gas disk. The presence of the gas nebula may be the key to how PDM works. We have shown that the stirring among the planetesimals increase their random velocity which eventually halts the outward migration. Gas drag should keep the random velocity of the planetesimals small. When a gas disk with several times MMSN is considered, the timescale for the gas drag to decrease and of planetesimals becomes shorter than the timescale of PDM. Hence, PDM and its stopping may be naturally explained by planetesimal-planetesimal gravitational interaction and the gas drag. The simulations which include the gas drag will be shown in the forthcoming paper. When the gas disk is considered, type-I migration should be effective as well (e.g. Tanaka et al. 2002). Since the timescale for the type-I migration is comparable to that of PDM when is considered, -body simulations including the effect of type-I migration is also necessary to understand which one dominates for the outer protoplanet. Depending on the mass density of the gas, PDM can actually be more effective than type-I migration for objects less than a few . Details will be shown in the next paper. PDM of the inner protoplanet stops at the ice line because of the decrease of the solid surface density at the inner region of the ice line. However, type-I migration can carry the protoplanet to terrestrial planet region.
In addition, PDM process should be affected by the fragments formed due to the collisions. If fragmentation is considered, many small bodies should form. The eccentricity of the fragments may be damped with short timescale due to the gas drag. Hence, if the gas drag and fragmentation are considered at the same time, the number of bodies with small random velocity surrounding the migrating protoplanet should increase. In the forthcoming paper, we will study the PDM within the gas disk. We will include the fragmentation in our -body simulation to consider more realistic model in forthcoming paper as well.
If the fragmentation and effect from the gas disk are included, our artificial treatment that increased the mass of the runaway bodies between the first stage and the second stage of the simulation can be replaced by more realistic continuous growth of the planetesimals to the protoplanets. We plan to perform such simulations soon.
References
- Agnor et al. (1999) Agnor C.B., R.M. Canup & H.F. Levison., 1999, Icarus, 142, 219-237
- Carter et al. (2015) Carter, P. J., Z. M. Leinhardt, T. Elliott, M. J. Warter and S. T. Stewart, 2015, ApJ(accepted).
- Hayashi et al. (1985) Hayashi, C., K. Nakazawa. & Y. Nakagawa., 1985, Protostars and planets II, University of Arizona Press, 1100-1153.
- Ida & Makino (1992) Ida, S. & Makino, J., 1992, Icarus, 96,107-120.
- Ida & Makino (1993) Ida, S. & Makino, J., 1993, Icarus, 106,210-227.
- Ida (1990) Ida, S., 1990, Icarus, 88, 129-145.
- Ida et al. (2000) Ida, S., G. Bryden, D.N.C. Lin, & H. Tanaka., 2000, ApJ, 534, 428-445.
- Kirsch et al. (2009) Kirsh, D. R., M. Duncan, R. Brasser & H. L. Levison., 2009, Icarus, 199, 197-209.
- Kokubo & Ida (1996) Kokubo, E., & S. Ida., 1996, Icarus, 123,180-191.
- Kokubo & Ida (1998) Kokubo, E., & S. Ida., 1998, Icarus, 131, 171-178.
- Kokubo & Ida (2002) Kokubo, E., & S. Ida., 2002, Icarus, 581, 666-680.
- Kominami & Ida (2002) Kominami, J & S. Ida, 2002, Icarus, 157, 43-56.
- Kominami et al. (2016) Kominami, J.D., H. Daisaka, K. Nitadori & J. Makino, 2016, in prep.
- Makino & Aarseth (1992) Makino, J., & S. J. Aarseth, 1992, PASJ, 44,141-151.
- Minton & Levison (2014) Minton, D.A. & H.F. Levison, 2014, Icarus, 232, 118-132.
- Morbidelli et al. (2012) Morbidelli, A., J.I. Lunine, D.P. O’Brien, S.N. Raymond & K.J. Walsh, 2012, Annal Review of Earth and Planetary Sciences, 40, 251-275.
- Nakazawa & Ida (1988) Nakazawa K. & S. Ida, 1988, Prog.Theoy.Phys.Suppl., 96, 167-174.
- Nitadori et al. (2006) Nitadori, K., J. Makino & G. Abe, 2006, arXiv:astro-ph/0606105v2.
- Oka et al. (2011) Oka, A., T. Nakamoto & S. Ida, 2011, ApJ, 738, Issue 2, article id. 141, 11 pp.
- Ormel et al. (2012) Ormel, C.W., S. Ida & H. Tanaka, 2012, Astrophys J., 758, 80, (17pp)
- Raymond et al. (2012) Raymond, S. N., P. J. Armitage, A. Moro-Martín, M. Booth, M. C. Wyatt, J. C. Armstrong, A. M. Mandell, F. Selsis & A. A. West, 2012, A&A, 541 et.A11,25pp
- Tanaka et al. (2002) Tanaka, H., T. Takeuchi & W. Ward, 2002, ApJ, 565,1257-1274.
- Walsh et al. (2011) Walsh, K. J., A. Morbidelli, S. N. Raymond., D. P. O’brien & A. M. Mandell, 2011, Nature, Volume 475, Issue 7355, pp. 206-209.
- Wetherill & Stewart (1989) Wetherill G. W. & G. R. Stewart, 1989, Icarus, 77, 330-357.
Table 1 Model List
| 1st stage simulation | 2nd stage simulation | |
|---|---|---|
| run | run | |
| S1a | S2aM0.1 | 0.1 |
| S2aM0.3 | 0.3 | |
| S2aM0.03 | 0.03 | |
| S1b | S2bM0.1 | 0.1 |