Early-type Host Galaxies of Type Ia Supernovae. I. Evidence for Downsizing
Abstract
Type Ia supernova (SN Ia) cosmology provides the most direct evidence for the presence of dark energy. This result is based on the assumption that the look-back time evolution of SN Ia luminosity, after light-curve corrections, would be negligible. Recent studies show, however, that the Hubble residual (HR) of SN Ia is correlated with the mass and morphology of host galaxies, implying the possible dependence of SN Ia luminosity on host galaxy properties. In order to investigate this more directly, we have initiated spectroscopic survey for the early-type host galaxies, for which population age and metallicity can be more reliably determined from the absorption lines. As the first paper of the series, here we present the results from high signal-to-noise ratio (100 per pixel) spectra for 27 nearby host galaxies in the southern hemisphere. For the first time in host galaxy studies, we find a significant (3.9) correlation between host galaxy mass (velocity dispersion) and population age, which is consistent with the “downsizing” trend among non-host early-type galaxies. This result is rather insensitive to the choice of population synthesis models. Since we find no correlation with metallicity, our result suggests that stellar population age is mainly responsible for the relation between host mass and HR. If confirmed, this would imply that the luminosity evolution plays a major role in the systematic uncertainties of SN Ia cosmology.
1 Introduction
Type Ia supernova (SN Ia) cosmology is providing the most direct evidence for the dark energy (Riess et al., 1998; Perlmutter et al., 1999; Kessler et al., 2009a; Sullivan et al., 2011; Suzuki et al., 2012; Betoule et al., 2014, and references therein). The distance measurement using SNe Ia is based on the assumption that the look-back time evolution of SNe Ia luminosity, after light-curve shape and color corrections, would be negligible. A strong support for this assumption was the apparent insensitivity of SNe Ia luminosity with host galaxies of different morphological types, where SNe Ia are believed to arise from old and young progenitors (Riess et al., 1998; Schmidt et al., 1998; Perlmutter et al., 1999).
However, more extensive recent compilations of SNe Ia data show a systematic difference, in the sense that SNe Ia in late-type hosts are fainter than those in early-type hosts by 0.16 0.08 mag, both at low and high redshifts (Hicken et al., 2009b; Suzuki et al., 2012). Considering the fact that the difference in Hubble residual (HR ≡ ) used in the discovery of the dark energy is 0.2 mag, this is potentially a significant result and no longer supports the assumption that there is no luminosity evolution of SNe Ia. Furthermore, recent studies on the host galaxy properties report a systematic difference in HR of 0.08 0.02 mag between the high and low mass host galaxies (Kelly et al., 2010; Lampeitl et al., 2010; Sullivan et al., 2010). Sullivan et al. (2010) showed that this difference alone could shift the dark energy equation of state, w, by 0.17. Since the mass of a galaxy cannot directly affect SN luminosity, this is most likely due to the population properties of a host galaxy, such as age and metallicity (Johansson et al., 2013; Childress et al., 2014; Pan et al., 2014). All of these results might indicate that the light-curve fitters used by the SNe Ia community cannot quite yet correct for a large portion of the population age or metallicity effects.
In order to investigate these issues more directly, population age and metallicity of host galaxies are required to be pre-determined. Most of the studies on host galaxy properties, however, use spectral energy distribution (SED) fitting technique or emission lines to measure gas-phase metallicity, star formation rate, and stellar mass (Gallagher et al., 2005; Sullivan et al., 2006, 2010; Kelly et al., 2010; Lampeitl et al., 2010; D’Andrea et al., 2011; Gupta et al., 2011; Childress et al., 2013; Pan et al., 2014). Because of the well-known limitations of this technique, such as the age-metallicity degeneracy and attenuation by dust, population ages derived from this technique is rather uncertain (see e.g., Worthey et al., 1994; Walcher et al., 2011). In order to overcome these limitations, Balmer absorption lines have been widely used in age dating of early-type galaxies (ETG) during the last two decades (Faber et al., 1992; Worthey et al., 1994; Worthey, 1998; Kuntschner, 2000; Trager et al., 2000; Thomas et al., 2005; Collobert et al., 2006; Kuntschner et al., 2006; Graves et al., 2007, 2009; Sánchez-Blázquez et al., 2009; Scott et al., 2009; Conroy & Gunn, 2010; Zhu et al., 2010). One of the results established from these studies is that stellar population in more massive galaxies, in the mean, is older than that in less massive galaxies. Although there is no theoretical reason to believe that stellar population in host galaxies would be significantly different from that in non-host galaxies, this “downsizing” trend is not reported yet from host galaxy studies.
As to the SNe Ia host galaxies, there have been only two previous studies that employed this technique based on Balmer absorption lines. In their pilot study, Gallagher et al. (2008) obtained low signal-to-noise (S/N = 10-20) ratio spectra of 29 nearby early-type host galaxies. Their result, however, is hampered by “an error in the original analysis” (see section 1 of Sullivan et al., 2010). The other study by Johansson et al. (2013) used very low S/N (10) spectra from Sloan Digital Sky Survey, and attempted to obtain population ages from emission corrected absorption lines. Most galaxies in their sample (70%) are emission dominated star-forming or active galactic nuclei (AGN) galaxies, and thus required significant emission corrections, which together with the low S/N ratio spectra produced rather limited results (5 Gyr error in age).
In order to determine more reliable population ages and metallicities for a sufficiently large sample of early-type host galaxies based on high S/N spectra, we have therefore initiated the project that we call YONSEI, YOnsei Nearby Supernovae Evolution Investigation. For this project, we have constructed our own SNe Ia catalogue (Y.-L. Kim et al., in preparation) by employing MLCS2k2 and SALT2 light-curve fitters (Jha et al., 2007; Guy et al., 2007) implemented in the SuperNova ANAlysis (SNANA; Kessler et al., 2009b) package. Since ETGs are more homogeneous in terms of population age and less affected by dust extinction, we believe that this project can provide the best test for the possible luminosity evolution of SNe Ia. Furthermore, ETGs are known to host both faint and bright SNe Ia, while late-type galaxies tend to host fainter SNe Ia, after light-curve corrections (Hicken et al., 2009b). As the first paper of this series, here we report our spectroscopic observations for 27 nearby host galaxies observed at Las Campanas Observatory (LCO). The spectra obtained from these observations are used to investigate the correlations between population age, metallicity, and velocity dispersion of early-type host galaxies.
2 Observations and Data Reduction
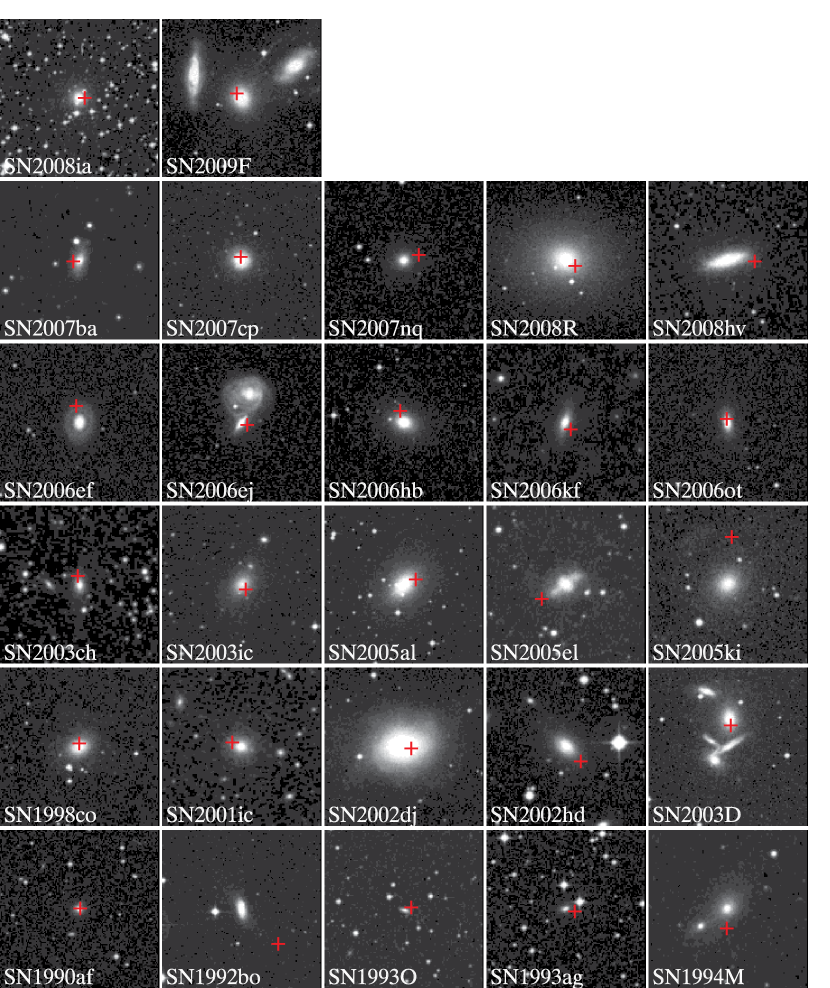
Our sample galaxies have been observed with the du Pont 2.5 m telescope at LCO. All of them are classified as early-type galaxies (E-S0) by NASA Extragalactic Database (NED) or HyperLeda database (Makarov et al., 2014)111http://leda.univ-lyon1.fr/. They are in the redshift range of 0.01 z 0.06 with the magnitudes between 11 and 18 mag. We have further limited our sample to host galaxies for which the SN Ia light curve analysis is possible by employing the SNANA package for our future analysis of the correlation between population age and HR. The whole sample of our target galaxies are listed in Table 1 and their images together with SN Ia position are shown in Figure 1.
The observations were carried out with the Boller & Chivens long-slit spectrograph during the six observing runs from February 2011 to March 2013. Table 2 lists an instrumental setup of our observations. As listed in Table 1, the single exposure time of each host galaxy was 1200, 1800, or 3600 sec, depending on the brightness, and most of target galaxies were observed at least three times. The slit position angle (PA) was aligned with the direction of the major axis of each galaxy, except the cases where a bright object is placed in the slit, for which the angle was further tilted to avoid it. Following the usual manner, calibration frames were obtained including dome flats, twilight sky flats, and He-Ar arc lamp. Standard stars for flux calibration, radial velocity correction, and telluric feature removal were further observed. In addition, we observed 70 stars from the Lick library (Worthey et al., 1994; Worthey & Ottaviani, 1997) to transform the measured indices to Lick/IDS standard system. Spectra for 29 non-host early-type galaxies were also obtained for the comparison with previous studies.
The observed spectra were reduced using the IRAF222IRAF is distributed by the National Optical Astronomy Observatory, which is operated by the Association of Universities for Research in Astronomy (AURA) under cooperative agreement with the National Science Foundation. in the standard manner. Pre-processing, including overscan, bias subtraction, flat-fielding, and illumination correction, was performed using the CCDRED package, and the cosmic rays were removed by the lacosmic routine of van Dokkum (2001). The He-Ar lamp exposures were used for the wavelength calibration and distortion correction. The one dimensional spectra were extracted using routine with an aperture of 3.85″ for the stars and within the half-light width for target galaxies. The half-light width was calculated based on the spectra of each galaxy, which is defined to be the width that includes the half of the total integrated light in Johnson band. These widths determined from our spectra correspond to 1/4 of the effective radii derived from 2MASS photometry (as defined by Cappellari et al., 2011). As shown below in Figure 3, however, the adopted aperture size has only little effect (5%) on the measured Lick indices. The task was also used for the sky subtraction and the noise level estimation. Flux calibration and heliocentric velocity correction were then applied to the extracted 1-d spectra. Telluric absorption lines were further removed for the redder than 7000 Å using IRAF task. With fully processed spectra observed in the same observing run for each galaxy, we finally performed median stacking to enhance S/N ratio. The typical S/N ratio of our target galaxies is 192 per pixel (3 Å at 5000 Å) and even the faintest galaxies in our sample have S/N ratio of more than 72.
3 Line Strengths on the Lick/IDS System
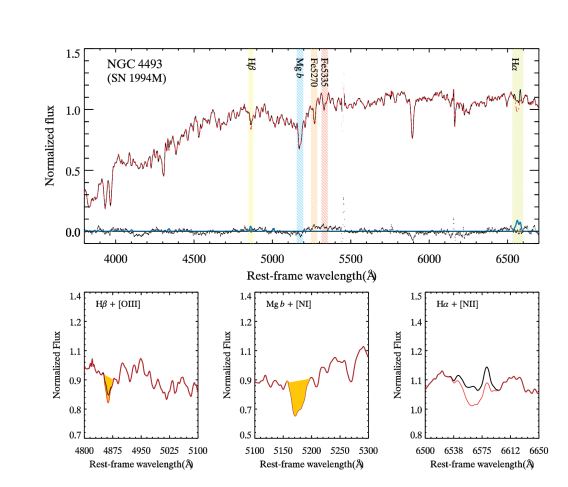
Some ETGs in our sample show weak emission lines, which are likely caused by AGN or residual star formation (e.g. Ho et al., 1997; Yi et al., 2005). This contamination, especially in the H region, must be removed before the Lick indices are measured from the spectra for these galaxies. For this, we have used the Gas AND Absorption Line Fitting (GANDALF; Sarzi et al., 2006) package based on the Penalized Pixel-Fitting method (pPXF; Cappellari & Emsellem, 2004). The pPXF routine was also used to derive radial velocity and velocity dispersion of each galaxy. In the GANDALF package, the MILES stellar library (Vazdekis et al., 2010) was adopted for the template SEDs, and the reddening map of Schlafly & Finkbeiner (2011) was applied for the Galactic extinction correction. To estimate the amplitude of embedded emission in the H absorption line, the emission in the H was detected first and then the Balmer decrement method, adopting H/H 2.86 (Osterbrock, 1989), was employed. The continuum shape correction required in this method (Serven & Worthey, 2010) was applied in the GANDALF package as it performs the continuum fitting to the template SEDs for the whole wavelength coverage of spectra. The emission line correction was applied only when A/N, the ratio of the line amplitude to the noise of the spectrum, was larger than 2 (see Trager et al., 2008). Only three galaxies in our sample, NGC 1819, 2MASX J1331…, and UGC 03787, required significant emission corrections (i.e., negative Lick indices before the correction). For the remaining galaxies in our sample, the variation in the H index by the emission correction was either negligible or less than 30%. As an example, Figure 2 shows the observed spectrum of NGC 4493, which compares absorption line features before and after the emission correction.
In order to measure Lick/IDS indices from the emission-cleaned spectra, we employed an IDL routine lick_ew in the package developed by Graves & Schiavon (2008). In this routine, the observed spectra were first degraded from the instrumental resolution of observed spectra ( 7 Å/FWHM) to the original Lick/IDS resolution. For the galaxy spectra, we have further applied corrections for the line broadening from velocity dispersion. This was performed by calculating the correction factor from the best fitting model spectra in the GANDALF package before and after the line broadening (see Oh et al., 2011). The correction factor for each index was then applied to obtain indices at zero velocity dispersion. Out of 25 indices measured, we adopted H index as an age indicator, and the mean iron index, Fe (Fe5270 + Fe5335)/2, was used as a metallicity indicator. The Mg index was also used to estimate the alpha-elements enhancement, . The index errors were calculated from the equations defined in Cardiel et al. (1998). For five galaxies in our sample in the redshift range of 0.04 z 0.06, Fe5270 and/or Fe5335 indices are contaminated by a strong sky emission line 5577 Å. In these cases, Fe5270 and/or Fe5335 indices were obtained from the best-fit model spectra. Since there are tight correlations between the observed Fe indices and those obtained from the best-fit models, the uncertainties in Fe indices derived from this procedure are not significantly greater than those for other sample galaxies and are estimated to be 0.21 Å for Fe5270 and 0.16 Å for Fe5335 (10% uncertainty in each index).
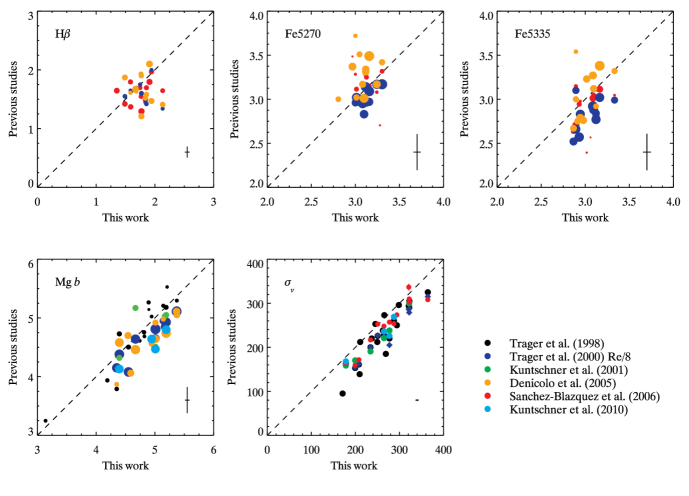
As the last step, the measured indices were transformed to the Lick/IDS standard system. For this, our observed spectra for the Lick/IDS standard stars were used to derive small systematic offsets caused by the continuum shape differences. Figure 4 compares indices measured from our observations with those in the Lick/IDS database, from which we obtained the mean offset for each index and used it for the zero-point correction. Table LABEL:table3 lists the fully-corrected Lick indices (H, Fe5270, Fe5335, and Mg ), together with the measured velocity dispersion (), for our host galaxy sample. After this correction, in Figure 5, we compare our indices for non-host early-type galaxies with those in previous studies (Trager et al., 1998, 2000; Kuntschner et al., 2001, 2010; Denicoló et al., 2005; Sánchez-Blázquez et al., 2006). Our measurements are generally in good agreements with mean offsets of 0.12, -0.043, 0.11, 0.21 Å, and 30.8 km/s for H, Fe5270, Fe5335, Mg , and , respectively. These differences are comparable to those reported by other investigators, and are probably due to the differences in the adopted aperture size, instrument used, and/or the procedures adopted for the emission correction.
4 Correlation between Velocity Dispersion and Population Age
Using H, Fe, and Mg indices measured in the Lick/IDS system, we have determined the luminosity-weighted mean ages, metallicities, and ’s for our early-type host galaxy sample. For this, we have adopted four different sets of evolutionary population synthesis (EPS) models, the Yonsei Evolutionary Population Synthesis (Chung et al., 2013, hereafter YEPS), Thomas et al. (2003, hereafter TMB03), Thomas et al. (2011, hereafter TMJ11), and Schiavon (2007, hereafter S07). The YEPS model was constructed with the most up-to-date Y2 stellar evolutionary tracks and isochrones (Han et al., 2009; Lee et al., 2015) and the line fitting functions from Worthey (1994) and Worthey & Ottaviani (1997). It includes the detailed effects of horizontal branch (HB) morphology and its variation with metallicity, age, and , and is well-calibrated to the color magnitude diagrams, integrated colors, and absorption indices of globular clusters in the Milky Way and nearby galaxies (Chung et al., 2013; Joo & Lee, 2013; Kim et al., 2013). Because of the detailed modeling of HB, YEPS is the only model that can match the observed H indices of metal-poor globular clusters in M31 (Kim et al., 2013). TMB03 model is based on the isochrones of Bono et al. (1997) and Cassisi et al. (1997), and they adopt the fitting functions of Worthey (1994) for Lick indices. Their model provides extensive grids of from 0.0 to 0.5. TMJ11 is the flux-calibrated version of TMB03, and used empirical fitting functions of Johansson et al. (2010). S07 developed his own fitting functions based on the Jones (1998) library, and exhibits greater sensitivity to metallicity and temperature of stellar populations. His model adopted Padova isochrones (Girardi et al., 2000; Salasnich et al., 2000) for scaled-solar and alpha-enhanced model. In practice, we used his model extracted from the package (Graves & Schiavon, 2008). Figure 6 compares observed Fe and H indices of our host galaxy sample with the four different model grids constructed at 0.3.
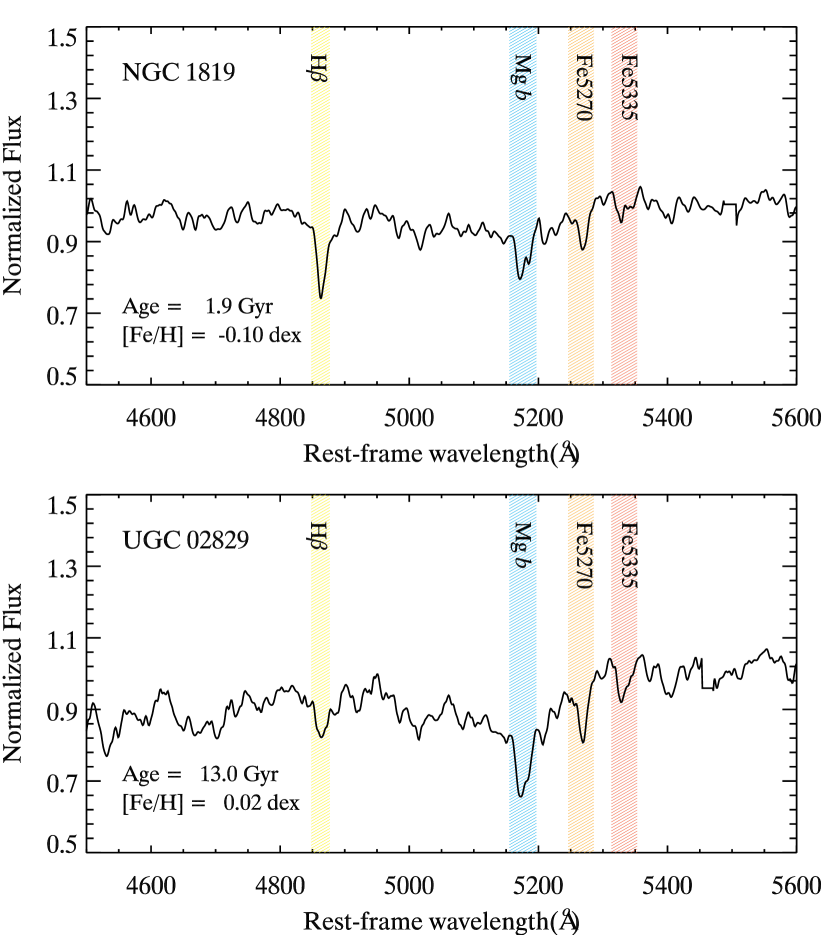
In our determination of population age and metallicity, the initial guesses for age and [Fe/H] (or [M/H]) were obtained from the Fe-H grid assuming 0.3. From these initial guesses, we found a value for in the model grid for Mg vs. Fe (see Thomas et al., 2005). These procedures were iterated until the values of age, [Fe/H], and reached convergence. The one sigma errors for age and metallicity were estimated from the observed errors in H and Fe indices. Figure 7 shows two example spectra for relatively old and young host galaxies, where one can see a large difference in the depth of H line between these galaxies. Table 4 presents the derived population age, [M/H], and [Fe/H] together with their errors, for the host galaxies in our sample, obtained from YEPS, TMB03, TMJ11, and S07 models, respectively.
Figure 8 shows the correlation between velocity dispersion and population age for our sample of early-type host galaxies, where each panel shows, respectively, ages derived from the four different population synthesis models. As is clear from this Figure, all panels show positive correlations, although the population ages derived from the YEPS model are somewhat younger (by 1-3 Gyr) than those derived from other models. This is most likely due to the differences in the adopted isochrones/evolutionary tracks. In order to estimate the slope and the statistical significance of the correlation, we performed the Markov chain Monte Carlo (MCMC) analysis implemented in the LINMIX package (Kelly, 2007). According to this analysis, the velocity dispersion is correlated with population age in the form of age , with an 2.17 (see Table 5). The posterior possibility distributions in the upper panels of Figure 8 show 99.97% probability for the positive slope, corresponding to 3.9. Strong correlations are still maintained (with 99.76% probability) even if the youngest galaxy, 2MASX J1331…, is excluded from the regression fit. On the other hand, Figure 9 shows that the total metallicity, [M/H], has no significant correlation with velocity dispersion (81.25% probability, 1.6). Similarly, the iron abundance, [Fe/H], also shows weak correlation (77.30%, 1.3; see Figure 10). If the most metal poor galaxy, 2MASX J1331…, is excluded from the regression fit, the correlations become even weaker for both [M/H] and [Fe/H] (70.81%, 1.1). Table 5 lists the median value of the slope for the correlation between velocity dispersion and population property (age, [M/H], and [Fe/H]), and Table 6 lists the probability for the non-zero slope derived from the posterior distribution together with the corresponding value.
5 Discussion
We found a tight correlation between velocity dispersion and population age among our sample of early-type host galaxies. The total metallicity or iron abundance, on the other hand, show no significant correlation with velocity dispersion. As summarized in Table 6, these results are rather insensitive to the choice of population synthesis models. When the relation between and dynamic mass of Cappellari et al. (2006) is adopted, our result would suggest that more massive host galaxies (by a factor of 10) are 6.5 Gyr older than less massive galaxies. A similar result (5.8 Gyr difference) is obtained, if, instead, the relation between and stellar mass (Thomas et al., 2005) is employed. Qualitatively, this is consistent with the well-known “downsizing” trend observed among non-host galaxies, in both early (Thomas et al., 2005, 2010; Smith et al., 2009) and late-type galaxies (Heavens et al., 2004; Cid Fernandes et al., 2007).
Our result has an important implication on the well-established correlation between host mass and HR of SN Ia (Kelly et al., 2010; Lampeitl et al., 2010; Sullivan et al., 2010; Pan et al., 2014). According to these results, SNe Ia in more massive host galaxies (by a factor of 10) are brighter, after light curve corrections, than those in less massive galaxies by 0.1 mag. Combining this with our result on the host mass and population age would imply that the SNe Ia in older host galaxies (by 10 Gyr) are 0.16 mag brighter than those in younger hosts. Since we found no correlation between host mass and metallicity, our result therefore suggests that the origin of the host mass and HR correlation is most likely a population age effect. If confirmed by further observations, this would imply that the luminosity evolution deserves more careful consideration in the SN Ia cosmology. In order to explore this more directly, our future papers will include the light-curve analysis of SNe Ia for a larger sample of early-type host galaxies, based on which the correlations between the HR and population properties will be investigated.
In the era of the giant telescopes, sufficient sample of early-type host galaxies at high redshift will be accumulated from a similar survey. Then, a unique dark energy test will be possible by combining the early-type host galaxy sample observed in this study with that to be obtained at high redshifts. Since the maximum possible age of stellar populations in galaxies decreases with increasing redshift or look-back time, host galaxies in the same population age bin, for both the nearby and high redshift samples, should be selected for this test in the construction of the Hubble diagram. For this, relatively young galaxies at low redshifts should be compared with relatively old galaxies at high redshifts. As stellar populations in sample galaxies would have roughly the same age, this test will be entirely free from the possible evolution effect. Furthermore, since only ETGs are employed, it will be less affected by dust extinction. This “evolution-free and dust-free” dark energy test would, therefore, provide an unprecedented opportunity in SN Ia cosmology.
References
- Betoule et al. (2014) Betoule, M., Kessler, R., Guy, J., et al. 2014, A&A, 568, A22
- Bono et al. (1997) Bono, G., Caputo, F., Cassisi, S., Castellani, V., & Marconi, M. 1997, ApJ, 489, 822
- Cappellari et al. (2006) Cappellari, M., Bacon, R., Bureau, M., et al. 2006, MNRAS, 366, 1126
- Cappellari & Emsellem (2004) Cappellari, M., & Emsellem, E. 2004, PASP, 116, 138
- Cappellari et al. (2011) Cappellari, M., Emsellem, E., Krajnović, D., et al. 2011, MNRAS, 413, 813
- Cardiel et al. (1998) Cardiel, N., Gorgas, J., Cenarro, J., & Gonzalez, J. J. 1998, A&AS, 127, 597
- Cassisi et al. (1997) Cassisi, S., Castellani, M., & Castellani, V. 1997, A&A, 317, 108
- Childress et al. (2013) Childress, M., Aldering, G., Antilogus, P., et al. 2013, ApJ, 770, 108
- Childress et al. (2014) Childress, M., Wolf, C., & Zahid, H. J. 2014, MNRAS, 445, 1898
- Chung et al. (2013) Chung, C., Yoon, S.-J., Lee, S.-Y., & Lee, Y.-W. 2013, ApJS, 204, 3
- Cid Fernandes et al. (2007) Cid Fernandes, R., Asari, N. V., Sodré, L., et al. 2007, MNRAS, 375, L16
- Collobert et al. (2006) Collobert, M., Sarzi, M., Davies, R. L., Kuntschner, H., & Colless, M. 2006, MNRAS, 370, 1213
- Conroy & Gunn (2010) Conroy, C., & Gunn, J. E. 2010, ApJ, 712, 833
- D’Andrea et al. (2011) D’Andrea, C. B., Gupta, R. R., Sako, M., et al. 2011, ApJ, 743, 172
- Denicoló et al. (2005) Denicoló, G., Terlevich, R., Terlevich, E., et al. 2005, MNRAS, 356, 1440
- Faber et al. (1992) Faber, S. M., Worthey, G., & Gonzales, J. J. 1992, The Stellar Populations of Galaxies, 149, 255
- Gallagher et al. (2005) Gallagher, J. S., Garnavich, P. M., Berlind, P., et al. 2005, ApJ, 634, 210
- Gallagher et al. (2008) Gallagher, J. S., Garnavich, P. M., Caldwell, N., et al. 2008, ApJ, 685, 752
- Girardi et al. (2000) Girardi, L., Bressan, A., Bertelli, G., & Chiosi, C. 2000, A&AS, 141, 371
- Graves et al. (2009) Graves, G. J., Faber, S. M., & Schiavon, R. P. 2009, ApJ, 698, 1590
- Graves et al. (2007) Graves, G. J., Faber, S. M., Schiavon, R. P., & Yan, R. 2007, ApJ, 671, 243
- Graves & Schiavon (2008) Graves, G. J., & Schiavon, R. P. 2008, ApJS, 177, 446
- Gupta et al. (2011) Gupta, R. R., D’Andrea, C. B., Sako, M., et al. 2011, ApJ, 740, 92
- Guy et al. (2007) Guy, J., Astier, P., Baumont, S., et al. 2007, A&A, 466, 11
- Han et al. (2009) Han, S.-I., Kim, Y.-C., Lee, Y.-W., et al. 2009, Globular Clusters - Guides to Galaxies, 33
- Heavens et al. (2004) Heavens, A., Panter, B., Jimenez, R., & Dunlop, J. 2004, Nature, 428, 625
- Hicken et al. (2009a) Hicken, M., Challis, P., Jha, S., et al. 2009a, ApJ, 700, 331
- Hicken et al. (2009b) Hicken, M., Wood-Vasey, W. M., Blondin, S., et al. 2009b, ApJ, 700, 1097
- Ho et al. (1997) Ho, L. C., Filippenko, A. V., & Sargent, W. L. W. 1997, ApJ, 487, 579
- Jha et al. (2007) Jha, S., Riess, A. G., & Kirshner, R. P. 2007, ApJ, 659, 122
- Johansson et al. (2010) Johansson, J., Thomas, D., & Maraston, C. 2010, MNRAS, 406, 165
- Johansson et al. (2013) Johansson, J., Thomas, D., Pforr, J., et al. 2013, MNRAS, 435, 1680
- Jones (1998) Jones, L. A. 1998, Ph.D. Thesis, Univ. North Carolina
- Joo & Lee (2013) Joo, S.-J., & Lee, Y.-W. 2013, ApJ, 762, 36
- Kelly (2007) Kelly, B. C. 2007, ApJ, 665, 1489
- Kelly et al. (2010) Kelly, P. L., Hicken, M., Burke, D. L., Mandel, K. S., & Kirshner, R. P. 2010, ApJ, 715, 743
- Kessler et al. (2009a) Kessler, R., Becker, A. C., Cinabro, D., et al. 2009a, ApJS, 185, 32
- Kessler et al. (2009b) Kessler, R., Bernstein, J. P., Cinabro, D., et al. 2009b, PASP, 121, 1028
- Kim et al. (2013) Kim, S., Yoon, S.-J., Chung, C., et al. 2013, ApJ, 768, 138
- Kuntschner (2000) Kuntschner, H. 2000, MNRAS, 315, 184
- Kuntschner et al. (2006) Kuntschner, H., Emsellem, E., Bacon, R., et al. 2006, MNRAS, 369, 497
- Kuntschner et al. (2010) Kuntschner, H., Emsellem, E., Bacon, R., et al. 2010, MNRAS, 408, 97
- Kuntschner et al. (2001) Kuntschner, H., Lucey, J. R., Smith, R. J., Hudson, M. J., & Davies, R. L. 2001, MNRAS, 323, 615
- Lampeitl et al. (2010) Lampeitl, H., Smith, M., Nichol, R. C., et al. 2010, ApJ, 722, 566
- Lee et al. (2015) Lee, Y.-W., Joo, S.-J., Han, S.-I., et al. 2015, Highlights of Astronomy, 16, 247
- Makarov et al. (2014) Makarov D., Prugniel P., Terekhova N., Courtois H., & Vauglin I. 2014, A&A, 570, A13
- Oh et al. (2011) Oh, K., Sarzi, M., Schawinski, K., & Yi, S. K. 2011, ApJS, 195, 13
- Osterbrock (1989) Osterbrock, D. E. 1989, Research supported by the University of California, John Simon Guggenheim Memorial Foundation, University of Minnesota, et al. Mill Valley, CA ,University Science Books, 1989, 422 p.,
- Pan et al. (2014) Pan, Y.-C., Sullivan, M., Maguire, K., et al. 2014, MNRAS, 438, 1391
- Perlmutter et al. (1999) Perlmutter, S., Aldering, G., Goldhaber, G., et al. 1999, ApJ, 517, 565
- Riess et al. (1998) Riess, A. G., Filippenko, A. V., Challis, P., et al. 1998, AJ, 116, 1009
- Salasnich et al. (2000) Salasnich, B., Girardi, L., Weiss, A., & Chiosi, C. 2000, A&A, 361, 1023
- Sánchez-Blázquez et al. (2006) Sánchez-Blázquez, P., Gorgas, J., Cardiel, N., & González, J. J. 2006, A&A, 457, 787
- Sánchez-Blázquez et al. (2009) Sánchez-Blázquez, P., Jablonka, P., Noll, S., et al. 2009, A&A, 499, 47
- Sarzi et al. (2006) Sarzi, M., Falcón-Barroso, J., Davies, R. L., et al. 2006, MNRAS, 366, 1151
- Schiavon (2007) Schiavon, R. P. 2007, ApJS, 171, 146
- Schlafly & Finkbeiner (2011) Schlafly, E. F., & Finkbeiner, D. P. 2011, ApJ, 737, 103
- Schmidt et al. (1998) Schmidt, B. P., Suntzeff, N. B., Phillips, M. M., et al. 1998, ApJ, 507, 46
- Scott et al. (2009) Scott, N., Cappellari, M., Davies, R. L., et al. 2009, MNRAS, 398, 1835
- Serven & Worthey (2010) Serven, J., & Worthey, G. 2010, AJ, 140, 152
- Smith et al. (2009) Smith, R. J., Lucey, J. R., & Hudson, M. J. 2009, MNRAS, 400, 1690
- Stritzinger et al. (2011) Stritzinger, M. D., Phillips, M. M., Boldt, L. N., et al. 2011, AJ, 142, 156
- Sullivan et al. (2010) Sullivan, M., Conley, A., Howell, D. A., et al. 2010, MNRAS, 406, 782
- Sullivan et al. (2011) Sullivan, M., Guy, J., Conley, A., et al. 2011, ApJ, 737, 102
- Sullivan et al. (2006) Sullivan, M., Le Borgne, D., Pritchet, C. J., et al. 2006, ApJ, 648, 868
- Suzuki et al. (2012) Suzuki, N., Rubin, D., Lidman, C., et al. 2012, ApJ, 746, 85
- Thomas et al. (2003) Thomas, D., Maraston, C., & Bender, R. 2003, MNRAS, 339, 897
- Thomas et al. (2005) Thomas, D., Maraston, C., Bender, R., & Mendes de Oliveira, C. 2005, ApJ, 621, 673
- Thomas et al. (2011) Thomas, D., Maraston, C., & Johansson, J. 2011, MNRAS, 412, 2183
- Thomas et al. (2010) Thomas, D., Maraston, C., Schawinski, K., Sarzi, M., & Silk, J. 2010, MNRAS, 404, 1775
- Trager et al. (2008) Trager, S. C., Faber, S. M., & Dressler, A. 2008, MNRAS, 386, 715
- Trager et al. (2000) Trager, S. C., Faber, S. M., Worthey, G., & González, J. J. 2000, AJ, 119, 1645
- Trager et al. (1998) Trager, S. C., Worthey, G., Faber, S. M., Burstein, D., & González, J. J. 1998, ApJS, 116, 1
- van Dokkum (2001) van Dokkum, P. G. 2001, PASP, 113, 1420
- Vazdekis et al. (2010) Vazdekis, A., Sánchez-Blázquez, P., Falcón-Barroso, J., et al. 2010, MNRAS, 404, 1639
- Walcher et al. (2011) Walcher, J., Groves, B., Budavári, T., & Dale, D. 2011, Ap&SS, 331, 1
- Worthey (1994) Worthey, G. 1994, ApJS, 95, 107
- Worthey (1998) Worthey, G. 1998, PASP, 110, 888
- Worthey et al. (1994) Worthey, G., Faber, S. M., Gonzalez, J. J., & Burstein, D. 1994, ApJS, 94, 687
- Worthey & Ottaviani (1997) Worthey, G., & Ottaviani, D. L. 1997, ApJS, 111, 377
- Yi et al. (2005) Yi, S. K., Yoon, S.-J., Kaviraj, S., et al. 2005, ApJ, 619, L111
- Zhu et al. (2010) Zhu, G., Blanton, M. R., & Moustakas, J. 2010, ApJ, 722, 491


| SN | Galaxy | R.A. | Decl. | ††footnotemark: | Morphology | PA | Exposures | Ref.bb(1) JRK 07: Jha et al. (2007) (2) CfA3: Hicken et al. (2009a) (3) CSPDR2: Stritzinger et al. (2011) | |
|---|---|---|---|---|---|---|---|---|---|
| (J2000) | (J2000) | (mag) | (∘) | (N s) | |||||
| SN 1990af | 2MASX J21345926-6244143 | 21:34:59.31 | -62:44:14.5 | 16.07 | SB0 | 0.0506 | 50 | JRK07 | |
| SN 1992bo | ESO 352- G 057 | 01:22:02.41 | -34:11:48.4 | 14.76 | SB(s)0^0^pec | 0.0190 | 12 | JRK07 | |
| SN 1993O | 2MASX J13310895-3312576 | 13:31:09.15 | -33:12:56.9 | 17.98 | E5/S01 | 0.0505 | 75 | + | JRK07 |
| SN 1993ag | 2MASX J10033546-3527410 | 10:03:35.46 | -35:27:41.0 | 16.86 | E3/S01 | 0.0491 | 80 | JRK07 | |
| SN 1994M | NGC 4493 | 12:31:08.37 | +00:36:49.3 | 14.78 | SA?0-pec | 0.0232 | 0 | JRK07 | |
| SN 1998co | NGC 7131 | 21:47:36.11 | -13:10:57.4 | 14.82 | (R’)SA(rs)0^0^ | 0.0181 | 120 | JRK07 | |
| SN 2001ic | NGC 7503 | 23:10:42.28 | +07:34:03.7 | 14.45 | E2:;BrClG | 0.0442 | 100 | CfA3 | |
| SN 2002dj | NGC 5018 | 13:13:01.03 | -19:31:05.5 | 11.69 | E3: | 0.0094 | 100 | + | CfA3 |
| SN 2002hd | MCG -01-23-008 | 08:54:04.68 | -07:10:59.5 | 15.03 | SA0^0^: | 0.0308 | 50 | CfA3 | |
| SN 2003D | ARP 321 NED01 | 09:38:53.55 | -04:50:57.4 | 13.77 | E1 | 0.0221 | 90 | CfA3 | |
| SN 2003ch | UGC 03787 | 07:17:57.56 | +09:41:21.6 | 15.56 | E-S0 | 0.0286 | 0 | + | CfA3 |
| SN 2003ic | MCG -02-02-086 | 00:41:50.47 | -09:18:11.3 | 14.60 | cD;BrClG | 0.0557 | 130 | CfA3 | |
| SN 2005al | NGC 5304 | 13:50:01.48 | -30:34:42.5 | 13.62 | E+ pec: | 0.0124 | 140 | CSPDR2 | |
| SN 2005el | NGC 1819 | 05:11:46.14 | +05:12:02.2 | 13.69 | SB0 | 0.0149 | 130 | CfA3 | |
| SN 2005ki | NGC 3332 | 10:40:28.37 | +09:10:57.2 | 13.62 | (R)SA0- | 0.0192 | 0 | CSPDR2 | |
| SN 2006ef | NGC 0809 | 02:04:18.97 | -08:44:07.1 | 14.55 | (R)S0+: | 0.0179 | 175 | CfA3 | |
| SN 2006ej | NGC 0191A | 00:39:00.24 | -09:00:52.5 | 14.71 | S0 pec sp | 0.0205 | 0 | CSPDR2 | |
| SN 2006hb | ESO 552- G 052 | 05:02:00.68 | -21:08:13.0 | 13.94 | E? | 0.0153 | 67 | CfA3 | |
| SN 2006kf | UGC 02829 | 03:41:50.86 | +08:09:35.4 | 14.94 | S0 pec sp | 0.0213 | 160 | CSPDR2 | |
| SN 2006ot | ESO 544- G 031 | 02:15:04.60 | -20:46:03.7 | 15.37 | Sa;S0 | 0.0531 | 4 | CSPDR2 | |
| SN 2007ba | UGC 09798 | 15:16:41.82 | +07:23:48.9 | 15.26 | S0/a | 0.0385 | 80 | CSPDR2 | |
| SN 2007cp | IC 0807 | 12:42:12.49 | -17:24:12.8 | 14.61 | E-S0ccMorphological classification is adapted from HyperLeda. | 0.0366 | 95 | CfA3 | |
| SN 2007nq | UGC 00595 | 00:57:34.92 | -01:23:27.9 | 14.86 | E | 0.0450 | 140 | CSPDR2 | |
| SN 2008R | NGC 1200 | 03:03:54.48 | -11:59:30.5 | 13.61 | SA(s)0- | 0.0135 | 130 | CSPDR2 | |
| SN 2008hv | NGC 2765 | 09:07:36.64 | +03:23:34.5 | 13.17 | S0 | 0.0125 | 107 | + | CSPDR2 |
| SN 2008ia | ESO 125- G 006 | 08:50:35.85 | -61:16:40.5 | 11.9I | S0 | 0.0219 | 35 | CSPDR2 | |
| SN 2009F | NGC 1725 | 04:59:22.89 | -11:07:56.3 | 13.82 | S0 | 0.0130 | 15 | CSPDR2 |
| Boller & Chivens Spectrograph | |
|---|---|
| Grating & Blaze | 300 l/mm, 5500 Å |
| Grating angle | 5 |
| Spectral range | 38008000 Å |
| Resolution | 7 Å/FWHM |
| Dispersion | 3 Å/pixel |
| Slit width | 1.5″ |
| Slit length | 271″ |
Note. — Dates of observations : Feb. 08-10, 2011; Jun. 27-29, 2011; Sep. 20-23, 2011; Apr.14-19, 2012; Dec. 06-12, 2012; Mar. 11-14, 2013
| Galaxy | Error | H | Error | Mg | Error | Fe5270 | Error | Fe5335 | Error | |
|---|---|---|---|---|---|---|---|---|---|---|
| (km/s) | (Å) | (Å) | (Å) | (Å) | ||||||
| 2MASX J21345926-6244143 | 191.7 | 3.3 | 1.779 | 0.059 | 4.184 | 0.061 | 3.190 | 0.148 | 3.074 | 0.113 |
| ESO 352- G 057 | 180.3 | 2.7 | 1.672 | 0.037 | 4.168 | 0.037 | 2.871 | 0.040 | 2.998 | 0.044 |
| 2MASX J13310895-3312576 | 116.3 | 6.4 | 4.711 | 0.057 | 1.856 | 0.060 | 1.285 | 0.074 | 1.217 | 0.092 |
| 2MASX J10033546-3527410 | 201.7 | 2.8 | 1.680 | 0.034 | 3.907 | 0.034 | 2.662 | 0.121 | 2.603 | 0.092 |
| NGC 4493 | 220.6 | 2.9 | 1.761 | 0.043 | 5.024 | 0.044 | 2.833 | 0.047 | 2.915 | 0.052 |
| NGC 7131 | 264.2 | 5.6 | 1.360 | 0.105 | 4.435 | 0.111 | 2.914 | 0.123 | 2.938 | 0.144 |
| NGC 7503 | 272.6 | 4.6 | 1.451 | 0.071 | 4.733 | 0.067 | 2.523 | 0.074 | 3.072 | 0.160 |
| NGC 5018 | 215.4 | 2.4 | 2.661 | 0.008 | 3.230 | 0.008 | 2.756 | 0.009 | 2.534 | 0.010 |
| MCG -01-23-008 | 273.7 | 2.1 | 1.614 | 0.022 | 4.506 | 0.021 | 2.871 | 0.023 | 2.728 | 0.026 |
| ARP 321 NED01 | 239.0 | 3.1 | 1.704 | 0.026 | 4.481 | 0.026 | 2.893 | 0.027 | 3.147 | 0.031 |
| UGC 03787 | 199.6 | 3.3 | 1.860 | 0.052 | 3.498 | 0.050 | 2.598 | 0.053 | 2.409 | 0.061 |
| MCG -02-02-086 | 350.2 | 5.7 | 1.401 | 0.060 | 5.137 | 0.061 | 2.972 | 0.148 | 2.668 | 0.074 |
| NGC 5304 | 222.5 | 4.4 | 1.890 | 0.033 | 4.483 | 0.032 | 2.737 | 0.035 | 2.662 | 0.040 |
| NGC 1819 | 195.1 | 7.1 | 2.943 | 0.080 | 2.896 | 0.075 | 2.182 | 0.084 | 2.010 | 0.099 |
| NGC 3332 | 244.1 | 2.5 | 1.821 | 0.026 | 4.683 | 0.025 | 2.664 | 0.027 | 2.641 | 0.031 |
| NGC 0809 | 180.6 | 3.0 | 2.056 | 0.035 | 4.207 | 0.034 | 3.066 | 0.037 | 3.116 | 0.042 |
| NGC 0191A | 233.1 | 4.9 | 1.858 | 0.136 | 4.417 | 0.128 | 2.311 | 0.141 | 2.644 | 0.164 |
| ESO 552- G 052 | 170.4 | 2.2 | 1.891 | 0.026 | 4.016 | 0.025 | 2.794 | 0.028 | 2.498 | 0.032 |
| UGC 02829 | 284.1 | 4.4 | 1.488 | 0.028 | 4.604 | 0.028 | 2.926 | 0.030 | 3.022 | 0.033 |
| ESO 544- G 031 | 286.7 | 3.9 | 1.669 | 0.087 | 4.622 | 0.088 | 3.040 | 0.096 | 2.809 | 0.105 |
| UGC 09798 | 205.9 | 4.5 | 1.978 | 0.084 | 4.966 | 0.082 | 3.304 | 0.088 | 3.226 | 0.100 |
| IC 0807 | 189.1 | 4.8 | 1.952 | 0.076 | 3.995 | 0.074 | 2.650 | 0.082 | 2.476 | 0.093 |
| UGC 00595 | 244.4 | 4.3 | 1.635 | 0.072 | 4.930 | 0.070 | 2.772 | 0.077 | 2.850 | 0.160 |
| NGC 1200 | 249.8 | 3.7 | 1.673 | 0.031 | 5.064 | 0.030 | 3.160 | 0.032 | 3.104 | 0.036 |
| NGC 2765 | 190.7 | 2.5 | 1.950 | 0.024 | 3.973 | 0.023 | 2.918 | 0.025 | 2.720 | 0.029 |
| ESO 125- G 006 | 213.0 | 2.4 | 1.751 | 0.013 | 4.003 | 0.013 | 2.861 | 0.014 | 2.734 | 0.016 |
| NGC 1725 | 273.8 | 4.6 | 1.835 | 0.026 | 5.277 | 0.026 | 3.041 | 0.028 | 3.221 | 0.031 |
| Galaxy | Age | Error | [M/H] | Error | [Fe/H] | Error | |||
|---|---|---|---|---|---|---|---|---|---|
| (Gyr) | + | - | (dex) | + | - | (dex) | + | - | |
| YEPS | |||||||||
| 2MASX J21345926-6244143 | 4.79 | 1.09 | 0.68 | 0.39 | 0.15 | 0.15 | 0.34 | 0.15 | 0.15 |
| ESO 352- G 057 | 6.83 | 0.87 | 0.76 | 0.18 | 0.06 | 0.05 | 0.13 | 0.05 | 0.05 |
| 2MASX J13310895-3312576 | 1.19 | 0.12 | 0.18 | -0.06 | 0.14 | 0.10 | -0.27 | 0.13 | 0.10 |
| 2MASX J10033546-3527410 | 8.35 | 1.10 | 1.12 | -0.03 | 0.10 | 0.11 | -0.10 | 0.10 | 0.11 |
| NGC 4493 | 4.73 | 0.55 | 0.41 | 0.50 | 0.07 | 0.06 | 0.28 | 0.07 | 0.06 |
| NGC 7131 | 12.11 | 2.79 | 3.05 | 0.07 | 0.17 | 0.14 | -0.01 | 0.17 | 0.14 |
| NGC 7503 | 10.10 | 2.25 | 2.08 | 0.16 | 0.14 | 0.15 | 0.02 | 0.14 | 0.15 |
| NGC 5018 | 2.05 | 0.02 | 0.02 | 0.45 | 0.02 | 0.02 | 0.39 | 0.01 | 0.01 |
| MCG -01-23-008 | 7.68 | 0.49 | 0.51 | 0.19 | 0.03 | 0.03 | 0.07 | 0.03 | 0.03 |
| ARP 321 NED01 | 5.50 | 0.43 | 0.42 | 0.36 | 0.04 | 0.04 | 0.26 | 0.04 | 0.04 |
| UGC 03787 | 6.90 | 0.97 | 0.94 | -0.11 | 0.08 | 0.07 | -0.15 | 0.07 | 0.07 |
| MCG -02-02-086 | 10.05 | 2.00 | 1.90 | 0.28 | 0.13 | 0.14 | 0.09 | 0.13 | 0.14 |
| NGC 5304 | 4.74 | 0.40 | 0.34 | 0.29 | 0.05 | 0.05 | 0.11 | 0.05 | 0.05 |
| NGC 1819 | 2.03 | 0.20 | 0.15 | 0.15 | 0.10 | 0.11 | 0.00 | 0.10 | 0.11 |
| NGC 3332 | 5.28 | 0.40 | 0.37 | 0.29 | 0.04 | 0.04 | 0.07 | 0.04 | 0.03 |
| NGC 0809 | 3.28 | 0.22 | 0.23 | 0.59 | 0.06 | 0.06 | 0.50 | 0.06 | 0.06 |
| NGC 0191A | 5.80 | 2.31 | 1.63 | 0.13 | 0.19 | 0.18 | -0.08 | 0.19 | 0.17 |
| ESO 552- G 052 | 5.32 | 0.41 | 0.39 | 0.13 | 0.04 | 0.04 | 0.02 | 0.04 | 0.04 |
| UGC 02829 | 8.92 | 0.72 | 0.71 | 0.23 | 0.04 | 0.04 | 0.13 | 0.04 | 0.04 |
| ESO 544- G 031 | 6.12 | 1.86 | 1.31 | 0.32 | 0.13 | 0.12 | 0.19 | 0.13 | 0.12 |
| UGC 09798 | 3.08 | 0.55 | 0.37 | 0.83 | 0.13 | 0.11 | 0.67 | 0.12 | 0.11 |
| IC 0807 | 5.02 | 1.17 | 0.88 | 0.11 | 0.11 | 0.10 | -0.02 | 0.11 | 0.10 |
| UGC 00595 | 6.53 | 1.80 | 1.49 | 0.34 | 0.14 | 0.14 | 0.15 | 0.14 | 0.13 |
| NGC 1200 | 4.86 | 0.32 | 0.26 | 0.59 | 0.05 | 0.04 | 0.42 | 0.05 | 0.04 |
| NGC 2765 | 4.38 | 0.25 | 0.24 | 0.25 | 0.04 | 0.04 | 0.18 | 0.04 | 0.04 |
| ESO 125- G 006 | 6.53 | 0.26 | 0.26 | 0.12 | 0.02 | 0.02 | 0.06 | 0.02 | 0.02 |
| NGC 1725 | 3.79 | 0.14 | 0.15 | 0.78 | 0.03 | 0.03 | 0.55 | 0.03 | 0.03 |
| TMB03 | |||||||||
| 2MASX J21345926-6244143 | 5.03 | 2.21 | 1.48 | 0.44 | 0.13 | 0.11 | 0.33 | 0.13 | 0.12 |
| ESO 352- G 057 | 8.96 | 1.18 | 1.18 | 0.23 | 0.05 | 0.05 | 0.10 | 0.05 | 0.06 |
| 2MASX J13310895-3312576 | 0.48 | 0.19 | 0.20 | -0.11 | 0.12 | 0.19 | -0.39 | 0.13 | 0.20 |
| 2MASX J10033546-3527410 | 9.01 | 1.58 | 1.90 | 0.38 | 0.08 | 0.11 | 0.12 | 0.09 | 0.12 |
| NGC 4493 | 5.88 | 1.46 | 1.11 | 0.44 | 0.05 | 0.05 | 0.13 | 0.06 | 0.05 |
| NGC 7131 | 16.80 | 3.10 | 4.17 | 0.12 | 0.16 | 0.12 | -0.05 | 0.17 | 0.13 |
| NGC 7503 | 14.39 | 2.96 | 3.07 | 0.22 | 0.14 | 0.14 | -0.05 | 0.15 | 0.15 |
| NGC 5018 | 1.60 | 0.02 | 0.03 | 0.34 | 0.01 | 0.01 | 0.22 | 0.02 | 0.01 |
| MCG -01-23-008 | 10.59 | 0.59 | 0.60 | 0.22 | 0.03 | 0.03 | -0.01 | 0.04 | 0.03 |
| ARP 321 NED01 | 7.16 | 0.87 | 0.89 | 0.37 | 0.03 | 0.03 | 0.19 | 0.03 | 0.04 |
| UGC 03787 | 7.46 | 1.46 | 1.64 | 0.03 | 0.07 | 0.07 | -0.15 | 0.07 | 0.07 |
| MCG -02-02-086 | 15.71 | 2.56 | 2.83 | 0.20 | 0.14 | 0.13 | -0.10 | 0.14 | 0.13 |
| NGC 5304 | 5.25 | 0.58 | 0.61 | 0.32 | 0.04 | 0.05 | 0.04 | 0.05 | 0.05 |
| NGC 1819 | 1.70 | 0.13 | 0.19 | 0.10 | 0.10 | 0.07 | -0.11 | 0.11 | 0.09 |
| NGC 3332 | 6.41 | 0.82 | 0.64 | 0.30 | 0.04 | 0.04 | -0.01 | 0.04 | 0.04 |
| NGC 0809 | 2.68 | 0.24 | 0.20 | 0.56 | 0.06 | 0.06 | 0.40 | 0.06 | 0.06 |
| NGC 0191A | 6.90 | 4.04 | 2.73 | 0.16 | 0.19 | 0.20 | -0.16 | 0.21 | 0.21 |
| ESO 552- G 052 | 5.66 | 0.54 | 0.45 | 0.20 | 0.04 | 0.04 | -0.02 | 0.04 | 0.04 |
| UGC 02829 | 12.57 | 1.10 | 0.96 | 0.25 | 0.04 | 0.04 | 0.06 | 0.04 | 0.05 |
| ESO 544- G 031 | 8.51 | 2.60 | 2.89 | 0.34 | 0.10 | 0.13 | 0.12 | 0.11 | 0.13 |
| UGC 09798 | 2.60 | 0.45 | 0.28 | 0.81 | 0.16 | 0.15 | 0.56 | 0.17 | 0.15 |
| IC 0807 | 5.15 | 1.78 | 1.14 | 0.18 | 0.11 | 0.10 | -0.06 | 0.12 | 0.11 |
| UGC 00595 | 9.69 | 2.47 | 2.96 | 0.33 | 0.11 | 0.15 | 0.04 | 0.12 | 0.16 |
| NGC 1200 | 6.05 | 1.08 | 0.95 | 0.52 | 0.04 | 0.04 | 0.26 | 0.04 | 0.04 |
| NGC 2765 | 4.46 | 0.35 | 0.36 | 0.30 | 0.03 | 0.03 | 0.13 | 0.04 | 0.04 |
| ESO 125- G 006 | 8.11 | 0.37 | 0.41 | 0.17 | 0.02 | 0.02 | 0.02 | 0.02 | 0.02 |
| NGC 1725 | 3.38 | 0.30 | 0.29 | 0.66 | 0.04 | 0.04 | 0.36 | 0.04 | 0.04 |
| TMJ11 | |||||||||
| 2MASX J21345926-6244143 | 7.06 | 2.46 | 2.32 | 0.41 | 0.12 | 0.12 | 0.25 | 0.13 | 0.13 |
| ESO 352- G 057 | 10.94 | 1.06 | 0.93 | 0.15 | 0.05 | 0.05 | -0.01 | 0.05 | 0.05 |
| 2MASX J13310895-3312576 | 0.75 | 0.07 | 0.02 | 0.03 | 0.09 | 0.22 | -0.31 | 0.10 | 0.22 |
| 2MASX J10033546-3527410 | 11.47 | 1.39 | 1.77 | 0.31 | 0.10 | 0.11 | 0.02 | 0.10 | 0.11 |
| NGC 4493 | 8.60 | 1.45 | 1.54 | 0.38 | 0.05 | 0.06 | 0.02 | 0.06 | 0.06 |
| NGC 7131 | 19.75 | 3.65 | 4.01 | 0.07 | 0.15 | 0.18 | -0.16 | 0.17 | 0.19 |
| NGC 7503 | 17.66 | 2.69 | 2.97 | 0.07 | 0.13 | 0.15 | -0.21 | 0.14 | 0.16 |
| NGC 5018 | 1.74 | 0.02 | 0.01 | 0.43 | 0.01 | 0.02 | 0.21 | 0.02 | 0.02 |
| MCG -01-23-008 | 12.87 | 0.76 | 0.71 | 0.12 | 0.03 | 0.03 | -0.13 | 0.03 | 0.03 |
| ARP 321 NED01 | 9.79 | 0.68 | 0.70 | 0.29 | 0.04 | 0.04 | 0.07 | 0.04 | 0.04 |
| UGC 03787 | 8.67 | 1.52 | 1.40 | 0.02 | 0.06 | 0.08 | -0.20 | 0.07 | 0.09 |
| MCG -02-02-086 | 18.98 | 2.39 | 2.52 | 0.08 | 0.12 | 0.14 | -0.24 | 0.13 | 0.14 |
| NGC 5304 | 6.85 | 0.92 | 0.89 | 0.28 | 0.05 | 0.05 | -0.05 | 0.05 | 0.05 |
| NGC 1819 | 1.70 | 0.18 | 0.22 | 0.16 | 0.11 | 0.11 | -0.13 | 0.11 | 0.11 |
| NGC 3332 | 8.57 | 0.72 | 0.78 | 0.25 | 0.04 | 0.04 | -0.11 | 0.04 | 0.04 |
| NGC 0809 | 3.22 | 0.41 | 0.31 | 0.52 | 0.05 | 0.04 | 0.29 | 0.05 | 0.05 |
| NGC 0191A | 8.61 | 3.75 | 3.30 | 0.12 | 0.19 | 0.21 | -0.23 | 0.20 | 0.22 |
| ESO 552- G 052 | 7.25 | 0.79 | 0.72 | 0.16 | 0.03 | 0.03 | -0.10 | 0.04 | 0.04 |
| UGC 02829 | 15.73 | 1.03 | 1.05 | 0.13 | 0.04 | 0.04 | -0.07 | 0.04 | 0.04 |
| ESO 544- G 031 | 10.84 | 2.77 | 2.62 | 0.25 | 0.12 | 0.12 | 0.00 | 0.13 | 0.13 |
| UGC 09798 | 2.93 | 0.81 | 0.32 | 0.73 | 0.12 | 0.12 | 0.40 | 0.12 | 0.12 |
| IC 0807 | 6.22 | 2.16 | 1.29 | 0.17 | 0.11 | 0.10 | -0.12 | 0.11 | 0.11 |
| UGC 00595 | 12.16 | 2.76 | 2.22 | 0.19 | 0.13 | 0.13 | -0.13 | 0.14 | 0.14 |
| NGC 1200 | 9.01 | 0.99 | 1.09 | 0.43 | 0.04 | 0.04 | 0.15 | 0.04 | 0.04 |
| NGC 2765 | 5.52 | 0.39 | 0.39 | 0.28 | 0.03 | 0.03 | 0.06 | 0.04 | 0.04 |
| ESO 125- G 006 | 9.85 | 0.36 | 0.39 | 0.13 | 0.02 | 0.02 | -0.06 | 0.02 | 0.02 |
| NGC 1725 | 4.51 | 0.90 | 0.67 | 0.60 | 0.04 | 0.04 | 0.24 | 0.04 | 0.04 |
| S07 | |||||||||
| 2MASX J21345926-6244143 | 8.38 | 1.49 | 1.34 | 0.16 | 0.09 | 0.09 | 0.12 | 0.09 | 0.08 |
| ESO 352- G 057 | 10.92 | 0.85 | 0.91 | 0.07 | 0.04 | 0.05 | -0.01 | 0.04 | 0.05 |
| 2MASX J13310895-3312576 | 1.12 | 0.08 | 0.02 | -0.39 | 0.09 | 0.20 | -0.62 | 0.08 | 0.20 |
| 2MASX J10033546-3527410 | 11.53 | 1.12 | 1.00 | -0.06 | 0.09 | 0.09 | -0.19 | 0.09 | 0.09 |
| NGC 4493 | 8.91 | 0.99 | 0.80 | 0.28 | 0.04 | 0.05 | 0.05 | 0.04 | 0.04 |
| NGC 7131 | 19.20 | 5.22 | 4.29 | -0.02 | 0.14 | 0.14 | -0.14 | 0.14 | 0.13 |
| NGC 7503 | 16.25 | 3.60 | 2.67 | 0.06 | 0.12 | 0.12 | -0.14 | 0.12 | 0.12 |
| NGC 5018 | 2.23 | 0.02 | 0.03 | 0.23 | 0.01 | 0.01 | 0.17 | 0.01 | 0.01 |
| MCG -01-23-008 | 12.13 | 0.55 | 0.49 | 0.09 | 0.03 | 0.03 | -0.08 | 0.03 | 0.03 |
| ARP 321 NED01 | 9.82 | 0.58 | 0.60 | 0.17 | 0.03 | 0.03 | 0.06 | 0.02 | 0.02 |
| UGC 03787 | 8.59 | 1.02 | 0.90 | -0.11 | 0.07 | 0.07 | -0.21 | 0.06 | 0.06 |
| MCG -02-02-086 | 17.27 | 3.12 | 2.56 | 0.15 | 0.11 | 0.11 | -0.12 | 0.11 | 0.11 |
| NGC 5304 | 7.63 | 0.53 | 0.53 | 0.18 | 0.04 | 0.04 | -0.02 | 0.03 | 0.04 |
| NGC 1819 | 2.07 | 0.16 | 0.31 | 0.01 | 0.13 | 0.10 | -0.15 | 0.13 | 0.10 |
| NGC 3332 | 8.63 | 0.48 | 0.43 | 0.19 | 0.03 | 0.04 | -0.06 | 0.03 | 0.03 |
| NGC 0809 | 4.64 | 0.65 | 0.67 | 0.28 | 0.04 | 0.03 | 0.20 | 0.04 | 0.03 |
| NGC 0191A | 8.44 | 2.94 | 2.07 | 0.10 | 0.17 | 0.18 | -0.17 | 0.17 | 0.17 |
| ESO 552- G 052 | 7.77 | 0.43 | 0.40 | 0.07 | 0.04 | 0.04 | -0.08 | 0.03 | 0.03 |
| UGC 02829 | 14.66 | 0.93 | 0.86 | 0.10 | 0.04 | 0.04 | -0.04 | 0.03 | 0.03 |
| ESO 544- G 031 | 10.73 | 2.08 | 2.00 | 0.16 | 0.09 | 0.11 | 0.01 | 0.08 | 0.10 |
| UGC 09798 | 5.28 | 1.13 | 1.55 | 0.44 | 0.09 | 0.08 | 0.29 | 0.08 | 0.08 |
| IC 0807 | 7.08 | 1.24 | 1.19 | 0.06 | 0.09 | 0.10 | -0.11 | 0.09 | 0.09 |
| UGC 00595 | 11.48 | 2.11 | 1.82 | 0.20 | 0.10 | 0.13 | -0.04 | 0.10 | 0.13 |
| NGC 1200 | 9.72 | 0.68 | 0.70 | 0.30 | 0.03 | 0.03 | 0.13 | 0.03 | 0.03 |
| NGC 2765 | 6.70 | 0.36 | 0.38 | 0.12 | 0.03 | 0.03 | 0.03 | 0.02 | 0.02 |
| ESO 125- G 006 | 9.76 | 0.27 | 0.27 | 0.04 | 0.02 | 0.02 | -0.06 | 0.02 | 0.02 |
| NGC 1725 | 7.01 | 0.50 | 0.36 | 0.41 | 0.03 | 0.03 | 0.20 | 0.02 | 0.03 |
| Age (Gyr) | (Age) | [M/H] | [Fe/H] | |
|---|---|---|---|---|
| YEPS | 14.60 4.42 | 1.56 0.41 | 0.70 0.53 | 0.58 0.50 |
| TMB03 | 26.75 6.91 | 2.45 0.58 | 0.48 0.42 | 0.24 0.42 |
| TMJ11 | 34.83 8.34 | 2.54 0.56 | 0.00 0.43 | -0.13 0.41 |
| S07 | 29.06 6.92 | 2.11 0.46 | 0.71 0.35 | 0.45 0.37 |
| Age | (Age) | [M/H] | [Fe/H] | |
|---|---|---|---|---|
| YEPS | 99.92% | 99.97% | 90.35% | 87.16% |
| (3.3) | (3.6) | (1.7) | (1.5) | |
| TMB03 | 99.99% | 99.98% | 86.84% | 71.11% |
| (4.0) | (3.7) | (1.5) | (1.1) | |
| TMJ11 | 99.99% | 99.99% | 50.04% | 62.47% |
| (4.1) | (3.8) | (0.7) | (0.9) | |
| S07 | 99.99% | 99.99% | 97.77% | 88.44% |
| (4.1) | (3.8) | (2.3)aa1.3 without a deviant point (2MASX 1331…). | (1.6) |